Attached files
| file | filename |
|---|---|
| 8-K - 8-K - BENCHMARK ELECTRONICS INC | Form_8K.htm |
| EX-99.1 - EXHIBIT 99.1 - BENCHMARK ELECTRONICS INC | Ex_99.1.htm |

Fourth Quarter Fiscal 2013 February 4, 2014 Financial Results

design develop deliver advanced technology 2 Forward - Looking Statements This document contains forward - looking statements within the meaning of Section 27 A of the Securities Act of 1933 , as amended, and Section 21 E of the Securities Exchange Act of 1934 , as amended . In addition, from time to time, Benchmark Electronics, Inc . (“the Company”) or its representatives have made or may make forward - looking statements, orally or in writing . Such forward - looking statements may be included in, but are not limited to, various filings made by the Company with the Securities and Exchange Commission, press releases or oral statements made with the approval of an authorized executive officer of the Company . Actual results could differ materially from those projected or suggested in any forward - looking statements as a result of many factors, some of which have been described in the section of the Company’s Annual Report on Form 10 - K for the year ended December 31 , 2012 , entitled “Risk Factors,” and in other documents the Company’s files from time to time, with the Securities and Exchange Commission, including annual reports on Form 10 - K, quarterly reports on Form 10 - Q and current reports on Form 8 - K . This document includes financial measures for earnings and earnings per share that exclude certain items and therefore are not in accordance with generally accepted accounting principles (GAAP) . A detailed reconciliation between GAAP results and results excluding special items (non - GAAP) is included in our press release and in the Appendix of this presentation .

design develop deliver advanced technology 3 Fourth Quarter 2013 Results (In millions, except EPS) Dec. 31, 2013 Sept. 30, 2013 Dec. 31, 2012 Net Sales $756.8 $599.7 $633.9 Net Income – GAAP $67.5 $23.7 $18.1 Net Income – non - GAAP $23.5 $16.9 $18.0 Diluted EPS – GAAP $1.24 $0.43 $0.33 Diluted EPS – non - GAAP $0.43 $0.31 $0.33 Operating Margin – GAAP 8.0% 4.9% 3.9% Operating Margin – non - GAAP 4.1% 3.5% 3.7% Effective Tax Rate – non - GAAP 22.2% 21.3% 22.2% For the Three Months Ended Results exceeded Guidance Provided for the December 31, 2013 Quarter: ▪ Revenue $685 – $715 ▪ Diluted EPS – non - GAAP $0.34 – $0.38
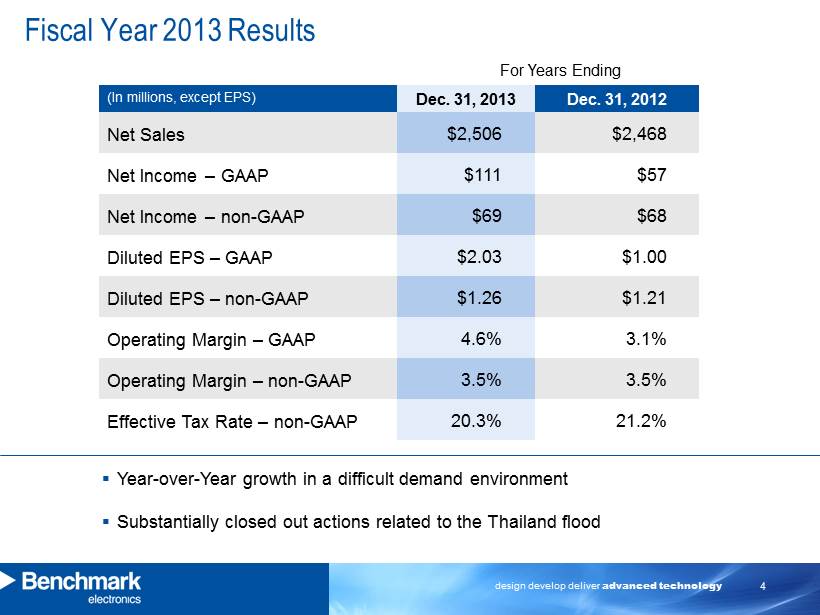
design develop deliver advanced technology 4 Fiscal Year 2013 Results (In millions, except EPS) Dec. 31, 2013 Dec. 31, 2012 Net Sales $2,506 $2,468 Net Income – GAAP $111 $57 Net Income – non - GAAP $69 $68 Diluted EPS – GAAP $2.03 $1.00 Diluted EPS – non - GAAP $1.26 $1.21 Operating Margin – GAAP 4.6% 3.1% Operating Margin – non - GAAP 3.5% 3.5% Effective Tax Rate – non - GAAP 20.3% 21.2% For Years Ending ▪ Year - over - Year growth in a difficult demand environment ▪ Substantially closed out actions related to the Thailand flood

design develop deliver advanced technology 5 Fourth Quarter Industry Sector Update Sector Dec. 31, 2013 Sept. 30, 2013 Dec. 31, 2012 Computers and Related Products for Business Enterprises 32% 30% 33% Industrial Control Equipment 27% 31% 27% Telecommunication Equipment 24% 20% 25% Medical Devices 10% 12% 10% Testing and Instrumentation Products 7% 7% 5% Total Revenue 100% 100% 100% Revenue by Industry Sector

design develop deliver advanced technology 6 Financial Statement Highlights Balance Sheet and Cash Flows (In millions) Dec. 31, 2013 Sept. 30, 2013 Dec. 31, 2012 Cash $345.6* $426.6 $384.6 Cash Flow from Operating Activities ($0.6) $38.7 $80.9 Acquisitions $75.0 $0 $0 Capital Expenditures $8.6 $6.8 $13.5 Depreciation & Amortization $11.3 $10.1 $9.3 Accounts Receivable $559.8 $423.6 $459.1 Days Sales Outstanding 67 64 65 Inventory $396.7 $395.0 $324.0 Inventory Turns 7.0x 5.6x 7.3x Total Cost of Shares Repurchased $10.5 $9.4 $15.7 * Approximately $38 million of cash is in the U.S.
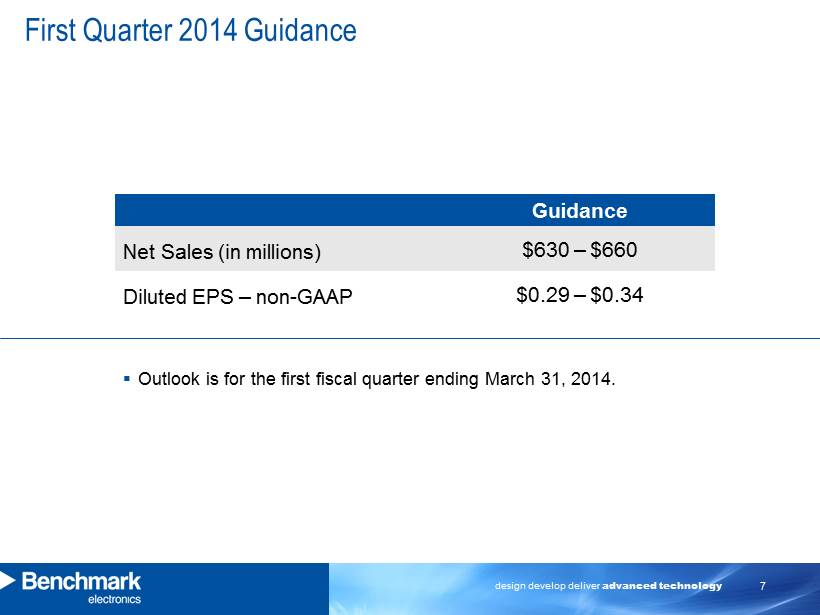
design develop deliver advanced technology 7 First Quarter 2014 Guidance Guidance Net Sales (in millions) $630 – $660 Diluted EPS – non - GAAP $0.29 – $0.34 ▪ Outlook is for the first fiscal quarter ending March 31, 2014.

design develop deliver advanced technology 8 CEO and President Commentary
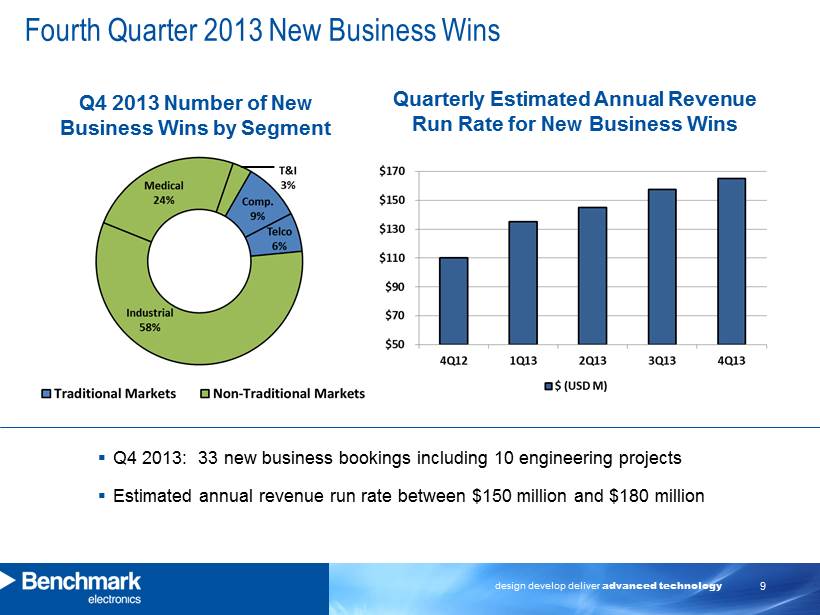
design develop deliver advanced technology 9 Fourth Quarter 2013 New Business Wins Q4 2013 Number of New Business Wins by Segment ▪ Q4 2013: 33 new business bookings including 10 engineering projects ▪ E stimated annual revenue run rate between $150 million and $180 million Quarterly Estimated Annual Revenue Run Rate for New Business Wins
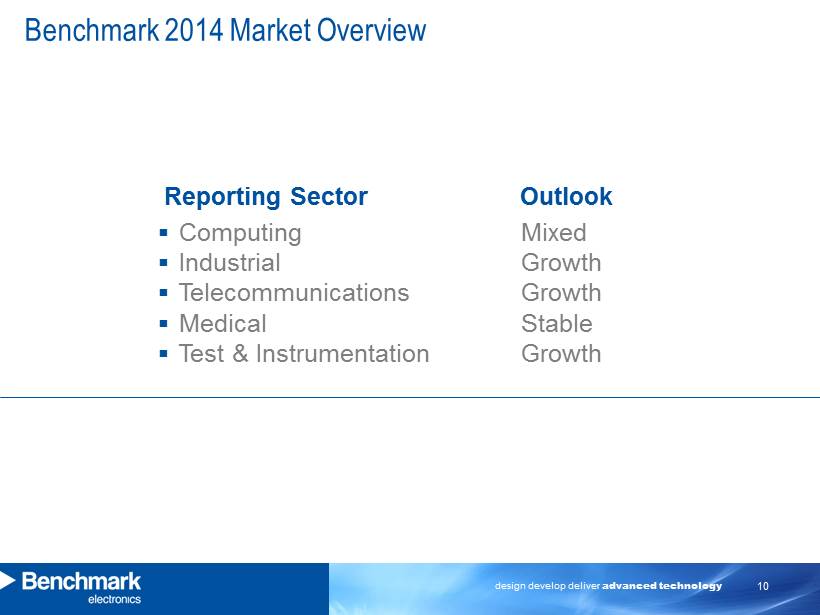
design develop deliver advanced technology 10 Benchmark 2014 Market Overview ▪ Computing Mixed ▪ Industrial Growth ▪ Telecommunications Growth ▪ Medical Stable ▪ Test & Instrumentation Growth Reporting Sector Outlook

design develop deliver advanced technology 11 ▪ Strong Q4 Results ▪ Solid 2013 Performance ▪ Continuing Progress in Three Key Focus Areas: o Operational Excellence o Portfolio Management o Customer Focus and New Bookings Summary Fourth Quarter and Full Year 2013

design develop deliver advanced technology 12 Appendix

design develop deliver advanced technology 13 Reconciliation of GAAP to non - GAAP Financial Results (Amounts in Thousands, Except Per Share Data) – (UNAUDITED) December 31, September 30, December 31, 2013 2013 2012 2013 2012 $ 60,275 $ 29,473 $ 24,584 $ 116,524 $ 75,559 2,025 1,214 1,427 9,348 2,200 - - - 2,606 - (31,577) (9,748) (2,770) (41,325) 9,028 $ 30,723 $ 20,939 $ 23,241 $ 87,153 $ 86,787 $ 67,489 $ 23,726 $ 18,115 $ 111,159 $ 56,607 1,343 1,002 1,249 8,290 1,833 - - - 2,849 - (27,810) (7,817) (1,319) (35,627) 9,862 (17,500) - - (17,500) - $ 23,522 $ 16,911 $ 18,045 $ 69,171 $ 68,302 Basic $ 1.26 $ 0.44 $ 0.33 $ 2.05 $ 1.01 Diluted $ 1.24 $ 0.43 $ 0.33 $ 2.03 $ 1.00 Basic $ 0.44 $ 0.31 $ 0.33 $ 1.28 $ 1.21 Diluted $ 0.43 $ 0.31 $ 0.33 $ 1.26 $ 1.21 Three Months Ended Year Ended net of tax December 31, Income from operations (GAAP) Restructuring charges and integration and acquisition-related costs Asset impairment charge and other Thailand flood related items Non-GAAP income from operations Net income (GAAP) Restructuring charges and integration and acquisition-related costs, net of tax Asset impairment charge and other, Thailand flood related items, net of tax Discrete US tax benefit Non-GAAP net income Earnings per share: (GAAP) Earnings per share: (Non-GAAP)