Attached files
| file | filename |
|---|---|
| 8-K - 8-K - ADVENT SOFTWARE INC /DE/ | a14-4859_18k.htm |
| EX-99.1 - EX-99.1 - ADVENT SOFTWARE INC /DE/ | a14-4859_1ex99d1.htm |
|
|
Advent Software, Inc. Fourth Quarter 2013 Earnings Highlights February 3, 2014 Advent Investor Relations Contact: InvestorRelations@advent.com |
|
|
ADVS Forward-Looking Statements The financial projections under Financial Guidance and any other forward-looking statements included in this presentation reflect management's best judgment based on factors currently known and involve risks and uncertainties and our actual results may differ materially from those discussed here. These risks and uncertainties include: potential fluctuations in new contract bookings, renewal rates, operating results and future growth rates; continued market acceptance of our products; the successful development, release and market acceptance of new products and product enhancements; uncertainties and fluctuations in the financial markets; the Company’s ability to satisfy contractual performance requirements and other risks detailed from time to time in our SEC reports including, but not limited to, our quarterly reports on Form 10-Q and our 2012 Annual Report on Form 10-K. The Company disclaims any intention or obligation to publicly update or revise any forward-looking statements including any guidance, whether as a result of events or circumstances after the date hereof or to reflect the occurrence of unanticipated events. 2 |
|
|
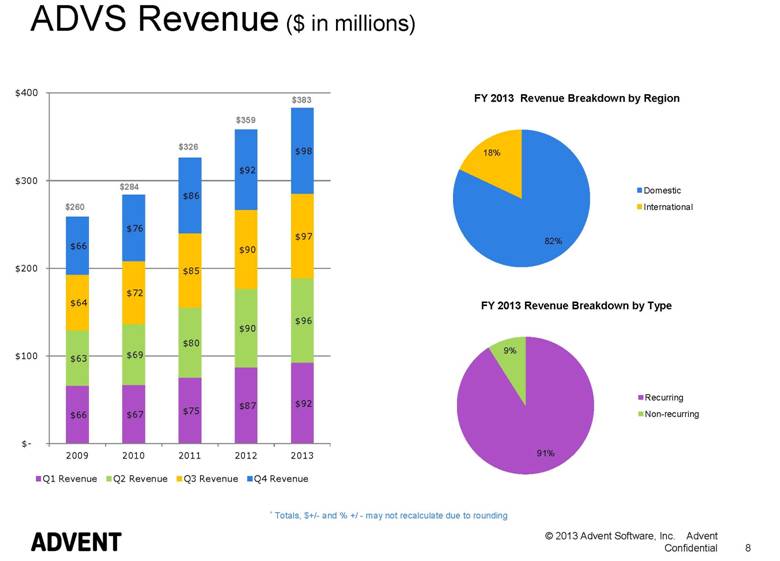
ADVS Q413 Highlights Annual Contract Value (ACV) from term license, Advent OnDemand, and Black Diamond contracts was $8.8M Annualized Recurring Run Rate was $359.2M at December 31, 2013 Quarterly revenue of $97.6M; 6% increase over prior year 19% of revenue was from international sources 91% of revenue was categorized as recurring Non-GAAP Operating Income of $28.9M, or 30% of revenue; increase of 17% compared to $24.6M, or 27% in prior year. Non-GAAP EPS of $0.32; increase of 5% over prior year Adjusted EBITDA of $31.4M; increase of 28% versus prior year Operating cash flows of $36.7M, increase of 12% over prior year Q3 initially reported renewal rate of 97%; increase of 3 points over prior year Q2 updated renewal rate of 94%; increase of 2 points over the initially reported rate 3 |
|
|
ADVS 2013 Highlights Annual Contract Value (ACV) from term license, Advent OnDemand, and Black Diamond contracts was $31.2M 2013 revenue of $383M; 7% increase over prior year 18% of revenue was from international sources 91% of revenue was categorized as recurring Non-GAAP Operating Income of $115.3M, or 30% of revenue; increase of 36% compared to $85.0M, or 24% in prior year. Non-GAAP EPS of $1.32; increase of 28% over prior year Adjusted EBITDA of $118.4M; increase of 23% versus prior year Operating cash flows of $98.6M, increase of 14% over prior year Contract backlog of $165M, increase of 29% over prior year 4 |
|
|
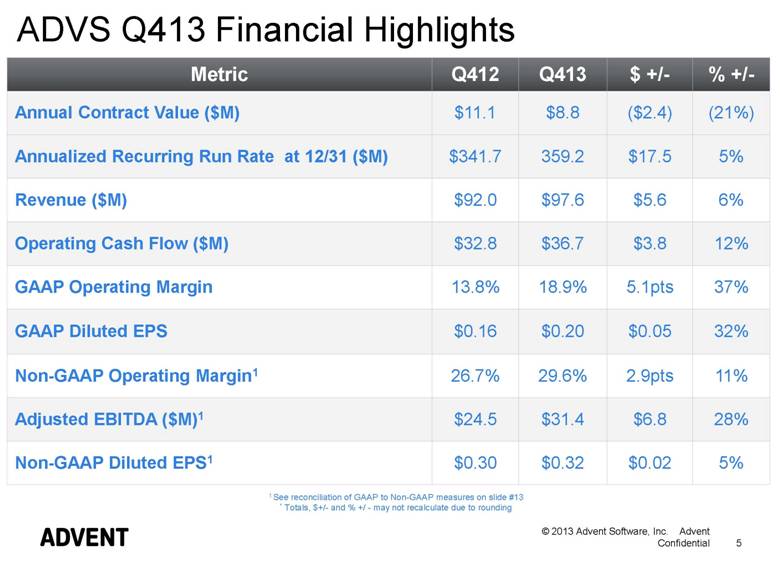
ADVS Q413 Financial Highlights Metric Q412 Q413 $ +/- % +/- Annual Contract Value ($M) $11.1 $8.8 ($2.4) (21%) Annualized Recurring Run Rate at 12/31 ($M) $341.7 359.2 $17.5 5% Revenue ($M) $92.0 $97.6 $5.6 6% Operating Cash Flow ($M) $32.8 $36.7 $3.8 12% GAAP Operating Margin 13.8% 18.9% 5.1pts 37% GAAP Diluted EPS $0.16 $0.20 $0.05 32% Non-GAAP Operating Margin1 26.7% 29.6% 2.9pts 11% Adjusted EBITDA ($M)1 $24.5 $31.4 $6.8 28% Non-GAAP Diluted EPS1 $0.30 $0.32 $0.02 5% 1 See reconciliation of GAAP to Non-GAAP measures on slide #13 * Totals, $+/- and % +/ - may not recalculate due to rounding 5 |
|
|
ADVS FY13 Financial Highlights Metric FY12 FY13 $ +/- % +/- Annual Contract Value ($M) $32.8 $31.2 ($1.7) (5%) Revenue ($M) $358.8 $383.0 $24.1 7% Operating Cash Flow ($M) $86.6 $98.6 $11.9 14% GAAP Operating Margin 13.7% 12.0% (1.7pts) (12%) GAAP Diluted EPS $0.58 $0.54 ($0.04) (7%) Non-GAAP Operating Margin1 23.7% 30.1% 6.4pts 27% Adjusted EBITDA ($M)1 $96.0 $118.4 $22.5 23% Non-GAAP Diluted EPS1 $1.03 $1.32 $0.29 28% 1 See reconciliation of GAAP to Non-GAAP measures on slide #14 * Totals, $+/- and % +/ - may not recalculate due to rounding 6 |
|
|
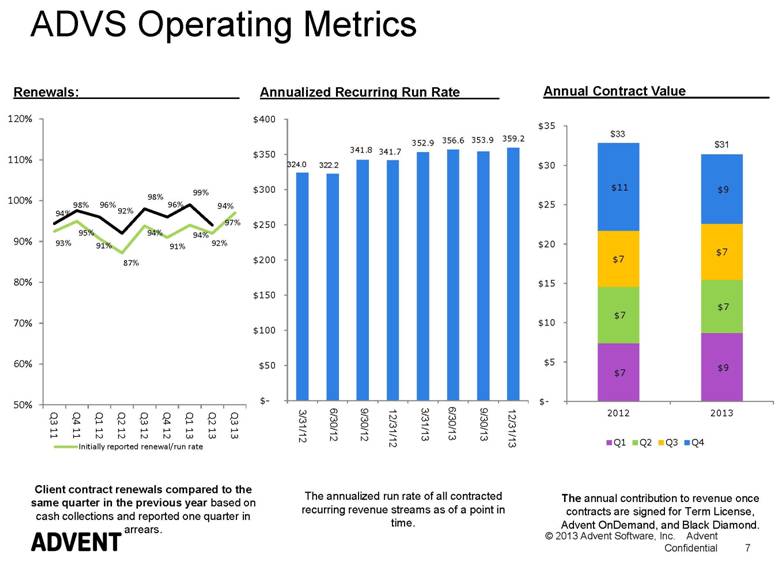
7 ADVS Operating Metrics 7 Annual Contract Value Annualized Recurring Run Rate Renewals: $33 $31 324.0 322.2 The annual contribution to revenue once contracts are signed for Term License, Advent OnDemand, and Black Diamond. The annualized run rate of all contracted recurring revenue streams as of a point in time. Client contract renewals compared to the same quarter in the previous year based on cash collections and reported one quarter in arrears. 3/31/12 6/30/12 9/30/12 12/31/12 3/31/13 6/30/13 9/30/13 12/31/13 |
|
|
ADVS Revenue ($ in millions) * Totals, $+/- and % +/ - may not recalculate due to rounding 8 |
|
|
ADVS Q413 Revenue Components ($ in millions) Q412 Q413 $ +/- % +/- Recurring $83.9 $89.0 $5.1 6% Term License Revenue $42.2 $47.1 $4.9 12% Perpetual Maintenance $16.7 $16.0 ($0.7) (4%) Other Recurring 1 $25.0 $25.9 $0.9 4% Non-Recurring $8.1 $8.6 $0.4 5% Total Revenue $92.0 $97.6 $5.6 6% 1 Includes OnDemand, Data Services, Black Diamond, and asset based fees. * Totals, $+/- and % +/ - may not recalculate due to rounding 9 |
|
|
ADVS FY13 Revenue Components ($ in millions) FY12 FY13 $ +/- % +/- Recurring $324.6 $349.9 $25.3 8% Term License Revenue $159.9 $180.5 $20.5 13% Perpetual Maintenance $67.1 $65.4 ($1.7) (2%) Other Recurring 1 $97.6 $104.0 $6.4 7% Non-Recurring $34.2 $33.1 ($1.1) (3%) Total Revenue $358.8 $383.0 $24.1 7% 1 Includes OnDemand, Data Services, Black Diamond, and asset based fees. * Totals, $+/- and % +/ - may not recalculate due to rounding 10 |
|
|
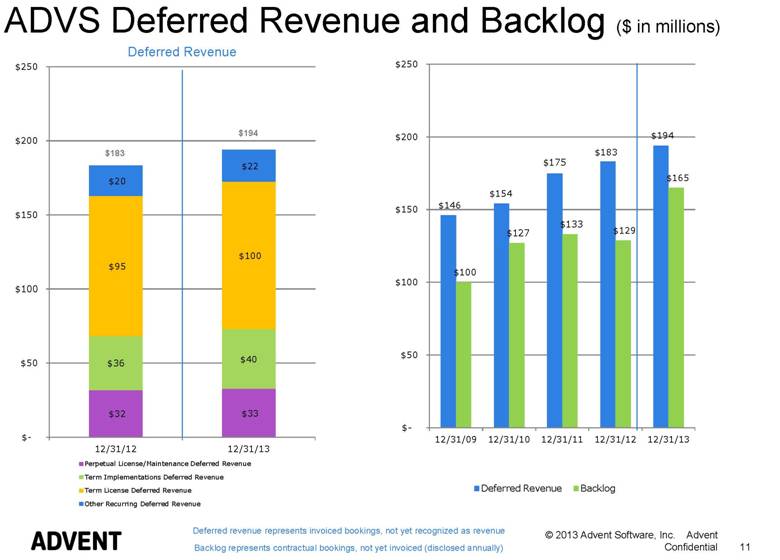
Deferred revenue represents invoiced bookings, not yet recognized as revenue Backlog represents contractual bookings, not yet invoiced (disclosed annually) 11 Deferred Revenue ADVS Deferred Revenue and Backlog ($ in millions) |
|
|
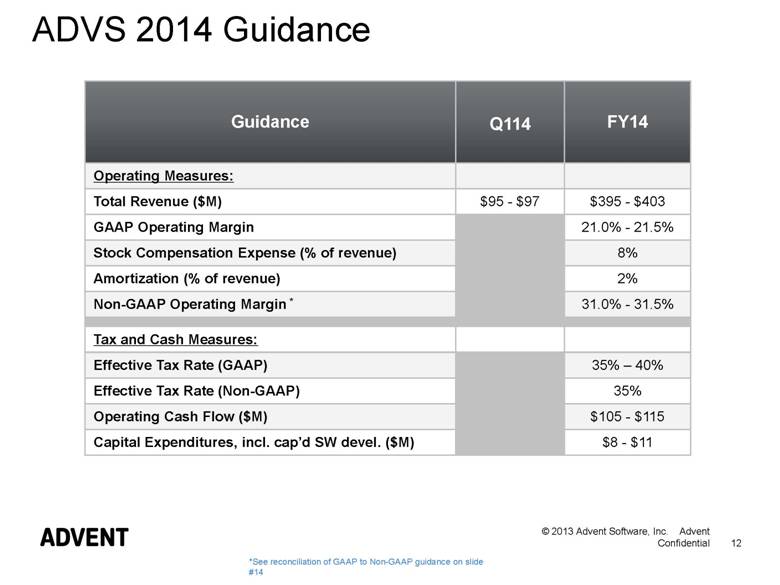
Guidance Q114 FY14 Operating Measures: Total Revenue ($M) $95 - $97 $395 - $403 GAAP Operating Margin 21.0% - 21.5% Stock Compensation Expense (% of revenue) 8% Amortization (% of revenue) 2% Non-GAAP Operating Margin * 31.0% - 31.5% Tax and Cash Measures: Effective Tax Rate (GAAP) 35% – 40% Effective Tax Rate (Non-GAAP) 35% Operating Cash Flow ($M) $105 - $115 Capital Expenditures, incl. cap’d SW devel. ($M) $8 - $11 ADVS 2014 Guidance *See reconciliation of GAAP to Non-GAAP guidance on slide #14 12 |
|
|
Q413 Reconciliation of GAAP to Non-GAAP 13 Amount % of Net Revenues Amount % of Net Revenues GAAP gross margin 68,524 $ 70.2% 62,578 $ 68.0% Amortization of acquired intangibles 1,177 1,908 Stock-based compensation 1,407 905 Non-GAAP gross margin 71,108 $ 72.9% 65,391 $ 71.1% GAAP operating income 18,397 $ 18.9% 12,692 $ 13.8% Amortization of acquired intangibles 2,089 2,866 Stock-based compensation 7,582 5,457 Restructuring charges 811 3,581 Non-GAAP operating income 28,879 $ 29.6% 24,596 $ 26.7% GAAP net income 11,017 $ 8,030 $ Amortization of acquired intangibles 2,089 2,866 Stock-based compensation 7,582 5,457 Restructuring charges 811 3,581 Income tax adjustment (1) (4,420) (4,281) Non-GAAP net income 17,079 $ 15,653 $ GAAP net income 11,017 $ 8,030 $ Net interest 2,510 408 Provision for income taxes 4,777 4,147 Depreciation expense 2,895 2,991 Amortization expense 2,594 3,516 Stock-based compensation 7,582 5,457 Adjusted EBITDA 31,375 $ 24,549 $ Diluted net income per share GAAP 0.20 $ 0.16 $ Non-GAAP 0.32 $ 0.30 $ Shares used to compute diluted net income per share 53,844 51,802 (1) The estimated non-GAAP effective tax rate was 35% for the three months ended December 31, 2013 and 2012, respectively, and has been used to adjust the provision for income taxes for non-GAAP net income and non-GAAP diluted net income per share purposes. 2013 2012 ADVENT SOFTWARE, INC. RECONCILIATION OF SELECTED CONTINUING OPERATIONS' GAAP MEASURES TO NON-GAAP MEASURES (In thousands, except per share data) (Unaudited) To supplement our condensed consolidated financial statements presented in accordance with generally accepted accounting principles in the United States of America (or GAAP), Advent uses non-GAAP measures of continuing operations' gross margin, operating income, net income and net income per share, which are adjusted to exclude certain costs, expenses and income we believe appropriate to enhance an overall understanding of our past financial performance and also our prospects for the future. These adjustments to our current period GAAP results are made with the intent of providing both management and investors a more complete understanding of Advent’s underlying operational results and trends and our marketplace performance. In addition, these non-GAAP results are among the information management uses as a basis for our planning and forecasting of future periods. The presentation of this additional information is not meant to be considered in isolation or as a substitute for results prepared in accordance with GAAP. Three Months Ended December 31 |
|
|
FY13 Reconciliation of GAAP to Non-GAAP 14 Amount % of Net Revenues Amount % of Net Revenues GAAP gross margin 263,238 $ 68.7% 236,103 $ 65.8% Amortization of acquired intangibles 6,841 7,599 Stock-based compensation 6,744 3,641 Non-GAAP gross margin 276,823 $ 72.3% 247,343 $ 68.9% GAAP operating income 46,132 $ 12.0% 49,179 $ 13.7% Amortization of acquired intangibles 10,616 11,424 Stock-based compensation 48,179 20,801 Restructuring charges 3,770 3,634 Recapitalization costs 6,041 - Transaction related fees 565 - Non-GAAP operating income 115,303 $ 30.1% 85,038 $ 23.7% GAAP net income 28,752 $ 30,231 $ Amortization of acquired intangibles 10,616 11,424 Stock-based compensation 48,179 20,801 Restructuring charges 3,770 3,634 Recapitalization costs 6,692 - Transaction related fees 565 - Income tax adjustment (1) (27,892) (11,868) Non-GAAP net income 70,682 $ 54,222 $ GAAP net income 28,752 $ 30,231 $ Net interest 6,949 1,732 Provision for income taxes 10,167 17,328 Depreciation expense 11,531 11,796 Amortization expense 12,862 14,083 Stock-based compensation 48,179 20,801 Adjusted EBITDA 118,440 $ 95,971 $ Diluted net income per share GAAP 0.54 $ 0.58 $ Non-GAAP 1.32 $ 1.03 $ Shares used to compute diluted net income per share 53,378 52,425 (1) The estimated non-GAAP effective tax rate was 35% for the twelve months ended December 31, 2013 and 2012, respectively, and has been used to adjust the provision for income taxes for non-GAAP net income and non-GAAP diluted net income per share purposes. 2013 2012 ADVENT SOFTWARE, INC. RECONCILIATION OF SELECTED CONTINUING OPERATIONS' GAAP MEASURES TO NON-GAAP MEASURES (In thousands, except per share data) (Unaudited) To supplement our condensed consolidated financial statements presented in accordance with generally accepted accounting principles in the United States of America (or GAAP), Advent uses non-GAAP measures of continuing operations' gross margin, operating income, net income and net income per share, which are adjusted to exclude certain costs, expenses and income we believe appropriate to enhance an overall understanding of our past financial performance and also our prospects for the future. These adjustments to our current period GAAP results are made with the intent of providing both management and investors a more complete understanding of Advent’s underlying operational results and trends and our marketplace performance. In addition, these non-GAAP results are among the information management uses as a basis for our planning and forecasting of future periods. The presentation of this additional information is not meant to be considered in isolation or as a substitute for results prepared in accordance with GAAP. Twelve Months Ended December 31 |
|
|
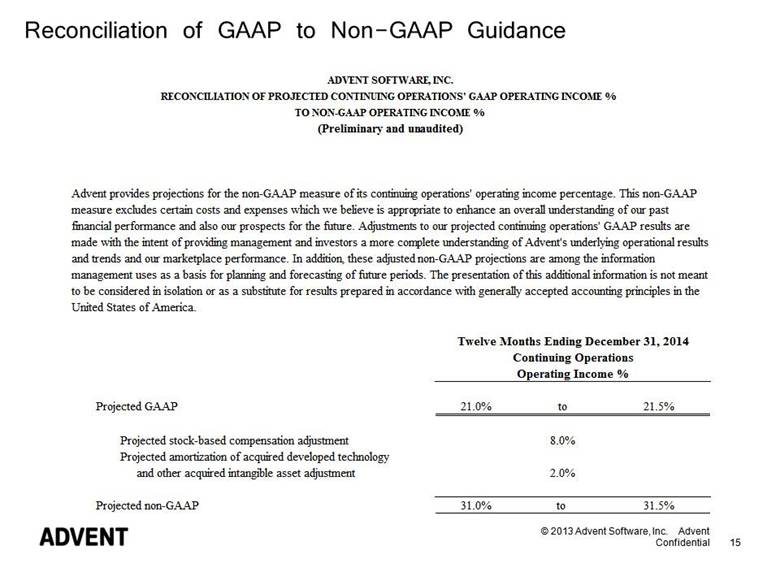
Reconciliation of GAAP to Non-GAAP Guidance 15 Projected GAAP 21.0% to 21.5% Projected stock-based compensation adjustment 8.0% Projected amortization of acquired developed technology and other acquired intangible asset adjustment 2.0% Projected non-GAAP 31.0% to 31.5% Twelve Months Ending December 31, 2014 Continuing Operations Operating Income % ADVENT SOFTWARE, INC. RECONCILIATION OF PROJECTED CONTINUING OPERATIONS' GAAP OPERATING INCOME % TO NON-GAAP OPERATING INCOME % (Preliminary and unaudited) Advent provides projections for the non-GAAP measure of its continuing operations' operating income percentage. This non-GAAP measure excludes certain costs and expenses which we believe is appropriate to enhance an overall understanding of our past financial performance and also our prospects for the future. Adjustments to our projected continuing operations' GAAP results are made with the intent of providing management and investors a more complete understanding of Advent's underlying operational results and trends and our marketplace performance. In addition, these adjusted non-GAAP projections are among the information management uses as a basis for planning and forecasting of future periods. The presentation of this additional information is not meant to be considered in isolation or as a substitute for results prepared in accordance with generally accepted accounting principles in the United States of America. |