Attached files
| file | filename |
|---|---|
| 8-K - 8-K - LyondellBasell Industries N.V. | d668076d8k.htm |
| EX-99.1 - EX-99.1 - LyondellBasell Industries N.V. | d668076dex991.htm |
 Jim
Gallogly, Chief Executive Officer Karyn Ovelmen, Chief Financial Officer
Sergey Vasnetsov, SVP -
Strategic Planning and Transactions
Doug Pike, VP -
Investor Relations
Fourth-Quarter 2013 Earnings
January 31, 2014
Exhibit 99.2 |
 Cautionary Statement
The
statements
in
this
presentation
relating
to
matters
that
are
not
historical
facts
are
forward-looking
statements.
These forward-looking statements are based upon assumptions of management which
are believed to be reasonable at the time made and are subject to
significant risks and uncertainties. Actual results could differ materially based on
factors including, but not limited to, the business cyclicality of the chemical,
polymers and refining industries; the availability, cost and price
volatility of raw materials and utilities, particularly the cost of oil, natural gas, and
associated natural gas liquids; competitive product and pricing pressures; labor
conditions; our ability to attract and retain key personnel; operating
interruptions (including leaks, explosions, fires, weather-related incidents, mechanical
failure, unscheduled downtime, supplier disruptions, labor shortages, strikes, work
stoppages or other labor difficulties, transportation interruptions, spills
and releases and other environmental risks); the supply/demand
balances
for
our
and
our
joint
ventures’
products,
and
the
related
effects
of
industry
production
capacities
and
operating rates; our ability to achieve expected cost savings and other synergies;
legal and environmental proceedings; tax rulings, consequences or
proceedings; technological developments, and our ability to develop new
products and process technologies; potential governmental regulatory actions;
political unrest and terrorist acts; risks and uncertainties posed by
international operations, including foreign currency fluctuations; and our ability to comply
with debt covenants and service our debt. Additional factors that could cause
results to differ materially from those described
in
the
forward-looking
statements
can
be
found
in
the
“Risk
Factors”
section
of
our
Form
10-K
for
the
year
ended December 31, 2012, which can be found at www.lyondellbasell.com on the
Investor Relations page and on the Securities and Exchange Commission’s
website at www.sec.gov. The illustrative results
or returns of growth projects are not in any way intended to be, nor should they be taken as,
indicators or guarantees of performance. The assumptions on which they are based
are not projections and do not necessarily represent the Company’s
expectations and future performance. You should not rely on illustrated results
or returns or these assumptions as being indicative of our future results or
returns. This presentation contains time sensitive information that is
accurate only as of the date hereof. Information contained in this
presentation is unaudited and is subject to change. We undertake no obligation to update the
information presented herein except as required by law.
2 |
 Information Related to Financial Measures
We have included EBITDA in this presentation, which is a non-GAAP measure, as
we believe that EBITDA
is
a
measure
commonly
used
by
investors.
However,
EBITDA,
as
presented
herein,
may
not
be
comparable to a similarly titled measure reported by other companies due to
differences in the way the measure is calculated.
We calculate EBITDA as income from continuing operations plus interest
expense (net), provision for (benefit from) income taxes, and depreciation &
amortization. EBITDA should not be considered an alternative to profit or
operating profit for any period as an indicator of our performance, or as an
alternative to operating cash flows as a measure of our liquidity. See Table 9 of
our accompanying earnings release for reconciliations of EBITDA to net
income. While we also believe that free cash flow (FCF) is a measure commonly
used by investors, free cash flow, as presented herein, may not be
comparable to a similarly titled measure reported by other companies due to
differences in the way the measure is calculated. For purposes of this presentation,
free cash flow means net cash provided by operating activities minus capital
expenditures. 3 |
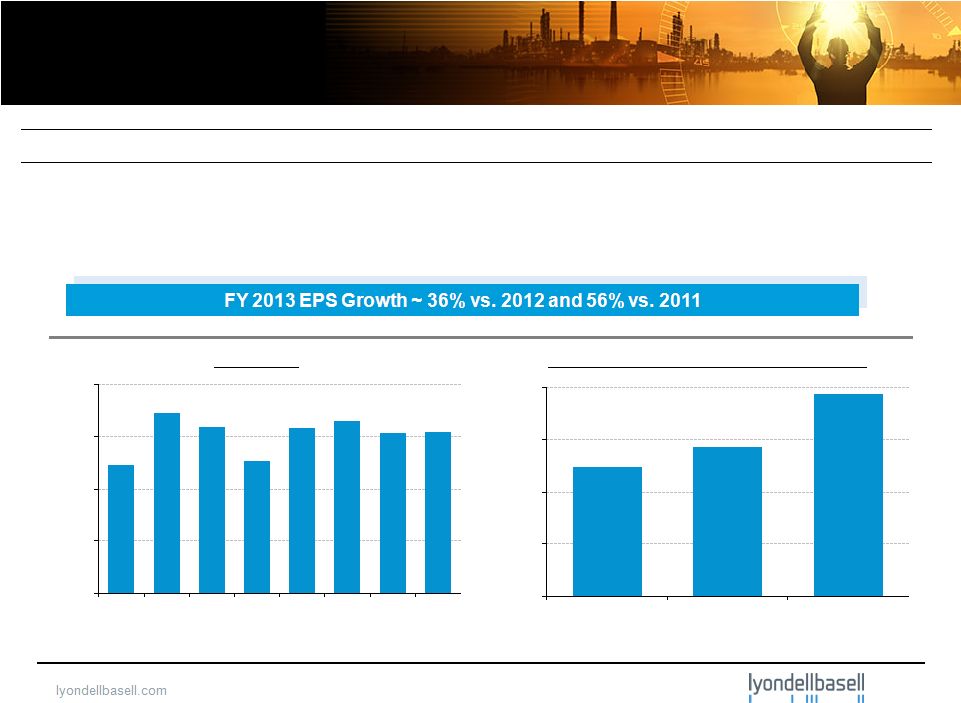 1,000
2,000
3,000
$4,000
2011
2012
2013
Highlights
EBITDA
(1)
($ in millions)
4
(1) EBITDA includes a pre-tax lower of cost or market inventory valuation
adjustment of $71 million in the third quarter 2012 which reversed a charge in the second quarter of 2012, due to a recovery in market
prices.
Income from Continuing Operations
($ in millions, except per share data)
FY 2013
FY 2012
FY 2011
EBITDA
(1)
$6,311
$5,808
$5,469
Income from Continuing Operations
$3,860
$2,858
$2,472
Diluted Earnings ($ / share) from Continuing Operations
$6.76
$4.96
$4.32
500
1,000
1,500
$2,000
1Q'12
2Q'12
3Q'12
4Q'12
1Q'13
2Q'13
3Q'13
4Q'13 |
 Health, Safety and Environmental Performance
1) Includes employees and contractors.
Safety -
Injuries per 200,000 Hours
Worked
(1)
Indexed Environmental Incidents
Indexed Process Incidents
5
0%
25%
50%
75%
100%
2009
2010
2011
2012
2013
0%
25%
50%
75%
100%
2009
2010
2011
2012
2013
0.00
0.15
0.30
0.45
0.60
2009
2010
2011
2012
2013 |
 2013
Accomplishments Record financial results, continued advancement made across
the company ($ in millions)
1)
Total
stock
return
based
on
CapIQ
dividend
adjusted
beginning
and
closing
prices
for
2012
and
2013.
6
Segment EBITDA
2011 EBITDA
2012 EBITDA
2013 EBITDA
2012 - 2013 Change
2012 - 2013 Change, %
Olefins & Polyolefins - Americas
$2,137
$2,968
$3,573
$605
20%
Olefins & Polyolefins - EAI
865
548
839
291
53%
Intermediates & Derivatives
1,410
1,621
1,492
(129)
-8%
Refining
977
481
182
(299)
-62%
Technology
191
197
232
35
18%
Total
$5,469
$5,808
$6,311
$503
9% |
 263
255
232
0
60
120
180
240
300
8.4
3.7
9.0
3.5
9.0
3.8
0
2
4
6
8
10
US
EU
1) I&D volumes exclude oxyfuels
2) EU ethylene cash margins normalized to 2010 US margins. 2010 indexed margin is
equal to 100% 3) Polyethylene and Polypropylene spreads indexed to 2010; 2010
indexed margins are equal to 100% * 2013 average crude processing rate
excluding the impact from Q1’13 turnaround Key Volumes and Margins: 2011
- 2013
HRO Crude Oil Rates
Polyethylene Volumes
Polypropylene Volumes
Maya 2-1-1 Spreads
Indexed Polyethylene
Spreads
(3)
Indexed Polypropylene
Spreads
(3)
Ethylene Volumes
Indexed Ethylene Cash
Margins
(2)
I&D Chemical
Volumes
(1)
MTBE Raw Material
Margin
MBPD
($/bbl)
billion lbs
billion lbs
billion lbs
billion lbs
(Cents/gal)
7
10.6
10.5
10.5
0
3
6
9
12
15
8.9
8.9
9.1
0
2
4
6
8
10
10.5
10.6
10.4
0
3
6
9
12
15
126
20
160
18
179
45
0
40
80
120
160
200
US
EU
91
94
95
78
120
80
0
30
60
90
120
150
US
EU
92
92
97
78
99
85
0
20
40
60
80
100
US
EU
83
118
79
0
25
50
75
100
125
23
25
23
0
5
10
15
20
25
%
%
%
253
(*) |
 200
400
600
800
$1000
Olefins &
Polyolefins -
Americas
Olefins &
Polyolefins -
EAI
Intermediates
& Derivatives
Refining
Technology
FY 2013 EBITDA
Fourth Quarter 2013 and FY 2013 Segment EBITDA
Fourth Quarter 2013 EBITDA
($ in millions)
($ in millions)
8
750
1,500
2,250
3,000
$3,750
Olefins &
Polyolefins -
Americas
Olefins &
Polyolefins -
EAI
Intermediates
& Derivatives
Refining
Technology |
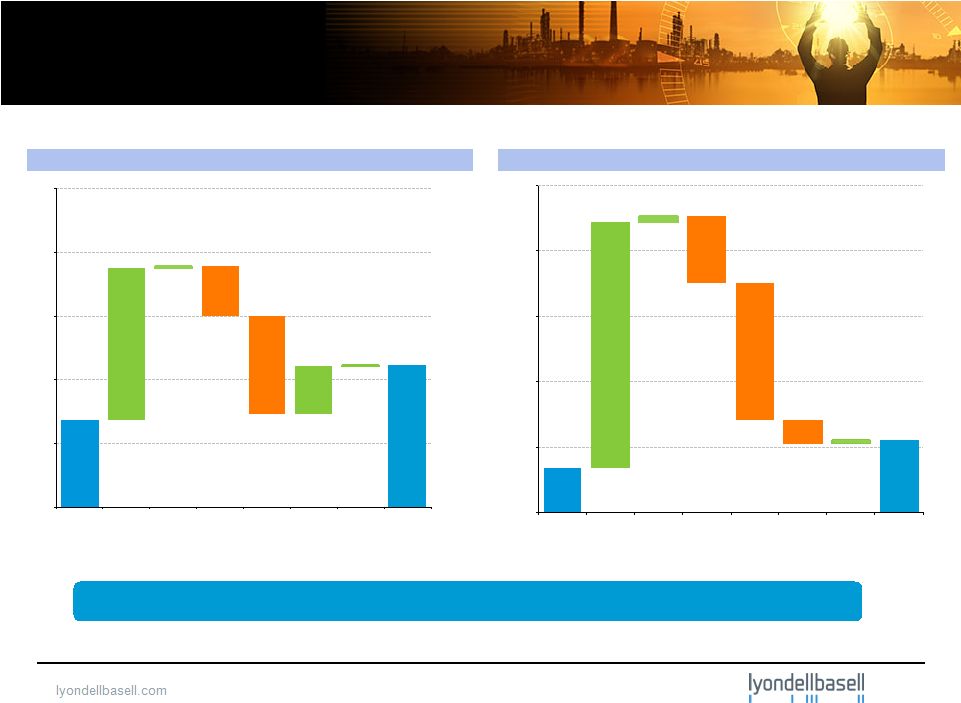 $2,711
$8,384
$4,450
0
4,000
8,000
12,000
16,000
$20,000
May 2010
Beginning
Cash
Balance
CF from
Operations
excl.
Working
Capital
Working
Capital
Changes
Capex
Dividends &
Share
Repurchases
Net Debt
Repayment
Other
Dec 2013
Ending Cash
Balance
$2,732
$3,076
$4,450
0
2,000
4,000
6,000
8,000
$10,000
Jan 2013
Beginning
Cash
Balance
CF from
Operations
excl.
Working
Capital
Working
Capital
Changes
Capex
Dividends &
Share
Repurchases
Net Debt
Borrowings
Other
Dec 2013
Ending Cash
Balance
Cash Flow
1) Beginning and ending cash balances include cash and cash equivalents; 2)
Includes accounts receivable, inventories, and accounts payable; 3) Includes capital and maintenance turnaround spending.
(3)
(2)
(1)
($ in millions)
(2)
(1)
FY 2013
May 2010 –
December 2013
(3)
(1)
9
(1)
~ $8.4 billion in dividends and share repurchases since inception
|
 3,671
6,435
1,949
0
3,750
7,500
11,250
$15,000
Source of Cash
Use of Cash
Cash from Ops
Capex
Dividends
Share Repurchases
0
400
800
1,200
$1,600
2011
2012
2013
Base
Growth
1,500
3,000
4,500
$6,000
2011
2012
2013
Capex
Free Cash Flow
10
Indexed Cash Fixed Cost
(1)
Free Cash Flow
(2)
Capital Expenditures
2011 –
2013 Cash Deployment
Key Financial Statistics
($ in millions)
($ in millions)
($ in millions)
1) Cash fixed costs include costs related to compensation, travel, insurance, third
party services, maintenance, marketing, selling, and administration; 2) Free Cash Flow = net cash provided by operating activities –
capex
25%
50%
75%
100%
2008
2009
2010
2011
2012
2013
(Indexed to 2008) |
 Olefins & Polyolefins -
Americas
Highlights and Business Drivers -
4Q’13
11
1) Source: quarterly average industry data from third party consultants; 2) The
direction of the arrows reflects our underlying business metrics. |
 Olefins & Polyolefins -
Europe, Asia, International
Highlights and Business Drivers -
4Q’13
12
1) Source: quarterly average data from third party
consultants; 2) The direction of the arrows reflects our underlying business metrics. |
 0
15
30
45
4Q12
3Q13
4Q13
1Q14 E
Intermediates & Derivatives
Highlights and Business Drivers -
4Q’13
EBITDA
Propylene Oxide and Derivatives
•
Higher deicer sales
Intermediates
•
Lower styrene margins
•
Methanol restart
Oxyfuels
EBITDA
Margin
Volume
Performance vs. 3Q’13
($ in millions)
13
EU MTBE Raw Material Margins (per Platts)
(1)
(cents / gallon)
P-Glycol Raw Material Margins (per Chemdata)
(1)
(cents / lb)
1) Data represents quarterly average; 2) The direction of the
arrows reflects our underlying business metrics. 100
200
300
400
$500
4Q'12
1Q'13
2Q'13
3Q'13
4Q'13
0
40
80
120
4Q'12
3Q'13
4Q'13
Jan'14
(2)
•
Seasonal volume and margin decline |
 Refining Highlights and Business Drivers -
4Q’13
1) Light Louisiana Sweet (LLS) is the referenced light crude. Data represents
quarterly average; 2) The direction of the arrows reflects our underlying business metrics.
14 |
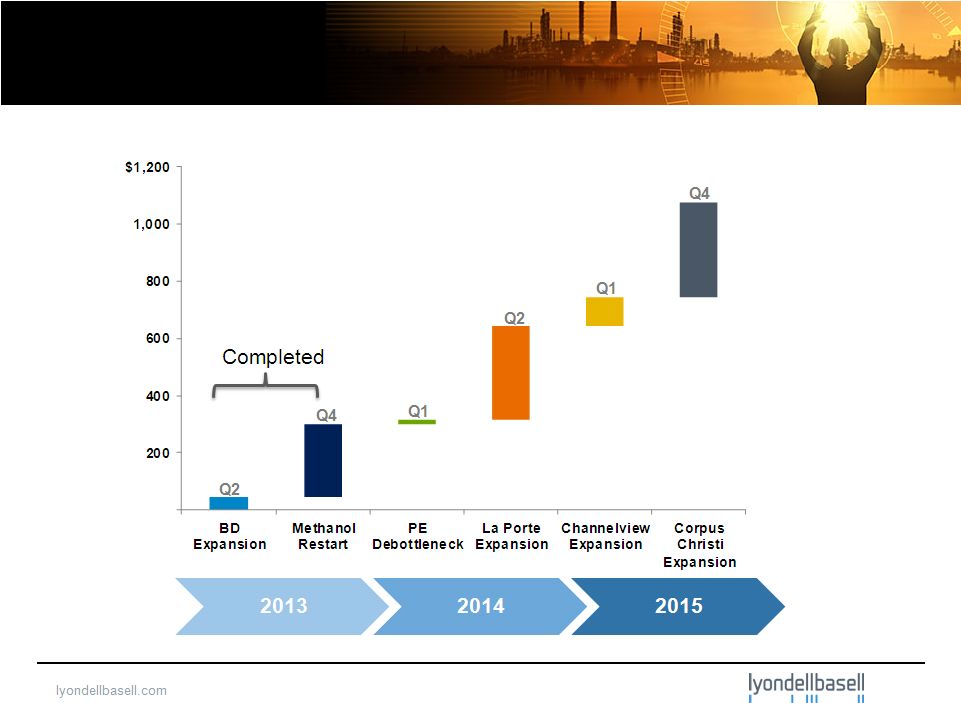 Projects Annual Potential Values &
Completion Timeline
15
Annual Potential Value
(1)
($ Million/ yr)
1) Annual potential values are based on LTM September 2013 industry benchmark
margins. |
 –
U.S. NGL advantage continues
–
La Porte turnaround and expansion
scheduled to begin in late Q1’2014,
estimate ~ 80 days
–
January Maya 2-1-1 crack spread ~
$28 per barrel
–
Growth projects remain on schedule
•
Polyethylene expansion project target
completion in 1Q’2014
Fourth-Quarter Summary and Outlook
–
Continued strength in O&P –
Americas results
•
Building inventory in preparation for
La Porte turnaround
–
Business declines driven by
seasonal impacts such as
•
Lower European polyolefin volumes
•
Lower oxyfuels margins and
volumes
–
Improved refining results
–
Methanol project completion and
restart of operations
–
Increased interim dividend by 20%
to $0.60 per share
Fourth-Quarter Summary
Near-Term Outlook
16 |