Attached files
| file | filename |
|---|---|
| 8-K - FORM 8K Q4 2013 - ManpowerGroup Inc. | form8k.htm |
| EX-99.1 - PRESS RELEASE FINANCIALS - ManpowerGroup Inc. | exhibit_99-1.htm |
Exhibit 99.2
ManpowerGroup Fourth Quarter Results January 30, 2014
Forward-Looking Statements This presentation contains statements, including financial projections, that are forward-looking in nature. These statements are based on managements’ current expectations or beliefs, and are subject to known and unknown risks and uncertainties regarding expected future results. Actual results might differ materially from those projected in the forward-looking statements. Additional information concerning factors that could cause actual results to materially differ from those in the forward-looking statements is contained in the ManpowerGroup Inc. Annual Report on Form 10-K dated December 31, 2012, which information is incorporated herein by reference, and such other factors as may be described from time to time in the Company’s SEC filings. Any forward-looking statements in this presentation speak only as of the date hereof. The Company assumes no obligation to update or revise any forward-looking statements. *
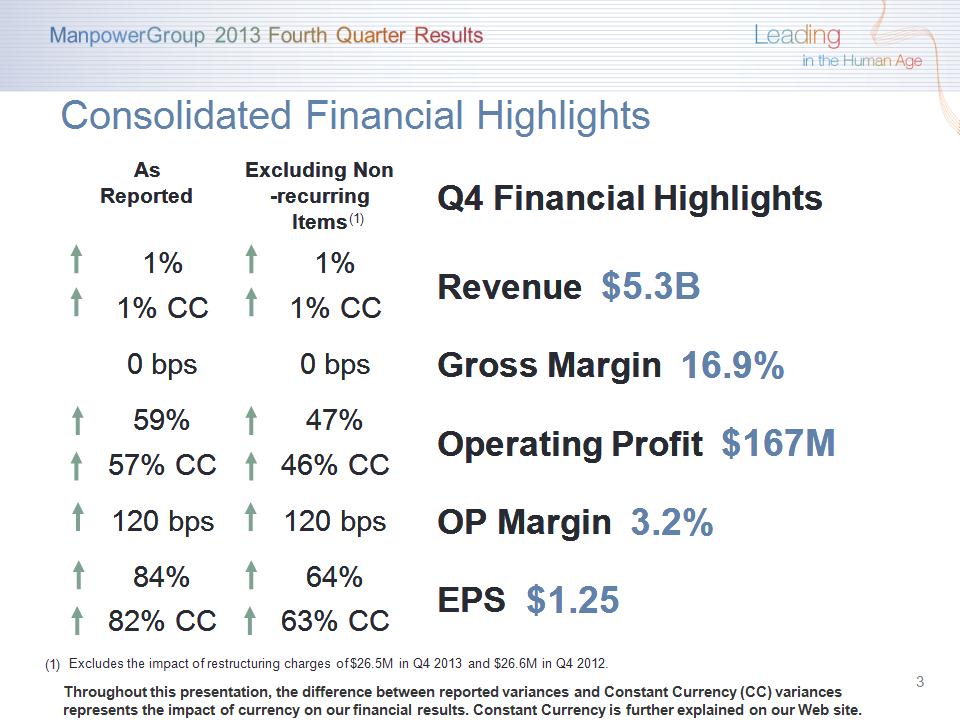
As Reported Excluding Non-recurring Items Q4 Financial Highlights 1% 1% Revenue $5.3B 1% CC 1% CC Revenue $5.3B 0 bps 0 bps Gross Margin 16.9% 59% 47% Operating Profit $167M 57% CC 46% CC Operating Profit $167M 120 bps 120 bps OP Margin 3.2% 84% 64% EPS $1.25 82% CC 63% CC EPS $1.25 Throughout this presentation, the difference between reported variances and Constant Currency (CC) variances represents the impact of currency on our financial results. Constant Currency is further explained on our Web site. Consolidated Financial Highlights * Excludes the impact of restructuring charges of $26.5M in Q4 2013 and $26.6M in Q4 2012. (1)
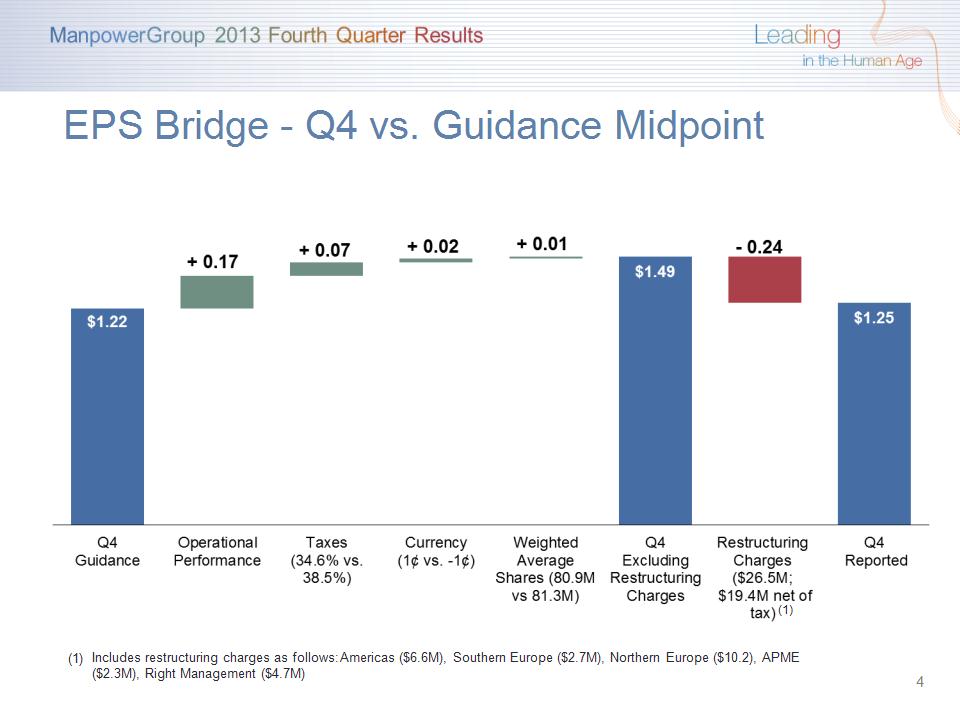
EPS Bridge – Q4 vs. Guidance Midpoint Includes restructuring charges as follows: Americas ($6.6M), Southern Europe ($2.7M), Northern Europe ($10.2), APME ($2.3M), Right Management ($4.7M) (1) * + 0.01 + 0.10 + 0.05 - 0.01 + 0.02
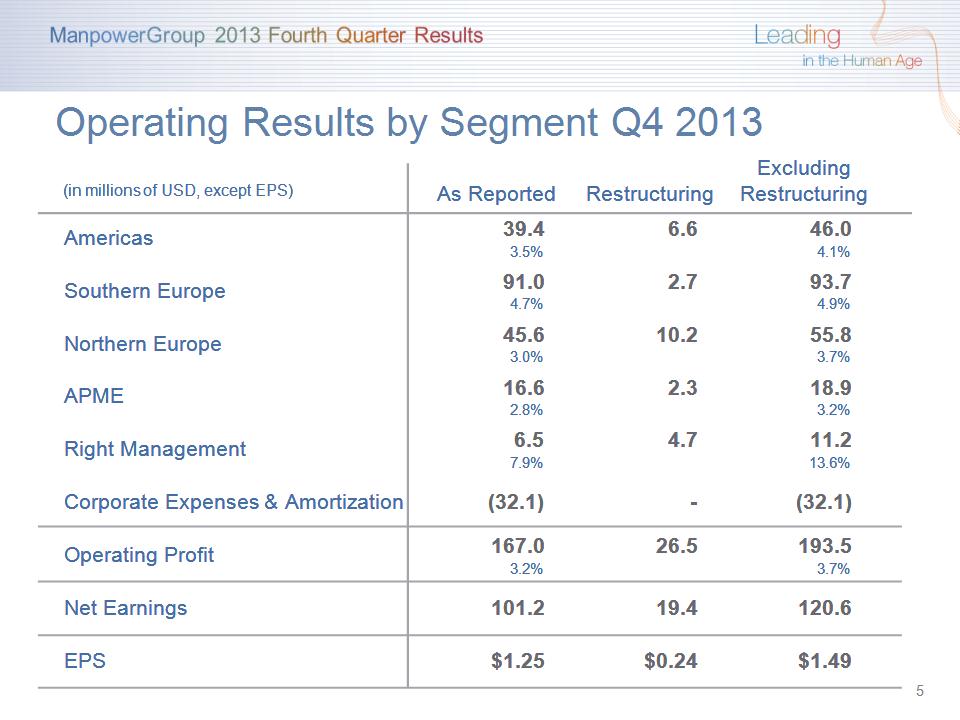
(in millions of USD, except EPS) As Reported Restructuring Excluding Restructuring Americas 39.4 3.5% 6.6 46.0 4.1% Southern Europe 91.0 4.7% 2.7 93.7 4.9% Northern Europe 45.6 3.0% 10.2 55.8 3.7% APME 16.6 2.8% 2.3 18.9 3.2% Right Management 6.5 7.9% 4.7 11.2 13.6% Corporate Expenses & Amortization (32.1) - (32.1) Operating Profit 167.0 3.2% 26.5 193.5 3.7% Net Earnings 101.2 19.4 120.6 EPS $1.25 $0.24 $1.49 Operating Results by Segment Q4 2013 *
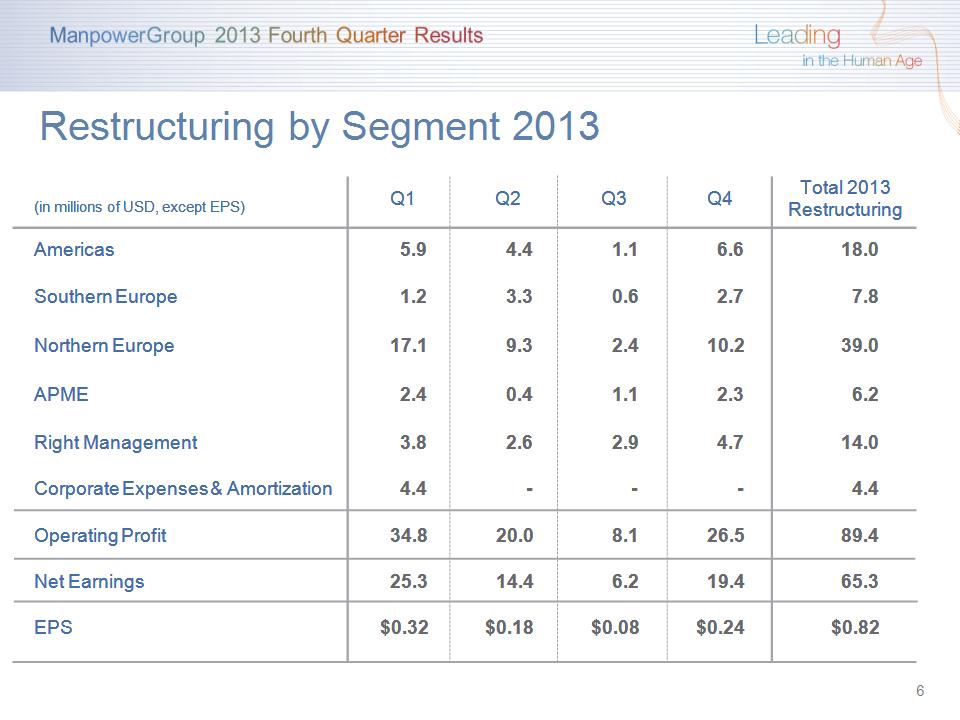
Restructuring by Segment 2013 (in millions of USD, except EPS) Q1 Q2 Q3 Q4 Total 2013 Restructuring Americas 5.9 4.4 1.1 6.6 18.0 Southern Europe 1.2 3.3 0.6 2.7 7.8 Northern Europe 17.1 9.3 2.4 10.2 39.0 APME 2.4 0.4 1.1 2.3 6.2 Right Management 3.8 2.6 2.9 4.7 14.0 Corporate Expenses & Amortization 4.4 - - - 4.4 Operating Profit 34.8 20.0 8.1 26.5 89.4 Net Earnings 25.3 14.4 6.2 19.4 65.3 EPS $0.32 $0.18 $0.08 $0.24 $0.82 *
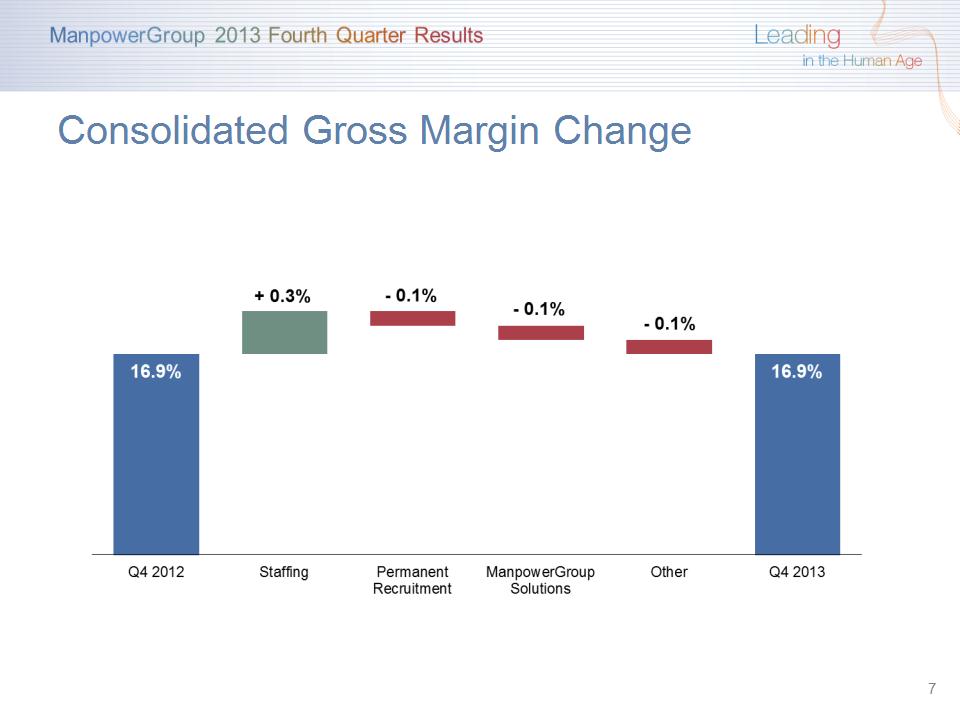
Consolidated Gross Margin Change *
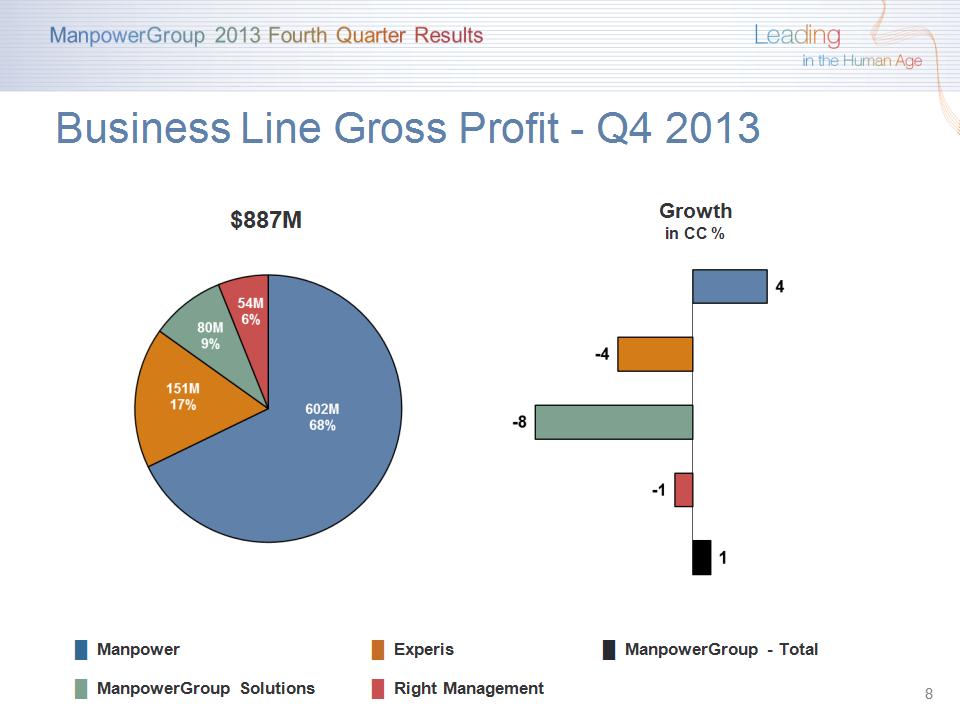
* $887M Growth in CC % Business Line Gross Profit – Q4 2013 █ Manpower █ Experis █ ManpowerGroup - Total █ ManpowerGroup Solutions █ Right Management
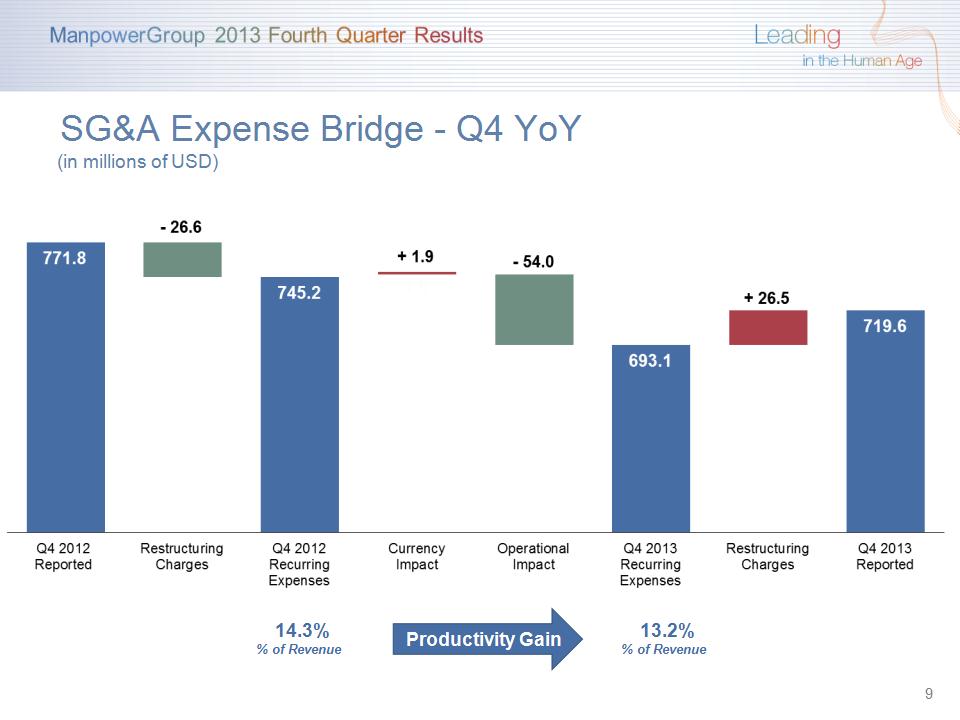
SG&A Expense Bridge – Q4 YoY (in millions of USD) * Productivity Gain 13.2% % of Revenue 14.3% % of Revenue
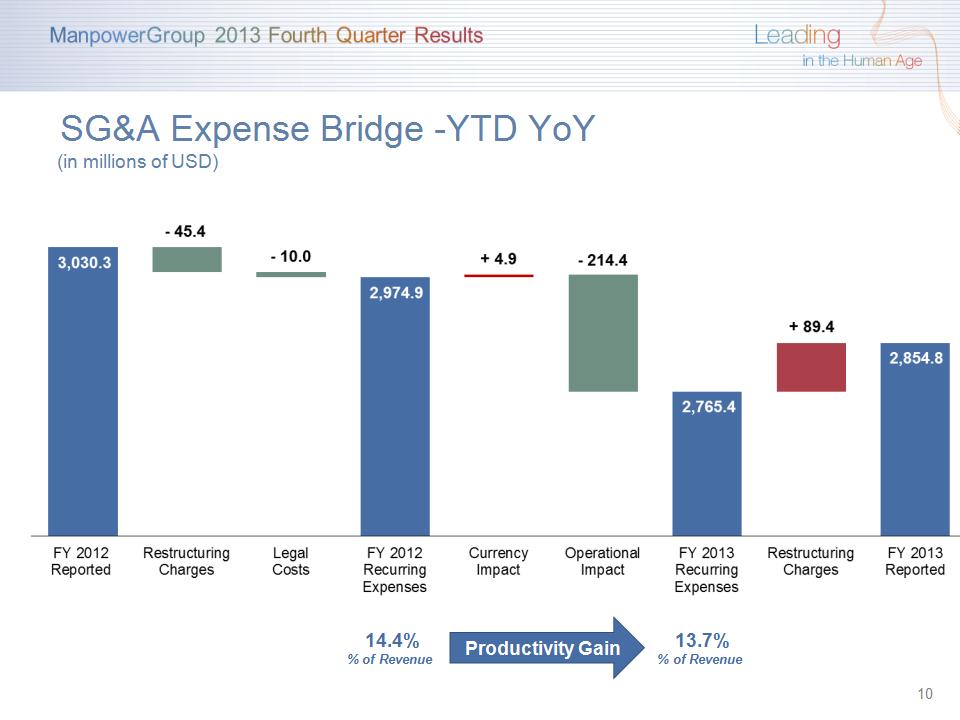
SG&A Expense Bridge –YTD YoY (in millions of USD) * Productivity Gain 13.7% % of Revenue 14.4% % of Revenue
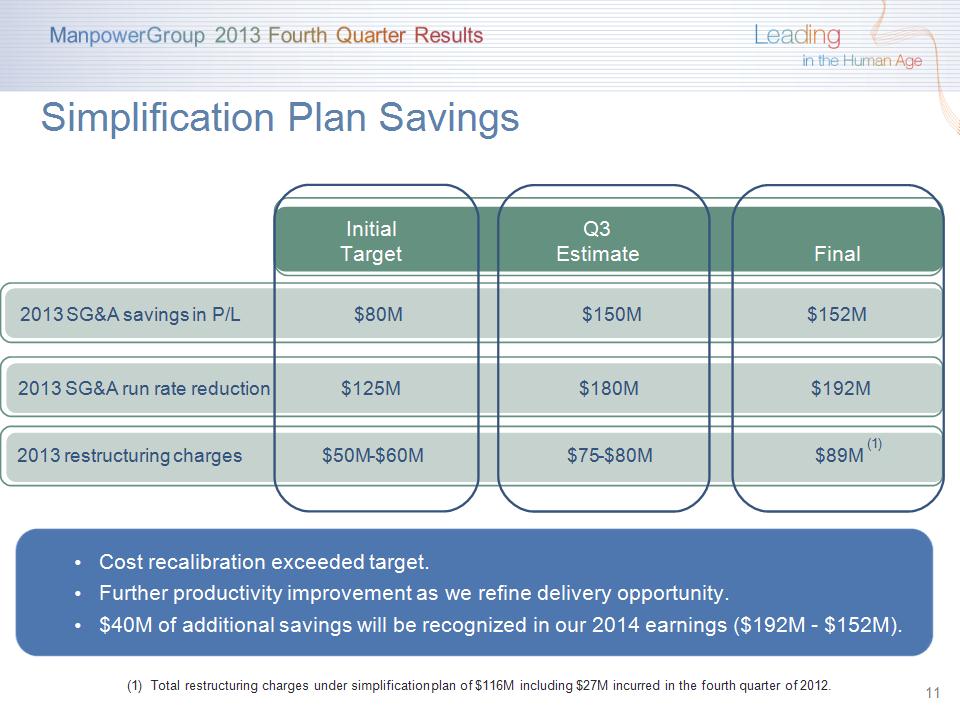
Simplification Plan Savings Cost recalibration exceeded target. Further productivity improvement as we refine delivery opportunity. $40M of additional savings will be recognized in our 2014 earnings ($192M - $152M). 2013 SG&A savings in P/L $80M $150M $152M 2013 SG&A run rate reduction $125M $180M $192M 2013 restructuring charges $50M-$60M $75-$80M $89M Initial Q3 Target Estimate Final (1) Total restructuring charges under simplification plan of $116M including $27M incurred in the fourth quarter of 2012. *
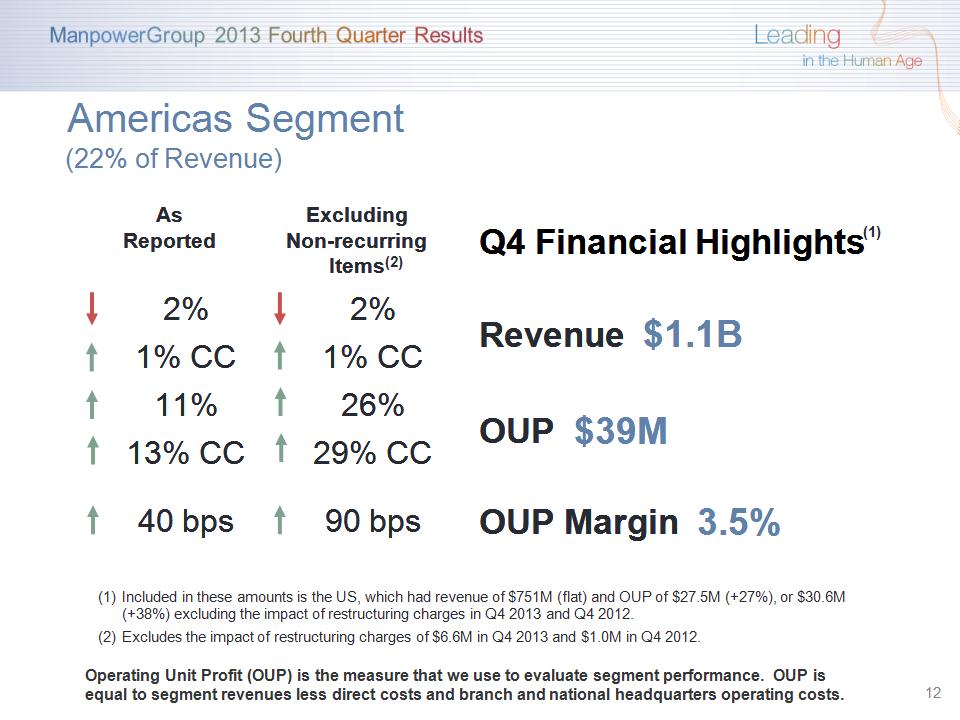
As Reported Excluding Non-recurring Items Q4 Financial Highlights 2% 2% Revenue $1.1B 1% CC 1% CC Revenue $1.1B 11% 26% OUP $39M 13% CC 29% CC OUP $39M 40 bps 90 bps OUP Margin 3.5% * (1) Americas Segment (22% of Revenue) Included in these amounts is the US, which had revenue of $751M (flat) and OUP of $27.5M (+27%), or $30.6M (+38%) excluding the impact of restructuring charges in Q4 2013 and Q4 2012. Excludes the impact of restructuring charges of $6.6M in Q4 2013 and $1.0M in Q4 2012. Operating Unit Profit (OUP) is the measure that we use to evaluate segment performance. OUP is equal to segment revenues less direct costs and branch and national headquarters operating costs. (2)
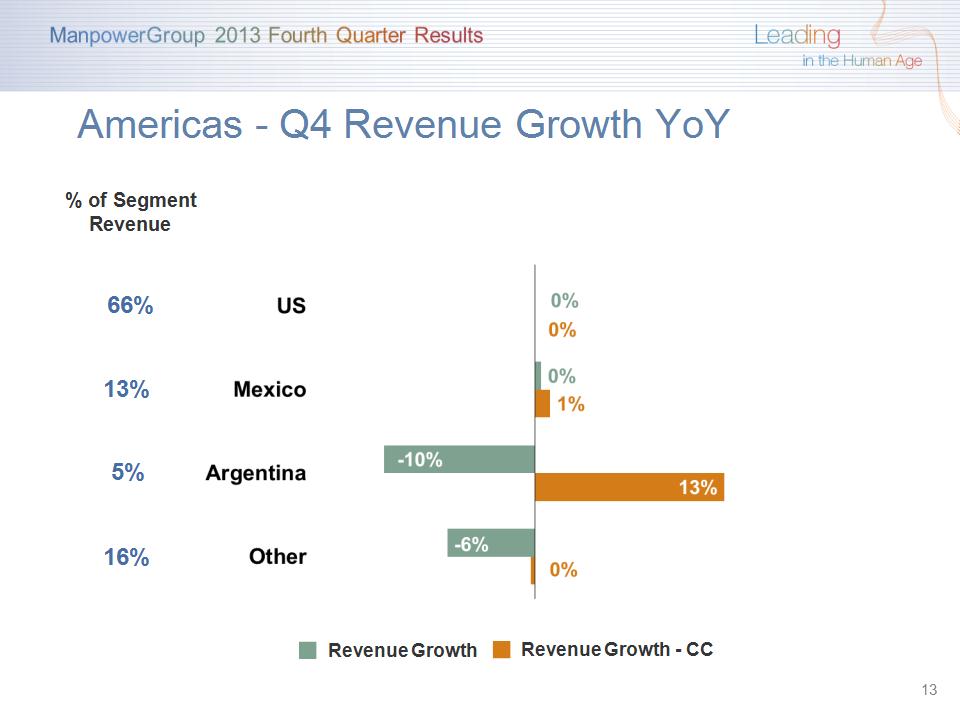
Americas – Q4 Revenue Growth YoY * Revenue Growth - CC Revenue Growth % of Segment Revenue 66% 13% 5% 16%
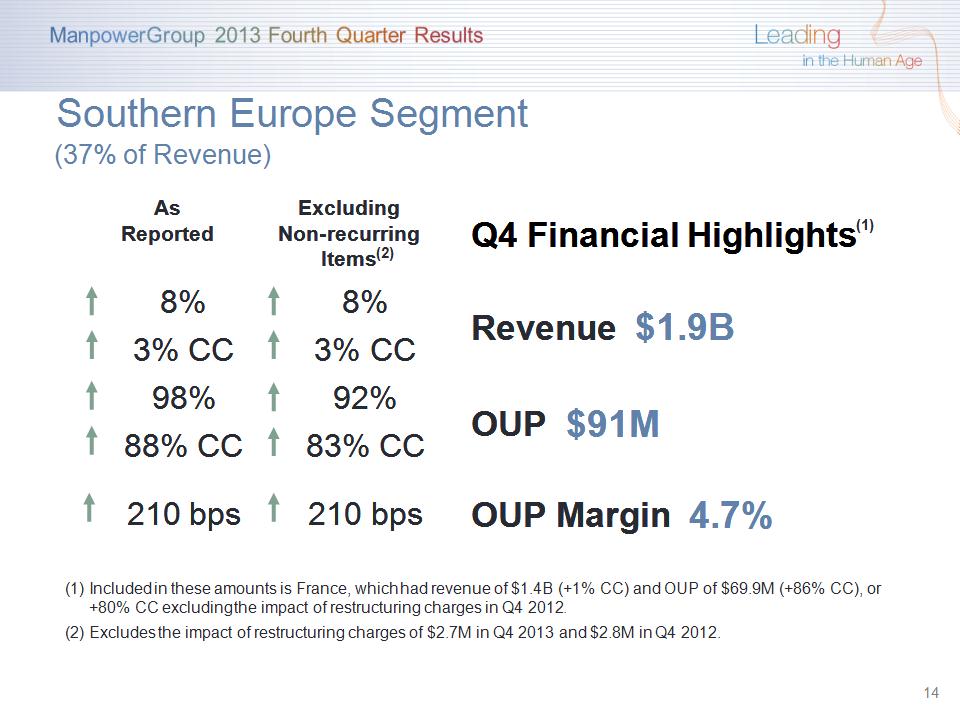
As Reported Excluding Non-recurring Items Q4 Financial Highlights 8% 8% Revenue $1.9B 3% CC 3% CC Revenue $1.9B 98% 92% OUP $91M 88% CC 83% CC OUP $91M 210 bps 210 bps OUP Margin 4.7% * (1) Southern Europe Segment (37% of Revenue) Included in these amounts is France, which had revenue of $1.4B (+1% CC) and OUP of $69.9M (+86% CC), or +80% CC excluding the impact of restructuring charges in Q4 2012. Excludes the impact of restructuring charges of $2.7M in Q4 2013 and $2.8M in Q4 2012. (2)
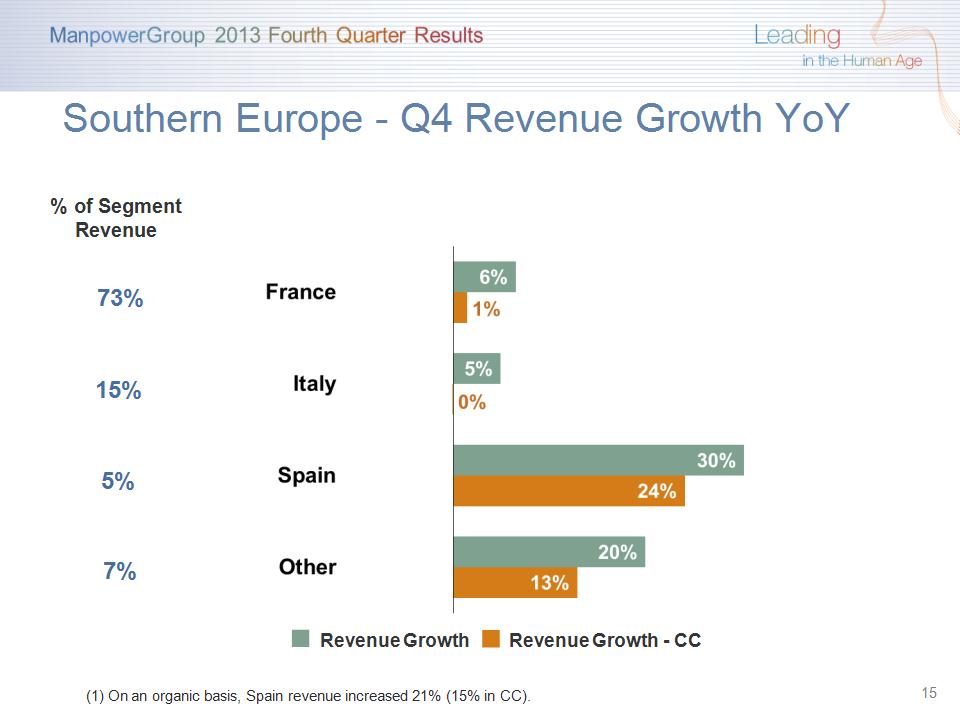
Southern Europe – Q4 Revenue Growth YoY * Revenue Growth - CC Revenue Growth % of Segment Revenue 73% 15% 5% 7% (1) On an organic basis, Spain revenue increased 21% (15% in CC).
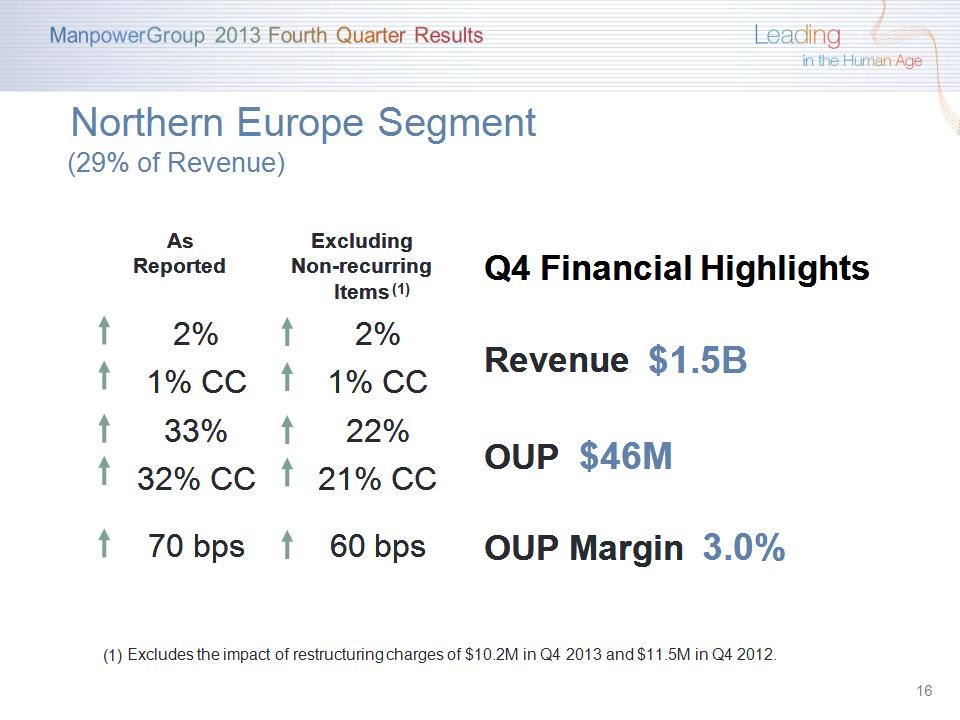
As Reported Excluding Non-recurring Items Q4 Financial Highlights 2% 2% Revenue $1.5B 1% CC 1% CC Revenue $1.5B 33% 22% OUP $46M 32% CC 21% CC OUP $46M 70 bps 60 bps OUP Margin 3.0% * Northern Europe Segment (29% of Revenue) (1) Excludes the impact of restructuring charges of $10.2M in Q4 2013 and $11.5M in Q4 2012.
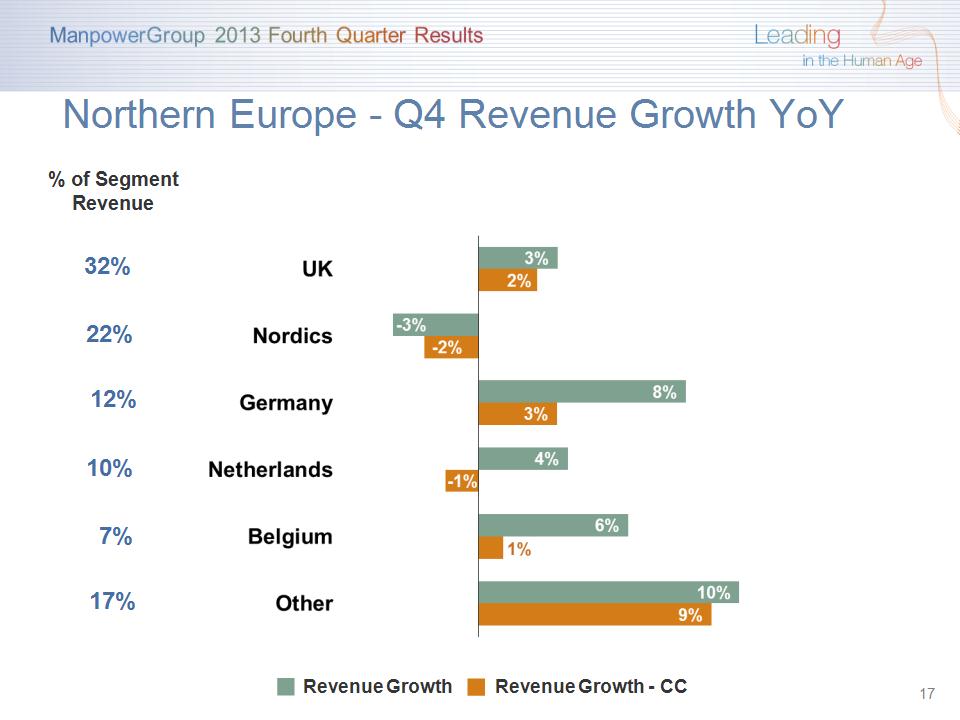
Northern Europe – Q4 Revenue Growth YoY * Revenue Growth - CC Revenue Growth % of Segment Revenue 32% 22% 12% 10% 17% 7%
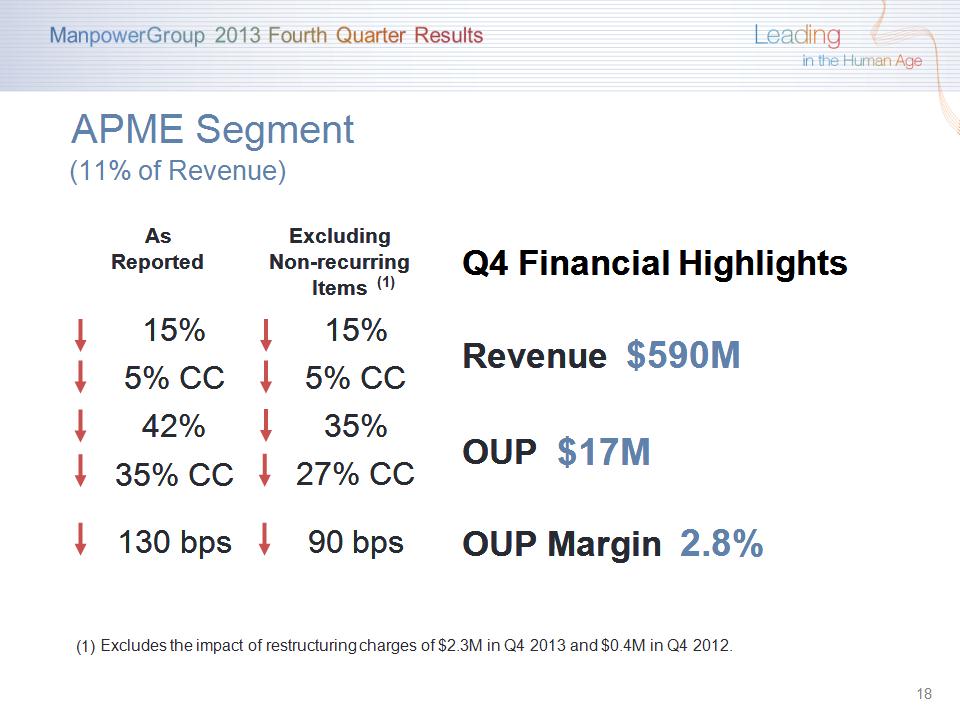
As Reported Excluding Non-recurring Items Q4 Financial Highlights 15% 15% Revenue $590M 5% CC 5% CC Revenue $590M 42% 35% OUP $17M 35% CC 27% CC OUP $17M 130 bps 90 bps OUP Margin 2.8% APME Segment (11% of Revenue) * (1) Excludes the impact of restructuring charges of $2.3M in Q4 2013 and $0.4M in Q4 2012.
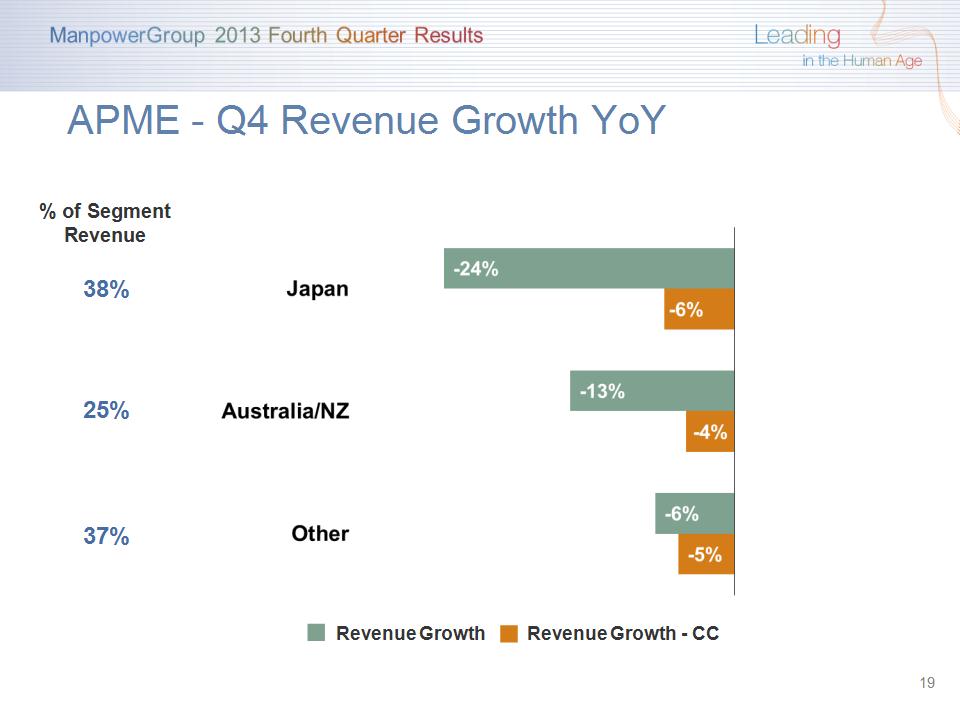
APME – Q4 Revenue Growth YoY * Revenue Growth - CC Revenue Growth % of Segment Revenue 38% 25% 37%
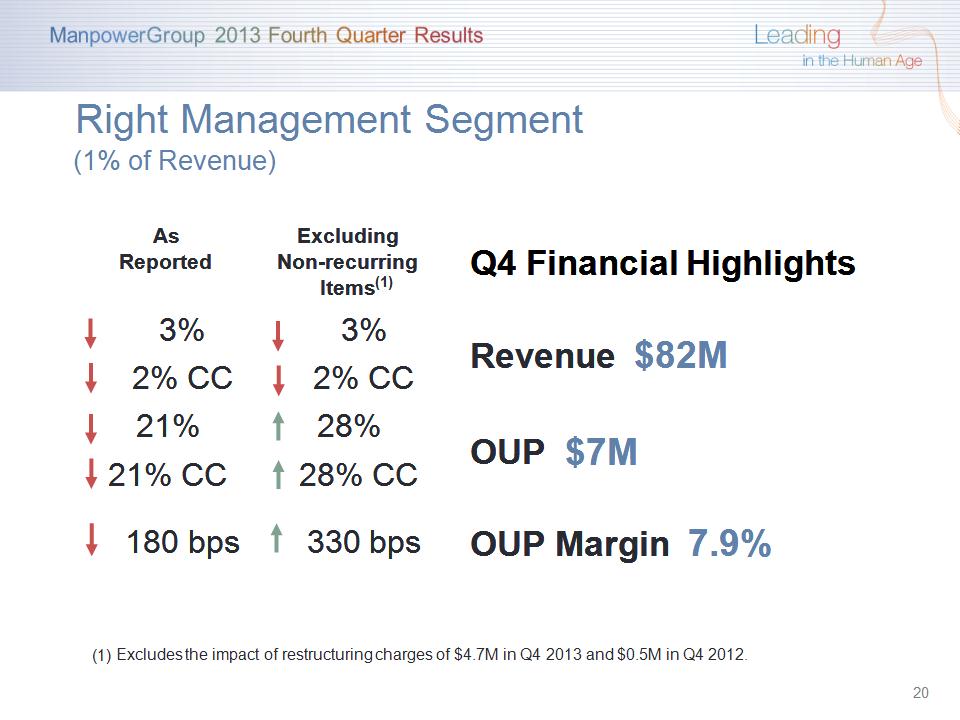
* Right Management Segment (1% of Revenue) As Reported Excluding Non-recurring Items Q4 Financial Highlights 3% 3% Revenue $82M 2% CC 2% CC Revenue $82M 21% 28% OUP $7M 21% CC 28% CC OUP $7M 180 bps 330 bps OUP Margin 7.9% (1) Excludes the impact of restructuring charges of $4.7M in Q4 2013 and $0.5M in Q4 2012.
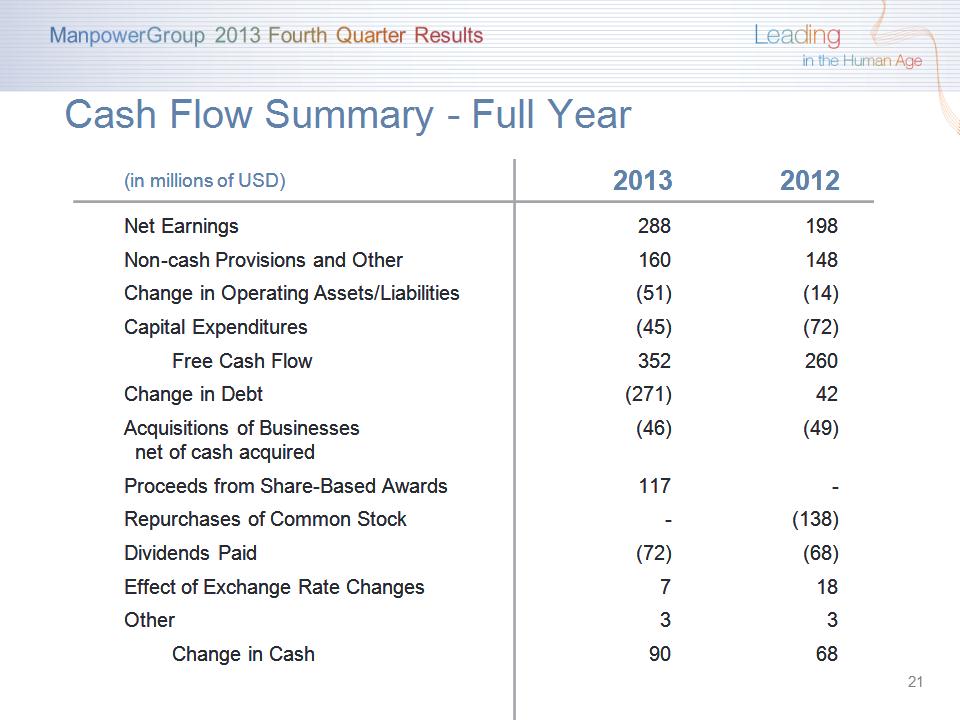
(in millions of USD) 2013 2012 Net Earnings 288 198 Non-cash Provisions and Other 160 148 Change in Operating Assets/Liabilities (51) (14) Capital Expenditures (45) (72) Free Cash Flow 352 260 Change in Debt (271) 42 Acquisitions of Businesses net of cash acquired (46) (49) Proceeds from Share-Based Awards 117 - Repurchases of Common Stock - (138) Dividends Paid (72) (68) Effect of Exchange Rate Changes 7 18 Other 3 3 Change in Cash 90 68 Cash Flow Summary – Full Year *
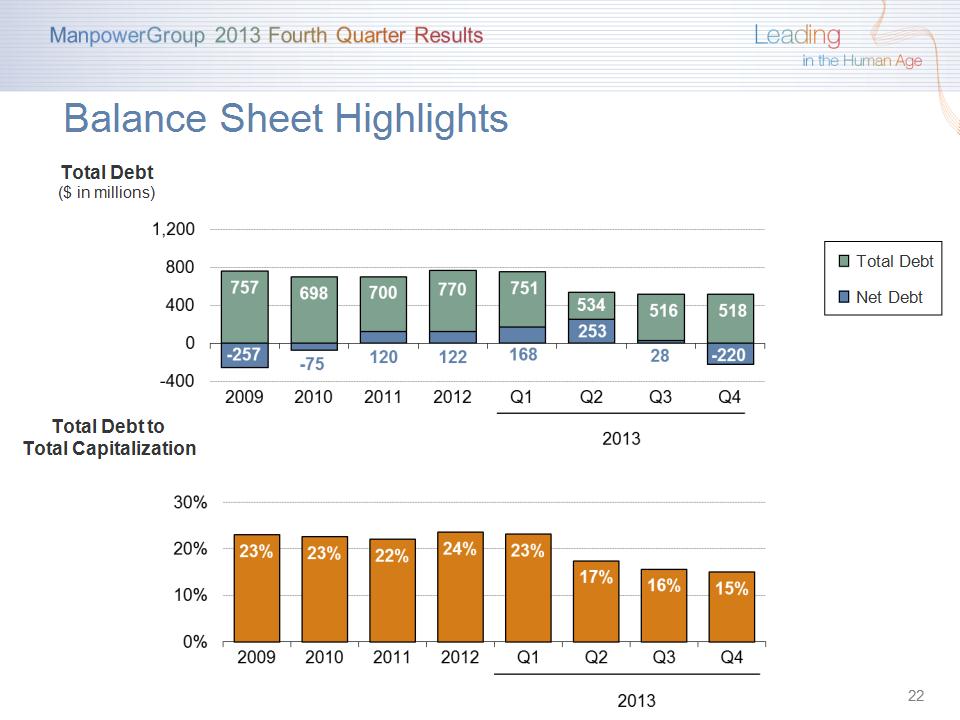
Balance Sheet Highlights * Total Debt ($ in millions) Total Debt to Total Capitalization Total Debt Net Debt
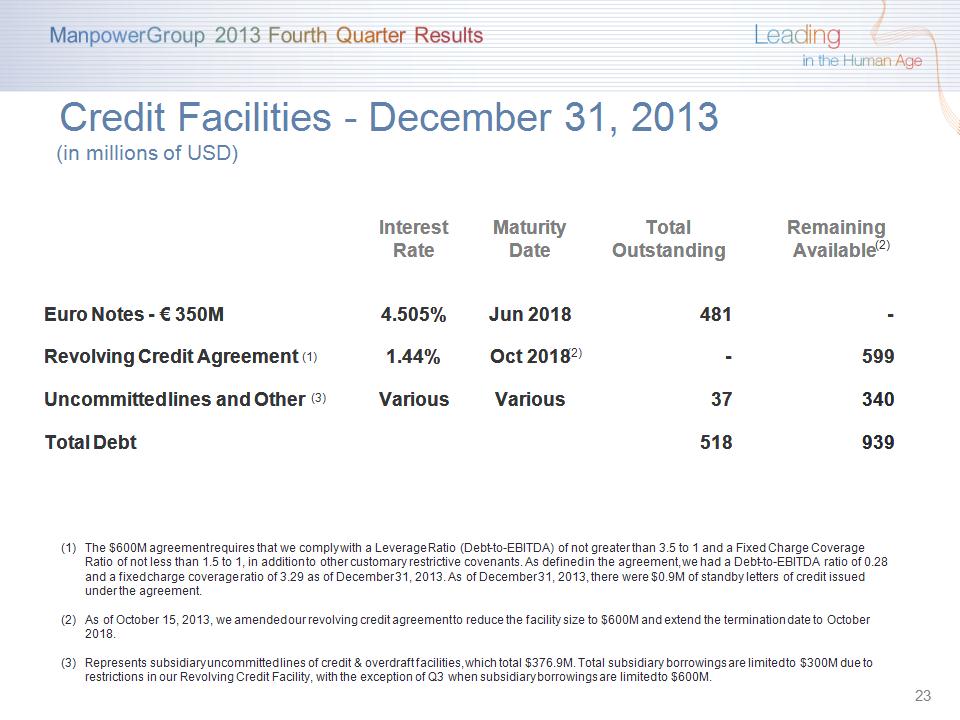
Interest Rate Maturity Date Total Outstanding Remaining Available Euro Notes - € 350M 4.505% Jun 2018 481 - Revolving Credit Agreement 1.44% Oct 2018 - 599 Uncommitted lines and Other Various Various 37 340 Total Debt 518 939 Credit Facilities – December 31, 2013 (in millions of USD) * (1) (3) The $600M agreement requires that we comply with a Leverage Ratio (Debt-to-EBITDA) of not greater than 3.5 to 1 and a Fixed Charge Coverage Ratio of not less than 1.5 to 1, in addition to other customary restrictive covenants. As defined in the agreement, we had a Debt-to-EBITDA ratio of 0.28 and a fixed charge coverage ratio of 3.29 as of December 31, 2013. As of December 31, 2013, there were $0.9M of standby letters of credit issued under the agreement. As of October 15, 2013, we amended our revolving credit agreement to reduce the facility size to $600M and extend the termination date to October 2018. Represents subsidiary uncommitted lines of credit & overdraft facilities, which total $376.9M. Total subsidiary borrowings are limited to $300M due to restrictions in our Revolving Credit Facility, with the exception of Q3 when subsidiary borrowings are limited to $600M. (2) (2)
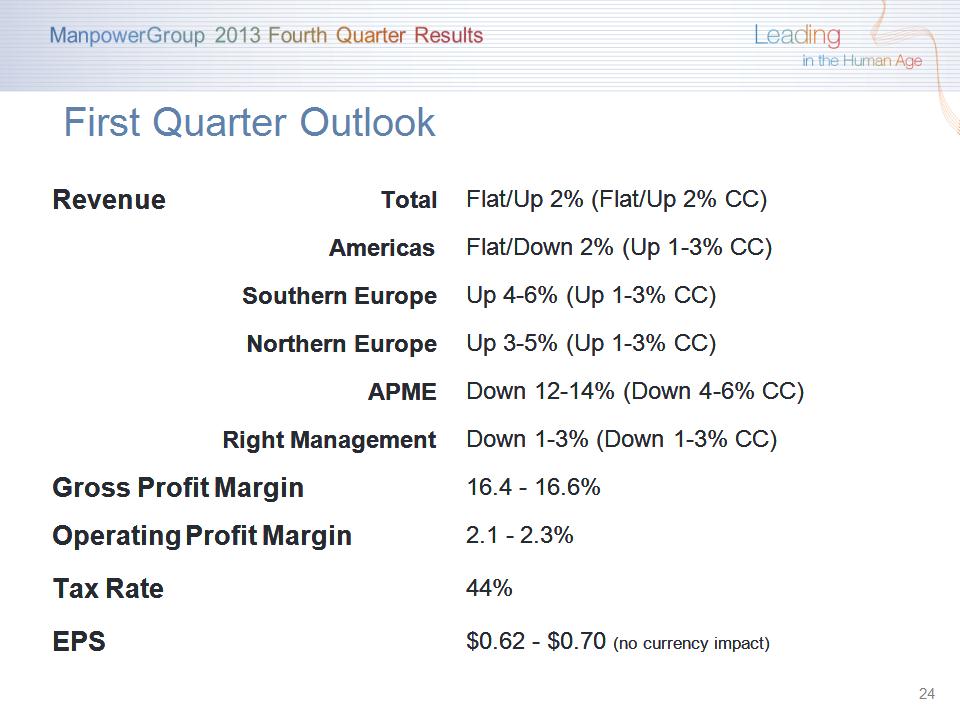
Revenue Total Flat/Up 2% (Flat/Up 2% CC) Americas Flat/Down 2% (Up 1-3% CC) Southern Europe Up 4-6% (Up 1-3% CC) Northern Europe Up 3-5% (Up 1-3% CC) APME Down 12-14% (Down 4-6% CC) Right Management Right Management Down 1-3% (Down 1-3% CC) Gross Profit Margin Gross Profit Margin 16.4 – 16.6% Operating Profit Margin Operating Profit Margin 2.1 – 2.3% Tax Rate Tax Rate 44% EPS EPS $0.62 – $0.70 (no currency impact) First Quarter Outlook *
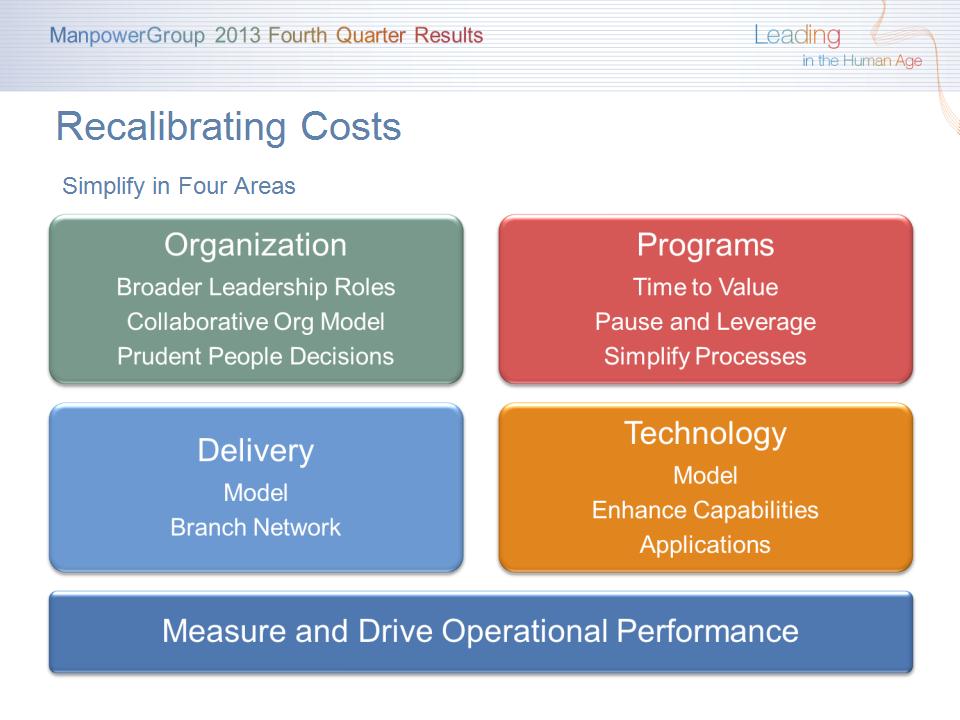
Recalibrating Costs Simplify in Four Areas

Questions *