Attached files
| file | filename |
|---|---|
| 8-K - 8-K - DOVER Corp | a201401308-k.htm |
| EX-99.1 - EX - 99.1 - DOVER Corp | a201401308-kexhibit991.htm |

Fourth Quarter 2013 Earnings Conference Call January 30, 2014 - 9:00am CT

Forward Looking Statements and Pro Forma Information We want to remind everyone that our comments may contain forward-looking statements that are inherently subject to uncertainties. We caution everyone to be guided in their analysis of Dover by referring to our Forms 10-K and 10-Q for a list of factors that could cause our results to differ from those anticipated in any such forward-looking statements. This presentation contains pro forma financial information that reflects the operations of Knowles as a discontinued operation. Upon completion of the spin, Knowles' results will be reclassified to discontinued operations for reporting purposes in accordance with GAAP. The unaudited pro forma consolidated financial information is presented for informational purposes only and is subject to a number of estimates, assumptions and uncertainties and does not purport to represent what our results of operations would have been if the spin-off of Knowles Corporation had occurred as of the dates indicated, what such results will be for any future periods, or what the historical results of Dover will be upon classifying Knowles as a discontinued operation as of the effective date of the spin-off of Knowles. We would also direct your attention to our internet site, www.dovercorporation.com, where considerably more information can be found. 2

$0.80 $1.00 $1.20 $1.40 $1.60 Q1* Q2 Q3* Q4* Q1* Q2* Q3* Q4* Q4 2013 Performance Adjusted Continuing Earnings Per Share* • Broad-based organic revenue growth, with strong results in the refrigeration, food equipment, fast moving consumer goods, fluids, drilling, downstream and consumer electronics markets • North America markets were solid; Europe markets grew over 10%; China remained strong • Segment margin of 16.5% in-line with last year, led by 23.1% in Energy •Bookings growth of 9% is broad-based, with growth in all segments • Overall book-to-bill of 0.98 Q4 Q4/Q4 * Excludes discrete & other tax benefits of -$0.01 in Q1 2012, $0.02 in Q3 2012, $0.07 in Q4 2012, $0.02 in Q1 2013 , $0.36 in Q2 2013, $0.03 in Q3 2013 and $0.03 in Q4 2013; includes spin off costs of $0.02 in Q2 2013, $0.06 in Q3 2013, and $0.09 in Q4 2013: includes other one-time gains of $0.02 in Q3 2013 (a) See Press Release filed under Form 8-K for free cash flow reconciliation 3 Quarterly Comments 2012 FY $4.44 2013 Revenue $2.2B 10% $8.7B 8% EPS (cont.) $1.22 5% $5.57 23% Bookings $2.2B 9% $8.7B 8% Seg. Margins 16.5% -10 bps 17.4% 20 bps Organic Rev. 5% 3% Acq. Growth 5% 5% FCF (a) $376M -22% $942M -2% FY FY/FY FY $5.28

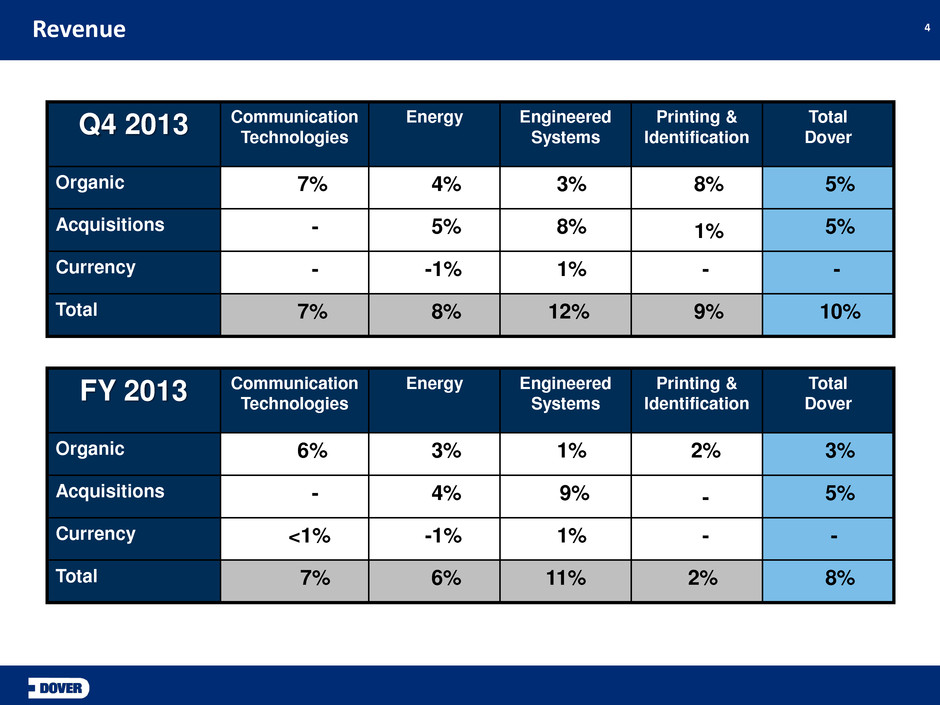
4 Revenue Q4 2013 Communication Technologies Energy Engineered Systems Printing & Identification Total Dover Organic 7% 4% 3% 8% 5% Acquisitions - 5% 8% 1% 5% Currency - -1% 1% - - Total 7% 8% 12% 9% 10% FY 2013 Communication Technologies Energy Engineered Systems Printing & Identification Total Dover Organic 6% 3% 1% 2% 3% Acquisitions - 4% 9% - 5% Currency <1% -1% 1% - - Total 7% 6% 11% 2% 8%

$778 $677 $257 $277 $414 $428 $577 $584 $227 $244 $0 $350 $700 $1,050 DCT Q3 DCT Q4 DE Q3 DE Q4 DES Q3 DES Q4 DPI Q3 DPI Q4 $662 $702 $256 $271 $424 $373 $595 $571 $222 $248 $0 $350 $700 $1,050 DCT Q3 DCT Q4 DE Q3 DE Q4 DES Q3 DES Q4 DPI Q3 DPI Q4 Sequential Results – Q3 13 → Q4 13 Fluid Solutions ↑ 4% ↑ 1% Refrigeration & Industrial ↓ 12% ↓ 4% ↑ 7% ↑ 6% $ in millions 5 Bookings ↓8% ↑ 8% Revenue

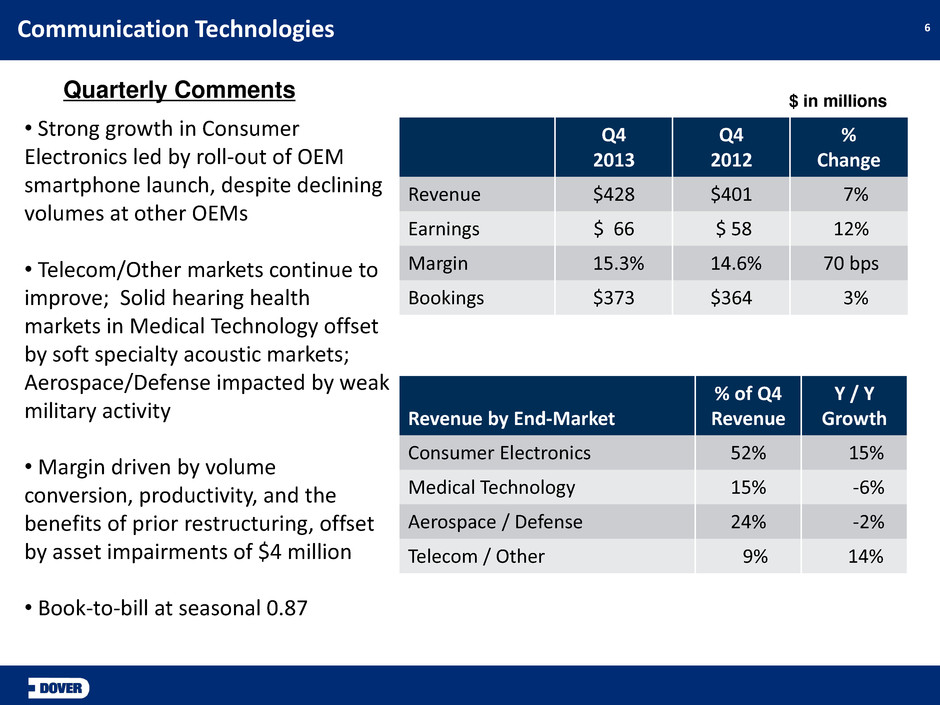
6 Communication Technologies • Strong growth in Consumer Electronics led by roll-out of OEM smartphone launch, despite declining volumes at other OEMs • Telecom/Other markets continue to improve; Solid hearing health markets in Medical Technology offset by soft specialty acoustic markets; Aerospace/Defense impacted by weak military activity • Margin driven by volume conversion, productivity, and the benefits of prior restructuring, offset by asset impairments of $4 million • Book-to-bill at seasonal 0.87 $ in millions Q4 2013 Q4 2012 % Change Revenue $428 $401 7% Earnings $ 66 $ 58 12% Margin 15.3% 14.6% 70 bps Bookings $373 $364 3% Quarterly Comments Revenue by End-Market % of Q4 Revenue Y / Y Growth Consumer Electronics 52% 15% Medical Technology 15% -6% Aerospace / Defense 24% -2% Telecom / Other 9% 14%

7 Energy • Strong drilling and downstream growth • International markets remain robust in production, offsetting weak winch markets and softer U.S. sucker rod markets • Margin in-line with expectations, costs associated with recent acquisitions had 150 basis point impact • Bookings growth is particularly strong in the drilling and downstream end-markets • Book-to-bill at 0.98 $ in millions Quarterly Comments Q4 2013 Q4 2012 % Change Revenue $584 $540 8% Earnings $135 $134 1% Margin 23.1% 24.7% -160 bps Bookings $571 $550 4% Revenue by End-Market % of Q4 Revenue Y / Y Growth Drilling 18% 13% Production 52% 1% Downstream 30% 20%

8 Engineered Systems • Revenue driven by recent acquisitions and strong results in refrigeration & food equipment, fluids and the auto-aftermarket • Within refrigeration, regional activity improves • Strong plastics and petro- chemical markets aiding Fluids • Margin performance reflects continued strong execution • Bookings growth reflects acquisitions and strong fluids and auto-aftermarket activity • Book-to-bill at 1.03 $ in millions Quarterly Comments Q4 2013 Q4 2012 % Change Revenue $920 $819 12% Earnings $ 121 $102 19% Margin 13.2% 12.4% 80 bps Bookings $950 $816 16% Revenue by End-Market % of Q4 Revenue Y / Y Growth Fluids 27% 18% Refrigeration & Food Equipment 40% 18% Industrial 33% 3%

Printing & Identification • Broad-based growth in both fast moving consumer goods and industrial end-markets • Strong growth in Europe, across all product categories. • Project-related shipments increase. • Operating margin impacted by costs associated with completion of restructuring plan and deal costs • Bookings growth is broad-based • Book-to-bill at 0.98 $ in millions Quarterly Comments Q4 2013 Q4 2012 % Change Revenue $277 $254 9% Earnings $ 44 $ 41 8% Margin 15.9% 16.0% -10 bps Bookings $271 $253 7% 9 Revenue by End-Market % of Q4 Revenue Y / Y Growth Fast Moving Consumer Goods 61% 10% Industrial 39% 7%

Q4 2013 Overview Q4 2013 Net Interest Expense $30 million, down $1 million from last year and in- line with expectations Corporate Expense $45 million, up $14 million from last year, reflecting Q4 spin off costs of $16 million. Effective Tax Rate (ETR) Q4 normalized rate was 29.4%, excluding $0.03 cents of discrete tax benefits, reflecting a slightly unfavorable mix of geographic earnings(a) Capex $79 million, slightly below expectations Share Repurchases Repurchased 551K shares ($50M) in quarter under the $1 billion program. Completed 71% of $1 billion program by year-end. 10 (a) See press release filed under form 8-K for reconciliation

Selected Pro Forma Financials for Dover (Un-audited) 11 Revenue $ 6,994 $ 7,521 Operating Earnings (a) 1,113 1,215 Net Interest 121 121 Income Taxes 298 268 Earnings from Con’t Ops. $ 686 $ 832 Diluted Continuing EPS $ 3.73 $ 4.79 Adjusted Diluted Continuing EP S(b) $ 3.64 $ 4.31 Organic revenue growth 5% - 4% 2% Acquisition revenue growth 4% 6% 5% 6% Total revenue growth 9% 6% 9% 8% 2012 2013 For full year ended December 31, (b): Excludes discrete tax benefits of $0.09 EPS in 2012; discrete tax benefits of $0.46, other one-time gains of $0.02 in 2013 Note: Refer to slide 2 for pro forma disclosure. (a): Includes corporate expense of $135M in 2012 and $130M in 2013 1H FY 2H FY 18% Growth

FY 2014 Guidance – Pro Forma Revenue: • Organic revenue : ≈ 3% - 4% • Completed Acquisitions: ≈ 2% • Total revenue: ≈ 5% - 6% Corporate expense: ≈ $123 million* Interest expense: ≈ $133 million Full-Year Tax Rate: ≈ 31.0% Capital expenditures: ≈ 2.5% of revenue FCF for full year: ≈ 11% of revenue 12 Note: Refer to slide 2 for pro forma disclosure. * Excludes remaining costs to complete spin-off of Knowles

2013 Pro Forma EPS – Continuing Ops (post-spin basis) $4.79 • Less 2013 tax benefits (1): ($0.46) • Less 2013 one-time items (2): ($0.02) 2013 Pro Forma Adjusted EPS – Continuing Ops (post-spin) $4.31 • Volume, mix, price (inc. FX): $0.21 - $0.33 • Net benefits of productivity: $0.16 - $0.21 • Acquisitions: $0.06 - $0.07 • Investment / Compensation: ($0.15 - $0.20) • Corporate expenses: $0.03 - $0.04 • Interest / Shares / Tax Rate (net): ($0.02) - $0.04 2014 Pro Forma EPS – Continuing Ops $4.60 - $4.80 2014 EPS Guidance Bridge - Cont. Ops (Pro Forma) (1) $0.02 in Q1 2013, $0.38 in Q2 2013, $0.03 in Q3 2013, and $0.03 in Q4 2013 13 (2) $0.02 in Q3 2013 Note: Refer to slide 2 for pro forma disclosure. 9% Growth at mid-point

Appendix – Reconciliations 14 EPS – Continuing Ops $1.22 $5.57 • Discrete tax items: ($0.03) ($0.44) • Knowles spin-off costs: $0.09 $0.17 • Other one-time gains: - ($0.02) Adjusted EPS – Continuing Ops $1.28 $5.28 Q4 2013 FY 2013 ADJUSTED EPS FROM CONTINUING OPERATIONS Note: Per share data may not add due to rounding
