Attached files
| file | filename |
|---|---|
| 8-K - FORM 8-K - UMB FINANCIAL CORP | d665194d8k.htm |
| EX-3.(II).1 - EX-3.(II).1 - UMB FINANCIAL CORP | d665194dex3ii1.htm |
| EX-99.1 - EX-99.1 - UMB FINANCIAL CORP | d665194dex991.htm |
| EX-3.(II).2 - EX-3.(II).2 - UMB FINANCIAL CORP | d665194dex3ii2.htm |
 Fourth Quarter 2013
January 28, 2014
UMB Financial
Exhibit 99.2 |
 Cautionary Notice about Forward-Looking Statements
2
This
presentation
contains,
and
our
other
communications
may
contain,
forward-looking
statements
within
the
meaning
of
the
Private
Securities
Litigation
Reform
Act
of
1995.
These
statements
can
be
identified
by
the
fact
that
they
do
not
relate
strictly
to
historical
or
current
facts.
All
forward-looking
statements
are
subject
to
assumptions,
risks,
and
uncertainties,
which
may
change
over
time
and
many
of
which
are
beyond
our
control.
You
should
not
rely
on
any
forward-looking
statement
as
a
prediction
or
guarantee
about
the
future.
Our
actual
future
objectives,
strategies,
plans,
prospects,
performance,
condition,
or
results
may
differ
materially
from
those
set
forth
in
any
forward-looking
statement.
Some
of
the
factors
that
may
cause
actual
results
or
other
future
events,
circumstances,
or
aspirations
to
differ
from
those
in
forward-looking
statements
are
described
in
our
Annual
Report
on
Form
10-K
for
the
year
ended
December
31,
2012,
our
subsequent
Quarterly
Reports
on
Form
10-Q
or
Current
Reports
on
Form
8-K,
or
other
applicable
documents
that
are
filed
or
furnished
with
the
Securities
and
Exchange
Commission
(SEC).
Any
forward-looking
statement
made
by
us
or
on
our
behalf
speaks
only
as
of
the
date
that
it
was
made.
We
do
not
undertake
to
update
any
forward-
looking
statement
to
reflect
the
impact
of
events,
circumstances,
or
results
that
arise
after
the
date
that
the
statement
was
made.
You,
however,
should
consult
further
disclosures
(including
disclosures
of
a
forward-looking
nature)
that
we
may
make
in
any
subsequent
Quarterly
Report
on
Form
10-Q,
Current
Report
on
Form
8-K,
or
other
applicable
document
that
is
filed
or
furnished
with
the
SEC. |
 Business Segment Metrics |
 A
B
C
E
AUM increased 32.4% year-
over-year to $31.2 billion
Net inflows of $941.9 million
for Q4’13; year-to-date flows
of $5.3 billion
Institutional Investment Management
4
th
Quarter 2013
Highlights
4
$23.5
$25.7
$26.3
$29.3
$31.2
4Q'12
1Q'13
2Q'13
3Q'13
4Q'13
Total Scout Assets Under Management
($ billions)
Institutional Investment Management Operating Results
% Change
% Change
2013
2012
2013
2012
Net Interest income
(10)
-
NA
(32)
2
-1700.0%
Noninterest income
34,893
25,511
36.8%
126,442
100,051
26.4%
Noninterest expense
29,583
20,137
46.9%
88,336
70,981
24.5%
NI before taxes
5,300
5,374
-1.4%
38,074
29,072
31.0%
Income tax expense
1,127
1,204
-6.4%
10,011
8,118
23.3%
Net income
4,173
4,170
0.1%
28,063
20,954
33.9%
pre-tax profit margin
15.2%
21.1%
30.1%
29.1%
3 mos Ended
December 31,
Year Ended
December 31, |
 AUM Drivers
($millions)
$2,204.5
$932.7
Total Change
($millions)
$25,746.8
$23,542.3
Total AUM
($millions)
$567.3
$26,314.1
Institutional Investment Management
5
$2,994.8
$29,308.9
$1,858.5
$31,167.4 |
 Total
AUM $19.7B
$23.5B
$25.7B
$26.3B
Institutional Investment Management
6
$29.3B
$31.2B |
 25.3%
21.4%
6.4%
13.4%
28.7%
1.8%
0.1%
2.9%
68.7%
26.6%
2.6%
1.9%
0.2%
AUM by Strategy –
As of 4Q’13
Fixed Income Strategies
Equity Strategies
International
Mid Cap
International ADR
Emerging Markets
Global
Small Cap
Other:
7
Core Plus
Low Duration
Long Duration
Core
Intermediate
Unconstrained
Global Aggregate
Real Return
49%
51%
Equity
Fixed Income |
 25.3%
21.4%
6.5%
13.4%
28.7%
1.8%
0.1%
2.9%
36.6%
24.6%
16.8%
14.1%
5.5%
2.2%
0.2%
Fixed Income Rotation
Fixed Income AUM
Strategy Mix
4Q’13
4Q’12
8
Core Plus
Low Duration
Long Duration
Core
Intermediate
Unconstrained
Global Aggregate
Real Return |
 Asset Servicing
A
B
Total AUA increased by 22.4% to
$191.0 billion year-over-year
In the past 12 months, fund
accounting and administration
AUA grew by 42.9%; 40 new
funds added
4
th
Quarter 2013 Highlights
9
$162.4
$179.3
$206.4
$156.0
$191.0
2009
2010
2011
2012
2013
Assets Under Administration
($billions)
Asset Servicing Operating Results
% Change
% Change
2013
2012
2013
2012
Net interest income
545
534
2.1%
2,357
1,861
26.7%
Noninterest income
20,572
18,362
12.0%
80,633
75,589
6.7%
Noninterest expense
18,583
17,274
7.6%
72,731
68,793
5.7%
NI before taxes
2,534
1,622
56.2%
10,259
8,657
18.5%
Income tax expense
1,129
491
129.9%
4,184
3,382
23.7%
Net income
1,405
1,131
24.2%
6,075
5,275
15.2%
pre-tax profit margin
12.0%
8.6%
12.4%
11.2%
December 31,
3 mos Ended
Year Ended
December 31, |
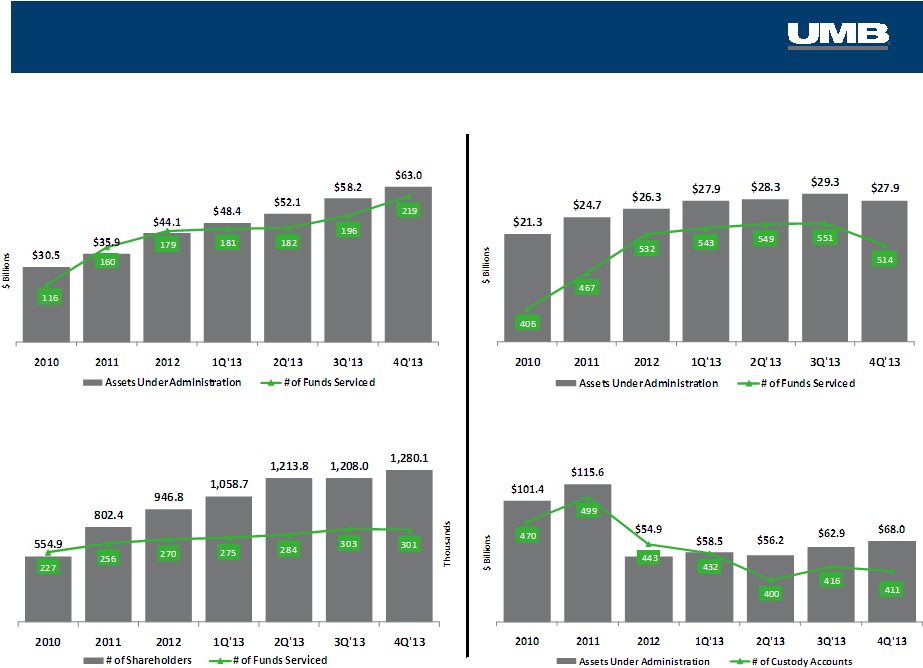 Asset Servicing
Fund Accounting & Administration
Alternative Asset Servicing
Custody
Transfer Agency
Business Metrics
10 |
 Payment Solutions
Total Card Purchase Volume
& Interchange Revenue
CAGR
B
Commercial credit card
purchase volume +5.1% year-
over-year to $314.9 million;
provided 45.7% of interchange
Interchange revenue +1.6%
year-over-year to $15.9 million
4
th
Quarter 2013 Highlights
11
Payment Solutions Operating Results
% Change
% Change
2013
2012
2013
2012
Net interest income
11,505
11,227
2.5%
45,832
43,350
5.7%
Provision for loan losses
2,660
1,719
54.7%
12,388
8,233
50.5%
Noninterest income
17,737
17,601
0.8%
74,223
67,887
9.3%
Noninterest expense
23,121
19,866
16.4%
86,746
69,095
25.5%
NI before taxes
3,461
7,243
-52.2%
20,921
33,909
-38.3%
Income tax expense
1,271
1,833
-30.7%
6,732
9,555
-29.5%
Net income
2,190
5,410
-59.5%
14,189
24,354
-41.7%
pre-tax profit margin
11.8%
25.1%
17.4%
30.5%
December 31,
3 mos Ended
Year Ended
December 31, |
 Payment Solutions
Health Savings Accounts & Balances*
* Deposits and investment assets
A
B
Healthcare card purchase volume
+54.0% to $649.1 million vs. 4Q’12
Customer deposits and assets
+49.2% to $642.4 million vs. 4Q’12
4
th
Quarter 2013 Highlights
Healthcare Services
12
Card Utilization |
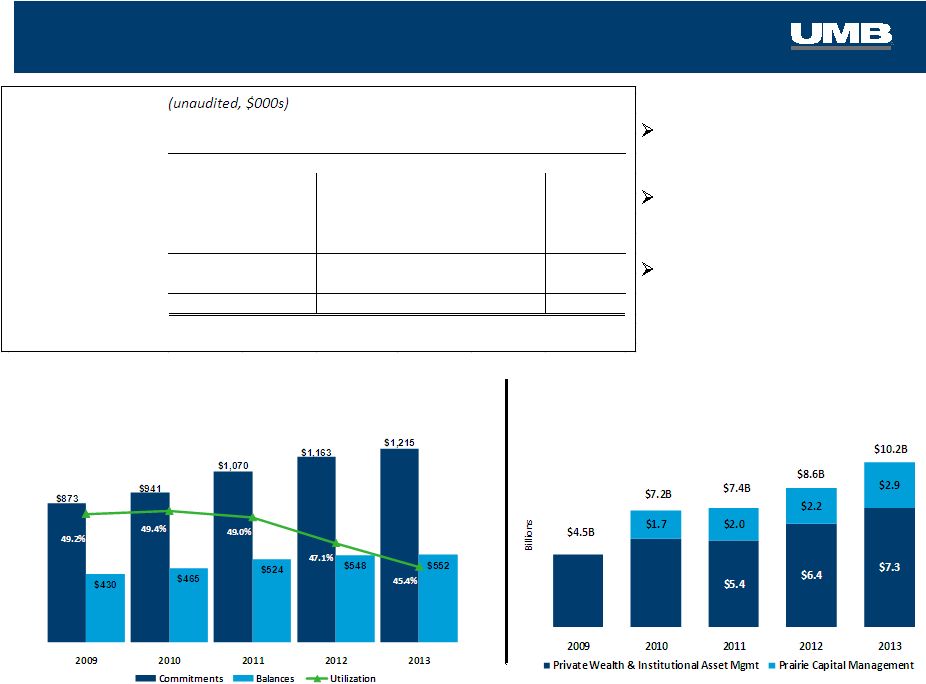 Bank
Assets Under Management
($ billions)
HELOC Lending
(average balances, $ millions)
A
B
C
Total net loans grew for the 15th
consecutive quarter, year-over-year,
increasing 14.8% to $6.4 billion
Private Banking reported $325.7 million
in average loan balances, an increase
of 36.0% over Q4 2012
Fourth quarter average Small Business
Banking loans increased 21.4% year-
over-year to $172.6 million
4
th
Quarter 2013 Highlights
Bank Operating Results
% Change
% Change
2013
2012
2013
2012
Net interest income
73,874
68,468
7.9%
285,112
274,843
3.7%
Provision for loan losses
1,340
2,281
-41.3%
5,112
9,267
-44.8%
Noninterest income
62,405
47,800
30.6%
210,535
214,595
-1.9%
Noninterest expense
99,139
100,682
-1.5%
376,365
381,585
-1.4%
NI before taxes
35,800
13,305
169.1%
114,170
98,586
15.8%
Income tax expense
8,905
2,956
201.3%
28,532
26,452
7.9%
Net income
26,895
10,349
159.9%
85,638
72,134
18.7%
pre-tax profit margin
26.3%
11.4%
23.0%
20.1%
3 mos Ended
December 31,
December 31,
Year Ended |
 46.8%
47.6%
45.2%
44.0%
41.1%
0%
50%
100%
4Q'09
4Q'10
4Q'11
4Q'12
4Q'13
KC
CO
STL
Greater MO
KS
OK
AZ
NE
TX
Bank
High Growth Regions
4Q’13 vs. 4Q’12
•
Arizona
+94.6%
Commercial Loans By Region
•
St. Louis
+40.3%
•
Oklahoma +36.4%
Commercial Loan Balances
(Average C&I and CRE Loan Balances for Three Months Ended December 31)
14 |
 Bank
Average Deposits
(Average deposits for the three months ended December 31)
4 yr
CAGR
4Q ‘09–’13
12.9%
Deposits By Region
15
53.6%
56.4%
57.8%
61.6%
66.2%
0%
50%
100%
4Q'09
4Q'10
4Q'11
4Q'12
4Q'13
KC
STL
CO
Gtr MO
KS
OK
AZ
NE
$7.1
$7.8
$8.8
$9.9
$11.1
29.1%
31.8%
33.4%
39.1%
42.5%
4Q'09
4Q'10
4Q'11
4Q'12
4Q'13
Interest Bearing
Non-Interest Bearing |
 Deposit Composition
16
Deposit Composition by Line of Business
At December 31, 2013
Actual
Pro-forma,
After deposit migration
Commercial
Consumer
Asset Servicing
Private Wealth Management
Healthcare
Inst. Banking & Investor Services
Small Business
Inst. Asset Management
35.1%
24.3%
17.8%
7.2%
6.6%
4.5%
4.3%
0.2%
39.4%
27.3%
7.8%
8.0%
7.4%
5.1%
4.7%
0.3% |
 Appendix |
    1.6%
18.6%
43.5%
29.6%
6.7%
Average 2013 Balance:
$7.0 billion
Average Yield:
1.97%
Investment Mix
Securities Available for Sale as of December 31, 2013
Mortgage-Backed Securities
Municipals
CDs & Corporates
Agencies
Treasuries
Investment Portfolio Statistics –
Securities Available for Sale
18
Roll off
Purchased
($ millions)
Yield
($ millions)
Yield
1Q13
$413
1.98%
$769
1.31%
2Q13
$340
2.13%
$815
1.41%
3Q13
$265
1.85%
$77
1.02%
4Q13
$308
2.04%
$355
0.64%
Scheduled Cash Flow
1Q14
$398
1.71%
Next 12 months
$1,068
1.94%
Securities Gains
($ thousands)
4Q12
210
$
1Q13
5,893
$
2Q13
1,519
$
3Q13
1,140
$
4Q13
(10)
$
Duration/Life
(in months)
at 12/31/2013
at 9/30/2013
Avg. Life Total
47.55
49.39
Duration Total
44.12
46.31 |