Attached files
| file | filename |
|---|---|
| EX-3.3 - EX-3.3 - TRINET GROUP, INC. | d572726dex33.htm |
| EX-23.2 - EX-23.2 - TRINET GROUP, INC. | d572726dex232.htm |
| EX-23.4 - EX-23.4 - TRINET GROUP, INC. | d572726dex234.htm |
| EX-23.3 - EX-23.3 - TRINET GROUP, INC. | d572726dex233.htm |
Table of Contents
As filed with the Securities and Exchange Commission on January 6, 2014
Registration No. 333-192465
UNITED STATES
SECURITIES AND EXCHANGE COMMISSION
Washington, D.C. 20549
Amendment No. 1
to
FORM S-1
REGISTRATION STATEMENT
UNDER
THE SECURITIES ACT OF 1933
TRINET GROUP, INC.
(Exact name of Registrant as specified in its charter)
| Delaware | 7389 | 95-3359658 | ||
| (State or other jurisdiction of incorporation or organization) |
(Primary Standard Industrial Classification Code Number) |
(I.R.S. Employer Identification Number) |
1100 San Leandro Blvd., Suite 400
San Leandro, CA 94577
(510) 352-5000
(Address, including zip code and telephone number, including area code, of Registrant’s principal executive offices)
Burton M. Goldfield
Chief Executive Officer
TriNet Group, Inc.
1100 San Leandro Blvd., Suite 400
San Leandro, CA 94577
(510) 352-5000
(Name, address, including zip code and telephone number, including area code, of agent for service)
Copies to:
| Jodie M. Bourdet Craig D. Jacoby Andrew S. Williamson Cooley LLP 101 California Street, 5th Floor San Francisco, California 94111 (415) 693-2000 |
Gregory L. Hammond Chief Legal Officer TriNet Group, Inc. 1100 San Leandro Blvd., Suite 400 San Leandro, CA 94577 (510) 352-5000 |
Gordon K. Davidson Daniel J. Winnike Fenwick & West LLP 801 California Street Mountain View, CA 94041 (650) 988-8500 |
Approximate date of commencement of proposed sale to the public: As soon as practicable after the effective date of this registration statement.
If any of the securities being registered on this Form are to be offered on a delayed or continuous basis pursuant to Rule 415 under the Securities Act, check the following box. ¨
If this Form is filed to register additional securities for an offering pursuant to Rule 462(b) under the Securities Act, please check the following box and list the Securities Act registration statement number of the earlier effective registration statement for the same offering. ¨
If this Form is a post-effective amendment filed pursuant to Rule 462(c) under the Securities Act, check the following box and list the Securities Act registration statement number of the earlier effective registration statement for the same offering. ¨
If this Form is a post-effective amendment filed pursuant to Rule 462(d) under the Securities Act, check the following box and list the Securities Act registration statement number of the earlier effective registration statement for the same offering. ¨
Indicate by check mark whether the registrant is a large accelerated filer, an accelerated filer, a non-accelerated filer, or a smaller reporting company. See the definitions of “large accelerated filer,” “accelerated filer” and “smaller reporting company” in Rule 12b-2 of the Exchange Act.
| Large accelerated filer | ¨ | Accelerated filer | ¨ | |||
| Non-accelerated filer | þ (Do not check if a smaller reporting company) | Smaller reporting company | ¨ | |||
The Registrant hereby amends this Registration Statement on such date or dates as may be necessary to delay its effective date until the Registrant shall file a further amendment which specifically states that this Registration Statement shall thereafter become effective in accordance with Section 8(a) of the Securities Act of 1933, as amended, or until the Registration Statement shall become effective on such date as the Securities and Exchange Commission acting pursuant to said Section 8(a), may determine.
Table of Contents
The information in this preliminary prospectus is not complete and may be changed. These securities may not be sold until the registration statement filed with the Securities and Exchange Commission is effective. This preliminary prospectus is not an offer to sell nor does it seek an offer to buy these securities in any jurisdiction where the offer or sale is not permitted.
Subject to completion, dated January 6, 2014.
Prospectus
Shares

Common Stock
This is an initial public offering of shares of common stock of TriNet Group, Inc.
We are offering shares of our common stock. The selling stockholders identified in this prospectus are offering an additional shares. We will not receive any of the proceeds from the sale of the shares being sold by the selling stockholders.
Prior to this offering, there has been no public market for our common stock. It is currently estimated that the initial public offering price per share will be between $ and $ . We intend to list our common stock on the under the symbol “ .”
| Per Share | Total | |||||||
| Initial public offering price |
$ | $ | ||||||
| Underwriting discount |
$ | $ | ||||||
| Proceeds, before expenses, to TriNet |
$ | $ | ||||||
| Proceeds, before expenses, to the selling stockholders |
$ | $ | ||||||
have granted the underwriters an option to purchase up to an additional shares at the initial public offering price, less the underwriting discount.
See “Risk Factors” beginning on page 14 to read about factors you should consider before buying shares of our common stock.
Neither the Securities and Exchange Commission nor any other regulatory body has approved or disapproved of these securities or passed upon the accuracy or adequacy of this prospectus. Any representation to the contrary is a criminal offense.
The underwriters expect to deliver the shares against payment in New York, New York on , 2014.
| J.P. Morgan | Morgan Stanley | Deutsche Bank Securities | ||
| Jefferies | Stifel | William Blair | ||
Prospectus dated , 2014
Table of Contents
| Page | ||||
| 1 | ||||
| 8 | ||||
| 10 | ||||
| 14 | ||||
| 33 | ||||
| 35 | ||||
| 36 | ||||
| 37 | ||||
| 38 | ||||
| 40 | ||||
| 42 | ||||
| Management’s Discussion and Analysis of Financial Condition and Results of Operations |
48 | |||
| 88 | ||||
| 103 | ||||
| 111 | ||||
| 129 | ||||
| 130 | ||||
| 133 | ||||
| 137 | ||||
| Material United States Federal Income Tax Consequences to Non-U.S. Holders of Our Common Stock |
139 | |||
| 142 | ||||
| 146 | ||||
| 146 | ||||
| 146 | ||||
| F-1 | ||||
Neither we, the selling stockholders nor the underwriters have authorized anyone to give any information or to make any representations other than those contained in this prospectus or in any free writing prospectuses we have prepared. Neither we, the selling stockholders nor the underwriters take responsibility for, and can provide no assurance as to the reliability of, any other information that others may give you. This prospectus is an offer to sell only the shares offered hereby, and only under circumstances and in jurisdictions where it is lawful to do so. The information contained in this prospectus is current only as of its date.
Through and including , 2014 (the 25th day after the date of this prospectus), all dealers effecting transactions in these securities, whether or not participating in this offering, may be required to deliver a prospectus. This is in addition to a dealer’s obligation to deliver a prospectus when acting as an underwriter and with respect to an unsold allotment or subscription.
Persons who come into possession of this prospectus and any applicable free writing prospectus we have prepared in jurisdictions outside the United States are required to inform themselves about and to observe any restrictions in this offering and the distribution of this prospectus and any such free writing prospectus applicable to that jurisdiction.
i
Table of Contents
This summary highlights information contained elsewhere in this prospectus and does not contain all of the information that you should consider in making your investment decision. Before investing in our common stock, you should read the entire prospectus carefully, including the sections titled “Risk Factors” and “Management’s Discussion and Analysis of Financial Condition and Results of Operations” and our consolidated financial statements and related notes included elsewhere in this prospectus. Unless the context suggests otherwise, references in this prospectus to “TriNet,” the “Company,” “we,” “us” and “our” refer to TriNet Group, Inc. and, where appropriate, its subsidiaries.
Company Overview
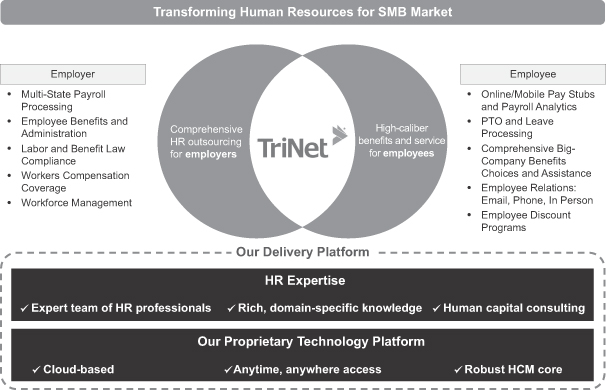
TriNet is a leading provider of a comprehensive human resources solution for small to medium-sized businesses, or SMBs. We enhance business productivity by enabling our clients to outsource their human resources, or HR, function to one strategic partner and allowing them to focus on operating and growing their core businesses. Our HR solution includes services such as payroll processing, human capital consulting, employment law compliance and employee benefits, including health insurance, retirement plans and workers compensation insurance. Our services are delivered by our expert team of HR professionals and enabled by our proprietary, cloud-based technology platform, which allows our clients and their employees to efficiently conduct their HR transactions anytime and anywhere. As of September 30, 2013, we served over 8,000 clients in 47 states, the District of Columbia and Canada and co-employed approximately 218,000 of our clients’ employees, which we refer to as worksite employees, or WSEs. In 2012, we processed over $10 billion in payroll and insurance premiums for our clients.
HR is a mission-critical function for businesses. Businesses of all sizes face increasing levels of complexity in managing HR processes, including regulatory pressures and escalating healthcare costs. These challenges are especially acute for SMBs, which typically lack the scale and capability to solve many of these issues on their own. In 2011, there were approximately 5.7 million employers with 500 or fewer employees. These SMBs employed approximately 55 million people in the United States, or 49% of all U.S. employees, and represented over 99% of all U.S. employers in 2011. We estimate that in 2013, SMBs will spend approximately $90 billion on in-house HR resources, payroll processing and other HR services. We believe that this in-house approach is more challenging for SMBs to manage, and is less effective and more costly as compared to our comprehensive, outsourced solution. Therefore, we believe that this presents a significant opportunity for us to continue to penetrate and expand our presence in the SMB market.
We offer our clients a bundled solution that enables them to outsource their HR function to a single provider. We believe that the combination of our HR professionals, full suite of services, vertical market orientation, broad geographic reach and powerful technology platform enables us to solve the HR challenges of our SMB clients. Our solution helps reduce the complexity, cost and risk of managing the HR function for our SMB clients while helping SMBs better retain their employees. In addition, our tailored approach allows us to serve a diverse range of industries with varying levels of HR requirements. For our clients’ employees, we provide access to high-caliber, big-company benefits, timely payroll processing and anytime and anywhere system access. We are also able to leverage our strong and diverse partner relationships to provide a broad and rich suite of services and benefits for our clients and their employees. We believe that this provides us with a highly referenceable customer base that allows us to further penetrate our target vertical markets.
Our proprietary, cloud-based technology platform and our team of HR professionals make HR transactions simple, seamless and efficient for employers and employees. Our platform is designed to function as the core system of record for all of our clients’ HR activities and allows our clients to enjoy 24/7, ubiquitous access. Our platform is also highly scalable, allowing us to efficiently add new clients and grow with our existing clients.
We sell our services primarily through our direct sales force, which we align around target vertical markets, including technology, life sciences, property management, professional services, banking and financial services,
1
Table of Contents
retail, manufacturing and hospitality services. The HR needs of our clients are influenced by the industry in which they operate. For example, wage and hour compliance and workers compensation are important components of our solution for clients in the food service industry, and retirement plans and specialized employee perquisites are significant components of the solution we provide to clients in the financial services industry. We believe that our vertical market expertise and tailored service offerings differentiate us in the market and allow us to compete more effectively. We acquire this expertise organically, by hiring individuals who are experienced in the markets that we target for our services. For example, we hire experienced sales persons and human capital consultants within the technology industry in order to build service teams that will understand the needs of our technology clients. Attracting employees with these skills in turn helps to increase the expertise and sophistication of our employees as they serve clients within a vertical industry. We also acquire vertical market expertise through our acquisitions. For example, we acquired significant expertise in blue- and gray-collar vertical markets such as property management and food services with our acquisition of SOI Holdings, Inc., and in the high-end financial services industry with our acquisition of Ambrose Employer Group, LLC. The industry-specific expertise we obtain through acquisitions allows us to better understand the needs of our clients and package the services we provide accordingly.
Our total revenues consist of professional service revenues and insurance service revenues. For 2012 and the nine months ended September 30, 2013, 15% and 17% of our total revenues, respectively, consisted of professional service revenues, and 85% and 83% of our total revenues, respectively, consisted of insurance service revenues. We earn professional service revenues by processing HR transactions, such as payroll and employment tax withholding, and providing labor and benefit law compliance services, on behalf of our clients. We earn insurance service revenues by providing risk-based, third-party plans to our clients, primarily employee health benefit plans and workers compensation insurance.
For professional service revenues, we recognize as revenues the fees we earn for processing HR transactions, which fees do not include the payroll that is paid to us by the client and paid out to WSEs or remitted as taxes. We recognize as insurance service revenues all insurance-related billings and administrative fees collected from clients and withheld from WSEs for risk-based insurance plans provided through third-party insurance carriers, primarily employee health insurance and workers compensation insurance. We in turn pay premiums to third-party insurance carriers for these insurance benefits, as well as reimburse them for claim payments within our insurance deductible layer. These premiums and reimbursements are classified as insurance costs on our statements of operations. To augment our financial information prepared in accordance with U.S. generally accepted accounting principles, or GAAP, we use internally a non-GAAP financial measure, Net Insurance Service Revenues, which consists of insurance service revenues less insurance costs. We also use a measure of total non-GAAP revenue, or Net Service Revenues, which is the sum of professional service revenues and Net Insurance Service Revenues. For 2012 and the nine months ended September 30, 2013, 55% and 66% of our Net Service Revenues, respectively, consisted of professional service revenues and 45% and 34% of our Net Service Revenues, respectively, consisted of Net Insurance Service Revenues.
We have grown our business organically and through strategic acquisitions. For 2010, 2011 and 2012, our total revenues were $906.2 million, $840.4 million and $1.0 billion, respectively, our Net Service Revenues were $192.5 million, $189.3 million and $269.0 million, respectively, and our net income (loss) was $(9.6 million), $15.5 million and $31.8 million, respectively. For the nine months ended September 30, 2012 and 2013, our total revenues were $696.9 million and $1.2 billion, respectively, our Net Service Revenues were $178.5 million and $296.0 million, respectively, and our net income was $23.0 million and $7.1 million, respectively. For 2010, 2011 and 2012, our Adjusted EBITDA was $29.8 million, $47.3 million and $95.4 million, respectively. For the nine months ended September 30, 2012 and 2013, our Adjusted EBITDA was $61.5 million and $92.3 million, respectively.
2
Table of Contents
Our Market Opportunity
We serve the HR needs of SMBs in the United States. The growing complexity of managing HR processes today presents a significant challenge for SMBs. Traditionally, SMBs have managed HR processes in-house through a range of separately delivered services rather than seeking a holistic and comprehensive solution, which we believe has further aggravated many of these challenges. We believe that a bundled HR solution better addresses these needs and allows SMBs to focus in-house resources on business operations instead of managing HR activities. As a result, we believe that this represents a significant opportunity for TriNet’s solution.
Large and Underpenetrated Market. SMBs employ a large percentage of the total employee base in the United States today. According to the U.S. Census Bureau, in 2011, approximately 55 million employees were employed by organizations with fewer than 500 employees, representing approximately 49% of U.S. employees. These SMBs comprised approximately 5.7 million business organizations, representing over 99% of U.S. employers in 2011. Though smaller, these companies have HR needs similar to their larger counterparts, including payroll, employee benefits and many other HR services for employees, and spend significant amounts on managing these processes. We estimate that in 2013 SMBs will spend approximately $90 billion in providing HR services, and that most of this spending will be on in-house resources. Based on data published by the National Association of Professional Employer Organizations, we estimate that in 2012 fewer than 5% of U.S. employees of businesses with fewer than 500 employees were part of a co-employment arrangement, in which all or some portion of the employer’s HR function was outsourced to a single third-party provider such as TriNet. We believe that our growth opportunity is primarily a function of our ability to increase our penetration of the SMB market.
HR Management Increasing in Complexity. The HR function is becoming increasingly complex. The scope of responsibilities and demands on HR departments continues to expand beyond the management of payroll and benefits as firms compete to attract, retain and motivate employees. In addition, external pressures continue to mount as firms must deal with the increased complexity of the laws and regulations that govern the provision and administration of HR services, including effectively managing multiple and disparate state and federal laws and regulations. As a recent example, the Patient Protection and Affordable Care Act, enacted in March 2010, imposes a staggered schedule of sweeping health care reforms, which began in 2010 and will continue through 2018, and which will put increased burdens on many employers.
Challenges Are Especially Acute for SMBs. SMBs typically confront an array of challenges as they seek to address increasingly complex HR requirements. These organizations frequently lack the dedicated and specialized personnel and systems that are necessary to provide complex HR solutions. According to The Bureau of National Affairs, Inc., in 2013, 39% of the smallest (fewer than 250 workers) organizations surveyed do not have an HR specialist on staff. Conversely, 90% of the largest (more than 2,500 workers) organizations surveyed have at least one employee devoted to just one or two areas of HR. Additionally, a large portion of HR-related spending by SMBs has traditionally been on a range of disparate products and services, where companies utilize a combination of third-party service and technology providers and in-house resources to administer the HR function. We believe that this approach of utilizing a combination of various third-party providers further complicates the delivery of HR services, dilutes the benefit that HR processes can have on an organization, and is typically more costly than a bundled solution. Lastly, SMBs typically cannot afford to invest in a comprehensive technology platform to manage their HR processes and often lack the scale required to negotiate favorable employee health benefit and workers compensation plan terms with insurance companies and other large employee benefits providers. As a result, we believe that SMBs will increasingly look to a bundled solution to help solve these issues.
Our Solution
We offer our clients a bundled solution that enables them to outsource their HR function to one strategic partner, so they can focus on operating and growing their core businesses. Our bundled solution, which includes services such as payroll processing, human capital consulting, employment law compliance and employee benefits, including health insurance, retirement plans and workers compensation insurance, holistically addresses
3
Table of Contents
the HR needs of both our clients and their employees. For each of our clients, we offer timely payroll processing and access to a team of HR professionals with specific knowledge of its industry to help reduce the complexity, cost and risk of managing the HR function, while helping them better retain their workforce. For employees, we provide access to high-caliber, big-company benefits and other services such as expert HR guidance and anytime, anywhere access to comprehensive HR information and services. We leverage our strong and diverse partner relationships to provide a broad and rich suite of services for our clients and their employees.
We serve a number of large vertical markets. Businesses in these vertical markets have HR requirements that vary across two primary dimensions: (1) the complexity of HR needs and (2) the importance of employee benefits and a high touch service experience. We believe that our ability to address our target vertical markets across these dimensions is a clear competitive differentiator.
Our vertical market expertise allows us to tailor our services for our target industries, which helps to further embed us within our clients and helps us to deliver meaningful business impact. Our solution is delivered by a team of HR professionals with expertise in our clients’ industries, enabled by our proprietary, cloud-based technology platform, which simplifies the day-to-day HR transactions of our clients and their employees. Our platform provides SMBs with the knowledge and features of large-business support and technology, as well as anywhere and any-device access to their HR systems. Our platform is also highly scalable, allowing our clients to efficiently add new employees and us to grow with our existing clients. Its seamless integration with partner systems allows single-sign-on functionality that enhances the employee and employer experience.
Our Competitive Advantages
We believe that we have the following key competitive advantages:
Comprehensive Suite of HR Capabilities. We are the strategic HR partner to our clients. Our innovative bundled solution, developed over our 25-year operating history, allows our clients to outsource their HR function
4
Table of Contents
to a single provider in an effective and cost-efficient manner. As the provider of a bundled solution, we deliver our services in a coordinated and comprehensive manner, which provides significant value to our clients by reducing the complexity of managing the HR function. The services that we provide are delivered through a combination of HR professionals and our proprietary, cloud-based technology platform. Each TriNet client is guided by a team of HR professionals with expertise in both complex and day-to-day HR questions and challenges, ensuring a high level of customer service and attention throughout the client’s organization. In addition to our HR services such as payroll processing and human capital consulting, we also offer our clients and their employees access to a broad range of big-company employee benefits plans, and our risk management tools allow us to significantly mitigate employer risk, such as compliance, legal and related risks, including workers compensation and employee practices liability insurance.
Deep Vertical Market Expertise. We focus on serving clients in specific industry vertical markets. We have developed deep expertise around the HR functions within our target industries, which enables us to provide our clients with a solution tailored to the industries in which they operate. Our direct sales force and go-to-market strategy is aligned with these vertical markets, which enhances our client value proposition and allows us to leverage our strong institutional knowledge to further expand our presence within these target industries. We believe that this verticalized approach allows us to target clients across a range of industries in which SMBs have varying levels of need for services based on the complexity of their HR environment and required employee experience.
Proprietary, Cloud-Based Technology Platform. Our proprietary, cloud-based technology platform enables our clients and their employees to conduct their HR transactions anytime and anywhere. Our platform offers online self-service tools for managing employee payroll, creating compensation reports, managing employee hiring and termination and managing health benefits. As a result of our long-standing partnerships and the significant investments that we have made in our platform, our technology and benefits services partners are able to integrate their systems with our platform, allowing employees to access a unified view of all of their pertinent HR information. In addition, our platform allows clients to leverage information about their workforce in real time to keep tactical HR demands under control. Our platform is also highly scalable, which allows our clients to efficiently add new employees.
Scale. We are able to leverage our national presence and large WSE base to provide a comprehensive and cost-effective solution to our clients. SMBs typically lack the scale required to negotiate favorable employee health benefit plan prices and other features with insurance companies and other large employee benefits providers. Leveraging the economies of scale arising from serving approximately 218,000 WSEs, we are able to make significant investments in our technology platform and are typically able to secure a broader range of benefits plans at rates and with features that are more competitive than those that an SMB would be able to procure on its own. In addition, our scale has allowed us to specialize our workforce by industry vertical markets and deliver more relevant services to our clients.
Strong Strategic Partnerships. We have developed strong relationships with our insurance and risk management partners, as well as other vendors and suppliers, which we believe enable us to provide a broader array of services to our clients and their employees more cost-effectively than if they attempted to purchase these offerings themselves. We have long-standing relationships with large health benefits insurers, such as Aetna, Blue Shield of California, Blue Cross and Blue Shield of Florida, Kaiser Permanente, MetLife and United Healthcare, as well as retirement plan providers, such as Transamerica Retirement Services and MassMutual. We believe that we are a valuable partner for our insurance and other service vendors, as we provide them with an attractive channel to the hard-to-reach SMB market through our large scale presence across the United States and Canada, and across a wide range of industry vertical markets.
5
Table of Contents
Our Growth Strategies
Our goal is to become the leading HR solutions provider to SMBs. Our strategies to achieve that goal include the following:
| • | Continue to Penetrate the SMB Market Using Our Vertical Market Approach. Our focus on serving clients in specific industry vertical markets has given us deep, substantive knowledge of the HR needs facing SMBs in those industries. This enables us to provide a bundled solution of services to each client that is tailored to its specific needs and better enables us to attract sales professionals with industry expertise. We intend to continue this focus on industry vertical markets. We also regularly assess additional and new industry vertical markets and intend to add them, either through acquisition or internal development, selectively based on what we believe the market opportunity is. |
| • | Expand Our Direct Sales Force. We believe that the SMB market remains significantly underpenetrated for a bundled HR solution such as ours. We intend to continue to invest in our direct sales force to enable us to identify and acquire new clients across our target vertical markets, in addition to expanding our sales force to target new vertical markets. |
| • | Grow With Our Clients by Enhancing the Breadth and Quality of Our Services. We intend to continue to expand the breadth and quality of our HR solution. We believe that this will allow us to continue to enhance the value proposition for our clients and to grow with them by providing additional high-quality service offerings. |
| • | Continue to Enhance Our Technology Platform. We intend to continue to invest in and improve our proprietary, cloud-based technology platform, including mobile applications, in order to provide our clients with enhanced features and functionality with which to conduct their HR transactions, manage employees and analyze employee benefits data. This may include acquiring or developing additional functionality or technology. |
| • | Continue to Grow Through Strategic Acquisitions. We have successfully completed numerous strategic acquisitions over the course of the past decade, which has allowed us to enhance and expand our presence in both existing and new target industries as well as expand our solution and technology platform. We intend to continue to pursue strategic acquisitions that will enable us to leverage our existing assets and offer our clients more comprehensive and attractive services. |
Risks Associated with Our Business
Our business is subject to numerous risks and uncertainties, including those highlighted in the section titled “Risk Factors” immediately following this prospectus summary. Some of these risks are:
| • | our success depends on growth in market acceptance of the HR outsourcing and related services we provide; |
| • | if we are unable to rapidly grow our sales force, we will not be able to grow our business at the rate that we anticipate, which could harm our business, results of operations and financial condition; |
| • | we are subject to client attrition; |
| • | our acquisition strategy creates risks for our business; |
| • | unexpected changes in workers compensation and health insurance claims by worksite employees could harm our business; |
| • | our quarterly results of operations may fluctuate as a result of numerous factors, many of which are outside of our control; |
6
Table of Contents
| • | our business is subject to numerous state and federal laws, and uncertainty as to the application of these laws, or adverse applications of these laws, as well as changes in applicable laws, could adversely affect our business; |
| • | if we are not recognized as an employer of worksite employees under federal and state regulations, we and our clients could be adversely impacted; |
| • | we and our clients could be adversely impacted by health care reform; |
| • | we may have additional tax liabilities, which could harm our business, operating results, financial condition and prospects; |
| • | our business and operations have experienced rapid growth in recent periods, and if we are unable to effectively manage this growth, our business and results of operations may suffer; |
| • | we may not be able to sustain our revenue growth rate or profitability in the future; |
| • | our industry is highly competitive, which may limit our ability to maintain or increase our market share or improve our results of operations; |
| • | adverse changes in our relationships with key vendors could impair the quality of our solution; |
| • | we depend on licenses to third-party software in order to provide our services; and |
| • | we have a substantial amount of indebtedness, which could adversely affect our financial condition and our operating flexibility. |
Corporate Information
We were incorporated in 1988 as TriNet Employer Group, Inc., a California corporation. We reincorporated as TriNet Group, Inc., a Delaware corporation, in 2000. Our principal executive offices are located at 1100 San Leandro Blvd., Suite 400, San Leandro, CA 94577 and our telephone number is (510) 352-5000. Our website address is www.trinet.com. Information contained on or accessible through our website is not a part of this prospectus and should not be relied upon in determining whether to make an investment decision.
TriNet, TriNet Group, SOI, Ambrose, Accord and ExpenseCloud and their associated logos and other trade names, trademarks or service marks of TriNet appearing in this prospectus are the property of TriNet. Trade names, trademarks and service marks of other companies appearing in this prospectus are the property of their respective holders.
Upon the completion of this offering, funds affiliated with General Atlantic will beneficially own approximately % of our outstanding common stock.
7
Table of Contents
| Common stock offered by TriNet |
shares |
| Common stock offered by the selling stockholders |
shares |
| Common stock to be outstanding after this offering |
shares |
| Option to purchase additional shares of common stock offered by |
shares |
| Use of proceeds |
We estimate that our net proceeds from this offering will be approximately $ million, based on an assumed initial public offering price of $ per share, which is the midpoint of the estimated offering price range set forth on the cover page of this prospectus, and after deducting estimated underwriting discounts and commissions and estimated offering expenses payable by us. |
| We intend to use the net proceeds to us from this offering to repay approximately $200 million of indebtedness outstanding under our credit facilities and for working capital and other general corporate purposes. We may also use a portion of the net proceeds from this offering for acquisitions of, or investments in, technologies, assets or businesses that complement our business, although we have no present commitments or agreements to enter into such acquisitions or investments. We will not receive any of the proceeds from the sale of shares to be offered by the selling stockholders. See “Use of Proceeds” for additional information. |
| Risk factors |
See “Risk Factors” beginning on page 14 and the other information included in this prospectus for a discussion of factors you should carefully consider before deciding to invest in our common stock. |
| Qualified Independent Underwriter |
Affiliates of J.P. Morgan Securities LLC, Morgan Stanley & Co. LLC and Deutsche Bank Securities Inc., underwriters in this offering, are lenders under our credit facilities and will receive more than 5% of the net proceeds of this offering in connection with our repayment of approximately $200 million of indebtedness under our credit facilities, as set forth under “Use of Proceeds.” Accordingly, this offering is being made in compliance with the requirements of Rule 5121 of the Financial Industry Regulatory Authority, Inc. In accordance with this rule, Jefferies LLC has assumed the responsibilities of acting as a qualified independent underwriter. In its role as qualified independent underwriter, Jefferies LLC has participated in due diligence and the preparation of this prospectus and the registration statement of which this prospectus is a part. Jefferies LLC will not receive any additional fees for serving as a qualified independent underwriter in connection with this offering. Affiliates of |
8
Table of Contents
| J.P. Morgan Securities LLC, Morgan Stanley & Co. LLC and Deutsche Bank Securities Inc. will not confirm sales of the shares to any account over which it exercises discretionary authority without the prior written approval of the customer. |
| Proposed symbol |
The number of shares of common stock to be outstanding after this offering is based on 26,449,910 shares of our common stock (including preferred stock on an as-converted basis) outstanding as of September 30, 2013, and excludes:
| • | 3,343,372 shares of common stock issuable upon the exercise of outstanding stock options as of September 30, 2013 pursuant to our 2000 Equity Incentive Plan, or our 2000 Plan, and our 2009 Equity Incentive Plan, or our 2009 Plan, at a weighted average exercise price of $2.85 per share; |
| • | 3,266 shares of common stock issuable upon the settlement of restricted stock units as of September 30, 2013 pursuant to our 2009 Plan; |
| • | shares of common stock issuable upon the exercise of outstanding stock options issued after September 30, 2013 pursuant to our 2009 Plan at a weighted average exercise price of $ ; |
| • | shares of common stock to be reserved for future issuance under our 2009 Plan, as amended in connection with this offering, as well as any automatic increases in the number of shares of common stock reserved for future issuance under this benefit plan; and |
| • | shares of common stock to be reserved for issuance under our 2013 Employee Stock Purchase Plan, or our ESPP, to be effective in connection with this offering, as well as any automatic increases in the number of shares of common stock reserved for future issuance under this benefit plan. |
In addition, unless we specifically state otherwise, all information in this prospectus assumes:
| • | that the two-for-one split of our common stock that occurred in July 2013 occurred as of the first date presented in this prospectus; |
| • | the conversion of all outstanding shares of our preferred stock into an aggregate of 19,032,854 shares of common stock immediately prior to the completion of this offering; |
| • | no exercise of options outstanding; |
| • | no exercise of the underwriters’ option to purchase up to an additional shares of common stock from ; and |
| • | the filing of our amended and restated certificate of incorporation in Delaware and the adoption of our amended and restated bylaws, each of which will occur immediately prior to the completion of this offering. |
9
Table of Contents
SUMMARY CONSOLIDATED FINANCIAL AND OTHER DATA
The following tables summarize our consolidated financial and other data. You should read this summary consolidated financial and other data together with the sections titled “Selected Consolidated Financial and Other Data” and “Management’s Discussion and Analysis of Financial Condition and Results of Operations” as well as our consolidated financial statements and related notes included elsewhere in this prospectus.
We have derived the consolidated statement of operations data for the years ended December 31, 2010, 2011 and 2012 from our audited consolidated financial statements that are included elsewhere in this prospectus. We have derived the unaudited consolidated statement of operations data for the nine months ended September 30, 2012 and 2013 and the unaudited consolidated balance sheet data as of September 30, 2013 from our unaudited consolidated financial statements that are included elsewhere in this prospectus. Our unaudited consolidated financial statements have been prepared on the same basis as our audited consolidated financial statements and, in the opinion of management, reflect all adjustments, which consist only of normal recurring adjustments, necessary for the fair statement of those unaudited consolidated financial statements. Our historical results are not necessarily indicative of the results that should be expected in the future, and our interim results are not necessarily indicative of the results that should be expected for the full year or any other period.
10
Table of Contents
| Year Ended December 31, | Nine Months Ended September 30, |
|||||||||||||||||||
| 2010 | 2011 | 2012 | 2012 | 2013 | ||||||||||||||||
| (in thousands, except share and per share data) | ||||||||||||||||||||
| Consolidated Statement of Operations Data: |
||||||||||||||||||||
| Professional service revenues |
$ | 139,495 | $ | 113,279 | $ | 148,233 | $ | 94,892 | $ | 195,642 | ||||||||||
| Insurance service revenues |
766,695 | 727,111 | 870,828 | 601,967 | 959,246 | |||||||||||||||
|
|
|
|
|
|
|
|
|
|
|
|||||||||||
| Total revenues |
906,190 | 840,390 | 1,019,061 | 696,859 | 1,154,888 | |||||||||||||||
|
|
|
|
|
|
|
|
|
|
|
|||||||||||
| Costs and operating expenses: |
||||||||||||||||||||
| Insurance costs |
713,653 | 651,094 | 750,025 | 518,386 | 858,862 | |||||||||||||||
| Cost of providing services (exclusive of depreciation and amortization of intangible assets)(1) |
72,073 | 59,388 | 63,563 | 44,944 | 74,042 | |||||||||||||||
| Sales and marketing(1) |
46,454 | 38,087 | 59,931 | 39,377 | 79,387 | |||||||||||||||
| General and administrative(1) |
28,366 | 31,421 | 37,879 | 24,147 | 39,821 | |||||||||||||||
| Systems development and programming costs(1) |
15,045 | 15,646 | 16,718 | 11,893 | 15,140 | |||||||||||||||
| Amortization of intangible assets |
17,960 | 12,388 | 17,441 | 7,853 | 35,926 | |||||||||||||||
| Depreciation |
12,042 | 9,201 | 11,676 | 9,100 | 8,908 | |||||||||||||||
| Restructuring |
5,922 | 2,358 | — | — | — | |||||||||||||||
|
|
|
|
|
|
|
|
|
|
|
|||||||||||
| Total costs and operating expenses |
911,515 | 819,583 | 957,233 | 655,700 | 1,112,086 | |||||||||||||||
|
|
|
|
|
|
|
|
|
|
|
|||||||||||
| Operating income (loss) |
(5,325 | ) | 20,807 | 61,828 | 41,159 | 42,802 | ||||||||||||||
| Other income (expense): |
||||||||||||||||||||
| Interest expense |
(4,444 | ) | (751 | ) | (9,709 | ) | (2,835 | ) | (32,091 | ) | ||||||||||
| Other, net |
67 | 127 | 57 | 22 | 309 | |||||||||||||||
|
|
|
|
|
|
|
|
|
|
|
|||||||||||
| Income (loss) before provision for (benefit from) income taxes |
(9,702 | ) | 20,183 | 52,176 | 38,346 | 11,020 | ||||||||||||||
| Provision for (benefit from) income taxes |
(100 | ) | 4,646 | 20,344 | 15,386 | 3,880 | ||||||||||||||
|
|
|
|
|
|
|
|
|
|
|
|||||||||||
| Net income (loss) |
$ | (9,602 | ) | $ | 15,537 | $ | 31,832 | $ | 22,960 | $ | 7,140 | |||||||||
|
|
|
|
|
|
|
|
|
|
|
|||||||||||
| Net income (loss) per share attributable to common stock: |
||||||||||||||||||||
| Basic |
$ | (2.58 | ) | $ | 0.68 | $ | 1.33 | $ | 0.97 | $ | 0.29 | |||||||||
|
|
|
|
|
|
|
|
|
|
|
|||||||||||
| Diluted |
$ | (2.58 | ) | $ | 0.65 | $ | 1.26 | $ | 0.92 | $ | 0.27 | |||||||||
|
|
|
|
|
|
|
|
|
|
|
|||||||||||
| Weighted average common stock outstanding: |
||||||||||||||||||||
| Basic |
3,727,195 | 3,921,341 | 4,902,692 | 4,728,686 | 5,750,789 | |||||||||||||||
|
|
|
|
|
|
|
|
|
|
|
|||||||||||
| Diluted |
3,727,195 | 5,051,990 | 6,238,046 | 6,002,628 | 7,598,197 | |||||||||||||||
|
|
|
|
|
|
|
|
|
|
|
|||||||||||
| Pro forma net income per share: |
||||||||||||||||||||
| Basic |
$ | $ | ||||||||||||||||||
|
|
|
|
|
|||||||||||||||||
| Diluted |
$ | $ | ||||||||||||||||||
|
|
|
|
|
|||||||||||||||||
| Pro forma weighted average shares of common stock outstanding: |
||||||||||||||||||||
| Basic |
||||||||||||||||||||
|
|
|
|
|
|||||||||||||||||
| Diluted |
||||||||||||||||||||
|
|
|
|
|
|||||||||||||||||
11
Table of Contents
| Year Ended December 31, | Nine Months Ended September 30, |
|||||||||||||||||||
| 2010 | 2011 | 2012 | 2012 | 2013 | ||||||||||||||||
| Key Operating Metrics and Other Financial Data: |
||||||||||||||||||||
| Total WSEs(2) |
96,816 | 83,314 | 174,311 | 104,747 | 218,069 | |||||||||||||||
| Total Sales Representatives(3) |
114 | 80 | 224 | 149 | 301 | |||||||||||||||
| Net Insurance Service Revenues (in thousands)(4) |
$ | 53,042 | $ | 76,017 | $ | 120,803 | $ | 83,581 | $ | 100,384 | ||||||||||
| Net Service Revenues (in thousands)(5) |
$ | 192,537 | $ | 189,296 | $ | 269,036 | $ | 178,473 | $ | 296,026 | ||||||||||
| Adjusted EBITDA (in thousands)(6) |
$ | 29,797 | $ | 47,348 | $ | 95,362 | $ | 61,530 | $ | 92,305 | ||||||||||
| Adjusted Net Income (in thousands)(7) |
$ | 13,174 | $ | 28,788 | $ | 45,133 | $ | 29,695 | $ | 33,242 | ||||||||||
| (1) | Includes stock-based compensation expense as follows: |
| Year Ended December 31, | Nine Months Ended September 30, |
|||||||||||||||||||
| 2010 | 2011 | 2012 | 2012 | 2013 | ||||||||||||||||
| (in thousands) | ||||||||||||||||||||
| Cost of providing services (exclusive of depreciation and amortization of intangible assets) |
$ | 467 | $ | 438 | $ | 516 | $ | 382 | $ | 770 | ||||||||||
| Sales and marketing |
670 | 637 | 500 | 364 | 882 | |||||||||||||||
| General and administrative |
3,385 | 3,590 | 3,144 | 2,505 | 2,371 | |||||||||||||||
| Systems development and programming costs |
531 | 160 | 200 | 145 | 337 | |||||||||||||||
|
|
|
|
|
|
|
|
|
|
|
|||||||||||
| Total stock-based compensation expense |
$ | 5,053 | $ | 4,825 | $ | 4,360 | $ | 3,396 | $ | 4,360 | ||||||||||
|
|
|
|
|
|
|
|
|
|
|
|||||||||||
| (2) | We define Total WSEs at the end of a given fiscal period as the total number of WSEs paid in the last calendar month of the fiscal period. For more information about Total WSEs, see “Management’s Discussion and Analysis of Financial Condition and Results of Operations—Key Operating Metrics.” |
| (3) | We define Total Sales Representatives at the end of a given fiscal period as the total number of our direct sales force employees at that date. For more information about Total Sales Representatives, see “Management’s Discussion and Analysis of Financial Condition and Results of Operations—Key Operating Metrics.” |
| (4) | Net Insurance Service Revenues is a non-GAAP financial measure that we calculate as insurance service revenues less insurance costs. For more information about Net Insurance Service Revenues and a reconciliation of Net Insurance Service Revenues to insurance service revenues, the most directly comparable financial measure calculated and presented in accordance with GAAP, see “Selected Consolidated Financial and Other Data—Non-GAAP Financial Results.” |
| (5) | Net Service Revenues is a non-GAAP financial measure that we calculate as the sum of professional service revenues and Net Insurance Service Revenues. For more information about Net Service Revenues and a reconciliation of Net Service Revenues to total revenues, the most directly comparable financial measure calculated and presented in accordance with GAAP, see “Selected Consolidated Financial and Other Data—Non-GAAP Financial Results.” |
| (6) | Adjusted EBITDA is a non-GAAP financial measure that we calculate as net income (loss) excluding the effects of our income tax provision (benefit), interest expense, depreciation, amortization of intangible assets, and stock-based compensation expense. For more information about Adjusted EBITDA and a reconciliation of Adjusted EBITDA to net income (loss), the most directly comparable financial measure calculated and presented in accordance with GAAP, see “Selected Consolidated Financial and Other Data—Non-GAAP Financial Results.” |
| (7) | Adjusted Net Income is a non-GAAP financial measure that we calculate as net income (loss), excluding the effects of stock-based compensation, amortization of intangible assets and the income tax effect of these pre-tax adjustments at our effective tax rate. For more information about Adjusted Net Income and a reconciliation of Adjusted Net Income to net income (loss), the most directly comparable financial measure calculated and presented in accordance with GAAP, see “Selected Consolidated Financial and Other Data—Non-GAAP Financial Results.” |
12
Table of Contents
| As of September 30, 2013 | ||||||||||
| Actual | Pro Forma(1) | Pro Forma As Adjusted(2)(3) | ||||||||
| (in thousands) | ||||||||||
| Consolidated Balance Sheet Data: |
||||||||||
| Cash and cash equivalents |
$ | 112,161 | $ | 112,161 | ||||||
| Working capital |
$ | 85,541 | $ | 85,541 | ||||||
| Total assets |
$ | 1,215,597 | $ | 1,215,597 | ||||||
| Notes payable and borrowings under capital leases |
$ | 820,610 | $ | 820,610 | ||||||
| Total liabilities |
$ | 1,448,163 | $ | 1,448,163 | ||||||
| Convertible preferred stock |
$ | 122,878 | — | |||||||
| Total stockholders’ equity (deficit) |
$ | (355,444 | ) | $ | (232,566 | ) | ||||
| (1) | The pro forma column reflects the conversion of all outstanding shares of our preferred stock into 19,032,854 shares of our common stock immediately prior to the completion of this offering. |
| (2) | The pro forma as adjusted column reflects the (i) conversion of all outstanding shares of our preferred stock into 19,032,854 shares of our common stock immediately prior to the closing of this offering, (ii) sale by us of shares of our common stock in this offering at an assumed initial public offering price of $ per share, which is the midpoint of the estimated offering price range set forth on the cover page of this prospectus, after deducting estimated underwriting discounts and commissions and estimated offering expenses payable by us, and (iii) the application of $200 million of the net proceeds of this offering to repay amounts outstanding under our credit facilities. |
| (3) | A $1.00 increase (decrease) in the assumed initial public offering price of $ per share would increase (decrease) the amount of cash and cash equivalents, working capital, total assets and total stockholders’ equity by approximately $ million, assuming the number of shares offered by us, as set forth on the cover page of this prospectus, remains the same and after deducting estimated underwriting discounts and commissions. Similarly, each increase (decrease) of 1,000,000 shares in the number of shares of our common stock offered by us would increase (decrease) the amount of cash and cash equivalents, working capital, total assets and total stockholders’ equity by approximately $ million, assuming that the assumed initial public offering price remains the same, and after deducting estimated underwriting discounts and commissions. The pro forma as adjusted information discussed above is illustrative only and will be adjusted based on the actual initial public offering price and the other terms of this offering determined at pricing. |
13
Table of Contents
Investing in our common stock involves a high degree of risk. You should carefully consider the following risks and all of the other information contained in this prospectus, including our consolidated financial statements and related notes, before investing in our common stock. If any of the following risks materialize, our business, financial condition and results of operations could be materially and adversely affected. In that case, the trading price of our common stock could decline, and you may lose some or all of your investment.
Risks Related to Our Business and Industry
Our success depends on growth in market acceptance of the human resources outsourcing and related services we provide.
Our success depends on the willingness of SMBs to outsource their HR function to a third-party service provider. Based on data published by the National Association of Professional Employer Organizations, we estimate that in 2012 fewer than 5% of U.S. employees of businesses with fewer than 500 employees were part of a co-employment arrangement, in which all or some portion of the employer’s HR function was outsourced to a single third-party provider such as TriNet. We believe that our growth opportunity is primarily a function of our ability to penetrate the SMB market. Many companies have invested substantial personnel, infrastructure and financial resources in their own internal HR organizations and therefore may be reluctant to switch to our solution. Companies may not engage us for other reasons, including a desire to maintain control over all aspects of their HR activities, a belief that they manage their HR activities more effectively using their internal administrative organizations, perceptions about the expenses associated with our services, perceptions about whether our services comply with laws and regulations applicable to them or their businesses, or other considerations that may not always be evident. Additional concerns or considerations may also emerge in the future. We must address our potential clients’ concerns and explain the benefits of our approach in order to convince them to change the way that they manage their HR activities, particularly in parts of the United States where our company and solution are less well-known. If we are not successful in addressing potential clients’ concerns and convincing companies that our solution can fulfill their HR needs, then the market for our solution may not develop as we anticipate and our business may not grow.
If we are unable to rapidly grow our sales force, we will not be able to grow our business at the rate that we anticipate, which could harm our business, results of operations and financial condition.
In order to raise awareness of the benefits of our services and identify and acquire new clients, we must rapidly grow our direct sales force, which consists of regional sales representatives who focus on serving clients in specific industry vertical markets. Competition for skilled sales personnel is intense, and we cannot assure you that we will be successful in attracting, training and retaining qualified sales personnel, or that our newly hired sales personnel will function effectively, either individually or as a group. In addition, our newly hired sales personnel are typically not productive for up to a year following their hiring. This results in increased near-term costs to us relative to the sales contributions of these newly hired sales personnel. If we are unable to rapidly grow and effectively train our sales force, our revenues likely will not increase at the rate that we anticipate, which could harm our business, results of operations and financial condition.
We are subject to client attrition.
We regularly experience significant client attrition due to a variety of factors, including increases in administrative fees and insurance costs, disruption caused by the transition of WSEs we have gained through acquisition to our technology platform, client business failure, competition and clients determining to bring HR administration in-house. Our standard client service agreement can be cancelled by us or by the client without penalty with 30 days’ prior written notice. Clients who intend to cease doing business with us often elect to do so effective as of the beginning of a calendar year. As a result, in the first quarter of each year we experience our largest concentration of client attrition. In addition, we experience higher levels of client attrition in connection
14
Table of Contents
with renewals of the health insurance we provide for WSEs in the event that such renewals result in increased premiums that we pass on to our clients. If we were to experience client attrition in excess of our projected annual attrition rate of approximately 20% of our installed WSE base, as we did in 2010 and 2011, it could harm our business, results of operations and financial condition.
Our acquisition strategy creates risks for our business.
We have completed numerous acquisitions of other businesses, and we expect that we will continue to grow through acquisitions of other businesses, assets or technologies. We may fail to identify attractive acquisition candidates or we may be unable to reach acceptable terms for future acquisitions. If we are unable to complete acquisitions in the future, our ability to grow our business will be impaired.
We may pay for acquisitions by issuing additional shares of our common stock, which would dilute our stockholders, or by issuing debt, which could include terms that restrict our ability to operate our business or pursue other opportunities and subject us to meaningful debt service obligations. We may also use significant amounts of cash to complete acquisitions. To the extent that we complete acquisitions in the future, we likely will incur future depreciation and amortization expenses associated with the acquired assets. We may also record significant amounts of intangible assets, including goodwill, which could become impaired in the future. Acquisitions involve numerous other risks, including:
| • | difficulties integrating the operations, technologies, services and personnel of the acquired companies, including the migration of WSEs from an acquired company’s technology platform to ours; |
| • | challenges maintaining our internal standards, controls, procedures and policies; |
| • | diversion of management’s attention from other business concerns; |
| • | over-valuation by us of acquired companies; |
| • | litigation resulting from activities of the acquired company, including claims from terminated employees, customers, former stockholders and other third parties; |
| • | insufficient revenues to offset increased expenses associated with the acquisitions and unanticipated liabilities of the acquired companies; |
| • | insufficient indemnification or security from the selling parties for legal liabilities that we may assume in connection with our acquisitions; |
| • | entering markets in which we have no prior experience and may not succeed; |
| • | risks associated with foreign acquisitions, such as communication and integration problems resulting from geographic dispersion and language and cultural differences, compliance with foreign laws and regulations and general economic or political conditions in other countries or regions; |
| • | potential loss of key employees of the acquired companies; and |
| • | impairment of relationships with clients and employees of the acquired companies or our clients and employees as a result of the integration of acquired operations and new management personnel. |
If we fail to integrate newly acquired businesses effectively, we might not achieve the growth, service enhancement or operational efficiency objectives of the acquisitions, and our business, results of operations and financial condition could be harmed.
Unexpected changes in workers compensation and health insurance claims by worksite employees could harm our business.
Our insurance costs are impacted significantly by our WSEs’ health and workers compensation insurance claims experience. We establish reserves to provide for the estimated costs of reimbursing our workers
15
Table of Contents
compensation and health insurance carriers for paying claims within the deductible layer in accordance with their insurance policies. Estimating these reserves involves our consideration of a number of factors and requires significant judgment. If there is an unexpected increase in the severity or frequency of claims, such as due to our WSEs generating additional claims activity, or if we subsequently receive updated information indicating insurance claims were higher than previously estimated and reported, our insurance costs could be higher in that period or subsequent periods as we adjust our reserves accordingly. In addition, we may be unable to increase our pricing to offset increases in insurance costs on a timely basis. A number of factors affect claim activity levels, such as changes in general economic conditions, proposed and enacted regulatory changes and disease outbreaks.
Our quarterly results of operations may fluctuate as a result of numerous factors, many of which are outside of our control.
Our quarterly results of operations are likely to fluctuate, and our results in some quarters may be below the expectations of research analysts and our investors, which could cause the price of our common stock to decline. Some of our significant expenses, such as insurance costs for our WSEs, rent expense and debt expense, may require significant lead time to reduce. If we do not achieve our expected revenues targets, we may be unable to adjust our costs quickly enough to offset any revenues shortfall, which could harm our results of operations. Some of the important factors that may cause our revenues, results of operations and cash flows to fluctuate from quarter to quarter include:
| • | the number of our new clients initiating service and the number of WSEs employed by each new client; |
| • | our loss of existing clients; |
| • | reduction in the number of WSEs at existing clients; |
| • | the number and severity of health and workers compensation insurance claims by WSEs and the timing of claims information provided by our insurance carriers; |
| • | the timing of client payments and payment defaults by clients; |
| • | the amount and timing of our operating expenses and capital expenditures; |
| • | costs associated with our acquisitions of companies, assets and technologies; |
| • | expenses we incur for geographic and service expansion; |
| • | our regulatory compliance costs; |
| • | changes to our credit ratings by rating agencies; |
| • | changes in our effective tax rate; |
| • | extraordinary expenses such as litigation or other dispute-related settlement payments; and |
| • | the impact of new accounting pronouncements. |
Many of the above factors are discussed in more detail elsewhere in this “Risk Factors” section and in the sections titled “Management’s Discussion and Analysis of Financial Condition and Results of Operations” and “Business.” Many of these factors are outside our control, and the variability and unpredictability of these factors could cause us to fail to meet our expectations for revenues or results of operations for a given period. In addition, the occurrence of one or more of these factors might cause our results of operations to vary widely, which could lead to negative impacts on our margins, short-term liquidity or ability to retain or attract key personnel, and could cause other unanticipated issues. Accordingly, we believe that quarter-to-quarter comparisons of our revenues, results of operations and cash flows may not be meaningful and should not be relied upon as an indication of our future performance.
16
Table of Contents
Our business is subject to numerous state and federal laws, and uncertainty as to the application of these laws, or adverse applications of these laws, as well as changes in applicable laws, could adversely affect our business.
Our operations are governed by numerous federal, state and local laws relating to labor, tax, benefits, insurance and employment matters. We are a professional employer organization, and by entering into a co-employer relationship with WSEs, we assume certain obligations, responsibilities and potential legal risks of an employer under these laws. However, many of these laws (such as the Employee Retirement Income Security Act, or ERISA, and federal and state employment tax laws) do not specifically address the obligations and responsibilities of a provider of outsourced HR in a co-employer relationship, and the definition of employer under these laws is not uniform. In addition, many states have not addressed the co-employer relationship for purposes of compliance with applicable state laws governing the relationship between employers and employees and state insurance laws. There is even greater uncertainty on the federal level, such as the application of immigration reform to a co-employer relationship, and tax credits for small businesses that utilize a co-employer relationship.
We are not able to predict whether broader federal or state regulation governing the co-employer relationship will be implemented, or if it is, how it will affect us. Any adverse application or interpretation (in courts, agencies or otherwise) of new or existing federal or state laws to the co-employer relationship with our WSEs and clients could harm our business. If federal, state or local jurisdictions were to change their regulatory framework related to outsourced HR, or introduce new laws governing our industry that were materially different from existing laws, those changes could reduce or eliminate the need for some of our services, or could require that we make significant changes in our methods of doing business, which could increase our cost of doing business. Changes in regulations could also affect the extent and type of benefits employers can or must provide employees, the amount and type of taxes employers and employees are required to pay or the time within which employers must remit taxes to the applicable authority. These changes could substantially decrease our revenues and substantially increase our cost of doing business. If we fail to educate and assist our clients regarding new or revised legislation that impacts them, our reputation could be harmed.
Although some states do not explicitly regulate professional employer organizations, 42 states have passed laws that have licensing, certification or registration requirements applicable to professional employer organizations or recognize the professional employer organization model, and other states may implement such requirements in the future. Laws regulating professional employer organizations vary from state to state, but generally provide for oversight of the fiscal responsibility of professional employer organizations, and in some cases codify and clarify the co-employment relationship for processing unemployment claims, workers compensation and other purposes under state law. We may be required to spend significant time and resources to satisfy licensing requirements or other applicable regulations in some states, and we may not be able to satisfy these requirements or regulations in all states, which could prohibit us from doing business in such states. In addition, we cannot assure you that we will be able to renew our licenses in all states.
If we are not recognized as an employer of worksite employees under federal and state regulations, we and our clients could be adversely impacted.
In order for WSEs to receive the full benefit of our benefits offerings, it is important that we act and qualify as an employer of the WSEs under the Internal Revenue Code of 1986, or the Code, and ERISA. In addition, our status as an employer is important for purposes of ERISA preemption of state laws. The definition of employer under various laws is not uniform, and under both the Code and ERISA the term is defined in part by complex multi-factor tests under common law. We believe that we qualify as an employer of our WSEs in the United States under both the Code and ERISA, and we implement processes to protect and preserve this status. However, the U.S. Department of Labor has issued guidance that certain entities in the HR outsourcing industry do not qualify as common law employers of WSEs for ERISA purposes. If we were found not to be an employer under the Code, our WSEs may not receive the favorable tax treatment for any plans intended to qualify under Section 401 of the Code, including our 401(k) plans and cafeteria plans, which could have a material adverse effect on our business. If we were found not to be an employer for ERISA purposes, our plans would not comply with ERISA, and fines and penalties could be imposed. In addition, if we were found not to be an employer for
17
Table of Contents
ERISA purposes, we and our plans would not enjoy the full preemption of state laws provided by ERISA and could be subject to varying state laws and regulations, including laws governing multiple employer welfare arrangements, or MEWAs, as well as to claims based upon state laws.
We and our clients could be adversely impacted by health care reform.
The Patient Protection and Affordable Care Act and the Heath Care and Education Reconciliation Act of 2010, which we refer to collectively as the Act, entail sweeping health care reforms with staggered effective dates from 2010 through 2018, and many provisions of the Act require the issuance of additional guidance from the U.S. Departments of Labor and Health and Human Services, the Internal Revenue Service, or IRS, and U.S. states. Beginning in 2014, a number of key provisions of the Act take effect, including the establishment of state insurance exchanges, insurance market reforms, “pay or play” penalties on large employers and the imposition of excise taxes on the health insurance industry and reinsurance taxes on insurers and third-party administrators. Collectively, these items have the potential to significantly change the insurance marketplace for employers and how employers provide insurance to employees.
As a co-employer of our clients’ WSEs, we assume or share many of the employer-related responsibilities and legal risks and assist our clients in complying with many employment-related governmental regulations. Generally, the Act and subsequently issued guidance by the IRS and the U.S. Department of Health and Human Services have not addressed, or in some instances are unclear, as to their application in the co-employment relationship. For example, the Act provides for a small business tax credit for eligible companies offering health care coverage to employees. We believe that these tax credits are available to our clients that meet the qualification requirements; however, the Act and subsequently issued IRS guidance do not expressly address the issue of whether small business clients of a professional employer organization may still qualify as small business eligible for such tax credits. As a result of this uncertainty, we are not yet able to determine the impacts to our business, and to our clients, resulting from the Act. In future periods, the changes may result in increased costs to us and our clients and could affect our ability to attract and retain clients. Additionally, we may be limited or delayed in our ability to increase service fees to offset any associated potential increased costs resulting from compliance with the Act. Furthermore, the uncertainty surrounding the terms and application of the Act may delay or inhibit the decisions of potential clients to outsource their HR needs. Any of these developments could harm our business, results of operations and financial condition.
We may have additional tax liabilities, which could harm our business, operating results, financial condition and prospects.
Significant judgments and estimates are required in determining our provision for income taxes and other tax liabilities. Our provision for income taxes, results of operations and cash flows may be impacted if any of our tax positions are challenged and successfully disputed by the tax authorities. In determining the adequacy of our tax provision, we assess the likelihood of adverse outcomes that could result if our tax positions were challenged by the IRS and other tax authorities. The tax authorities in the United States regularly examine our income and other tax returns. For example, in connection with an IRS examination of prior federal income tax returns filed by Gevity, a company we acquired in 2009, we recently received a technical advice memorandum from the IRS taking the position that approximately $10.1 million of tax credits taken by Gevity, and an additional approximately $2.0 million taken by us after acquiring Gevity, should be reversed, which position we dispute. The ultimate outcome of these examinations and tax disputes cannot be predicted with certainty. Should the IRS or other tax authorities assess additional taxes as a result of examinations, we may be required to record charges to operations that could have a material impact on our results of operations, financial position or cash flows.
Our business and operations have experienced rapid growth in recent periods, and if we are unable to effectively manage this growth, our business and results of operations may suffer.
We have experienced rapid growth and have significantly expanded our operations in recent periods, which has placed a strain on our management, administrative, operational and financial infrastructure. Managing this growth requires us to further refine our operational, financial and management controls and reporting systems and procedures.
18
Table of Contents
Our ability to effectively manage any significant growth of our business will depend on a number of factors, including our ability to do the following:
| • | effectively recruit, integrate, train and motivate a large number of new employees, including our direct sales force, while retaining our existing employees, maintaining the beneficial aspects of our corporate culture and effectively executing our business plan; |
| • | satisfy our existing clients and identify and acquire new clients; |
| • | enhance the breadth and quality of our services; |
| • | continue to improve our operational, financial and management controls; and |
| • | make sound business decisions in light of the scrutiny associated with operating as a public company. |
These activities will require significant operating and capital expenditures and allocation of valuable management and employee resources, and we expect that our growth will continue to place significant demands on our management and on our operational and financial infrastructure.
Our future financial performance and our ability to execute on our business plan will depend, in part, on our ability to effectively manage any future growth. We cannot assure you that we will be able to do so in an efficient or timely manner, or at all. In particular, any failure to successfully implement systems enhancements and improvements will likely negatively impact our ability to manage our expected growth, ensure uninterrupted operation of key business systems and comply with the rules and regulations that are applicable to public companies. If we fail to manage our growth effectively, our costs and expenses may increase more than we expect them to, which in turn could harm our business, results of operations and financial condition.
We may not be able to sustain our revenue growth rate or profitability in the future.
While we have achieved profitability on an annual basis in each of the last two and four of the last five fiscal years, we expect our operating expenses to increase substantially in the near term, particularly as we make significant investments in our sales and marketing organization, expand our operations and infrastructure and enhance the breadth and quality of our services. If our revenues do not increase to offset these increases in our operating expenses, we may not be profitable in future periods.
Moreover, you should not consider our historical revenue growth to be indicative of our future performance. As we grow our business, our revenue growth rates may slow in future periods due to a number of reasons, which may include slowing demand for our services, increasing competition, a decrease in the growth of our overall market, our failure, for any reason, to continue to capitalize on growth opportunities, the maturation of our business or the decline in the number of SMBs in our target markets.
Our industry is highly competitive, which may limit our ability to maintain or increase our market share or improve our results of operations.
We face significant competition on a national and regional level from a number of companies purporting to deliver a range of bundled services that are generally similar to the services we provide, including large professional employer organizations such as the TotalSource unit of Automatic Data Processing, Inc. and Insperity, Inc., as well as specialized and small professional employer organization service providers. If and to the extent that we and other companies providing these services are successful in growing our businesses, we anticipate that future competitors will enter this industry. Some of our current, and any future, competitors have or may have greater marketing and financial resources than we do, and may be better positioned than we are in certain markets. Increased competition in our industry could result in price reductions or loss of market share, any of which could harm our business. We expect that we will continue to experience competitive pricing pressure. If we cannot compete effectively, our market share, business, results of operations and financial condition may suffer.
19
Table of Contents
In addition to competition from other professional employer organizations, we also face competition in the form of companies and third parties serving HR needs in traditional manners. These forms of competition include:
| • | HR and information systems departments and personnel of companies that perform their own administration of benefits, payroll and other HR functions; |
| • | providers of certain endpoint HR services, including payroll, benefits and business process outsourcers with high-volume transaction and administrative capabilities, such as Automatic Data Processing, Inc., Paychex, Inc. and other third-party administrators; and |
| • | benefits exchanges that provide benefits administration services over the Internet to companies that otherwise maintain their own benefit plans. |
We believe that our services are attractive to many SMBs in part because of our ability to provide workers compensation, health care and other benefits programs to them on a cost-effective basis. We compete with insurance brokers and other providers of this coverage in this regard, and our offerings must be priced competitively with those provided by these competitors in order for us to attract and retain our clients.
We may not be successful in convincing potential clients that the use of our services is a superior, cost-effective means of satisfying their HR obligations relative to the way in which they currently satisfy these obligations.
If we cannot compete effectively against other professional employer organizations or against the alternative means by which companies meet their HR obligations, our market share, business, results of operations and financial condition may suffer.
Adverse changes in our relationships with key vendors could impair the quality of our solution.
Our success depends in part on our ability to establish and maintain arrangements and relationships with vendors that supply us with essential components of our services. These service providers include insurance carriers to provide health and workers compensation insurance coverage for WSEs, as well as other vendors such as couriers used to deliver client payroll checks and banks used to electronically transfer funds from clients to their employees. Failure by these service providers, for any reason, to deliver their services in a timely manner could result in material interruptions to our operations, impact client relations, and result in significant penalties or other liabilities to us. Our agreements with many of these service providers typically have a term of one year. However, we engage some service providers, such as payroll couriers, on an as needed basis at published rates. In addition, many of our employee benefit plan agreements may be terminated by the insurance companies on 90 days’ notice. If any of these vendors decided to terminate its relationship with us, we may have difficulty obtaining replacement services at reasonable rates or on a timely basis, if at all. The loss of any one or more of our key vendors, or our inability to partner with certain vendors that are better-known or more desirable to our clients or potential clients, could impair the quality of our solution and harm our business.
We depend on licenses to third-party software in order to provide our services.
We license a substantial portion of the software on which we depend to provide services to our clients from third-party vendors, including Oracle America, Inc. If we are unable to maintain these licenses, or if we are required to make significant changes in the terms and conditions of these licenses, we may need to seek replacement vendors or change our software architecture to address licensing revisions with our current vendors, either of which could increase our expenses and impair the quality of our services. In addition, we cannot assure you that our key vendors will continue to support their technology. Financial or other difficulties experienced by these vendors may adversely affect the technologies we incorporate into our products and services. If this software ceases to be available, we may be unable to find suitable alternatives on reasonable terms, or at all.
20
Table of Contents
If we are deemed to be an insurance agent or third-party administrator, we may incur significant additional costs and expenses, which could harm our results of operations.
State regulatory authorities generally require licenses for companies that do business in their states as insurance agents or third-party administrators, such as those that handle health or retirement plan funding and claim processing. Insurance and third-party administrator regulation covers a host of activities, including sales, underwriting, rating, claims payments and record keeping by companies and agents. We do not believe that our services constitute acting as an insurance agent or third-party administrator. If regulatory authorities in any state determine that the nature of our business requires that we be licensed as an insurance agent or as a third-party administrator, we may need to hire additional personnel to manage regulatory compliance and become obligated to pay annual regulatory fees, which could adversely affect our results of operations.
Most of our clients are concentrated in a relatively small number of industries, making us vulnerable to downturns in those industries.
Most of our clients operate in the technology, life sciences, property management, professional services, banking and financial services, retail, manufacturing and hospitality services industries. As a result, if any of those industries suffers a downturn, the portion of our business attributable to clients in that industry could be adversely affected. For example, in July 2013, we acquired Ambrose Employer Group, LLC, a New York-based company that provides HR services primarily to WSEs in the financial services industry in the New York area, which we refer to as Ambrose. If the financial services industry were to suffer a downturn similar to the one that began in the fall of 2008, our Ambrose product line would likely suffer.
We have a substantial amount of indebtedness, which could adversely affect our financial condition and our operating flexibility.
As of September 30, 2013, we had $820.0 million in outstanding indebtedness under our credit facility, all of which was secured indebtedness of our subsidiary, TriNet HR Corporation, guaranteed on a senior secured basis by us and certain of our subsidiaries. In August 2013, we entered into two new credit facilities, the proceeds of which we used to repay approximately $448.3 million of indebtedness outstanding under the previous credit facility, declare a special dividend, issue letters of credit and pay transaction costs. Our level of indebtedness and the limitations imposed on us by our credit facilities could affect our business in various ways, including the following:
| • | we will have to use a portion of our cash flows from operating activities for debt service rather than for other operational activities; |
| • | we may not be able to borrow additional funds or obtain additional financing for future working capital, acquisitions, capital expenditures or other corporate purposes, or may have to pay more for such financing; |
| • | some or all of the indebtedness under our current or future credit facilities bears interest at variable interest rates, making us more vulnerable to interest rate increases; |
| • | we could be less able to take advantage of significant business opportunities, such as acquisition opportunities, and to react to changes in market or industry conditions; and |
| • | we may be more vulnerable to general adverse economic and industry conditions as a result of our inability to reduce our debt service costs in response to reduced revenues. |
Because borrowings under each of our credit facilities bear interest at variable rates, our interest expense could increase even though the amount borrowed remains the same, exacerbating these risks. Our ability to meet these expenses depends on our future business performance, which will be affected by various factors, including the risks described in this “Risk Factors” section. We are not able to control many of these factors, such as economic conditions in the markets where we operate and pressure from competitors. Our operations may provide insufficient cash to pay the principal and interest on our credit facility and to meet our other debt obligations. If so, we may be required to refinance all or part of our existing indebtedness or borrow additional funds, which we may not be able to do on terms that are acceptable to us, if at all. In addition, the terms of our existing or future debt agreements may
21
Table of Contents
restrict our ability to take some or all of these responsive actions. If we were unable to pay the principal and interest on our credit facility or meet our other debt obligations, the lenders under our credit facility could terminate their commitments to extend further credit to us and accelerate a substantial part of our indebtedness. If that were to happen, we may not be able to repay all of the amounts that would become due under our indebtedness or refinance our debt. If we were unable to repay those amounts or refinance our debt, the lenders under each of our credit facilities could proceed against the collateral granted to them to secure that indebtedness. If that were to happen, our results of operations and financial condition could be harmed and we might be forced to seek bankruptcy protection.
The terms of our credit facilities may restrict our current and future operations, which would impair our ability to respond to changes in our business and to manage our business.
Our credit facilities contain, and any future indebtedness of ours would likely contain, a number of restrictive covenants that impose significant operating and financial restrictions on us, including restricting our ability to:
| • | incur, assume or guarantee additional debt; |
| • | pay dividends or distributions or redeem or repurchase capital stock; |
| • | incur or assume liens; |
| • | make loans, investments and acquisitions; |
| • | engage in sales of assets and subsidiary stock; |
| • | enter into sale-leaseback transactions; |
| • | enter into certain transactions with affiliates; |
| • | complete dividends, loans or asset transfers from our subsidiaries; |
| • | enter into new lines of business; |
| • | prepay other indebtedness; |
| • | transfer all or substantially all of our assets or enter into merger or consolidation transactions with another person; and |
| • | make capital expenditures. |
Under the revolving credit facility, we are required to comply with a financial covenant that requires us and our subsidiaries to maintain a maximum leverage ratio so long as there is any indebtedness outstanding under the revolving credit facility (excluding letters of credit issued and outstanding of up to $15.0 million other than letters of credit that have been cash collateralized). Our ability to meet the leverage ratio can be affected by events beyond our control, and we may be unable to comply with it. Our failure to comply with this financial covenant or other restrictive covenants under our credit facilities and other debt instruments could result in a default under each of our credit facilities and/or other debt instruments, which in turn could result in the termination of the lenders’ commitments to extend further credit to us under our revolving credit facility and acceleration of a substantial portion of our indebtedness then outstanding under each of our credit facilities. If that were to happen, we may not be able to repay all of the amounts that would become due under our indebtedness or refinance our debt. If we were unable to repay those amounts or refinance our debt, the lenders under either of our credit facilities could proceed against the collateral granted to them to secure that indebtedness. If that were to happen, our results of operations and financial condition could be harmed and we might be forced to seek bankruptcy protection.
Volatility in the financial and economic environment could harm our business.
Demand for our services is sensitive to changes in the level of overall economic activity in the markets in which we operate. During periods of weak economic conditions, employment levels tend to decrease, small business failures tend to increase and interest rates may become more volatile. Current or potential clients may also react to weak economic conditions or forecasted weak economic conditions by reducing their employee headcount
22
Table of Contents
or by lowering their wage, bonus or benefits levels, any of which would affect our revenues, and may affect our margins, because we may be unable to reduce our selling, administrative or other expenses sufficient to offset the drop in revenues. It is difficult for us to forecast future demand for our services due to the inherent difficulty in forecasting the direction and strength of economic cycles. These conditions may affect the willingness of our clients and potential clients to pay outside vendors for services like ours, and may impact their ability to pay their obligations to us on time, or at all. In addition, if businesses have difficulty obtaining credit, business growth and new business formation may be impaired, which could also harm our business. Even modest downturns in economic activity or the availability of credit on a regional or national level could harm our business.
If we fail to retain our key personnel or fail to attract additional skilled personnel, our business may suffer.
Our operations are dependent on the continued efforts of our officers and executive management and the performance and productivity of our regional managers and field personnel. Our ability to attract and retain business depends on the quality of our services and the relationships that we maintain with our clients. If we lose key personnel with significant experience in managing our business, this could impair our ability to deliver services effectively or profitably, could divert other senior management time in seeking replacements, and could adversely affect our reputation with our clients and potential clients. Some of our most important client relationships depend on the continued involvement of individual managers or sales personnel, and any loss of those individuals could jeopardize those relationships and in turn adversely affect our operating results.
Our future success will depend on our ability to attract, hire, train and retain highly skilled technical, sales and marketing and support personnel, particularly with expertise in outsourced solutions and the technology platforms that we deploy today and will deploy in the future. Qualified personnel are in great demand throughout the HR industry. Our failure to attract and retain the appropriate personnel may limit the rate at which we can expand our business, including developing new services and attracting new clients.
Improper disclosure of sensitive or confidential company, employee or client data, including personal data, could result in liability and harm our reputation.
Our business involves the use, storage and transmission of information about our corporate employees, WSEs and clients. This information includes sensitive or confidential data, such as employees’ Social Security numbers, bank account numbers, retirement account information and medical information. We and our third-party service providers have established policies and procedures to help protect the security and privacy of this information, but it is possible that our security controls over sensitive or confidential data may not prevent the improper access to or disclosure of this information. Third parties, including vendors that provide services for our operations, could also be a source of security risk to us in the event of a failure of their own security systems and infrastructure. Any such disclosure could harm our reputation and expose us to liability under our contracts and under the many and sometimes contradictory laws and regulations regarding data privacy in the various markets in which we operate. Any failure to adhere to applicable laws and regulations or to our contractual commitments with respect to the preservation and use of confidential information could result in legal liability and could damage our reputation.
Any failure in our business systems could reduce the quality of our business services, which could harm our reputation and expose us to liability.
Our business systems rely on the complex integration of numerous hardware and software subsystems to manage the transactions involved in managing the client relationship through the processing of employee, payroll and benefits data. These systems can be disrupted by, among other things, equipment failures, computer server or systems failures, network outages, malicious acts, software errors or defects, vendor performance problems and power failures. Any delay or failure in our systems that impairs our ability to communicate electronically with our clients, employees or vendors or our ability to store or process data could harm our reputation and our business. If we are unable to meet client demands or service expectations, we may lose existing clients and we may have difficulty attracting new clients. In addition, errors in our products and services, such as the erroneous denial of healthcare benefits or delays in making payroll, could expose our clients to liability claims from improperly serviced WSEs, for which we are contractually obligated to provide indemnification.
23
Table of Contents
We have disaster recovery, business continuity, and crisis management plans and procedures designed to protect our business against a multitude of events, including natural disasters, military or terrorist actions, power or communication failures, or similar events. Despite our preparations, our plans may not be successful in preventing the loss of client data, service interruptions, and disruptions to our operations, or damage to our important facilities. The precautions that we have taken to protect ourselves against these types of events may prove to be inadequate. If we suffer damage to our data or operations centers, experience a telecommunications failure or experience a security breach, our operations could be interrupted. Any interruption or other loss may not be covered by our insurance and could harm our reputation.
If our systems were to fail for any of these reasons during payroll processing, preventing the proper payment of employees, or the proper remission of payroll taxes, we could be liable for wage payment delay penalties and payroll tax penalties, as well as other contractual penalties. Any inaccuracies in the processing of health insurance benefits could result in our being liable for lapses in insurance. If any of our systems fails to operate properly or becomes disabled even for a brief period of time, we could suffer financial loss, a disruption of our businesses, liability to clients, regulatory intervention, or damage to our reputation.
Security breaches could compromise our data and the data of our clients and WSEs, exposing us to liability, which would cause our business and reputation to suffer.
Our ability to ensure secure electronic processing, maintenance and transmission of payroll, insurance and other sensitive client and WSE information is critical to our operations. We rely on standard internet and other security systems to provide the security and authentication necessary to effect secure transmission of data. Despite our security measures, our information technology and infrastructure may be vulnerable to cybersecurity threats, including attacks by hackers and other malfeasance. Any such security breach could compromise our networks and result in the information stored or transmitted there to be accessed, publicly disclosed, lost or stolen. Any such access, disclosure or other loss of information could result in legal claims or proceedings leading to liability, including under laws that protect the privacy of personal information, disrupt our operations and the services we provide to our clients, damage our reputation and cause a loss of confidence in our products and services, which could adversely affect our business, operations and competitive position.
In the course of providing our services to our clients, we also rely on certain third-party service providers and products, such as insurance carriers, to process information related to our clients and WSEs. Through contractual provisions, we take steps to require that our service providers protect sensitive information. However, we cannot provide assurances as to the security steps taken by such providers. Any security breach or other disruption of our third-party service providers that results in an inadvertent disclosure or loss of confidential information could adversely affect our reputation and our business.
We must keep pace with rapid technological change in order to succeed.
Our business depends upon the use of software, hardware and networking technologies that must be frequently and rapidly upgraded in response to technological advances, competitive pressures and consumer expectations. To succeed, we will need to effectively develop or license and integrate these new technologies as they become available to improve our services commensurate with client requirements. In particular, we rely on enterprise software applications licensed from third parties that are upgraded from time to time, such as PeopleSoft HR information systems and Oracle databases, that provide the basis for our HR information system platform supporting payroll, benefits and other HR functions. Any difficulties we encounter in adapting applications upgrades to our systems could harm our performance or delay or prevent the successful development, introduction or marketing of new services. New products or upgrades may not be released according to schedule, or may contain defects when released. Difficulties in integrating new technologies could result in adverse publicity, loss of sales, delay in market acceptance of our services, or client claims against us, any of which could harm our business. We could also incur substantial costs in modifying our services or infrastructure to adapt to these changes. In addition, we could lose market share if our competitors develop technologically superior products and services.
24
Table of Contents
Our co-employment relationship with our worksite employees exposes us to business risks.
We are a co-employer of our WSEs, and there is a possibility that we may be subject to liability for violations of employment laws by our clients and acts or omissions of our WSEs, who may be deemed to be our agents, even if we do not participate in any such acts or violations. Such laws include, but are not limited to, laws relating to payment of wages, employment discrimination, labor relations and whistleblower protection. Although our client agreements establish the contractual division of responsibilities between us and our clients for various personnel management matters, including compliance with and liability under various governmental regulations, as well as providing for clients to indemnify us for any liability attributable to clients’ or their employees’ conduct, we may not be able to effectively enforce or collect these contractual obligations with our clients, which could harm our business. We maintain employment practices liability insurance coverage (including coverages for our clients) to manage our and our clients’ exposure for various employee-related claims, and as a result, our incurred costs with respect to this exposure have historically been insignificant to our operating results. Employment practices liability insurance generally excludes coverage for claims relating to compliance with laws associated with the classification of employees as exempt or non-exempt, such as overtime pay and minimum wage law compliance. We cannot assure you that our insurance will be sufficient in amount or scope to cover all claims that may be asserted against us and for which we are unable to obtain indemnification from our clients. If judgments or settlements related to WSEs that we and our clients employ exceed our insurance coverage, it could harm our results of operations and financial condition. We cannot assure you that we will be able to obtain appropriate types and levels of insurance in the future, that we will be able to replace existing policies on acceptable terms, or at all, or that our insurers will be able to pay all claims that we may make under our policies, any of which could harm our business.
Our failure to maintain or enhance our reputation or brand recognition could harm our business.
We believe that maintaining and enhancing our reputation and the TriNet brand identity is critical to maintaining our relationships with our clients and vendors and our ability to attract new clients and vendors. We also believe that our reputation and brand identity will become more important as competition in our industry continues to develop. Our ability to maintain and enhance our reputation and brand identity will be affected by a number of factors, some of which are beyond our control, including:
| • | the effectiveness of our marketing efforts; |
| • | our ability to attract and retain new sales personnel to expand our direct sales force; |
| • | our ability to retain our existing clients and attract new clients; |
| • | the quality and perceived value of our services; |
| • | our ability to successfully differentiate our services from those of our competitors; |
| • | actions of our competitors and other third parties; |
| • | positive or negative publicity about us or our industry in general; |
| • | interruptions, delays or attacks on our website; and |
| • | litigation or regulatory developments. |
Any brand promotion activities in which we engage may not be successful or yield increased revenues. Furthermore, negative publicity, whether or not justified, relating to events or activities attributed to us, our corporate employees, our WSEs, our vendors, other companies in our industry or others associated with any of these parties, may tarnish our reputation and reduce the value of our brand. Damage to our reputation and loss of brand equity may reduce demand for our services and harm our business, results of operations and financial condition. Moreover, any attempts to rebuild our reputation and restore the value of our brand may be costly and time-consuming, and any such efforts may not ultimately be successful.
25
Table of Contents
If we are unable to protect our intellectual property, or if we infringe on the intellectual property rights of others, our business may be harmed.
Our success depends in part on intellectual property rights to the services that we develop. We rely on a combination of contractual rights, including non-disclosure agreements, trade secrets, copyrights and trademarks, to establish and protect our intellectual property rights in our names, services, methodologies and related technologies. If we lose intellectual property protection or the ability to secure intellectual property protection on any of our names, confidential information or technology, this could harm our business. Our intellectual property rights may not prevent competitors from independently developing services and methodologies similar to ours, and the steps we take might be inadequate to deter infringement or misappropriation of our intellectual property by competitors, former employees or other third parties, any of which could harm our business. We do not currently have any registered patents or pending patent applications covering any of our technology. We own registered trademarks in the United States and Canada that have various expiration dates unless renewed through customary processes. Our trademark registrations may be unenforceable or ineffective in protecting our trademarks. Our trademarks may be unenforceable in countries outside of the United States, which may adversely affect our ability to build our brand outside of the United States.
Although we believe that our conduct of our business does not infringe on the intellectual property rights of others, third parties may nevertheless assert infringement claims against us in the future. We may be required to modify our products, services, internal systems or technologies, or obtain a license to permit our continued use of those rights. We may be unable to do so in a timely manner, or upon reasonable terms and conditions, which could harm our business. In addition, future litigation over these matters could result in substantial costs and resource diversion. Adverse determinations in any litigation or proceedings of this type could subject us to significant liabilities to third parties and could prevent us from using some of our services, internal systems or technologies.
Our use of open source software could subject us to possible litigation.
A portion of our technologies incorporates open source software, and we expect to continue to incorporate open source software into our platform in the future. Few of the licenses applicable to open source software have been interpreted by courts, and their application to the open source software integrated into our proprietary technology platform may be uncertain. If we fail to comply with these licenses, then pursuant to the terms of these licenses, we may be subject to certain requirements, including requirements that we make available the source code for our software that incorporates the open source software. We cannot assure you that we have not incorporated open source software in our software in a manner that is inconsistent with the terms of the applicable licenses or our current policies and procedures. If an author or other third party that distributes such open source software were to allege that we had not complied with the conditions of one or more of these licenses, we could incur significant legal expenses defending against such allegations. Litigation could be costly for us to defend, have a negative effect on our operating results and financial condition or require us to devote additional research and development resources to change our technology platform.
If we are unable to implement and maintain effective internal control over financial reporting in the future, investors may lose confidence in the accuracy and completeness of our financial reports and the market price of our common stock may be negatively affected.
As a public company, we will be required to maintain internal control over financial reporting and to report any material weaknesses in such internal controls. Section 404 of the Sarbanes-Oxley Act requires that we evaluate and determine the effectiveness of our internal control over financial reporting and, beginning with our annual report for the year ending December 31, 2015, provide a management report on our internal control over financial reporting. This report must be attested to by our independent registered public accounting firm. If we have a material weakness in our internal control over financial reporting, we may not detect errors on a timely basis and our financial statements may be materially misstated.
We are in the process of designing and implementing our internal control over financial reporting, which process will be time consuming, costly and complicated. If we identify material weaknesses in our internal
26
Table of Contents
control over financial reporting in the future, we are unable to comply with the requirements of Section 404 in a timely manner, we are unable to assert that our internal control over financial reporting is effective or our independent registered public accounting firm is unable to express an opinion as to the effectiveness of our internal control over financial reporting when required to do so, investors may lose confidence in the accuracy and completeness of our financial reports and the market price of our common stock could be negatively affected, and we could become subject to investigations by the stock exchange on which our securities are listed, the Securities and Exchange Commission, or SEC, or other regulatory authorities, which could require additional financial and management resources.
If we are unable to successfully remediate the existing material weakness in our internal control over financial reporting, the accuracy and timing of our financial reporting may be adversely affected.
In preparing and reviewing our consolidated financial statements as of and for the nine months ended September 30, 2013, we and our independent registered public accounting firm identified a material weakness in our internal control over financial reporting. A material weakness is a deficiency, or a combination of deficiencies, in internal control over financial reporting such that there is a reasonable possibility that a material misstatement of our financial statements will not be prevented or detected on a timely basis. The material weakness identified related to our incorrectly recording a deferred tax asset in connection with our accounting for our acquisition of Ambrose that should have been reported as goodwill. As a result, there were adjustments required in connection with closing our books and records and preparing our consolidated financial statements for the nine months ended September 30, 2013.
In response to this material weakness, we plan to hire additional personnel to build our financial management and reporting infrastructure, and further develop and document our accounting policies and financial reporting procedures. However, we cannot assure you that we will be successful in pursuing these measures or that these measures will significantly improve or remediate the material weakness described above. We also cannot assure you that we have identified all of our existing material weaknesses, or that we will not in the future have additional material weaknesses.
Neither we nor our independent registered public accounting firm has performed an evaluation of our internal control over financial reporting during any period in accordance with the provisions of the Sarbanes-Oxley Act. In light of the material weakness that was identified as a result of the limited procedures performed, we believe that it is possible that, had we and our independent registered public accounting firm performed an evaluation of our internal control over financial reporting in accordance with the provisions of the Sarbanes-Oxley Act, additional material weaknesses or significant control deficiencies may have been identified.
If we fail to remediate the material weakness or to meet the demands that will be placed upon us as a public company, including the requirements of the Sarbanes-Oxley Act, we may be unable to accurately report our financial results, or report them within the timeframes required by law or stock exchange regulations. Failure to comply with Section 404 of the Sarbanes-Oxley Act could also potentially subject us to sanctions or investigations by the SEC or other regulatory authorities. We cannot assure you that we will be able to remediate the material weakness in a timely manner, or at all, or that in the future, additional material weaknesses will not exist or otherwise be discovered. If our efforts to remediate the material weakness identified are not successful, or if other material weaknesses or other significant control deficiencies occur, our ability to accurately and timely report our financial results could be impaired, which could result in late filings of our annual and quarterly reports under the Securities Exchange Act of 1934, as amended, or the Exchange Act, restatements of our consolidated financial statements, a decline in our stock price, suspension or delisting of our common stock from the , and could adversely affect our reputation, results of operations and financial condition.
We will incur substantial increased costs as a result of being a public company.
As a public company, we will incur significant levels of legal, accounting and other expenses that we did not incur as a private company. We will be subject to the reporting requirements of the Exchange Act, the Sarbanes-Oxley Act, the Dodd-Frank Act, the listing requirements of and other applicable securities
27
Table of Contents
rules and regulations. Compliance with these rules and regulations will increase our legal and financial compliance costs, make some activities more difficult, time-consuming or costly and increase demand on our systems and resources. The Exchange Act requires, among other things, that we file annual, quarterly and current reports with respect to our business and results of operations. The Sarbanes-Oxley Act requires, among other things, that we maintain effective disclosure controls and procedures and internal control over financial reporting. In order to maintain and, if required, improve our disclosure controls and procedures and internal control over financial reporting to meet this standard, significant resources and management oversight may be required. As a result, management’s attention may be diverted from other business concerns, which could adversely affect our business and results of operations. Although we have already hired additional corporate employees to comply with these requirements, we may need to hire more corporate employees in the future or engage outside consultants, which would increase our costs and expenses.
In addition, changing laws, regulations and standards relating to corporate governance and public disclosure are creating uncertainty for public companies, increasing legal and financial compliance costs and making some activities more time-consuming. These laws, regulations and standards are subject to varying interpretations, in many cases due to their lack of specificity, and, as a result, their application in practice may evolve over time as new guidance is provided by regulatory and governing bodies. This could result in continuing uncertainty regarding compliance matters and higher costs necessitated by ongoing revisions to disclosure and governance practices. We intend to invest resources to comply with evolving laws, regulations and standards, and this investment may result in increased general and administrative expenses and a diversion of management’s time and attention from revenue-generating activities to compliance activities. If our efforts to comply with new laws, regulations and standards differ from the activities intended by regulatory or governing bodies due to ambiguities related to their application and practice, regulatory authorities may initiate legal proceedings against us and our business may be adversely affected.
We also expect that being a public company and these new rules and regulations will make it more expensive for us to obtain director and officer liability insurance, and we may be required to accept reduced coverage or incur substantially higher costs to obtain coverage. These factors could also make it more difficult for us to attract and retain qualified members of our board of directors, particularly to serve on our audit committee and compensation committee, and qualified executive officers.
As a result of disclosure of information in this prospectus and in the filings that we will be required to make as a public company, our business, results of operations and financial condition will become more visible, which may result in threatened or actual litigation, including by competitors and other third parties. If any such claims are successful, our business, results of operations and financial condition could be adversely affected, and even if the claims do not result in litigation or are resolved in our favor, these claims, and the time and resources necessary to resolve them, could divert the resources of our management and adversely affect our business, results of operations and financial condition.
Risks Related to This Offering and Ownership of Our Common Stock
There has been no prior market for our common stock. An active market for our common stock may not develop or be sustainable and investors may not be able to resell their shares at or above the initial public offering price.
There has been no public market for our common stock prior to this offering. The initial public offering price for our common stock will be determined through negotiations between the representatives of the underwriters and us and may vary from the market price of our common stock following this offering. If you purchase shares of our common stock in this offering, you may not be able to resell those shares at or above the initial public offering price. An active or liquid market in our common stock may not develop upon completion of this offering or, if it does develop, it may not be sustainable.
28
Table of Contents
Our stock price may be volatile or may decline regardless of our operating performance, resulting in substantial losses for investors purchasing shares in this offering.
The initial public offering price for the shares of our common stock sold in this offering will be determined by negotiation between the representatives of the underwriters and us. This price may not reflect the market price of our common stock following this offering. In addition, we expect the market price of our common stock may be volatile for the foreseeable future. The market price of our common stock may fluctuate significantly in response to numerous factors, many of which are beyond our control, including the factors listed below and other factors described in this “Risk Factors” section:
| • | actual or anticipated fluctuations in our results of operations; |
| • | any financial projections we provide to the public, any changes in these projections or our failure to meet these projections; |
| • | failure of securities analysts to initiate or maintain coverage of our company, changes in financial estimates by any securities analysts who follow our company, or our failure to meet these estimates or the expectations of investors; |
| • | ratings changes by any securities analysts who follow our company; |
| • | announcements by us or our competitors of significant innovations, acquisitions, strategic partnerships, joint ventures or capital commitments; |
| • | changes in operating performance and stock market valuations of other business services companies generally, or those in our industry in particular; |
| • | price and volume fluctuations in the overall stock market, including as a result of trends in the economy as a whole; |
| • | changes in our board of directors or management; |
| • | sales of large blocks of our common stock, including sales by our executive officers, directors and significant stockholders; |
| • | lawsuits threatened or filed against us; |
| • | short sales, hedging and other derivative transactions involving our capital stock; |
| • | general economic conditions in the United States and abroad; and |
| • | other events or factors, including those resulting from war, incidents of terrorism or responses to these events. |
In addition, stock markets have experienced extreme price and volume fluctuations that have affected and continue to affect the market prices of equity securities of many business services companies. Stock prices of many business services companies have fluctuated in a manner unrelated or disproportionate to the operating performance of those companies. In the past, stockholders have instituted securities class action litigation following periods of market volatility. If we were to become involved in securities litigation, it could subject us to substantial costs, divert resources and the attention of management from our business and adversely affect our business, results of operations and financial condition.
Substantial future sales of shares of our common stock could cause the market price of our common stock to decline.
Sales of a substantial number of shares of our common stock in the public market after this offering, or the perception that these sales might occur, could depress the market price of our common stock and impair our ability to raise capital through the sale of additional equity securities. We cannot predict the effect that such sales may have on the prevailing market price of our common stock.
All of our executive officers, senior management and directors and substantially all of the holders of our capital stock are subject to lock-up agreements that restrict their ability to transfer shares of our capital stock for 180 days from the date of this prospectus. Approximately shares of our common stock will become
29
Table of Contents
eligible for sale upon expiration of the 180-day lock-up period. J.P. Morgan Securities LLC and Morgan Stanley & Co. LLC may, in their sole discretion, permit the parties to these lock-up agreements to sell shares prior to the expiration of the lock-up agreements.
In addition, as of September 30, 2013, there were 3,343,372 shares of common stock subject to outstanding options and 3,266 shares of common stock issuable upon settlement of restricted stock units. We intend to register all of the shares of common stock issuable upon exercise of these outstanding options and settlement of these outstanding restricted stock units, and upon exercise or settlement of any options or other equity incentives we may grant in the future, for public resale under the Securities Act of 1933, as amended. Accordingly, these shares will be able to be freely sold in the public market upon issuance as permitted by any applicable vesting requirements, subject to the lock-up agreements described above. These shares will become eligible for sale in the public market to the extent such options are exercised or such restricted stock units settle, subject to the lock-up agreements described above and compliance with applicable securities laws.
Holders of 19,032,854 shares of common stock issuable upon conversion of outstanding preferred stock as of September 30, 2013, and without giving effect to the sale of shares in this offering by the selling stockholders, have rights, subject to some conditions, to require us to file registration statements for the public resale of the common stock issuable upon conversion of such shares or to include such shares in registration statements that we may file for TriNet or our stockholders.
Purchasers in this offering will experience immediate and substantial dilution in the book value of their investment.
The initial public offering price of our common stock will be substantially higher than the pro forma net tangible book value per share of our common stock outstanding immediately following this offering. Therefore, if you purchase shares of our common stock in this offering at a price of $ , which is the midpoint of the estimated offering price range set forth on the cover page of this prospectus, you will experience immediate dilution of $ per share, the difference between the price per share you pay for our common stock and its pro forma net tangible book value per share as of September 30, 2013, after giving effect to the issuance of shares of our common stock in this offering. This dilution is due in large part to the fact that our earlier investors paid substantially less than the initial public offering price when they purchased their shares of our common stock. In addition, we have issued options and a warrant to acquire our common stock at prices significantly below the initial public offering price. To the extent that outstanding options and the warrant are ultimately exercised, there will be further dilution to investors purchasing our common stock in this offering. In addition, if the underwriters exercise their option to purchase additional shares from us or if we issue additional equity securities, you will experience additional dilution.
Future sales and issuances of our capital stock or rights to purchase our capital stock could result in additional dilution of the percentage ownership of our stockholders and could cause our stock price to decline.
We may issue additional securities after this offering. Future sales and issuances of our capital stock or rights to purchase our capital stock could result in substantial dilution to our existing stockholders. We may sell common stock, convertible securities and other equity securities in one or more transactions at prices and in a manner as we may determine from time to time. If we sell any such securities in subsequent transactions, investors may be materially diluted. New investors in these subsequent transactions could gain rights, preferences and privileges senior to those of holders of our common stock.
The existing ownership of capital stock by our executive officers, directors and their affiliates has the effect of concentrating voting control with our executive officers, directors and their affiliates for the foreseeable future, which will limit your ability to influence corporate matters.
Upon the closing of this offering, persons and entities affiliated with General Atlantic will beneficially own approximately % of our outstanding common stock, and all of our directors, officers and their affiliates will beneficially own, in the aggregate, approximately % of our outstanding common stock, in each case, assuming no exercise of the underwriters’ option to purchase additional shares. As a result, these stockholders will be able
30
Table of Contents
to determine substantially all matters requiring stockholder approval, including the election of directors and approval of significant corporate transactions, such as a merger or other sale of our company or its assets. This concentration of ownership could limit the ability of other stockholders to influence corporate matters and may have the effect of delaying or preventing a third party from acquiring control over us.
If securities or industry analysts do not publish research or reports about our business, or publish negative reports about our business, our share price and trading volume could decline.
The trading market for our common stock will depend in part on the research and reports that securities or industry analysts publish about us or our business, our market and our competitors. We do not have any control over these analysts. If one or more of the analysts who cover us downgrade our shares or change their opinion of our shares, our share price would likely decline. If one or more of these analysts cease coverage of our company or fail to regularly publish reports on us, we could lose visibility in the financial markets, which could cause our share price or trading volume to decline.
We may invest or spend the proceeds of this offering in ways with which you may not agree or in ways which may not yield a return.
We expect to use the net proceeds that we receive from this offering for repayment of indebtedness, general corporate purposes, including working capital, sales and marketing activities, general and administrative matters and capital expenditures. We may also use a portion of the net proceeds to acquire complementary businesses, products, services or technologies. Our management will have considerable discretion in the application of the net proceeds, and you will not have the opportunity, as part of your investment decision, to assess whether the proceeds are being used appropriately. The net proceeds may be used for corporate purposes that do not increase the value of our business, which could cause the price of our stock to decline.
Anti-takeover provisions in our charter documents and under Delaware law could make an acquisition of our company more difficult, limit attempts by our stockholders to replace or remove our current management and limit the market price of our common stock.
Provisions in our certificate of incorporation and bylaws, as they will be amended and restated in connection with this offering, may have the effect of delaying or preventing a change of control or changes in our management. Our amended and restated certificate of incorporation and bylaws will include provisions that:
| • | establish a classified board of directors so that not all members of our board of directors are elected at one time; |
| • | permit our board of directors to establish the number of directors; |
| • | provide that directors may only be removed “for cause”; |
| • | require super-majority voting to amend some provisions in our certificate of incorporation and bylaws; |
| • | authorize the issuance of “blank check” preferred stock that our board of directors could use to implement a stockholder rights plan; |
| • | eliminate the ability of our stockholders to call special meetings of stockholders; |
| • | prohibit stockholder action by written consent, which requires all stockholder actions to be taken at a meeting of our stockholders; |
| • | provide that our board of directors is expressly authorized to make, alter or repeal our bylaws; and |
| • | establish advance notice requirements for nominations for election to our board of directors or for proposing matters that can be acted upon by stockholders at annual stockholder meetings. |
These provisions may frustrate or prevent any attempts by our stockholders to replace or remove our current management by making it more difficult for our stockholders to replace members of our board of directors,
31
Table of Contents
which is responsible for appointing the members of our management. In addition, because we are incorporated in Delaware, we are governed by the provisions of Section 203 of the Delaware General Corporation Law, which generally prohibits a Delaware corporation from engaging in any of a broad range of business combinations with any holder of at least 15% of our capital stock for a period of three years following the date on which the stockholder became a 15% stockholder.
In making your investment decision, you should not rely on information in public media that is published by third parties. You should rely only on statements made in this prospectus in determining whether to purchase our common stock.
You should carefully evaluate all of the information in this prospectus. We have in the past received, and may continue to receive, media coverage, including coverage that is not directly attributable to statements made by our directors, officers and other employees. We cannot confirm the accuracy of such coverage. You should rely only on the information contained in this prospectus in determining whether to purchase our shares of common stock.
32
Table of Contents
SPECIAL NOTE REGARDING FORWARD-LOOKING STATEMENTS
This prospectus, including the sections titled “Prospectus Summary,” “Risk Factors,” “Use of Proceeds,” “Management’s Discussion and Analysis of Financial Condition and Results of Operations” and “Business,” contains forward-looking statements. In some cases you can identify these statements by forward-looking words such as “believe,” “may,” “will,” “estimate,” “continue,” “anticipate,” “intend,” “could,” “would,” “project,” “plan,” “expect” or the negative or plural of these words or similar expressions. These forward-looking statements include, but are not limited to, statements concerning the following:
| • | the market acceptance of outsourcing the HR function, and the anticipated benefits associated with the use of a bundled HR solution; |
| • | our ability to expand our direct sales force and the efficacy of our sales and marketing efforts; |
| • | our ability to gain new clients, and our clients’ ability to grow and gain more employees; |
| • | our ability to effectively acquire and integrate new businesses; |
| • | the effects of seasonal trends on our results of operations; |
| • | changes to and our ability to comply with laws and regulations, including both those applicable to the co-employment relationship as well as those applicable to our clients’ businesses and their employees; |
| • | the implementation of the Patient Protection and Affordable Care Act, as modified by the Health Care and Education Reconciliation Act, and its application to the co-employer relationship; |
| • | our ability to effectively manage our growth; |
| • | the effects of increased competition and our ability to compete effectively; |
| • | our ability to comply with the restrictions of our credit facilities and meet our debt obligations; |
| • | economic and financial conditions and our ability to succeed in different economic environments; |
| • | employment and wage levels; |
| • | industry and technology trends; |
| • | our ability to attract and retain qualified personnel; |
| • | our ability to maintain, protect and enhance our brand and our intellectual property; |
| • | our financial performance, including our revenues, costs of revenues, gross margin and operating expenses, and our ability to sustain profitability; |
| • | our future capital requirements and estimates regarding the sufficiency of our cash resources; and |
| • | our ability to effectively scale and adapt our technology. |
These forward-looking statements are subject to a number of risks, uncertainties and assumptions, including those described in “Risk Factors.” Moreover, we operate in a very competitive and rapidly changing environment. New risks emerge from time to time. It is not possible for our management to predict all risks, nor can we assess the impact of all factors on our business or the extent to which any factor, or combination of factors, may cause actual results to differ materially from those contained in any forward-looking statements we may make. In light of these risks, uncertainties and assumptions, the forward-looking events and circumstances discussed in this prospectus may not occur and actual results could differ materially and adversely from those anticipated or implied in the forward-looking statements.
You should not rely upon forward-looking statements as predictions of future events. We cannot guarantee that the future results, levels of activity, performance or events and circumstances reflected in the forward-looking statements will be achieved or occur. Moreover, except as required by law, neither we nor any other
33
Table of Contents
person assumes responsibility for the accuracy and completeness of the forward-looking statements. We undertake no obligation to update publicly any forward-looking statements for any reason after the date of this prospectus to conform these statements to actual results or to changes in our expectations.
You should read this prospectus and the documents that we reference in this prospectus and have filed with the Securities and Exchange Commission as exhibits to the registration statement of which this prospectus is a part with the understanding that our actual future results, levels of activity, performance and events and circumstances may be materially different from what we expect.
34
Table of Contents
MARKET, INDUSTRY AND OTHER DATA
Unless otherwise indicated, information contained in this prospectus concerning our industry and the market in which we operate, including our market position, market opportunity and market size, is based on information from various sources, on assumptions that we have made based on such data and other similar sources and on our knowledge of the markets for our products. These data involve a number of assumptions and limitations, and you are cautioned not to give undue weight to such estimates.
We have not independently verified any third-party information. While we believe that the market position, market opportunity and market size information included in this prospectus is generally accurate and complete, such information is inherently imprecise. In addition, projections, assumptions and estimates of our future performance and the future performance of the industry in which we operate is necessarily subject to a high degree of uncertainty and risk due to a variety of factors, including those described in the section titled “Risk Factors” and elsewhere in this prospectus. These and other factors could cause results to differ materially from those expressed in the estimates made by the independent parties and by us.
The following reports described herein represent data, research opinion or viewpoints published as part of a syndicated subscription service by each of the respective publishers thereof and are not representations of fact. Such reports speak as of their respective original publication dates (and not as of the date of this prospectus) and the opinions expressed in such reports are subject to change without notice:
| 1. | Statistics about Business Size (including Small Business), reported by the U.S. Census Bureau at www.census.gov/econ/susb/ |
| 2. | HR Department Benchmarks and Analysis 2013-2014, published by the Bureau of National Affairs, Inc. |
| 3. | 2012 Annual Report of the National Association of Professional Employer Organizations |
35
Table of Contents
We estimate that we will receive net proceeds from the sale of common stock offered by us of approximately $ million, based upon an assumed initial public offering price of $ per share, which is the midpoint of the estimated offering price range set forth on the cover page of this prospectus, and after deducting estimated underwriting discounts and commissions and estimated offering expenses payable by us. If the underwriters’ option to purchase additional shares of common stock is exercised in full, we estimate that we will receive net proceeds of approximately $ million, after deducting estimated underwriting discounts and commissions and estimated offering expenses payable by us. We will not receive any proceeds from the sale of common stock by the selling stockholders.
Each $1.00 increase (decrease) in the assumed initial public offering price of $ per share would increase (decrease) the net proceeds to us from this offering by approximately $ million, assuming the number of shares offered by us, as set forth on the cover page of this prospectus, remains the same and after deducting estimated underwriting discounts and commissions. Similarly, each increase (decrease) of 1,000,000 shares in the number of shares of common stock offered by us would increase (decrease) the net proceeds to us from this offering by approximately $ million, assuming that the assumed initial public offering price remains the same, and after deducting estimated underwriting discounts and commissions.
The principal purpose of this offering is to repay approximately $200 million of indebtedness outstanding under our credit facilities, increase our equity capitalization and financial flexibility, increase our visibility in the marketplace and create a public market for our common stock.
Our credit facilities consist of (a) a first lien credit facility, which provides for a $75.0 million revolving credit facility, a $175.0 million tranche B-1 term loan and a $455.0 million tranche B-2 term loan, and (b) a second lien credit facility, which provides for a $190.0 million term loan. As of September 30, 2013, we had an aggregate of $820.0 million of indebtedness outstanding under our senior secured credit facilities. We intend to repay the entire $190.0 million of indebtedness outstanding under our second lien term loan and $ of the indebtedness outstanding under our $175.0 million tranche B-1 term loan with the net proceeds of this offering. See “Management’s Discussion and Analysis of Financial Condition and Results of Operations—Liquidity and Capital Resources—Credit Facilities.”
As of the date of this prospectus, we cannot specify with certainty all of the particular uses for any remaining net proceeds to us from this offering. However, we currently intend to use the net proceeds to us from this offering primarily for general corporate purposes, including working capital, sales and marketing activities, general and administrative matters and capital expenditures. We may also use a portion of the net proceeds from this offering for the acquisition of, or investment in, technologies, solutions or businesses that complement our business, although we have no present commitments or agreements to enter into any such acquisitions or investments. We will have broad discretion over the uses of the net proceeds from this offering. Pending these uses, we intend to invest the net proceeds from this offering in short-term, investment-grade, interest-bearing securities such as money market funds, certificates of deposit, commercial paper and guaranteed obligations of the U.S. government.
36
Table of Contents
Our board of directors has declared three special dividends since January 1, 2012. In March 2012, our board of directors declared a special dividend of $3.13 per common-equivalent share for holders of record of our preferred stock and $3.13 per share for holders of record of our common stock and restricted stock units, for a total of approximately $75.5 million. In August 2013, our board of directors declared a special dividend of $11.75 per common-equivalent share for holders of record of our preferred stock and $11.75 per share for holders of record of our common stock and restricted stock units, for a total of approximately $310.8 million. In December 2013, our board of directors declared a special dividend of $1.75 per common-equivalent share for holders of record of our preferred stock and $1.75 per share for holders of record of our common stock and restricted stock units, for a total amount of approximately $46.7 million. In each case, we determined to pay such dividends to our stockholders because our board of directors determined that such dividends were in our best interests and those of our stockholders, that we had sufficient surplus capital to pay such dividends and that we would be able to continue to fund our operations and service our indebtedness utilizing cash flows from operations after payment of such dividends.
Any future determination as to the declaration and payment of dividends, if any, will be at the discretion of our board of directors and will depend on then existing conditions, including our financial condition, operating results, contractual restrictions, capital requirements, business prospects and other factors our board of directors may deem relevant.
In addition, our credit facilities contain restrictions on our ability to declare and pay cash dividends on our capital stock. So long as no event of default has occurred and is continuing and no ECF Shortfall Amount (as defined in each credit agreement) exists, our credit facilities permit cash dividends in amounts up to the sum of (a) specified dollar amounts under each facility, plus (b) so long as specified leverage ratios under each credit facility are satisfied, the available Excess Cash Flow (as defined in each credit agreement and subject to certain adjustments). Notwithstanding the foregoing, our credit facilities permit, among other dividend payments and stock repurchases, one or more cash dividend payments not to exceed $360 million, subject to certain limitations, $357.5 million of which we have already utilized.
37
Table of Contents
The following table sets forth our cash and cash equivalents, notes payable and capitalization as of September 30, 2013:
| • | on an actual basis; |
| • | on a pro forma basis, giving effect to the conversion of all outstanding shares of preferred stock into 19,032,854 shares of common stock immediately prior to the closing of this offering and the filing and effectiveness of our amended and restated certificate of incorporation in Delaware; and |
| • | on a pro forma as adjusted basis to reflect, in addition to the pro forma adjustments set forth above, (i) the sale by us of shares of common stock in this offering at an assumed initial public offering price of $ per share, which is the midpoint of the estimated offering price range set forth on the cover page of this prospectus, after deducting estimated underwriting discounts and commissions and estimated offering expenses payable by us and (ii) the application of $200.0 million of the net proceeds of this offering to repay amounts outstanding under our credit facilities. |
You should read the information in this table together with the section titled “Management’s Discussion and Analysis of Financial Condition and Results of Operations” and our consolidated financial statements and related notes included elsewhere in this prospectus.
| As of September 30, 2013 | ||||||||||||
| Actual | Pro Forma |
Pro Forma
As Adjusted(1) |
||||||||||
| (in thousands, except share and per share data) | ||||||||||||
| Cash and cash equivalents |
$ | 112,161 | $ | 112,161 | ||||||||
|
|
|
|
|
|
|
|||||||
| Notes payable, current and non-current |
$ | 820,000 | $ | 820,000 | ||||||||
|
|
|
|
|
|
|
|||||||
| Convertible preferred stock: |
||||||||||||
| Series G convertible preferred stock, $0.0001 per share stated value, 5,391,441 shares authorized, issued and outstanding, actual; no shares authorized, issued and outstanding, pro forma and pro forma as adjusted |
59,059 | — | — | |||||||||
| Series H convertible preferred stock, $0.0001 per share stated value, 4,124,986 shares authorized, issued and outstanding, actual; no shares authorized, issued and outstanding, pro forma and pro forma as adjusted |
63,819 | — | — | |||||||||
| Stockholders’ equity: |
||||||||||||
| Common stock, $0.00005 per share stated value, 32,000,000 shares authorized and 7,417,056 shares issued and outstanding, actual; shares authorized and 26,449,910 shares issued and outstanding, pro forma; shares authorized and shares issued and outstanding, pro forma as adjusted |
71,017 | 193,895 | ||||||||||
| Accumulated deficit |
(426,303 | ) | (426,303 | ) | ||||||||
| Accumulated other comprehensive loss |
(158 | ) | (158 | ) | ||||||||
|
|
|
|
|
|
|
|||||||
| Total stockholders’ equity |
$ | (355,444 | ) | $ | (232,566 | ) | ||||||
|
|
|
|
|
|
|
|||||||
| Total capitalization |
$ | 699,595 | $ | 699,595 | ||||||||
|
|
|
|
|
|
|
|||||||
| (1) | Each $1.00 increase (decrease) in the assumed initial public offering price of $ per share would increase (decrease) each of cash and cash equivalents, additional paid-in capital, total stockholders’ equity and total capitalization by approximately $ million, assuming the number of shares offered by us, as set forth on the cover page of this prospectus, remains the same, and after deducting estimated underwriting discounts and commissions. Similarly, each increase (decrease) of 1,000,000 shares in the number of shares of our common stock offered by us would increase (decrease) cash and cash equivalents, additional paid-in capital, total stockholders’ equity and total capitalization by approximately $ million, assuming the assumed initial public offering price remains the same, and after deducting estimated underwriting discounts and commissions. The pro forma as adjusted information discussed above is illustrative only and will be adjusted based on the actual initial public offering price and other terms of this offering determined at pricing. |
38
Table of Contents
The outstanding share information in the table above is based on 26,449,910 shares of our common stock (including preferred stock on an as-converted basis) outstanding as of September 30, 2013, and excludes:
| • | 3,343,372 shares of common stock issuable upon the exercise of outstanding stock options as of September 30, 2013 pursuant to our 2000 Plan and our 2009 Plan at a weighted average exercise price of $2.85 per share; |
| • | 3,266 shares of common stock issuable upon the settlement of restricted stock units as of September 30, 2013 pursuant to our 2009 Plan; |
| • | shares of common stock issuable upon the exercise of outstanding stock options issued after September 30, 2013 pursuant to our 2009 Plan at a weighted average exercise price of $ ; |
| • | shares of common stock reserved for future issuance under our 2009 Plan, as amended in connection with this offering, as well as any automatic increases in the number of shares of common stock reserved for future issuance under this benefit plan; and |
| • | shares of common stock to be reserved for issuance under our ESPP, to be effective in connection with this offering, as well as any automatic increases in the number of shares of common stock reserved for future issuance under this benefit plan. |
39
Table of Contents
If you invest in our common stock, your interest will be diluted to the extent of the difference between the initial public offering price per share of our common stock and the pro forma as adjusted net tangible book value per share of our common stock immediately after this offering. The pro forma net tangible book value of our common stock as of September 30, 2013 was $(694.6) million, or $(26.26) per share. Pro forma net tangible book value per share represents our total tangible assets less our total liabilities, divided by the number of outstanding shares of common stock, after giving effect to the conversion of all outstanding shares of preferred stock into 19,032,854 shares of common stock immediately prior to the closing of this offering.
After giving effect to (i) the conversion of all outstanding shares of preferred stock into 19,032,854 shares of common stock immediately prior to the closing of this offering, (ii) receipt of the net proceeds from our sale of shares of common stock at an assumed initial public offering price of $ per share, which is the midpoint of the estimated offering price range set forth on the cover page of this prospectus, after deducting estimated underwriting discounts and commissions and estimated offering expenses payable by us and (iii) the application of $200 million of the net proceeds of this offering to repay amounts outstanding under our credit facilities, our pro forma as adjusted net tangible book value as of September 30, 2013 would have been approximately $ million, or $ per share. This represents an immediate increase in pro forma as adjusted net tangible book value of $ per share to our existing stockholders and an immediate dilution of $ per share to investors purchasing common stock in this offering.
The following table illustrates this dilution on a per share basis to new investors:
| Assumed initial public offering price per share |
$ | |||||||
| Pro forma net tangible book value per share as of September 30, 2013 |
$ | (26.26 | ) | |||||
| Increase in pro forma net tangible book value per share attributable to new investors purchasing shares in this offering |
||||||||
|
|
|
|||||||
| Pro forma as adjusted net tangible book value per share after giving effect to this offering |
||||||||
|
|
|
|||||||
| Dilution in pro forma net tangible book value per share to new investors in this offering |
$ | |||||||
|
|
|
Each $1.00 increase (decrease) in the assumed initial public offering price of $ per share would increase (decrease) the pro forma net tangible book value, as adjusted to give effect to this offering, by $ per share and the dilution to new investors by $ per share, assuming that the number of shares offered by us, as set forth on the cover page of this prospectus, remains the same, after deducting estimated underwriting discounts and commissions. Similarly, each increase (decrease) of 1,000,000 shares in the number of shares of common stock offered by us would increase (decrease) the pro forma net tangible book value, as adjusted to give effect to this offering, by approximately $ per share and the dilution to new investors by $ per share, assuming the assumed initial public offering price remains the same, and after deducting estimated underwriting discounts and commissions. If the underwriters exercise their option to purchase additional shares of common stock in full, the pro forma net tangible book value per share, as adjusted to give effect to this offering, would be $ per share, and the dilution in pro forma net tangible book value per share to investors in this offering would be $ per share.
40
Table of Contents
The table below summarizes as of September 30, 2013, on a pro forma as adjusted basis described above, the number of shares of our common stock, the total consideration and the average price per share (i) paid to us by our existing stockholders and (ii) to be paid by new investors purchasing our common stock in this offering at an assumed initial public offering price of $ per share, which is the midpoint of the estimated offering price range set forth on the cover page of this prospectus, before deducting estimated underwriting discounts and commissions and estimated offering expenses payable by us.
| Shares Purchased | Total Consideration | Average Price Per Share |
||||||||||||||||||
| Number | Percent | Amount | Percent | |||||||||||||||||
| Existing stockholders |
26,449,910 | % | $ | % | $ | |||||||||||||||
| New investors |
% | $ | % | $ | ||||||||||||||||
|
|
|
|
|
|
|
|
|
|||||||||||||
| Totals |
100.0 | % | $ | 100.0 | % | |||||||||||||||
|
|
|
|
|
|
|
|
|
|||||||||||||
The total number of shares of our common stock reflected in the discussion and tables above is based on 26,449,910 shares of our common stock (including preferred stock on an as-converted basis) outstanding as of September 30, 2013, and excludes:
| • | 3,343,372 shares of common stock issuable upon the exercise of outstanding stock options as of September 30, 2013 pursuant to our 2000 Plan and our 2009 Plan at a weighted average exercise price of $2.85 per share; |
| • | 3,266 shares of common stock issuable upon the settlement of restricted stock units as of September 30, 2013 pursuant to our 2009 Plan; |
| • | shares of common stock issuable upon the exercise of outstanding stock options issued after September 30, 2013 pursuant to our 2009 Plan at a weighted average exercise price of $ ; |
| • | shares of common stock reserved for future issuance under our 2009 Plan, as amended in connection with this offering, as well as any automatic increases in the number of shares of common stock reserved for future issuance under this benefit plan; and |
| • | shares of common stock to be reserved for issuance under our ESPP, to be effective in connection with this offering, as well as any automatic increases in the number of shares of common stock reserved for future issuance under this benefit plan. |
Sales by the selling stockholders in this offering will cause the number of shares held by existing stockholders to be reduced to shares, or % of the total number of shares of our common stock outstanding after this offering, and will increase the number of shares held by new investors to shares, or % of the total number of shares outstanding after this offering.
To the extent that any outstanding options are exercised, new options are issued under our stock-based compensation plans or we issue additional shares of common stock in the future, there will be further dilution to investors participating in this offering. If all outstanding options under our 2009 Plan as of September 30, 2013 were exercised, then our existing stockholders, including the holders of these options, would own % and our new investors would own % of the total number of shares of our common stock outstanding upon the closing of this offering.
41
Table of Contents
SELECTED CONSOLIDATED FINANCIAL AND OTHER DATA
The following selected consolidated financial and other data should be read in conjunction with the section titled “Management’s Discussion and Analysis of Financial Condition and Results of Operations” as well as our audited consolidated financial statements and related notes included elsewhere in this prospectus. We have derived the consolidated statement of operations data for the years ended December 31, 2010, 2011 and 2012 and the consolidated balance sheet data as of December 31, 2011 and 2012 from our audited consolidated financial statements that are included elsewhere in this prospectus. We have derived the consolidated statement of operations data for the years ended December 31, 2008 and 2009 and consolidated balance sheet data as of December 31, 2008, 2009 and 2010 from our audited consolidated financial statements that are not included in this prospectus. We have derived the unaudited consolidated statement of operations data for the nine months ended September 30, 2012 and 2013 and the unaudited consolidated balance sheet data as of September 30, 2013 from our unaudited consolidated financial statements that are included elsewhere in this prospectus. Our unaudited consolidated financial statements have been prepared on the same basis as our audited consolidated financial statements and, in the opinion of management, reflect all adjustments, which consist only of normal recurring adjustments, necessary for the fair statement of those unaudited consolidated financial statements. Our historical results are not necessarily indicative of the results to be expected in the future, and our interim results are not necessarily indicative of the results that should be expected for the full year or any other period.
42
Table of Contents
| Year Ended December 31, | Nine Months
Ended September 30, |
|||||||||||||||||||||||||||
| 2008 | 2009 | 2010 | 2011 | 2012 | 2012 | 2013 | ||||||||||||||||||||||
| (in thousands, except share and per share data) | ||||||||||||||||||||||||||||
| Consolidated Statement of Operations Data: |
||||||||||||||||||||||||||||
| Professional service revenues |
$ | 61,527 | $ | 112,187 | $ | 139,495 | $ | 113,279 | $ | 148,233 | $ | 94,892 | $ | 195,642 | ||||||||||||||
| Insurance service revenues |
356,037 | 607,196 | 766,695 | 727,111 | 870,828 | 601,967 | 959,246 | |||||||||||||||||||||
|
|
|
|
|
|
|
|
|
|
|
|
|
|
|
|||||||||||||||
| Total revenues |
417,564 | 719,383 | 906,190 | 840,390 | 1,019,061 | 696,859 | 1,154,888 | |||||||||||||||||||||
|
|
|
|
|
|
|
|
|
|
|
|
|
|
|
|||||||||||||||
| Costs and operating expenses: |
||||||||||||||||||||||||||||
| Insurance costs |
314,199 | 554,660 | 713,653 | 651,094 | 750,025 | 518,386 | 858,862 | |||||||||||||||||||||
| Cost of providing services (exclusive of depreciation and amortization of intangible assets)(1) |
33,820 | 57,957 | 72,073 | 59,388 | 63,563 | 44,944 | 74,042 | |||||||||||||||||||||
| Sales and marketing(1) |
24,316 | 37,173 | 46,454 | 38,087 | 59,931 | 39,377 | 79,387 | |||||||||||||||||||||
| General and administrative(1) |
14,691 | 37,287 | 28,366 | 31,421 | 37,879 | 24,147 | 39,821 | |||||||||||||||||||||
| Systems development and programming costs(1) |
7,173 | 9,850 | 15,045 | 15,646 | 16,718 | 11,893 | 15,140 | |||||||||||||||||||||
| Amortization of intangible assets |
1,819 | 12,223 | 17,960 | 12,388 | 17,441 | 7,853 | 35,926 | |||||||||||||||||||||
| Depreciation |
4,045 | 11,301 | 12,042 | 9,201 | 11,676 | 9,100 | 8,908 | |||||||||||||||||||||
| Restructuring |
— | 6,202 | 5,922 | 2,358 | — | — | — | |||||||||||||||||||||
|
|
|
|
|
|
|
|
|
|
|
|
|
|
|
|||||||||||||||
| Total costs and operating expenses |
400,063 | 726,653 | 911,515 | 819,583 | 957,233 | 655,700 | 1,112,086 | |||||||||||||||||||||
|
|
|
|
|
|
|
|
|
|
|
|
|
|
|
|||||||||||||||
| Operating income (loss) |
17,501 | (7,270 | ) | (5,325 | ) | 20,807 | 61,828 | 41,159 | 42,802 | |||||||||||||||||||
| Other income (expense): |
||||||||||||||||||||||||||||
| Interest expense |
(894 | ) | (3,681 | ) | (4,444 | ) | (751 | ) | (9,709 | ) | (2,835 | ) | (32,091 | ) | ||||||||||||||
| Other, net |
(70 | ) | (6 | ) | 67 | 127 | 57 | 22 | 309 | |||||||||||||||||||
| Gain from acquisition |
— | 23,350 | — | — | — | — | — | |||||||||||||||||||||
|
|
|
|
|
|
|
|
|
|
|
|
|
|
|
|||||||||||||||
| Income (loss) before provision for (benefit from) income taxes |
16,537 | 12,393 | (9,702 | ) | 20,183 | 52,176 | 38,346 | 11,020 | ||||||||||||||||||||
| Provision for (benefit from) income taxes |
7,078 | (5,425 | ) | (100 | ) | 4,646 | 20,344 | 15,386 | 3,880 | |||||||||||||||||||
|
|
|
|
|
|
|
|
|
|
|
|
|
|
|
|||||||||||||||
| Net income (loss) |
$ | 9,459 | $ | 17,818 | $ | (9,602 | ) | 15,537 | $ | 31,832 | $ | 22,960 | $ | 7,140 | ||||||||||||||
|
|
|
|
|
|
|
|
|
|
|
|
|
|
|
|||||||||||||||
| Net income (loss) per share attributable to common stock: |
||||||||||||||||||||||||||||
| Basic |
$ | 0.65 | $ | 0.78 | $ | (2.58 | ) | $ | 0.68 | $ | 1.33 | $ | 0.97 | $ | 0.29 | |||||||||||||
|
|
|
|
|
|
|
|
|
|
|
|
|
|
|
|||||||||||||||
| Diluted |
$ | 0.62 | $ | 0.76 | $ | (2.58 | ) | $ | 0.65 | $ | 1.26 | $ | 0.92 | $ | 0.27 | |||||||||||||
|
|
|
|
|
|
|
|
|
|
|
|
|
|
|
|||||||||||||||
| Weighted average common stock outstanding: |
||||||||||||||||||||||||||||
| Basic |
3,702,284 | 3,683,188 | 3,727,195 | 3,921,341 | 4,902,692 | 4,728,686 | 5,750,789 | |||||||||||||||||||||
|
|
|
|
|
|
|
|
|
|
|
|
|
|
|
|||||||||||||||
| Diluted |
4,490,190 | 4,507,563 | 3,727,195 | 5,051,990 | 6,238,046 | 6,002,628 | 7,598,197 | |||||||||||||||||||||
|
|
|
|
|
|
|
|
|
|
|
|
|
|
|
|||||||||||||||
| Pro forma net income (loss) per share: |
||||||||||||||||||||||||||||
| Basic |
$ | $ | ||||||||||||||||||||||||||
|
|
|
|
|
|||||||||||||||||||||||||
| Diluted |
$ | $ | ||||||||||||||||||||||||||
|
|
|
|
|
|||||||||||||||||||||||||
| Pro forma weighted average common stock outstanding: |
||||||||||||||||||||||||||||
| Basic |
||||||||||||||||||||||||||||
|
|
|
|
|
|||||||||||||||||||||||||
| Diluted |
||||||||||||||||||||||||||||
|
|
|
|
|
|||||||||||||||||||||||||
43
Table of Contents
| Year Ended December 31, | Nine Months Ended September 30, |
|||||||||||||||||||||||||||
| 2008 | 2009 | 2010 | 2011 | 2012 | 2012 | 2013 | ||||||||||||||||||||||
| (in thousands) | ||||||||||||||||||||||||||||
| Other Financial Data: |
||||||||||||||||||||||||||||
| Net Insurance Service Revenues(2) |
$ | 41,838 | $ | 52,536 | $ | 53,042 | $ | 76,017 | $ | 120,803 | $ | 83,581 | $ | 100,384 | ||||||||||||||
| Net Service Revenues(3) |
$ | 103,365 | $ | 164,723 | $ | 192,537 | $ | 189,296 | $ | 269,036 | $ | 178,473 | $ | 296,026 | ||||||||||||||
| Adjusted EBITDA(4) |
$ | 26,520 | $ | 20,174 | $ | 29,797 | $ | 47,348 | $ | 95,362 | $ | 61,530 | $ | 92,305 | ||||||||||||||
| Adjusted Net Income(5) |
$ | 12,344 | $ | 15,354 | $ | 13,174 | $ | 28,788 | $ | 45,133 | $ | 29,695 | $ | 33,242 | ||||||||||||||
| (1) | Includes stock-based compensation expense as follows: |
| Year Ended December 31, | Nine Months Ended September 30, |
|||||||||||||||||||||||||||
| 2008 | 2009 | 2010 | 2011 | 2012 | 2012 | 2013 | ||||||||||||||||||||||
| (in thousands) | ||||||||||||||||||||||||||||
| Cost of providing services (exclusive of depreciation and amortization of intangible assets) |
$ | 354 | $ | 318 | $ | 467 | 438 | $ | 516 | $ | 382 | $ | 770 | |||||||||||||||
| Sales and marketing |
359 | 486 | 670 | 637 | 500 | 364 | 882 | |||||||||||||||||||||
| General and administrative |
2,306 | 2,868 | 3,385 | 3,590 | 3,144 | 2,505 | 2,371 | |||||||||||||||||||||
| Systems development and programming costs |
206 | 254 | 531 | 160 | 200 | 145 | 337 | |||||||||||||||||||||
|
|
|
|
|
|
|
|
|
|
|
|
|
|
|
|||||||||||||||
| Total stock-based compensation expense |
$ | 3,225 | $ | 3,926 | $ | 5,053 | $ | 4,825 | $ | 4,360 | $ | 3,396 | $ | 4,360 | ||||||||||||||
|
|
|
|
|
|
|
|
|
|
|
|
|
|
|
|||||||||||||||
| (2) | Net Insurance Service Revenues is a non-GAAP financial measure that we calculate as insurance service revenues less insurance costs. For more information about Net Insurance Service Revenues and a reconciliation of Net Insurance Service Revenues to insurance service revenues, the most directly comparable financial measure calculated and presented in accordance with GAAP, see “—Non-GAAP Financial Results.” |
| (3) | Net Service Revenues is a non-GAAP financial measure that we calculate as the sum of professional service revenues and Net Insurance Service Revenues. For more information about Net Service Revenues and a reconciliation of Net Service Revenues to total revenues, the most directly comparable financial measure calculated and presented in accordance with GAAP, see “—Non-GAAP Financial Results.” |
| (4) | Adjusted EBITDA is a non-GAAP financial measure that we calculate as net income (loss), excluding the effects of our income tax provision (benefit), interest expense, depreciation, amortization of intangible assets and stock-based compensation expense. For 2009, we also excluded gain associated with our acquisition of Gevity. For more information about Adjusted EBITDA and a reconciliation of Adjusted EBITDA to net income (loss), the most directly comparable financial measure calculated and presented in accordance with GAAP, see “—Non-GAAP Financial Results.” |
| (5) | Adjusted Net Income is a non-GAAP financial measure that we calculate as net income (loss), excluding the effects of stock-based compensation, amortization of intangible assets and the income tax effect of these pre-tax adjustments at our effective tax rate. For 2009, we also excluded the gain associated with our acquisition of Gevity and the income tax effects of this pre-tax adjustment at our effective tax rate. For more information about Adjusted Net Income and a reconciliation of Adjusted Net Income to net income (loss), the most directly comparable financial measure calculated and presented in accordance with GAAP, see “—Non-GAAP Financial Results.” |
| As of December 31, | As of September 30, 2013 |
|||||||||||||||||||||||
| 2008 | 2009 | 2010 | 2011 | 2012 | ||||||||||||||||||||
| (in thousands) | ||||||||||||||||||||||||
| Consolidated Balance Sheet Data: |
||||||||||||||||||||||||
| Cash and cash equivalents |
$ | 28,834 | $ | 37,742 | $ | 45,535 | $ | 31,620 | $ | 63,749 | $ | 112,161 | ||||||||||||
| Working capital |
$ | 21,173 | $ | 37,604 | $ | 44,280 | $ | 26,424 | $ | 27,380 | $ | 85,541 | ||||||||||||
| Total assets |
$ | 142,354 | $ | 390,274 | $ | 339,964 | $ | 335,369 | $ | 887,727 | $ | 1,215,597 | ||||||||||||
| Notes payable and borrowings under capital leases |
$ | 11,930 | $ | 55,008 | $ | 1,798 | $ | 1,683 | $ | 301,334 | $ | 820,610 | ||||||||||||
| Total liabilities |
$ | 95,455 | $ | 258,017 | $ | 214,190 | $ | 241,771 | $ | 830,407 | $ | 1,448,163 | ||||||||||||
| Convertible preferred stock |
$ | 59,059 | $ | 122,878 | $ | 122,878 | $ | 122,878 | $ | 122,878 | $ | 122,878 | ||||||||||||
| Total stockholders’ equity (deficit) |
$ | (12,160 | ) | $ | $9,379 | $ | 2,896 | $ | (29,280 | ) | $ | (65,558 | ) | $ | (355,444 | ) | ||||||||
44
Table of Contents
Non-GAAP Financial Results
We use Net Insurance Service Revenues, Net Service Revenues, Adjusted EBITDA and Adjusted Net Income to provide an additional view of our operational performance. Net Insurance Service Revenues, Net Service Revenues, Adjusted EBITDA and Adjusted Net Income are financial measures that are not prepared in accordance with GAAP. We define Net Insurance Service Revenues as insurance service revenues less insurance costs, which include the premiums we pay to insurance carriers for the health and workers compensation insurance coverage provided to our clients and WSEs and the reimbursements we pay to the insurance carriers for claim payments within our insurance deductible layer. We define Net Service Revenues as the sum of professional service revenues and Net Insurance Service Revenues. We define Adjusted EBITDA as net income (loss), excluding the effects of our income tax provision (benefit), interest expense, depreciation, amortization of intangible assets and stock-based compensation expense. We define Adjusted Net Income as net income (loss), excluding the effects of stock-based compensation, amortization of intangible assets and the income tax effect of these pre-tax adjustments at our effective tax rate. For 2009, we also excluded the gain associated with our acquisition of Gevity from Adjusted EBITDA and Adjusted Net Income, and excluded the income tax effect of this pre-tax adjustment at our effective tax rate from Adjusted Net Income, as we consider these to be non-recurring items.
We believe that the use of Net Insurance Service Revenues provides useful information as it presents a measure of revenues from our provision of insurance services to our clients that eliminates the cost of insurance. We believe that Net Service Revenues provides a useful measure of total revenues for the two main components of our revenues calculated on a consistent basis. We believe that the use of Adjusted EBITDA and Adjusted Net Income provides additional period-to-period comparisons and analysis of trends in our business, as they exclude certain one-time and non-cash expenses. We believe that Net Insurance Service Revenues, Net Service Revenues, Adjusted EBITDA and Adjusted Net Income are useful for our stockholders and board of directors by helping them to identify trends in our business and understand how our management evaluates our business. We use Net Insurance Service Revenues, Net Service Revenues, Adjusted EBITDA and Adjusted Net Income to monitor and evaluate our operating results and trends on an ongoing basis and internally for operating, budgeting and financial planning purposes, in addition to allocating our resources to enhance the financial performance of our business and evaluating the effectiveness of our business strategies. We also use Net Service Revenues and Adjusted EBITDA in determining the incentive compensation for management.
Net Insurance Service Revenues, Net Service Revenues, Adjusted EBITDA and Adjusted Net Income are not prepared in accordance with, and should not be considered in isolation of, or as an alternative to, measurements required by GAAP. In addition, these non-GAAP measures are not based on any comprehensive set of accounting rules or principles. As non-GAAP measures, Net Insurance Service Revenues, Net Service Revenues, Adjusted EBITDA and Adjusted Net Income have limitations in that they do not reflect all of the amounts associated with our results of operations as determined in accordance with GAAP. In particular:
| • | Net Insurance Service Revenues and Net Service Revenues are reduced by the insurance costs that we pay to the insurance carriers; |
| • | Adjusted EBITDA does not reflect interest expense, or the cash requirements necessary to service interest or principal payments on our debt; |
| • | Adjusted EBITDA does not reflect the amounts we paid in taxes or other components of our tax provision; |
| • | Adjusted EBITDA does not reflect our cash expenditures or future requirements for capital expenditures or contractual commitments; |
| • | Adjusted EBITDA and Adjusted Net Income do not reflect changes in, or cash requirements for, our working capital needs; |
| • | Adjusted EBITDA and Adjusted Net Income do not reflect the non-cash component of employee compensation; |
45
Table of Contents
| • | Although depreciation and amortization of intangible assets are non-cash charges, the assets being depreciated and amortized often will have to be replaced in the future, and Adjusted EBITDA does not reflect any cash requirements for such replacements; and |
| • | Other companies in our industry may calculate Net Insurance Service Revenues, Net Service Revenues, Adjusted EBITDA and Adjusted Net Income differently than we do, limiting its usefulness as a comparative measure. |
Because of these limitations, you should consider Net Insurance Service Revenues, Net Service Revenues, Adjusted EBITDA and Adjusted Net Income alongside other financial performance measures, including total revenues, net income (loss) and our financial results presented in accordance with GAAP.
The table below sets forth a reconciliation of GAAP insurance service revenues to Net Insurance Service Revenues:
| Year Ended December 31, | Nine Months Ended September 30, |
|||||||||||||||||||||||||||
| 2008 | 2009 | 2010 | 2011 | 2012 | 2012 | 2013 | ||||||||||||||||||||||
| (in thousands) | ||||||||||||||||||||||||||||
| Insurance service revenues |
$ | 356,037 | $ | 607,196 | $ | 766,695 | $ | 727,111 | $ | 870,828 | $ | 601,967 | $ | 959,246 | ||||||||||||||
| Less: insurance costs |
314,199 | 554,660 | 713,653 | 651,094 | 750,025 | 518,386 | 858,862 | |||||||||||||||||||||
|
|
|
|
|
|
|
|
|
|
|
|
|
|
|
|||||||||||||||
| Net Insurance Service Revenues |
$ | 41,838 | $ | 52,536 | $ | 53,042 | $ | 76,017 | $ | 120,803 | $ | 83,581 | $ | 100,384 | ||||||||||||||
|
|
|
|
|
|
|
|
|
|
|
|
|
|
|
|||||||||||||||
The table below sets forth a reconciliation of GAAP total revenues to Net Service Revenues:
| Year Ended December 31, | Nine Months Ended September 30, |
|||||||||||||||||||||||||||
| 2008 | 2009 | 2010 | 2011 | 2012 | 2012 | 2013 | ||||||||||||||||||||||
| (in thousands) | ||||||||||||||||||||||||||||
| Total revenues |
$ | 417,564 | $ | 719,383 | $ | 906,190 | $ | 840,390 | $ | 1,019,061 | $ | 696,859 | $ | 1,154,888 | ||||||||||||||
| Less: insurance costs |
314,199 | 554,660 | 713,653 | 651,094 | 750,025 | 518,386 | 858,862 | |||||||||||||||||||||
|
|
|
|
|
|
|
|
|
|
|
|
|
|
|
|||||||||||||||
| Net Service Revenues |
$ | 103,365 | $ | 164,723 | $ | 192,537 | $ | 189,296 | $ | 269,036 | $ | 178,473 | $ | 296,026 | ||||||||||||||
|
|
|
|
|
|
|
|
|
|
|
|
|
|
|
|||||||||||||||
The table below sets forth a reconciliation of GAAP net income (loss) to Adjusted EBITDA:
| Year Ended December 31, | Nine Months Ended September 30, |
|||||||||||||||||||||||||||
| 2008 | 2009 | 2010 | 2011 | 2012 | 2012 | 2013 | ||||||||||||||||||||||
| (in thousands) | ||||||||||||||||||||||||||||
| Net income (loss) |
$ | 9,459 | $ | 17,818 | $ | (9,602 | ) | $ | 15,537 | $ | 31,832 | $ | 22,960 | $ | 7,140 | |||||||||||||
| Provision for (benefit from) income taxes |
7,078 | (5,425 | ) | (100 | ) | 4,646 | 20,344 | 15,386 | 3,880 | |||||||||||||||||||
| Stock-based compensation |
3,225 | 3,926 | 5,053 | 4,825 | 4,360 | 3,396 | 4,360 | |||||||||||||||||||||
| Interest expense |
894 | 3,681 | 4,444 | 751 | 9,709 | 2,835 | 32,091 | |||||||||||||||||||||
| Depreciation |
4,045 | 11,301 | 12,042 | 9,201 | 11,676 | 9,100 | 8,908 | |||||||||||||||||||||
| Amortization of intangible assets |
1,819 | 12,223 | 17,960 | 12,388 | 17,441 | 7,853 | 35,926 | |||||||||||||||||||||
| Gain from acquisition |
— | (23,350 | ) | — | — | — | — | — | ||||||||||||||||||||
|
|
|
|
|
|
|
|
|
|
|
|
|
|
|
|||||||||||||||
| Adjusted EBITDA |
$ | 26,520 | $ | 20,174 | $ | 29,797 | $ | 47,348 | $ | 95,362 | $ | 61,530 | $ | 92,305 | ||||||||||||||
|
|
|
|
|
|
|
|
|
|
|
|
|
|
|
|||||||||||||||
46
Table of Contents
The table below sets forth a reconciliation of GAAP net income (loss) to Adjusted Net Income:
| Year Ended December 31, | Nine Months Ended September 30, |
|||||||||||||||||||||||||||
| 2008 | 2009 | 2010 | 2011 | 2012 | 2012 | 2013 | ||||||||||||||||||||||
| (in thousands) | ||||||||||||||||||||||||||||
| Net income (loss) |
$ | 9,459 | $ | 17,818 | $ | (9,602 | ) | $ | 15,537 | $ | 31,832 | $ | 22,960 | $ | 7,140 | |||||||||||||
| Stock-based compensation |
3,225 | 3,926 | 5,053 | 4,825 | 4,360 | 3,396 | 4,360 | |||||||||||||||||||||
| Amortization of intangible assets |
1,819 | 12,223 | 17,960 | 12,388 | 17,441 | 7,853 | 35,926 | |||||||||||||||||||||
| Gain from acquisition |
— | (23,350 | ) | — | — | — | — | — | ||||||||||||||||||||
| Income tax impact of pre-tax adjustments at the effective tax rate |
(2,159 | ) | 4,737 | (237 | ) | (3,962 | ) | (8,500 | ) | (4,514 | ) | (14,184 | ) | |||||||||||||||
|
|
|
|
|
|
|
|
|
|
|
|
|
|
|
|||||||||||||||
| Adjusted Net Income |
$ | 12,344 | $ | 15,354 | $ | 13,174 | $ | 28,788 | $ | 45,133 | $ | 29,695 | $ | 33,242 | ||||||||||||||
|
|
|
|
|
|
|
|
|
|
|
|
|
|
|
|||||||||||||||
47
Table of Contents
MANAGEMENT’S DISCUSSION AND ANALYSIS OF FINANCIAL CONDITION AND
RESULTS OF OPERATIONS
You should read the following discussion of our financial condition and results of operations in conjunction with our consolidated financial statements and the related notes included elsewhere in this prospectus. The following discussion contains forward-looking statements that reflect our plans, estimates and beliefs. Our actual results could differ materially from those discussed in the forward-looking statements. Factors that could cause or contribute to these differences include those discussed below and elsewhere in this prospectus, particularly in the section titled “Risk Factors.”
Overview
TriNet is a leading provider of a comprehensive human resources solution for small to medium-sized businesses, or SMBs. We enhance business productivity by enabling our clients to outsource their HR function to one strategic partner and allowing them to focus on operating and growing their core businesses. Our HR solution includes services such as payroll processing, human capital consulting, employment law compliance and employee benefits, including health insurance, retirement plans and workers compensation insurance. Our services are delivered by our expert team of HR professionals and enabled by our proprietary, cloud-based technology platform, which allows our clients and their employees to efficiently conduct their HR transactions anytime and anywhere.
We utilize a co-employment model pursuant to which both we and our clients become employers of our clients’ employees, which we refer to as worksite employees, or WSEs. This model affords us a close and embedded relationship with our clients and their employees. Under the co-employment model, employment-related liabilities are contractually allocated between us and our clients. We assume responsibility for, and manage the risks associated with, each clients’ employee payroll obligations, including the liability for payment of salaries and wages to each client employee, the payment of payroll taxes and, at the client’s option, responsibility for providing group health, welfare, workers compensation and retirement benefits to such individuals. Unlike a payroll service provider, we issue each WSE a payroll check drawn on our bank accounts and contract with insurance carriers to provide health and workers compensation insurance to WSEs under TriNet’s name.
We serve thousands of clients in specific industry vertical markets, including technology, life sciences, property management, professional services, banking and financial services, retail, manufacturing and hospitality services, as well as non-profit entities. As of September 30, 2013, we served over 8,000 clients in 47 states, the District of Columbia and Canada and co-employed approximately 218,000 WSEs. In 2012, we processed over $10 billion in payroll and insurance premiums for our clients.
Our total revenues consist of professional service revenues and insurance service revenues. For 2012 and the nine months ended September 30, 2013, 15% and 17% of our total revenues, respectively, consisted of professional service revenues, and 85% and 83% of our total revenues, respectively, consisted of insurance service revenues. We earn professional service revenues by processing HR transactions, such as payroll and employment tax withholding, and providing labor and benefit law compliance services, on behalf of our clients. We earn insurance service revenues by providing risk-based, third-party plans to our clients, primarily employee health benefit plans and workers compensation insurance.
For professional service revenues, we recognize as revenues the fees we earn for processing HR transactions, which fees do not include the payroll that is paid to us by the client and paid out to WSEs or remitted as taxes. We recognize as insurance service revenues all insurance-related billings and administrative fees collected from clients and withheld from WSEs for risk-based insurance plans provided through third-party insurance carriers, primarily employee health insurance and workers compensation insurance. We in turn pay premiums to third-party insurance carriers for these insurance benefits, as well as reimburse them for claim payments within our insurance deductible layer. These premiums and reimbursements are classified as insurance costs on our statements of operations. To augment our financial information prepared in accordance with U.S. generally accepted accounting principles, or GAAP, we use internally a non-GAAP financial measure, Net Insurance Service Revenues, which consists of insurance service revenues less insurance costs. We also use a
48
Table of Contents
measure of total non-GAAP revenue, or Net Service Revenues, which is the sum of professional service revenues and Net Insurance Service Revenues. For 2012 and the nine months ended September 30, 2013, 55% and 66% of our Net Service Revenues, respectively, consisted of professional service revenues and 45% and 34% of our Net Service Revenues, respectively, consisted of Net Insurance Service Revenues.
We sell our services primarily through our direct sales force, which consists of sales representatives who focus on serving clients in specific industry vertical markets. For 2010, 2011 and 2012, our sales and marketing expenses were $46.5 million, $38.1 million and $59.9 million, respectively, or 5%, 5% and 6% of our total revenues and 24%, 20% and 22% of our Net Service Revenues, respectively. For the nine months ended September 30, 2012 and 2013, our sales and marketing expenses were $39.4 million and $79.4 million, or 6% and 7% of our total revenues and 22% and 27% of our Net Service Revenues, respectively.
We have made significant investments in our proprietary, cloud-based technology platform, including implementing client information and management software to provide our clients with enhanced features and functionality with which to conduct their HR transactions, manage their employees and analyze employee benefits data. For 2010, 2011 and 2012, our systems development and programming costs were $15.0 million, $15.6 million and $16.7 million, or 2%, 2% and 2% of our total revenues and 8%, 8% and 6% of our Net Service Revenues, respectively. For the nine months ended September 30, 2012 and 2013, our systems development and programming costs were $11.9 million and $15.1 million, or 2% and 1% of our total revenues and 7% and 5% of Net Service Revenues, respectively.
Recent Acquisitions
We operate in a highly fragmented industry and have completed numerous strategic acquisitions over the course of the past decade. We intend to continue to pursue strategic acquisitions that will enable us to add new clients and employees to our existing business and offer our clients and their employees more comprehensive and attractive services. Our recent acquisitions are listed below:
| • | In July 2013, we acquired Ambrose Employer Group, LLC, which we refer to as Ambrose, a New York-based company that provides premium HR services primarily to WSEs in the financial services industry in the New York area. Through our acquisition of Ambrose, we acquired approximately 13,000 WSEs, approximately 1,000 clients and 12 sales representatives. |
| • | In October 2012, we acquired South Carolina-based SOI Holdings, Inc., which we refer to as SOI, which expanded our presence in the property management and food services industry vertical markets. Through our acquisition of SOI, we acquired approximately 66,000 WSEs, approximately 1,500 clients and 92 sales representatives. |
| • | In May 2012, we acquired Los Angeles-based technology company App7, Inc., which does business under the name of, and which we refer to as, ExpenseCloud, which enabled us to enhance our technology platform with additional expense management capabilities. |
| • | In April 2012, we acquired Oklahoma-based 210 Park Avenue Holding, Inc., which does business under the name of, and which we refer to as, Accord, through which we expanded our presence in the hospitality and manufacturing industry vertical markets. Through our acquisition of Accord, we acquired approximately 14,000 WSEs, approximately 500 clients and 8 sales representatives. |
| • | In June 2009, we acquired Florida-based Gevity HR Inc., which we refer to as Gevity, which has provided us with insurance and risk-management expertise and a national presence through its East Coast processing facility. Through our acquisition of Gevity, we acquired approximately 92,000 WSEs and approximately 6,000 clients. Following our acquisition of Gevity, we elected to change the pricing terms with certain of Gevity’s clients, terminate Gevity’s relationships with certain of its clients, significantly restructure Gevity’s and our combined sales forces and migrate all of Gevity’s WSEs to our technology platform. As a result of these actions, our revenues fell short of our expectations in 2010 and declined in 2011, and we incurred restructuring charges of $6.2 million, $5.9 million and $2.4 million in the years ended December 31, 2009, 2010 and 2011, respectively. |
49
Table of Contents
Our operations could be adversely impacted if our recent acquisitions are not integrated effectively. Because many of the companies we have acquired were focused on specific industries, our acquisitions have allowed us to expand our vertical service offerings into areas such as financial services, property management and food services, hospitality and manufacturing in which we did not previously have a significant presence. In addition, we have acquired sales representatives with experience in these vertical markets. Our acquisitions have provided us with additional clients and WSEs to allow us to continue to leverage our operations over a larger client base. These acquisitions have resulted in increased revenues and costs, as described below in our results of operations. We expect to continue to pursue strategic acquisitions.
Key Operating Metrics
We regularly review certain key operating metrics to evaluate growth trends, measure our performance and make strategic decisions. Our key operating metrics at December 31, 2010, 2011 and 2012 and at September 30, 2012 and 2013 were as follows:
| Year Ended December 31, | Nine Months
Ended September 30, |
|||||||||||||||||||
| 2010 | 2011 | 2012 | 2012 | 2013 | ||||||||||||||||
| Key Operating Metrics: |
||||||||||||||||||||
| Total WSEs |
96,816 | 83,314 | 174,311 | 104,747 | 218,069 | |||||||||||||||
| Total Sales Representatives |
114 | 80 | 224 | 149 | 301 | |||||||||||||||
| Net Insurance Service Revenues (in thousands) |
$ | 53,042 | $ | 76,017 | $ | 120,803 | $ | 83,581 | $ | 100,384 | ||||||||||
| Net Service Revenues (in thousands) |
$ | 192,537 | $ | 189,296 | $ | 269,036 | $ | 178,473 | $ | 296,026 | ||||||||||
Total WSEs
We define Total WSEs at the end of a given fiscal period as the total number of WSEs paid in the last calendar month of the fiscal period. We believe that comparing our Total WSEs at the end of a fiscal period to that of prior periods is an indicator of our success in growing our business, both organically and through the integration of acquired businesses, and retaining clients, and that our Total WSEs paid in the last calendar month of the fiscal period is a leading indicator of our anticipated revenues for future fiscal periods.
Total Sales Representatives
Our direct sales force consists of sales representatives who focus on serving clients in specific industry vertical markets. We define Total Sales Representatives at the end of a given fiscal period as the total number of our direct sales force employees at that date. We believe that comparing our Total Sales Representatives at the end of a fiscal period to our Total Sales Representatives at the end of a prior fiscal period is an indicator of our success in growing our business, and that our Total Sales Representatives at the end of recent fiscal periods is a key indicator of our ability to increase our revenues in the following fiscal periods.
Net Insurance Service Revenues and Net Service Revenues
We define Net Insurance Service Revenues as insurance service revenues less insurance costs. We define Net Service Revenues as the sum of professional service revenues and Net Insurance Service Revenues. Our total revenues on a GAAP basis represent the total amount invoiced by us to our clients, net of direct pass-through costs such as payroll and payroll tax payments, for the services we provide to our clients. Our insurance costs include the premiums we pay to insurance carriers for the health and workers compensation insurance coverage provided to our clients and WSEs and the reimbursements we pay to the insurance carriers for claim payments within our insurance deductible layer. We act principally as the service provider to add value in the execution and procurement of these services to our clients. Net Insurance Service Revenues is the primary indicator of our ability to source, add value and offer benefit services to WSEs through third-party insurance carriers, and is considered by management to be a key performance measure. We believe that Net Service Revenues is also a key performance measure as it provides a
50
Table of Contents
useful measure of total revenues for the two main components of our revenues calculated on a consistent basis. In addition, management believes measuring operating costs as a function of Net Service Revenues provides a useful metric, as we believe it enables better evaluation of the performance of our business.
Impact of Health Care Reform
The Patient Protection and Affordable Care Act and the Heath Care and Education Reconciliation Act of 2010, which we refer to collectively as the Act, entail sweeping health care reforms with staggered effective dates from 2010 through 2018, and many provisions of the Act require the issuance of additional guidance from the U.S. Departments of Labor and Health and Human Services, the IRS and U.S. states. Beginning in 2014, a number of key provisions of the Act take effect, including the establishment of state insurance exchanges, insurance market reforms, “pay or play” penalties on large employers and the imposition of excise taxes on the health insurance industry and reinsurance taxes on insurers and third-party administrators. Collectively, these items have the potential to significantly change the insurance marketplace for employers and how employers provide insurance to employees.
We are not yet able to determine the impacts to our business, and to our clients, resulting from the Act. In future periods, the Act may result in increased costs to us and our clients and could affect our ability to attract and retain clients. Additionally, we may be limited or delayed in our ability to increase service fees to offset any associated potential increased costs resulting from compliance with the Act. Furthermore, the uncertainty surrounding the terms and application of the Act may delay or inhibit the decisions of potential clients to outsource their HR needs. These changes could have a negative impact on our operating results as a result.
Seasonality
Historically, we have experienced our highest monthly addition of WSEs, as well as our highest monthly levels of client attrition, in the month of January, primarily because clients that change their payroll service providers tend to do so at the beginning of a calendar year. In addition, we experience higher levels of client attrition in connection with renewals of the health insurance we provide for our WSEs, in the event that such renewals result in increased premiums that we pass on to our clients. We have also historically experienced higher insurance claim volumes in the second and third quarters of a fiscal year than in the first and fourth quarters of a fiscal year, as WSEs typically access their health care providers more often in the second and third quarters of a fiscal year, which has negatively impacted our insurance costs in these quarters. These historical trends may change, and other seasonal trends may develop that make it more difficult for us to manage our business.
Basis of Presentation and Key Components of Our Results of Operations
Total Revenues
Our total revenues consist of professional service revenues and insurance service revenues.
We earn professional service revenues by processing HR transactions, such as payroll and employment tax withholding, payment to WSEs, and labor and benefit law compliance, on behalf of our clients. Our clients pay us these fees based on either a fixed fee per WSE per month or per transaction, or a percentage of the WSE’s payroll cost, pursuant to written professional services agreements that are generally cancelable by us or our clients upon 30 days’ prior written notice. We also earn professional service revenues by providing strategic HR services to our clients, such as talent acquisition, performance management and time and expense reporting services. Our clients pay us professional service fees for these services based on separate written agreements.
We earn insurance service revenues by providing risk-based, third-party plans to our clients, primarily employee health benefit plans and workers compensation insurance. Insurance service revenues consist of insurance-related billings and administrative fees. We recognize as insurance service revenues insurance-related billings and administrative fees collected from clients and withheld from WSEs for risk-based insurance plans provided through third-party insurance carriers, primarily employee health insurance and workers compensation
51
Table of Contents
insurance. We in turn pay premiums to third-party insurance carriers for these insurance benefits, as well as reimburse them for claim payments within our insurance deductible layer. These premiums and reimbursements are classified as insurance costs on our statements of operations.
Our clients pay us administrative fees, typically based on a percentage of insurance-related amounts, collected from clients and withheld from WSEs, primarily in exchange for our administration of employee health benefit plans.
Insurance Costs
Insurance costs include the premiums we pay to the insurance carriers for the health and workers compensation insurance coverage provided to the clients and WSEs and the reimbursements we pay to the insurance carriers for claim payments made to the WSEs within the insurance deductible layer.
Our insurance costs are, in part, a function of the type and terms of agreements that we enter into with the insurance carriers that provide fully-insured coverage for our WSEs. We estimate that approximately 40% of our 2013 health insurance premiums are for policies with respect to which our carriers set the premiums and we are not responsible for any deductible. Our future premiums under these, or ensuing, policies will be influenced by the WSE claims activity in prior periods. The remainder of the health insurance policies and all of the workers compensation insurance policies that we provide to our clients are policies with respect to which we agree to reimburse our carriers for any claims that they pay within our deductible layer. Under these policies, WSEs file claims with the carriers, which are responsible for paying the claims up to the maximum coverage under the policies. The carriers then seek reimbursement from us up to our deductible per incident for workers compensation claims, or up to a cap for health insurance claims in accordance with the terms of the underlying health insurance policies. In no event are we liable to pay the claims directly to WSEs. As we evaluate the claims experience for each fiscal period, we adjust, as we deem necessary, our workers compensation and health benefits reserves, and this in turn has a corresponding impact on our insurance costs. As a result, our insurance costs fluctuate from period to period depending on the number and severity of the claims incurred by our WSEs.
Cost of Providing Services
Cost of providing services consists primarily of costs incurred by us associated with direct customer support, such as payroll and benefits processing, professional HR consultants, employee liability insurance and costs associated with defending clients in employment-related legal claims, benefits and risk management, postage and shipping expenses and consulting expenses.
Sales and Marketing Expenses
Sales and marketing expenses consist primarily of salaries, commissions and related variable compensation expenses, commission payments to partners and the cost of marketing programs. Marketing programs consist of advertising, lead generation, marketing events, corporate communications, brand building and product marketing activities, as well as various incentivized partnership and referral programs. We expect our sales and marketing expenses to continue to increase, both in absolute dollars and as a percentage of our total revenues on an annual basis, for the foreseeable future as we expand our sales force and our other sales and marketing efforts to build our brand, although these expenses may fluctuate as a percentage of our total revenues from period to period depending on the timing of those expenses.
General and Administrative Expenses
General and administrative expenses consist primarily of compensation-related expenses, legal and other professional services fees and other general corporate expenses. We expect our general and administrative expenses to continue to increase in absolute dollars for the foreseeable future due to increases in our legal and financial compliance costs in connection with becoming a public company, although these expenses may fluctuate as a percentage of our total revenues from period to period depending on the timing of those expenses.
52
Table of Contents
Systems Development and Programming Costs
Systems development and programming costs consist primarily of compensation-related expenses for our employees and contractors dedicated to systems development and programming, as well as fees that we pay to third-party consulting firms. We expect our systems development and programming costs to continue to increase modestly in absolute dollars for the foreseeable future as we continue to invest in and improve our technology platform. However, over time, we expect our systems development and programming costs to remain relatively consistent as a percentage of our total revenues on an annual basis, although these costs may fluctuate as a percentage of our total revenues from period to period depending on when we incur those costs.
Amortization of Intangible Assets
Amortization of intangible assets represents costs associated with an acquired company’s developed technologies, client lists, trade names and contractual agreements. We amortize these intangibles over their respective estimated useful lives using either the straight-line method or the accelerated method.
Depreciation
Depreciation consists primarily of amortization of the cost of software and furniture, fixtures and equipment.
Restructuring
Restructuring costs consist of severance and placement costs, lease termination costs and other exit costs associated with the restructuring described in “—Recent Acquisitions” above.
Other Income (Expense)
Other income (expense) consists primarily of interest expense under our credit facility and capital leases.
Provision for (Benefit from) Income Taxes
We are subject to taxation in the United States and Canada. We conduct our business primarily in the United States, and all of our clients are U.S. employers. However, we provide services with respect to certain of our clients’ employees in Canada. The percentage of our total revenues attributable to WSEs in Canada was less than 1% for each of 2010, 2011, 2012 and the nine months ended September 30, 2013. Our effective tax rate differs from the statutory rate primarily due to state taxes, tax credits and changes in uncertain tax positions. We make estimates and judgments about our future taxable income based on assumptions that are consistent with our plans and estimates. Should the actual amounts differ from our estimates, the amount of our valuation allowance could be materially affected.
Income taxes are computed using the asset and liability method, under which deferred tax assets and liabilities are determined based on the difference between the financial statement and tax bases of assets and liabilities using enacted tax rates in effect for the year in which the differences are expected to affect taxable income. Valuation allowances are established when necessary to reduce deferred tax assets to the amount expected to be realized. Changes in valuation allowances are reflected as a component of provision for (benefit from) income taxes.
53
Table of Contents
Results of Operations
The following tables set forth our results of operations for the periods presented and as a percentage of our total revenues and Net Service Revenues for those periods. Period-to-period comparisons of our financial results are not necessarily indicative of financial results to be achieved in future periods.
| Year Ended December 31, | Nine Months Ended September 30, |
|||||||||||||||||||
| 2010 | 2011 | 2012 | 2012 | 2013 | ||||||||||||||||
| (in thousands) | ||||||||||||||||||||
| Consolidated Statement of Operations: |
||||||||||||||||||||
| Professional service revenues |
$ | 139,495 | $ | 113,279 | $ | 148,233 | $ | 94,892 | $ | 195,642 | ||||||||||
| Insurance service revenues |
766,695 | 727,111 | 870,828 | 601,967 | 959,246 | |||||||||||||||
|
|
|
|
|
|
|
|
|
|
|
|||||||||||
| Total revenues |
906,190 | 840,390 | 1,019,061 | 696,859 | 1,154,888 | |||||||||||||||
|
|
|
|
|
|
|
|
|
|
|
|||||||||||
| Costs and operating expenses: |
||||||||||||||||||||
| Insurance costs |
713,653 | 651,094 | 750,025 | 518,386 | 858,862 | |||||||||||||||
| Cost of providing services (exclusive of depreciation and amortization of intangible assets) |
72,073 | 59,388 | 63,563 | 44,944 | 74,042 | |||||||||||||||
| Sales and marketing |
46,454 | 38,087 | 59,931 | 39,377 | 79,387 | |||||||||||||||
| General and administrative |
28,366 | 31,421 | 37,879 | 24,147 | 39,821 | |||||||||||||||
| Systems development and programming costs |
15,045 | 15,646 | 16,718 | 11,893 | 15,140 | |||||||||||||||
| Amortization of intangible assets |
17,960 | 12,388 | 17,441 | 7,853 | 35,926 | |||||||||||||||
| Depreciation |
12,042 | 9,201 | 11,676 | 9,100 | 8,908 | |||||||||||||||
| Restructuring |
5,922 | 2,358 | — | — | — | |||||||||||||||
|
|
|
|
|
|
|
|
|
|
|
|||||||||||
| Total costs and operating expenses |
911,515 | 819,583 | 957,233 | 655,700 | 1,112,086 | |||||||||||||||
|
|
|
|
|
|
|
|
|
|
|
|||||||||||
| Operating income (loss) |
(5,325 | ) | 20,807 | 61,828 | 41,159 | 42,802 | ||||||||||||||
| Other income (expense): |
||||||||||||||||||||
| Interest expense |
(4,444 | ) | (751 | ) | (9,709 | ) | (2,835 | ) | (32,091 | ) | ||||||||||
| Other, net |
67 | 127 | 57 | 22 | 309 | |||||||||||||||
|
|
|
|
|
|
|
|
|
|
|
|||||||||||
| Income (loss) before provision for (benefit from) income taxes |
(9,702 | ) | 20,183 | 52,176 | 38,346 | 11,020 | ||||||||||||||
| Provision for (benefit from) income taxes |
(100 | ) | 4,646 | 20,344 | 15,386 | 3,880 | ||||||||||||||
|
|
|
|
|
|
|
|
|
|
|
|||||||||||
| Net income (loss) |
$ | (9,602 | ) | $ | 15,537 | $ | 31,832 | $ | 22,960 | $ | 7,140 | |||||||||
|
|
|
|
|
|
|
|
|
|
|
|||||||||||
54
Table of Contents
| Year Ended December 31, | Nine Months Ended September 30, |
|||||||||||||||||||
| 2010 | 2011 | 2012 | 2012 | 2013 | ||||||||||||||||
| (as a percentage of total revenues) | ||||||||||||||||||||
| Professional service revenues |
15 | % | 13 | % | 15 | % | 14 | % | 17 | % | ||||||||||
| Insurance service revenues |
85 | 87 | 85 | 86 | 83 | |||||||||||||||
|
|
|
|
|
|
|
|
|
|
|
|||||||||||
| Total revenues |
100 | % | 100 | % | 100 | % | 100 | % | 100 | % | ||||||||||
|
|
|
|
|
|
|
|
|
|
|
|||||||||||
| Costs and operating expenses: |
||||||||||||||||||||
| Insurance costs |
79 | 77 | 74 | 74 | 74 | |||||||||||||||
| Cost of providing services (exclusive of depreciation and amortization of intangible assets) |
8 | 7 | 6 | 6 | 6 | |||||||||||||||
| Sales and marketing |
5 | 5 | 6 | 6 | 7 | |||||||||||||||
| General and administrative |
3 | 4 | 4 | 3 | 3 | |||||||||||||||
| Systems development and programming costs |
2 | 2 | 2 | 2 | 1 | |||||||||||||||
| Amortization of intangible assets |
2 | 1 | 2 | 1 | 3 | |||||||||||||||
| Depreciation |
1 | 1 | 1 | 1 | 1 | |||||||||||||||
| Restructuring |
1 | — | — | — | — | |||||||||||||||
|
|
|
|
|
|
|
|
|
|
|
|||||||||||
| Total costs and operating expenses |
101 | 98 | 94 | 94 | 96 | |||||||||||||||
|
|
|
|
|
|
|
|
|
|
|
|||||||||||
| Operating income (loss) |
(1 | ) | 2 | 6 | 6 | 4 | ||||||||||||||
| Other income (expense): |
||||||||||||||||||||
| Interest expense |
— | — | (1 | ) | — | (3 | ) | |||||||||||||
| Other, net |
— | — | — | — | — | |||||||||||||||
|
|
|
|
|
|
|
|
|
|
|
|||||||||||
| Income (loss) before provision for (benefit from) income taxes |
(1 | ) | 2 | 5 | 6 | 1 | ||||||||||||||
| Provision for (benefit from) income taxes |
— | 1 | 2 | 2 | — | |||||||||||||||
|
|
|
|
|
|
|
|
|
|
|
|||||||||||
| Net income (loss) |
(1 | )% | 2 | % | 3 | % | 3 | % | 1 | % | ||||||||||
|
|
|
|
|
|
|
|
|
|
|
|||||||||||
| Year Ended December 31, | Nine Months Ended September 30, |
|||||||||||||||||||
| 2010 | 2011 | 2012 | 2012 | 2013 | ||||||||||||||||
| (as a percentage of Net Service Revenues) | ||||||||||||||||||||
| Professional service revenues |
72 | % | 60 | % | 55 | % | 53 | % | 66 | % | ||||||||||
| Net Insurance Service Revenues |
28 | 40 | 45 | 47 | 34 | |||||||||||||||
|
|
|
|
|
|
|
|
|
|
|
|||||||||||
| Net Service Revenues |
100 | % | 100 | % | 100 | % | 100 | % | 100 | % | ||||||||||
|
|
|
|
|
|
|
|
|
|
|
|||||||||||
| Other operating expenses: |
||||||||||||||||||||
| Cost of providing services (exclusive of depreciation and amortization of intangible assets) |
37 | 31 | 24 | 25 | 25 | |||||||||||||||
| Sales and marketing |
24 | 20 | 22 | 22 | 27 | |||||||||||||||
| General and administrative |
15 | 17 | 14 | 14 | 13 | |||||||||||||||
| Systems development and programming costs |
8 | 8 | 6 | 7 | 5 | |||||||||||||||
| Amortization of intangible assets . |
9 | 7 | 6 | 4 | 12 | |||||||||||||||
| Depreciation |
6 | 5 | 4 | 5 | 3 | |||||||||||||||
| Restructuring |
3 | 1 | — | — | — | |||||||||||||||
|
|
|
|
|
|
|
|
|
|
|
|||||||||||
| Total other operating expenses |
103 | 89 | 77 | 77 | 86 | |||||||||||||||
|
|
|
|
|
|
|
|
|
|
|
|||||||||||
| Operating income (loss) |
(3 | ) | 11 | 23 | 23 | 14 | ||||||||||||||
| Other income (expense): |
||||||||||||||||||||
| Interest expense |
(2 | ) | — | (4 | ) | (2 | ) | (11 | ) | |||||||||||
| Other, net |
— | — | — | — | — | |||||||||||||||
|
|
|
|
|
|
|
|
|
|
|
|||||||||||
| Income (loss) before provision for (benefit from) income taxes |
(5 | ) | 11 | 19 | 21 | 4 | ||||||||||||||
| Provision for (benefit from) income taxes |
— | 2 | 8 | 9 | 1 | |||||||||||||||
|
|
|
|
|
|
|
|
|
|
|
|||||||||||
| Net income (loss) |
(5 | )% | 8 | % | 12 | % | 13 | % | 2 | % | ||||||||||
|
|
|
|
|
|
|
|
|
|
|
|||||||||||
55
Table of Contents
Nine Months Ended September 30, 2012 and 2013
Total Revenues
| Nine Months Ended September 30, |
Change 2013 vs. 2012 |
|||||||||||||||
| 2012 | 2013 | $ | % | |||||||||||||
| (in thousands, except percentages) | ||||||||||||||||
| Professional service revenues |
$ | 94,892 | $ | 195,642 | $ | 100,750 | 106 | % | ||||||||
| Insurance service revenues |
601,967 | 959,246 | 357,279 | 59 | % | |||||||||||
|
|
|
|
|
|
|
|||||||||||
| Total revenues |
$ | 696,859 | $ | 1,154,888 | $ | 458,029 | 66 | % | ||||||||
|
|
|
|
|
|
|
|||||||||||
| Nine Months Ended September 30, |
Change 2013 vs. 2012 |
|||||||||||||||
| 2012 | 2013 | # | % | |||||||||||||
| Key operating metrics: |
||||||||||||||||
| Total WSEs |
104,747 | 218,069 | 113,322 | 108 | % | |||||||||||
| Total Sales Representatives |
149 | 301 | 152 | 102 | % | |||||||||||
Total revenues for the nine months ended September 30, 2013 increased $458.0 million, or 66%, compared to the same period in 2012. Professional service revenues for the nine months ended September 30, 2013 increased $100.8 million, or 106%, compared to the same period in 2012. Of this amount, $76.8 million was attributable to our acquisitions of SOI, Ambrose and Accord. The remaining growth was primarily due to a 22% increase in Total WSEs (excluding WSEs added as a result of our acquisitions of SOI and Ambrose) and a 6% increase in average professional service revenues per WSE other than those acquired from SOI and Ambrose.
Insurance service revenues for the nine months ended September 30, 2013 increased by $357.2 million, or 59%, compared to the same period in 2012 primarily due to $219.9 million from our acquisitions of SOI, Ambrose and Accord, an increase in Total WSEs other than those acquired from SOI and Ambrose, and a 2% increase in average insurance service revenues per WSE other than those acquired from SOI and Ambrose.
Total WSEs at September 30, 2013 increased by approximately 113,000, or 108%, compared to Total WSEs at September 30, 2012, with approximately 79,000 of such increase due to the SOI and Ambrose acquisitions. The remaining growth in Total WSEs was primarily driven by a net increase in total clients other than those acquired from SOI and Ambrose. Our Total Sales Representatives increased from 149 at September 30, 2012 to 301 at September 30, 2013, 104 of which we acquired from SOI and Ambrose.
Insurance Costs
| Nine Months Ended September 30, |
Change 2013 vs. 2012 |
|||||||||||||||
| 2012 | 2103 | $ | % | |||||||||||||
| (in thousands, except percentage) | ||||||||||||||||
| Insurance costs |
$ | 518,386 | $ | 858,862 | $ | 340,476 | 66 | % | ||||||||
Insurance costs increased $340.5 million, or 66%, compared to the same period in 2012, primarily due to $219.4 million from our acquisitions of SOI, Ambrose and Accord. The remaining increase resulted from an increase in Total WSEs other than those acquired from SOI and Ambrose and a 2% increase in average insurance costs per WSE other than those acquired from SOI and Ambrose.
56
Table of Contents
Net Insurance Service Revenues and Net Service Revenues
| Nine Months Ended September 30, |
Change 2013 vs. 2012 |
|||||||||||||||
| 2012 | 2013 | $ | % | |||||||||||||
| (in thousands, except percentages) | ||||||||||||||||
| Insurance service revenues |
$ | 601,967 | $ | 959,246 | $ | 357,279 | 59 | % | ||||||||
| Less: Insurance costs |
518,386 | 858,862 | 340,476 | 66 | % | |||||||||||
|
|
|
|
|
|
|
|||||||||||
| Net Insurance Service Revenues |
$ | 83,581 | $ | 100,384 | $ | 16,803 | 20 | % | ||||||||
|
|
|
|
|
|
|
|||||||||||
| Nine Months Ended September 30, |
Change 2013 vs. 2012 |
|||||||||||||||
| 2012 | 2013 | $ | % | |||||||||||||
| (in thousands, except percentages) | ||||||||||||||||
| Total revenues |
$ | 696,859 | $ | 1,154,888 | $ | 458,029 | 66 | % | ||||||||
| Less: Insurance costs |
518,386 | 858,862 | 340,476 | 66 | % | |||||||||||
|
|
|
|
|
|
|
|||||||||||
| Net Service Revenues |
$ | 178,473 | $ | 296,026 | $ | 117,553 | 66 | % | ||||||||
|
|
|
|
|
|
|
|||||||||||
For the reasons set forth above, our Net Insurance Service Revenues for the nine months ended September 30, 2013 increased $16.8 million, or 20%, as compared to the same period in 2012, and our Net Service Revenues for the nine months ended September 30, 2013 increased $117.6 million, or 66%, as compared to the same period in 2012.
Other Operating Expenses
| Nine Months Ended September 30, |
Change 2013 vs. 2012 |
|||||||||||||||
| 2012 | 2013 | $ | % | |||||||||||||
| (in thousands, except percentages) | ||||||||||||||||
| Cost of providing services |
$ | 44,944 | $ | 74,042 | $ | 29,098 | 65 | % | ||||||||
| Sales and marketing |
39,377 | 79,387 | 40,010 | 102 | % | |||||||||||
| General and administrative |
24,147 | 39,821 | 15,674 | 65 | % | |||||||||||
| System development and programming costs |
11,893 | 15,140 | 3,247 | 27 | % | |||||||||||
| Amortization of intangible assets |
7,853 | 35,926 | 28,073 | 357 | % | |||||||||||
| Depreciation |
9,100 | 8,908 | (192 | ) | (2 | %) | ||||||||||
|
|
|
|
|
|
|
|||||||||||
| Total other operating expenses |
$ | 137,314 | $ | 253,224 | $ | 115,910 | 84 | % | ||||||||
|
|
|
|
|
|
|
|||||||||||
Cost of Providing Services
| Nine Months Ended September 30, |
Change 2013 vs. 2012 |
|||||||||||||||
| 2012 | 2013 | $ | % | |||||||||||||
| (in thousands, except percentages) | ||||||||||||||||
| Compensation-related costs |
$ | 31,398 | $ | 52,777 | $ | 21,379 | 68 | % | ||||||||
| Facilities |
2,880 | 3,711 | 831 | 29 | % | |||||||||||
| Information technology and communication |
3,488 | 5,809 | 2,321 | 67 | % | |||||||||||
| Other expenses |
7,178 | 11,745 | 4,567 | 64 | % | |||||||||||
|
|
|
|
|
|
|
|||||||||||
| Total cost of providing services |
$ | 44,944 | $ | 74,042 | $ | 29,098 | 65 | % | ||||||||
|
|
|
|
|
|
|
|||||||||||
Cost of providing services for the nine months ended September 30, 2013 increased by $29.1 million, or 65%, compared to the same period in 2012, primarily due to our acquisitions of SOI and Ambrose. Compensation-related costs increased by $21.4 million due to increased headcount, including $14.7 million from our acquisitions of SOI and Ambrose. Facilities-related costs increased by $0.9 million due to our acquisition of SOI, partly offset by a
57
Table of Contents
reduction in expense associated with a renegotiation of certain lease terms. The remainder of the increase was due to an increase in WSEs other than those that we acquired from SOI and Ambrose.
Sales and Marketing
| Nine Months Ended September 30, |
Change 2013 vs. 2012 |
|||||||||||||||
| 2012 | 2013 | $ | % | |||||||||||||
| (in thousands, except percentages) | ||||||||||||||||
| Compensation-related costs |
$ | 25,065 | $ | 52,506 | $ | 27,441 | 109 | % | ||||||||
| Marketing and advertising |
1,376 | 2,494 | 1,118 | 81 | % | |||||||||||
| Facilities |
6,091 | 11,414 | 5,323 | 87 | % | |||||||||||
| Other expenses |
6,845 | 12,973 | 6,128 | 90 | % | |||||||||||
|
|
|
|
|
|
|
|||||||||||
| Total sales and marketing |
$ | 39,377 | $ | 79,387 | $ | 40,010 | 102 | % | ||||||||
|
|
|
|
|
|
|
|||||||||||
Sales and marketing expenses for the nine months ended September 30, 2013 increased by $40.0 million, or 102%, compared to the nine months ended September 30, 2012. Of this increase, $27.4 million was attributable to compensation-related costs, $15.5 million of which was attributable to increased headcount mainly from our acquisitions of SOI and Ambrose and $11.9 million of which was attributable to growth in our direct sales channel, primarily the addition of new sales representatives. The remaining increase in sales and marketing expenses was primarily attributable to marketing and advertising expenses, which increased by $1.1 million, or 81%, mainly from our acquisitions of SOI and Ambrose. In addition, facilities-related expenses increased by $5.3 million, or 87%, primarily due to our acquisitions of SOI and Ambrose, and partly offset by reduction in expense associated with a renegotiation of certain lease terms. Other expenses increased by $6.1 million, or 90%, primarily due to increased sales travel, meeting and conference activities, as well as increased expenses associated with recruiting efforts and information technology spending to support the growth of our sales organization.
General and Administrative
| Nine Months Ended September 30, |
Change 2013 vs. 2012 |
|||||||||||||||
| 2012 | 2013 | $ | % | |||||||||||||
| (in thousands, except percentages) | ||||||||||||||||
| Compensation-related costs |
$ | 14,850 | $ | 24,566 | $ | 9,716 | 65 | % | ||||||||
| Legal and professional fees |
2,969 | 5,655 | 2,686 | 90 | % | |||||||||||
| Other expenses |
6,328 | 9,600 | 3,272 | 52 | % | |||||||||||
|
|
|
|
|
|
|
|||||||||||
| Total general and administrative |
$ | 24,147 | $ | 39,821 | $ | 15,674 | 65 | % | ||||||||
|
|
|
|
|
|
|
|||||||||||
General and administrative expenses for the nine months ended September 30, 2013 increased by $15.7 million, or 65%, primarily due to increased headcount resulting from our acquisitions of SOI and Ambrose and increased legal, professional services and other corporate expenses resulting from these acquisitions and related integration efforts.
Systems Development and Programming
| Nine Months Ended September 30, |
Change 2013 vs. 2012 |
|||||||||||||||
| 2012 | 2013 | $ | % | |||||||||||||
| (in thousands, except percentages) | ||||||||||||||||
| Compensation-related costs |
$ | 8,906 | $ | 11,246 | $ | 2,340 | 26 | % | ||||||||
| Other expenses |
2,987 | 3,894 | 907 | 30 | % | |||||||||||
|
|
|
|
|
|
|
|||||||||||
| Total systems development and programming costs |
$ | 11,893 | $ | 15,140 | $ | 3,247 | 27 | % | ||||||||
|
|
|
|
|
|
|
|||||||||||
58
Table of Contents
Our systems development and programming costs for the nine months ended September 30, 2013 increased by $3.2 million, or 27%, compared to the same period in 2012. Of this increase, $1.3 million was primarily attributable to increased headcount from our acquisitions of SOI and Ambrose. The remaining increase was primarily due to a $1.0 million increase in compensation-related costs resulting from the increase in headcount other than those we acquired from SOI to support and enhance our technology product delivery.
Amortization of Intangible Assets and Depreciation
| Nine Months Ended September 30, |
Change 2013 vs. 2012 |
|||||||||||||||
| 2012 | 2013 | $ | % | |||||||||||||
| (in thousands, except percentages) | ||||||||||||||||
| Amortization of intangible assets |
$ | 7,853 | $ | 35,926 | $ | 28,073 | 357 | % | ||||||||
| Depreciation |
$ | 9,100 | $ | 8,908 | $ | (192 | ) | (2 | %) | |||||||
Our amortization of intangible assets for the nine months ended September 30, 2013 increased by $28.1 million, or 357%, compared to the same period in 2012. Such increase was primarily attributable to our acquisitions of SOI and Ambrose. Depreciation expense for the nine months ended September 30, 2013 decreased by $0.2 million, or 2%, compared to the same period in 2012, primarily attributable to accelerated depreciation recorded in 2012 as a result of our assessment of changes in the extent and manner that certain fixed assets were expected to be used, offset by an increase in depreciation from our acquisitions of SOI and Ambrose.
Other Income (Expense)
| Nine Months Ended September 30, |
Change 2013 vs. 2012 |
|||||||||||||||
| 2012 | 2013 | $ | % | |||||||||||||
| (in thousands, except percentage) | ||||||||||||||||
| Interest expense |
$ | (2,835 | ) | $ | (32,091 | ) | $ | (29,256 | ) | 1,032 | % | |||||
In March 2012, we obtained a $140.0 million senior secured credit facility, which was amended and restated in October 2012 to provide for total borrowings of $350.0 million, and amended again in April 2013 to provide for total borrowings of $500.0 million. In August 2013, we entered into two new senior secured credit facilities for total borrowings of $820.0 million to pay off our previous credit facilities and pay a special dividend. We wrote off $11.4 million of unamortized loan fees in connection with the repayment of the credit facility in August 2013. Interest expense increased correspondingly with the increased indebtedness.
Provision for Income Taxes
| Nine Months Ended September 30, |
Change 2013 vs. 2012 |
|||||||||||||||
| 2012 | 2013 | $ | % | |||||||||||||
| (in thousands, except percentages) | ||||||||||||||||
| Provision for income taxes |
$ | 15,386 | $ | 3,880 | $ | (11,506 | ) | (75 | %) | |||||||
| Effective tax rates |
40.1 | % | 35.2 | % | ||||||||||||
Provision for income taxes for the nine months ended September 30, 2013 decreased by $11.5 million compared to the same period in 2012, primarily due to a decrease in pre-tax income. Our effective tax rate decreased from 40.1% for 2012 to 35.2% for 2013, primarily due to release of uncertain tax positions as a result of statute expirations and a retroactive law change in 2013, allowing for recognition of tax credits for 2012.
59
Table of Contents
Years Ended December 31, 2010, 2011 and 2012
Total Revenues
| Year Ended December 31, | Change 2011 vs. 2010 |
Change 2012 vs. 2011 |
||||||||||||||||||||||||||
| 2010 | 2011 | 2012 | $ | % | $ | % | ||||||||||||||||||||||
| (in thousands, except percentages) | ||||||||||||||||||||||||||||
| Professional service revenues |
$ | 139,495 | $ | 113,279 | $ | 148,233 | $ | (26,216 | ) | (19 | %) | $ | 34,954 | 31 | % | |||||||||||||
| Insurance service revenues |
766,695 | 727,111 | 870,828 | (39,584 | ) | (5 | %) | 143,717 | 20 | % | ||||||||||||||||||
|
|
|
|
|
|
|
|
|
|
|
|||||||||||||||||||
| Total revenues |
$ | 906,190 | $ | 840,390 | $ | 1,019,061 | $ | (65,800 | ) | (7 | %) | $ | 178,671 | 21 | % | |||||||||||||
|
|
|
|
|
|
|
|
|
|
|
|||||||||||||||||||
| Year Ended December 31, | Change 2011 vs. 2010 |
Change 2012 vs. 2011 |
||||||||||||||||||||||||||
| 2010 | 2011 | 2012 | # | % | # | % | ||||||||||||||||||||||
| Key operating metrics: |
||||||||||||||||||||||||||||
| Total WSEs |
96,816 | 83,314 | 174,311 | (13,502 | ) | (14 | %) | 90,997 | 109 | % | ||||||||||||||||||
| Total Sales Representatives |
114 | 80 | 224 | (34 | ) | (30 | %) | 144 | 180 | % | ||||||||||||||||||
Total revenues for 2012 increased $178.7 million, or 21%, compared to 2011. Professional service revenues for 2012 increased $35.0 million, or 31%, compared to 2011. Of this increase, $28.3 million was attributable to our acquisitions of SOI and Accord. The remaining $6.7 million was due to an increase in Total WSEs other than those that we acquired from SOI and Accord and a 3% increase in average professional services revenues per WSE other than those acquired from SOI and Ambrose. Our insurance service revenues for 2012 increased $143.7 million, or 20%, compared to 2011 due to an increase in Total WSEs other than those acquired from SOI and Ambrose and an 8% increase in average insurance service revenues per WSE other than those acquired from SOI and Ambrose.
Total WSEs at December 31, 2012 increased by approximately 91,000 compared to Total WSEs at December 31, 2011, with approximately 80,000 of such increase due to our acquisitions of SOI and Accord. The remaining growth in Total WSEs was driven primarily by a net increase in total clients other than those acquired from SOI and Ambrose. Our Total Sales Representatives increased from 80 at December 31, 2011 to 224 at December 31, 2012, 100 of which we acquired from SOI and Accord.
Following our acquisition of Gevity in June 2009, we elected to change the pricing terms with certain of Gevity’s clients, terminate Gevity’s relationships with certain of its clients, significantly restructure Gevity’s and our combined sales forces and migrate all of Gevity’s WSEs to our technology platform. As a result of these actions, our total revenues declined in 2011 by $65.8 million, or 7%, as compared to 2010. Professional services revenues for 2011 decreased $26.2 million, or 19%, primarily due to a decrease in WSEs, partially offset by a 6% increase in average professional service revenues per WSE resulting from the Gevity restructuring described above. Insurance service revenues for 2011 decreased $39.6 million, or 5%, primarily resulting from the Gevity restructuring activities, offset by an increase in insurance premium rates and an increase in the participation rate of WSEs in our insurance plans. Total WSEs at December 31, 2011 decreased by approximately 14,000 compared to Total WSEs at December 31, 2010 and our Total Sales Representatives decreased by 34 from 114 at December 31, 2010 to 80 at December 31, 2011, primarily due to the Gevity restructuring.
Insurance Costs
| Year Ended December 31, | Change 2011 vs. 2010 |
Change 2012 vs. 2011 |
||||||||||||||||||||||||||
| 2010 | 2011 | 2012 | $ | % | $ | % | ||||||||||||||||||||||
| (in thousands, except percentages) | ||||||||||||||||||||||||||||
| Insurance costs |
$ | 713,653 | $ | 651,094 | $ | 750,025 | $ | (62,559 | ) | (9 | %) | $ | 98,931 | 15 | % | |||||||||||||
Insurance costs for 2012 increased $98.9 million, or 15%, compared to 2011. Of this increase, $63.6 million was attributable to our acquisitions of SOI and Accord. The remaining increase of $35.3 million was due to an
60
Table of Contents
increase in Total WSEs other than those that we acquired from SOI and Accord and a 2% increase in average insurance costs per WSE other than those we acquired from SOI and Ambrose.
Our insurance costs for 2011 decreased $62.6 million, or 9%, primarily resulting from the Gevity restructuring activities.
Net Insurance Service Revenues and Net Service Revenues
| Year Ended December 31, | Change 2011 vs. 2010 |
Change 2012 vs. 2011 |
||||||||||||||||||||||||||
| 2010 | 2011 | 2012 | $ | % | $ | % | ||||||||||||||||||||||
| (in thousands, except percentages) | ||||||||||||||||||||||||||||
| Insurance service revenues |
$ | 766,695 | $ | 727,111 | $ | 870,828 | (39,584 | ) | (5 | %) | 143,717 | 20 | % | |||||||||||||||
| Less: Insurance costs |
713,653 | 651,094 | 750,025 | (62,559 | ) | (9 | %) | 98,931 | 15 | % | ||||||||||||||||||
|
|
|
|
|
|
|
|
|
|
|
|||||||||||||||||||
| Net Insurance Service Revenues |
$ | 53,042 | $ | 76,017 | $ | 120,803 | $ | 22,975 | 43 | % | $ | 44,786 | 59 | % | ||||||||||||||
|
|
|
|
|
|
|
|
|
|
|
|||||||||||||||||||
| Year Ended December 31, | Change 2011 vs. 2010 |
Change 2012 vs. 2011 |
||||||||||||||||||||||||||
| 2010 | 2011 | 2012 | $ | % | $ | % | ||||||||||||||||||||||
| (in thousands, except percentages) | ||||||||||||||||||||||||||||
| Total revenues |
$ | 906,190 | $ | 840,390 | $ | 1,019,061 | $ | (65,800 | ) | (7 | %) | $ | 178,671 | 21 | % | |||||||||||||
| Less: insurance costs |
713,653 | 651,094 | 750,025 | (62,559 | ) | (9 | %) | 98,931 | 15 | % | ||||||||||||||||||
|
|
|
|
|
|
|
|
|
|
|
|||||||||||||||||||
| Net Service Revenues |
$ | 192,537 | $ | 189,296 | $ | 269,036 | $ | (3,241 | ) | (2 | %) | $ | 79,740 | 42 | % | |||||||||||||
|
|
|
|
|
|
|
|
|
|
|
|||||||||||||||||||
For the reasons set forth above, our Net Insurance Service Revenues for 2012 increased by $44.8 million, or 59%, as compared to 2011, and our Net Insurance Service Revenues for 2011 increased by $23.0 million, or 43%, as compared to 2010. Also for the reasons set forth above, our Net Service Revenues for 2012 increased by $79.7 million, or 42%, as compared to 2011, and our Net Service Revenues for 2011 decreased by $3.2 million, or 2%, compared to 2010.
Other Operating Expenses
| Year Ended December 31, | Change 2011 vs. 2010 |
Change 2012 vs. 2011 |
||||||||||||||||||||||||||
| 2010 | 2011 | 2012 | $ | % | $ | % | ||||||||||||||||||||||
| (in thousands, except percentages) | ||||||||||||||||||||||||||||
| Cost of providing services |
$ | 72,073 | $ | 59,388 | $ | 63,563 | $ | (12,685 | ) | (18 | %) | $ | 4,175 | 7 | % | |||||||||||||
| Sales and marketing |
46,454 | 38,087 | 59,931 | (8,367 | ) | (18 | %) | 21,844 | 57 | % | ||||||||||||||||||
| General and administrative |
28,366 | 31,421 | 37,879 | 3,055 | 11 | % | 6,458 | 21 | % | |||||||||||||||||||
| System development and programming costs |
15,045 | 15,646 | 16,718 | 601 | 4 | % | 1,072 | 7 | % | |||||||||||||||||||
| Amortization of intangible assets |
17,960 | 12,388 | 17,441 | (5,572 | ) | (31 | %) | 5,053 | 41 | % | ||||||||||||||||||
| Depreciation |
12,042 | 9,201 | 11,676 | (2,841 | ) | (24 | %) | 2,475 | 27 | % | ||||||||||||||||||
| Restructuring |
5,922 | 2,358 | — | (3,564 | ) | (60 | %) | (2,358 | ) | (100 | %) | |||||||||||||||||
|
|
|
|
|
|
|
|
|
|
|
|||||||||||||||||||
| Total other operating expenses |
$ | 197,862 | $ | 168,489 | $ | 207,208 | $ | (29,373 | ) | (15 | %) | $ | 38,719 | 23 | % | |||||||||||||
|
|
|
|
|
|
|
|
|
|
|
|||||||||||||||||||
61
Table of Contents
Cost of Providing Services
| Year Ended December 31, | Change 2011 vs. 2010 |
Change 2012 vs. 2011 |
||||||||||||||||||||||||||
| 2010 | 2011 | 2012 | $ | % | $ | % | ||||||||||||||||||||||
| (in thousands, except percentages) | ||||||||||||||||||||||||||||
| Compensation-related costs |
$ | 46,258 | $ | 39,618 | $ | 44,629 | $ | (6,640 | ) | (14 | %) | $ | 5,011 | 13 | % | |||||||||||||
| Facilities |
5,284 | 4,729 | 3,941 | (555 | ) | (11 | %) | (788 | ) | (17 | %) | |||||||||||||||||
| Information technology and communication |
7,273 | 4,600 | 4,720 | (2,673 | ) | (37 | %) | 120 | 3 | % | ||||||||||||||||||
| Other expenses |
13,258 | 10,441 | 10,273 | (2,817 | ) | (21 | %) | (168 | ) | (2 | %) | |||||||||||||||||
|
|
|
|
|
|
|
|
|
|
|
|||||||||||||||||||
| Total cost of providing services |
$ | 72,073 | $ | 59,388 | $ | 63,563 | $ | (12,685 | ) | (18 | %) | $ | 4,175 | 7 | % | |||||||||||||
|
|
|
|
|
|
|
|
|
|
|
|||||||||||||||||||
Cost of providing services for 2012 increased by $4.2 million, or 7%, compared to 2011, primarily due to an increase in compensation-related costs, offset in part by a reduction in facilities costs. Compensation-related costs increased by $5.0 million, or 13%, due to increased headcount, including from our acquisitions of SOI and Accord. Facilities-related costs decreased by $0.8 million, or 17%, due to a reduction in expense associated with a renegotiation of certain lease terms. Information technology and communication and other costs included within the cost of providing services remained relatively consistent from period to period.
Cost of providing services for 2011 decreased by $12.7 million, or 18%, compared to 2010, primarily due to a $6.6 million decrease in compensation-related costs resulting from the integration of Gevity and associated restructuring described above. We also reduced redundant functions in customer support. As a result of additional cost-saving measures, information technology and communication costs for 2011 decreased by $2.7 million, or 37%, compared to 2010. Other expenses decreased by $2.8 million, or 21%, in 2011 compared to 2010, primarily due to savings in postage and shipping expenses and employment practices liability insurance-related expenses due to decreased WSEs.
Sales and Marketing
| Year Ended December 31, | Change 2011 vs. 2010 |
Change 2012 vs. 2011 |
||||||||||||||||||||||||||
| 2010 | 2011 | 2012 | $ | % | $ | % | ||||||||||||||||||||||
| (in thousands, except percentages) | ||||||||||||||||||||||||||||
| Compensation-related costs |
$ | 31,102 | $ | 25,410 | $ | 39,740 | $ | (5,692 | ) | (18 | %) | $ | 14,330 | 56 | % | |||||||||||||
| Marketing and advertising |
6,531 | 4,685 | 8,894 | (1,846 | ) | (28 | %) | 4,209 | 90 | % | ||||||||||||||||||
| Facilities |
1,850 | 1,697 | 2,066 | (153 | ) | (8 | %) | 369 | 22 | % | ||||||||||||||||||
| Other expenses |
6,971 | 6,295 | 9,231 | (676 | ) | (10 | %) | 2,936 | 47 | % | ||||||||||||||||||
|
|
|
|
|
|
|
|
|
|
|
|||||||||||||||||||
| Total sales and marketing |
$ | 46,454 | $ | 38,087 | $ | 59,931 | $ | (8,367 | ) | (18 | %) | $ | 21,844 | 57 | % | |||||||||||||
|
|
|
|
|
|
|
|
|
|
|
|||||||||||||||||||
Sales and marketing expenses for 2012 increased by $21.8 million, or 57%, compared to 2011. Of this increase, $5.6 million was attributable to increased headcount from our acquisitions of SOI and Accord and $8.8 million was attributable to our planned growth in our direct sales channel, primarily the addition of new sales representatives. The remaining increase in sales and marketing expenses for 2012 compared to 2011 was primarily attributable to marketing and advertising expenses, which increased by $4.2 million, or 90%, including $1.9 million attributable to our acquisitions of SOI and Accord. In addition, facilities-related expenses increased by $0.4 million, or 22%, primarily due to our acquisitions of SOI and Accord, and partly offset by reduction in expense associated with a renegotiation of certain lease terms. Other expenses increased by $2.9 million, or 47%, primarily due to increased sales travel, meeting and conference activities, and increased expenses associated with recruiting efforts and information technology spending to support the growth of the sales organization.
Sales and marketing expenses for 2011 decreased by $8.4 million, or 18%, compared to 2010. Of this decrease, $5.7 million was due to a decrease in compensation-related expenses that was mainly attributable to the Gevity
62
Table of Contents
restructuring, which resulted in an 18% reduction in our total sales workforce. The remaining decrease was due to a decrease in marketing and advertising expense of $1.8 million resulting from fewer marketing events and conferences in 2011 as compared to 2010 and a reduction in incentivized partnership and referral programs. The reduction in other expenses of $0.7 million was primarily due to a reduction in sales travel and related expenses.
General and Administrative
| Year Ended December 31, | Change 2011 vs. 2010 |
Change 2012 vs. 2011 |
||||||||||||||||||||||||||
| 2010 | 2011 | 2012 | $ | % | $ | % | ||||||||||||||||||||||
| (in thousands, except percentages) | ||||||||||||||||||||||||||||
| Compensation-related costs |
$ | 17,303 | $ | 19,041 | $ | 23,384 | $ | 1,738 | 10 | % | $ | 4,343 | 23 | % | ||||||||||||||
| Legal and professional fees |
2,563 | 4,882 | 4,904 | 2,319 | 90 | % | 22 | 0 | % | |||||||||||||||||||
| Other expenses |
8,500 | 7,498 | 9,591 | (1,002 | ) | (12 | %) | 2,093 | 28 | % | ||||||||||||||||||
|
|
|
|
|
|
|
|
|
|
|
|||||||||||||||||||
| Total general and administrative |
$ | 28,366 | $ | 31,421 | $ | 37,879 | $ | 3,055 | 11 | % | $ | 6,458 | 21 | % | ||||||||||||||
|
|
|
|
|
|
|
|
|
|
|
|||||||||||||||||||
General and administrative expenses for 2012 increased by $6.5 million, or 21%, compared to 2011. Of this increase, $4.3 million was attributable to increased compensation-related expenses resulting from our acquisitions of SOI and Accord. In addition, other corporate expenses increased by $2.1 million, or 28%, from 2011 to 2012, primarily due to our acquisitions of SOI and Accord and associated integration efforts.
General and administrative expenses for 2011 increased by $3.1 million, or 11%, compared to 2010. Of this increase, $1.7 million was attributable to an increase in compensation-related costs due to the adoption of a standardized company-wide bonus plan and $2.3 million was attributable to increased legal and professional fees. These increases were offset in part by a $1.0 million savings in other expenses due to an improved credit policy and collection process leading to a reduction in bad debt expenses.
Systems Development and Programming
| Year Ended December 31, | Change 2011 vs. 2010 |
Change 2012 vs. 2011 |
||||||||||||||||||||||||||
| 2010 | 2011 | 2012 | $ | % | $ | % | ||||||||||||||||||||||
| (in thousands, except percentages) | ||||||||||||||||||||||||||||
| Compensation-related costs |
$ | 11,902 | $ | 11,777 | $ | 12,427 | $ | (125 | ) | (1 | %) | $ | 650 | 6 | % | |||||||||||||
| Other expenses |
3,143 | 3,869 | 4,291 | 726 | 23 | % | 422 | 11 | % | |||||||||||||||||||
|
|
|
|
|
|
|
|
|
|
|
|||||||||||||||||||
| Total systems development and programming costs |
$ | 15,045 | $ | 15,646 | $ | 16,718 | $ | 601 | 4 | % | $ | 1,072 | 7 | % | ||||||||||||||
|
|
|
|
|
|
|
|
|
|
|
|||||||||||||||||||
Systems development and programming costs for 2012 increased by $1.1 million, or 7%, compared to 2011. Of this increase, $0.7 million was attributable to compensation-related costs due to our acquisition of SOI. The remaining $0.4 million was primarily due to an increase in outsourced consulting services in conjunction with product development.
Systems development and programming costs for 2011 increased by $0.6 million, or 4%, compared to 2010. This increase was primarily due to an increase in outsourced consulting services in conjunction with product development.
Amortization of Intangible Assets and Depreciation
| Year Ended December 31, | Change 2011 vs. 2010 |
Change 2012 vs. 2011 |
||||||||||||||||||||||||||
| 2010 | 2011 | 2012 | $ | % | $ | % | ||||||||||||||||||||||
| (in thousands, except percentages) | ||||||||||||||||||||||||||||
| Amortization of intangible assets |
$ | 17,960 | $ | 12,388 | $ | 17,441 | $ | (5,572 | ) | (31 | %) | $ | 5,053 | 41 | % | |||||||||||||
| Depreciation |
$ | 12,042 | $ | 9,201 | $ | 11,676 | $ | (2,841 | ) | (24 | %) | $ | 2,475 | 27 | % | |||||||||||||
63
Table of Contents
In 2012, our amortization of intangible assets expense increased by $5.1 million, or 41%, and depreciation expense increased by $2.5 million, or 27%, compared to 2011. Such increases were primarily due to our acquisitions of SOI and Accord as well as additional property and equipment purchases to support our growth and to enhance our client service capacity.
In 2011, our amortization of intangible assets decreased $5.6 million, or 31%, as compared to 2010, primarily due to the completion of amortization of previously acquired intangible assets. Depreciation expense for 2011 decreased by $2.8 million, or 24%, compared to 2010, which was primarily due to completion of depreciation of certain furniture, fixtures and equipment.
In addition, due to significant changes in the extent and manner in which certain assets were expected to be used, we accelerated depreciation expenses of $0.9 million, $0.4 million and $2.8 million in the years ended December 31, 2010, 2011 and 2012, respectively.
Restructuring
| Year Ended December 31, | Change 2011 vs. 2010 |
Change 2012 vs. 2011 |
||||||||||||||||||||||||||
| 2010 | 2011 | 2012 | $ | % | $ | % | ||||||||||||||||||||||
| (in thousands, except percentages) | ||||||||||||||||||||||||||||
| Restructuring |
$ | 5,922 | $ | 2,358 | $ | — | $ | (3,564 | ) | (60 | %) | $ | (2,358 | ) | (100 | %) | ||||||||||||
As described under “—Recent Acquisitions,” we conducted a restructuring related to our Gevity acquisition in 2010 and 2011, resulting in restructuring charges of $5.9 million in 2010 and $2.4 million in 2011.
Other Income (Expense)
| Year Ended December 31, | Change 2011 vs. 2010 |
Change 2012 vs. 2011 |
||||||||||||||||||||||||||
| 2010 | 2011 | 2012 | $ | % | $ | % | ||||||||||||||||||||||
| (in thousands, except percentages) | ||||||||||||||||||||||||||||
| Interest expense |
$ | (4,444 | ) | $ | (751 | ) | $ | (9,709 | ) | $ | 3,693 | (83 | %) | $ | (8,958 | ) | 1,193 | % | ||||||||||
In March 2012, we obtained a $140.0 million senior secured credit facility, which was amended and restated in October 2012 to provide for total borrowings of $350.0 million. In connection with the amendment and restatement of the credit facility in October 2012, we recognized a charge of $3.1 million to fully amortize loan fees related to the initial credit facility and recorded a total of $10.8 million in loan fees for the amendment of the credit facility to be amortized over five years on a straight-line basis, resulting in higher interest expense in 2012 as compared to 2011.
Interest expense for 2011 was $0.8 million, compared to $4.4 million in 2010, primarily due to a $60.0 million term loan in 2009 that was fully paid in 2010. There was no term loan drawn during 2011.
Provision for (Benefit from) Income Taxes
| Year Ended December 31, | Change 2011 vs. 2010 |
Change 2012 vs. 2011 |
||||||||||||||||||||||||||
| 2010 | 2011 | 2012 | $ | % | $ | % | ||||||||||||||||||||||
| (in thousands, except percentages) | ||||||||||||||||||||||||||||
| Provision for (benefit from) income taxes |
$ | (100 | ) | $ | 4,646 | $ | 20,344 | $ | 4,746 | NM | $ | 15,698 | 338 | % | ||||||||||||||
| Effective tax rates |
1.0 | % | 23.0 | % | 39.0 | % | ||||||||||||||||||||||
Our provision for income taxes for 2012 increased by $15.7 million compared to 2011 primarily due to the increase in our pre-tax income. Our effective tax rate increased from 23.0% for 2011 to 39.0% in 2012. Our effective tax rate for 2011 was positively impacted by the release of uncertain tax positions due to statute expirations and forfeitures of incentive stock options.
64
Table of Contents
Provision for income taxes for 2011 increased by $4.7 million compared to 2010 primarily due to the increase in pre-tax income. Our effective tax rate increased from 1.0% for 2010 to 23.0% in 2011. The 1.0% effective tax rate for 2010 resulted from recognition of uncertain tax positions.
Quarterly Results of Operations and Other Data
The following tables set forth selected unaudited quarterly statement of operations data for the seven quarters ended September 30, 2013, as well as the percentage that each line item represents of our total revenues and Net Service Revenues. The information for each of these quarters has been prepared on the same basis as our audited annual financial statements included elsewhere in this prospectus and, in the opinion of management, includes all adjustments, which include only normal recurring adjustments, necessary for the fair statement of our consolidated results of operations for these periods. This data should be read in conjunction with our audited consolidated financial statements and related notes included elsewhere in this prospectus. Our quarterly results of operations will vary in the future. These quarterly operating results are not necessarily indicative of our operating results for a full year or any future period.
| Three Months Ended | ||||||||||||||||||||||||||||
| Mar. 31, 2012 |
Jun. 30, 2012 |
Sep. 30, 2012 |
Dec. 31, 2012 |
Mar. 31, 2013 |
Jun. 30, 2013 |
Sep. 30, 2013 |
||||||||||||||||||||||
| (in thousands) | ||||||||||||||||||||||||||||
| Consolidated Statement of Operations Data: |
||||||||||||||||||||||||||||
| Professional service revenues |
$ | 30,181 | $ | 31,475 | $ | 33,236 | $ | 53,341 | $ | 59,231 | $ | 61,080 | $ | 75,331 | ||||||||||||||
| Insurance service revenues |
188,778 | 201,132 | 212,057 | 268,861 | 291,839 | 302,352 | 365,055 | |||||||||||||||||||||
|
|
|
|
|
|
|
|
|
|
|
|
|
|
|
|||||||||||||||
| Total revenues |
218,959 | 232,607 | 245,293 | 322,202 | 351,070 | 363,432 | 440,386 | |||||||||||||||||||||
|
|
|
|
|
|
|
|
|
|
|
|
|
|
|
|||||||||||||||
| Costs and operating expenses: |
||||||||||||||||||||||||||||
| Insurance costs |
156,427 | 177,371 | 184,588 | 231,639 | 253,912 | 269,217 | 335,733 | |||||||||||||||||||||
| Cost of providing services (exclusive of depreciation and amortization of intangible assets)(1) |
14,419 | 14,662 | 15,863 | 18,619 | 22,815 | 23,671 | 27,556 | |||||||||||||||||||||
| Sales and marketing(1) |
10,504 | 13,160 | 15,713 | 20,554 | 22,631 | 25,389 | 31,367 | |||||||||||||||||||||
| General and administrative(1) |
6,659 | 9,459 | 8,029 | 13,732 | 12,487 | 12,741 | 14,593 | |||||||||||||||||||||
| Systems development and programming costs(1) |
3,615 | 4,052 | 4,226 | 4,825 | 4,510 | 5,578 | 5,052 | |||||||||||||||||||||
| Amortization of intangible assets |
2,276 | 2,895 | 2,682 | 9,588 | 10,306 | 10,178 | 15,442 | |||||||||||||||||||||
| Depreciation |
2,113 | 4,913 | 2,074 | 2,576 | 2,826 | 2,726 | 3,356 | |||||||||||||||||||||
| Restructuring |
— | — | — | — | — | — | — | |||||||||||||||||||||
|
|
|
|
|
|
|
|
|
|
|
|
|
|
|
|||||||||||||||
| Total costs and operating expenses |
196,013 | 226,512 | 233,175 | 301,533 | 329,487 | 349,500 | 433,099 | |||||||||||||||||||||
|
|
|
|
|
|
|
|
|
|
|
|
|
|
|
|||||||||||||||
| Operating income |
22,946 | 6,095 | 12,118 | 20,669 | 21,583 | 13,932 | 7,287 | |||||||||||||||||||||
| Other income (expense): |
||||||||||||||||||||||||||||
| Interest expense |
(348 | ) | (1,233 | ) | (1,254 | ) | (6,874 | ) | (5,152 | ) | (7,037 | ) | (19,902 | ) | ||||||||||||||
| Other, net |
(23 | ) | (4 | ) | 49 | 35 | 73 | 161 | 75 | |||||||||||||||||||
|
|
|
|
|
|
|
|
|
|
|
|
|
|
|
|||||||||||||||
| Income (loss) before provision for (benefit from) income taxes |
22,575 | 4,858 | 10,913 | 13,830 | 16,504 | 7,056 | (12,540 | ) | ||||||||||||||||||||
| Provision for (benefit from) income taxes |
9,048 | 2,084 | 4,254 | 4,958 | 5,967 | 2,713 | (4,800 | ) | ||||||||||||||||||||
|
|
|
|
|
|
|
|
|
|
|
|
|
|
|
|||||||||||||||
| Net income |
$ | 13,527 | $ | 2,774 | $ | 6,659 | $ | 8,872 | $ | 10,537 | $ | 4,343 | $ | (7,740 | ) | |||||||||||||
|
|
|
|
|
|
|
|
|
|
|
|
|
|
|
|||||||||||||||
65
Table of Contents
| (1) | Includes stock-based compensation expense as follows: |
| Three Months Ended | ||||||||||||||||||||||||||||
| Mar. 31, 2012 |
Jun. 30, 2012 |
Sep. 30, 2012 |
Dec. 31, 2012 |
Mar. 31, 2013 |
Jun. 30, 2013 |
Sep. 30, 2013 |
||||||||||||||||||||||
| (in thousands) | ||||||||||||||||||||||||||||
| Cost of providing services (exclusive of depreciation and amortization of intangible assets) |
$ | 106 | $ | 163 | $ | 113 | $ | 135 | $ | 247 | $ | 269 | $ | 254 | ||||||||||||||
| Sales and marketing |
118 | 183 | 63 | 136 | 273 | 359 | 250 | |||||||||||||||||||||
| General and administrative |
907 | 874 | 723 | 639 | 753 | 767 | 851 | |||||||||||||||||||||
| Systems development and programming costs |
35 | 45 | 66 | 55 | 87 | 110 | 140 | |||||||||||||||||||||
|
|
|
|
|
|
|
|
|
|
|
|
|
|
|
|||||||||||||||
| Total stock-based compensation expense |
$ | 1,166 | $ | 1,265 | $ | 965 | $ | 965 | $ | 1,360 | $ | 1,505 | $ | 1,495 | ||||||||||||||
|
|
|
|
|
|
|
|
|
|
|
|
|
|
|
|||||||||||||||
| Three Months Ended | ||||||||||||||||||||||||||||
| Mar. 31, 2012 |
Jun. 30, 2012 |
Sep. 30, 2012 |
Dec. 31, 2012 |
Mar. 31, 2013 |
Jun. 30, 2013 |
Sep. 30, 2013 |
||||||||||||||||||||||
| (as a percentage of total revenues) | ||||||||||||||||||||||||||||
| Consolidated Statement of Operations Data: |
||||||||||||||||||||||||||||
| Professional service revenues |
14 | % | 14 | % | 14 | % | 17 | % | 17 | % | 17 | % | 17 | % | ||||||||||||||
| Insurance service revenues |
86 | 86 | 86 | 83 | 83 | 83 | 83 | |||||||||||||||||||||
|
|
|
|
|
|
|
|
|
|
|
|
|
|
|
|||||||||||||||
| Total revenues |
100 | 100 | 100 | 100 | 100 | 100 | 100 | |||||||||||||||||||||
|
|
|
|
|
|
|
|
|
|
|
|
|
|
|
|||||||||||||||
| Costs and operating expenses: |
||||||||||||||||||||||||||||
| Insurance costs |
71 | 76 | 75 | 72 | 72 | 74 | 76 | |||||||||||||||||||||
| Cost of providing services (exclusive of depreciation and amortization of intangible assets) |
7 | 6 | 6 | 6 | 6 | 7 | 6 | |||||||||||||||||||||
| Sales and marketing |
5 | 6 | 6 | 6 | 6 | 7 | 7 | |||||||||||||||||||||
| General and administrative |
3 | 4 | 3 | 4 | 4 | 4 | 3 | |||||||||||||||||||||
| Systems development and programming costs |
2 | 2 | 2 | 1 | 1 | 2 | 1 | |||||||||||||||||||||
| Amortization of intangible assets |
1 | 1 | 1 | 3 | 3 | 3 | 4 | |||||||||||||||||||||
| Depreciation |
1 | 2 | 1 | 1 | 1 | 1 | 1 | |||||||||||||||||||||
| Restructuring |
— | — | — | — | — | — | — | |||||||||||||||||||||
|
|
|
|
|
|
|
|
|
|
|
|
|
|
|
|||||||||||||||
| Total costs and operating expenses |
90 | 97 | 95 | 94 | 94 | 96 | 98 | |||||||||||||||||||||
|
|
|
|
|
|
|
|
|
|
|
|
|
|
|
|||||||||||||||
| Operating income (loss) |
10 | 3 | 5 | 6 | 6 | 4 | 2 | |||||||||||||||||||||
| Other income (expense): |
||||||||||||||||||||||||||||
| Interest expense |
— | (1 | ) | (1 | ) | (2 | ) | (1 | ) | (2 | ) | (5 | ) | |||||||||||||||
| Other, net |
— | — | — | — | — | — | — | |||||||||||||||||||||
|
|
|
|
|
|
|
|
|
|
|
|
|
|
|
|||||||||||||||
| Income (loss) before provision for (benefit from) income taxes |
10 | 2 | 4 | 4 | 5 | 2 | (3 | ) | ||||||||||||||||||||
| Provision for (benefit from) income taxes |
4 | 1 | 2 | 2 | 2 | 1 | (1 | ) | ||||||||||||||||||||
|
|
|
|
|
|
|
|
|
|
|
|
|
|
|
|||||||||||||||
| Net income (loss) |
6 | % | 1 | % | 3 | % | 3 | % | 3 | % | (1 | )% | (2 | )% | ||||||||||||||
|
|
|
|
|
|
|
|
|
|
|
|
|
|
|
|||||||||||||||
66
Table of Contents
| Three Months Ended | ||||||||||||||||||||||||||||
| Mar 31, 2012 |
Jun 30, 2012 |
Sep 30, 2012 |
Dec 31, 2012 |
Mar 31, 2013 |
Jun 30, 2013 |
Sep 30, 2013 |
||||||||||||||||||||||
| (as a percentage of Net Service Revenues) | ||||||||||||||||||||||||||||
| Consolidated Statement of Operations Data: |
||||||||||||||||||||||||||||
| Professional service fees |
48 | % | 57 | % | 55 | % | 59 | % | 61 | % | 65 | % | 72 | % | ||||||||||||||
| Net Insurance Service Revenues |
52 | 43 | 45 | 41 | 39 | 35 | 28 | |||||||||||||||||||||
|
|
|
|
|
|
|
|
|
|
|
|
|
|
|
|||||||||||||||
| Net Service Revenues |
100 | 100 | 100 | 100 | 100 | 100 | 100 | |||||||||||||||||||||
|
|
|
|
|
|
|
|
|
|
|
|
|
|
|
|||||||||||||||
| Operating expenses: |
||||||||||||||||||||||||||||
| Cost of providing services (exclusive of depreciation and amortization of intangible assets) |
23 | 27 | 26 | 21 | 23 | 25 | 26 | |||||||||||||||||||||
| Sales and marketing |
17 | 24 | 26 | 23 | 23 | 27 | 30 | |||||||||||||||||||||
| General and administrative |
11 | 17 | 13 | 15 | 13 | 14 | 14 | |||||||||||||||||||||
| Systems development and programming costs |
6 | 7 | 7 | 5 | 5 | 6 | 5 | |||||||||||||||||||||
| Amortization of intangible assets |
4 | 5 | 4 | 11 | 11 | 11 | 15 | |||||||||||||||||||||
| Depreciation |
3 | 9 | 3 | 3 | 3 | 3 | 3 | |||||||||||||||||||||
| Restructuring |
— | — | — | — | — | — | — | |||||||||||||||||||||
|
|
|
|
|
|
|
|
|
|
|
|
|
|
|
|||||||||||||||
| Total operating expenses |
63 | 89 | 80 | 77 | 78 | 85 | 93 | |||||||||||||||||||||
|
|
|
|
|
|
|
|
|
|
|
|
|
|
|
|||||||||||||||
| Operating income |
37 | 11 | 20 | 23 | 22 | 15 | 7 | |||||||||||||||||||||
| Other income (expense): |
||||||||||||||||||||||||||||
| Interest expense |
(1 | ) | (2 | ) | (2 | ) | (8 | ) | (5 | ) | (7 | ) | (19 | ) | ||||||||||||||
| Other, net |
— | — | — | — | — | — | — | |||||||||||||||||||||
|
|
|
|
|
|
|
|
|
|
|
|
|
|
|
|||||||||||||||
| Income before provision for (benefit from) income taxes |
36 | 9 | 18 | 15 | 17 | 7 | (12 | ) | ||||||||||||||||||||
| Provision for (benefit from) income taxes |
14 | 4 | 7 | 5 | 6 | 3 | (5 | ) | ||||||||||||||||||||
|
|
|
|
|
|
|
|
|
|
|
|
|
|
|
|||||||||||||||
| Net income |
22 | % | 5 | % | 11 | % | 10 | % | 11 | % | 5 | % | (7 | )% | ||||||||||||||
|
|
|
|
|
|
|
|
|
|
|
|
|
|
|
|||||||||||||||
| Three Months Ended | ||||||||||||||||||||||||||||
| Mar. 31, 2012 |
Jun. 30, 2012 |
Sep. 30, 2012 |
Dec. 31, 2012 |
Mar. 31, 2013 |
Jun. 30, 2013 |
Sep. 30, 2013 |
||||||||||||||||||||||
| Other Operational and Financial Data: |
||||||||||||||||||||||||||||
| Total WSEs |
84,059 | 102,987 | 104,747 | 174,311 | 185,894 | 197,458 | 218,069 | |||||||||||||||||||||
| Total Sales Representatives |
83 | 129 | 149 | 224 | 234 | 298 | 301 | |||||||||||||||||||||
| Net Insurance Service Revenues (in thousands) |
$ | 32,350 | $ | 23,762 | $ | 27,469 | $ | 37,222 | $ | 37,927 | $ | 33,135 | $ | 29,322 | ||||||||||||||
| Net Service Revenues (in thousands) |
$ | 62,532 | $ | 55,236 | $ | 60,705 | $ | 90,563 | $ | 97,158 | $ | 94,215 | $ | 104,653 | ||||||||||||||
| Adjusted EBITDA (in thousands) |
$ | 28,478 | $ | 15,164 | $ | 17,888 | $ | 33,833 | $ | 36,148 | $ | 28,502 | $ | 27,655 | ||||||||||||||
| Adjusted Net Income (in thousands) |
$ | 15,627 | $ | 5,312 | $ | 8,884 | $ | 15,311 | $ | 18,096 | $ | 11,913 | $ | 3,234 | ||||||||||||||
67
Table of Contents
The table below sets forth a reconciliation of GAAP insurance service revenues to Net Insurance Service Revenues:
| Three Months Ended | ||||||||||||||||||||||||||||
| Mar. 31, 2012 |
Jun. 30, 2012 |
Sep. 30, 2012 |
Dec. 31, 2012 |
Mar. 31, 2013 |
Jun. 30, 2013 |
Sep. 30, 2013 |
||||||||||||||||||||||
| (in thousands) | ||||||||||||||||||||||||||||
| Insurance service revenues |
$ | 188,778 | $ | 201,132 | $ | 212,057 | $ | 268,861 | $ | 291,839 | $ | 302,352 | $ | 365,055 | ||||||||||||||
| Less: Insurance costs |
156,427 | 177,371 | 184,588 | 231,639 | 253,912 | 269,217 | 335,733 | |||||||||||||||||||||
|
|
|
|
|
|
|
|
|
|
|
|
|
|
|
|||||||||||||||
| Net Insurance Service Revenues |
$ | 32,351 | $ | 23,761 | $ | 27,469 | $ | 37,222 | $ | 37,927 | $ | 33,135 | $ | 29,322 | ||||||||||||||
|
|
|
|
|
|
|
|
|
|
|
|
|
|
|
|||||||||||||||
The table below sets forth a reconciliation of GAAP total revenues to Net Service Revenues:
| Three Months Ended | ||||||||||||||||||||||||||||
| Mar. 31, 2012 |
Jun. 30, 2012 |
Sep. 30, 2012 |
Dec. 31, 2012 |
Mar. 31, 2013 |
Jun. 30, 2013 |
Sep. 30, 2013 |
||||||||||||||||||||||
| (in thousands) | ||||||||||||||||||||||||||||
| Total revenues |
$ | 218,959 | $ | 232,607 | $ | 245,293 | $ | 322,202 | $ | 351,070 | $ | 363,432 | $ | 440,386 | ||||||||||||||
| Less: Insurance costs |
156,427 | 177,371 | 184,588 | 231,639 | 253,912 | 269,217 | 335,733 | |||||||||||||||||||||
|
|
|
|
|
|
|
|
|
|
|
|
|
|
|
|||||||||||||||
| Net Service Revenues |
$ | 62,532 | $ | 55,236 | $ | 60,705 | $ | 90,563 | $ | 97,158 | $ | 94,215 | $ | 104,653 | ||||||||||||||
|
|
|
|
|
|
|
|
|
|
|
|
|
|
|
|||||||||||||||
The table below sets forth a reconciliation of GAAP net income (loss) to Adjusted EBITDA:
| Three Months Ended | ||||||||||||||||||||||||||||
| Mar. 31, 2012 |
Jun. 30, 2012 |
Sep. 30, 2012 |
Dec. 31, 2012 |
Mar. 31, 2013 |
Jun. 30, 2013 |
Sep. 30, 2013 |
||||||||||||||||||||||
| (in thousands) | ||||||||||||||||||||||||||||
| Net income |
$ | 13,527 | $ | 2,774 | $ | 6,659 | $ | 8,872 | $ | 10,537 | $ | 4,343 | $ | (7,740 | ) | |||||||||||||
| Provision for (benefit from) income taxes |
9,048 | 2,084 | 4,254 | 4,958 | 5,967 | 2,713 | (4,800 | ) | ||||||||||||||||||||
| Stock-based compensation |
1,166 | 1,265 | 965 | 965 | 1,360 | 1,505 | 1,495 | |||||||||||||||||||||
| Interest expense |
348 | 1,233 | 1,254 | 6,874 | 5,152 | 7,037 | 19,902 | |||||||||||||||||||||
| Depreciation |
2,113 | 4,913 | 2,074 | 2,576 | 2,826 | 2,726 | 3,356 | |||||||||||||||||||||
| Amortization of intangible assets |
2,276 | 2,895 | 2,682 | 9,588 | 10,306 | 10,178 | 15,442 | |||||||||||||||||||||
|
|
|
|
|
|
|
|
|
|
|
|
|
|
|
|||||||||||||||
| Adjusted EBITDA |
$ | 28,478 | $ | 15,164 | $ | 17,888 | $ | 33,833 | $ | 36,148 | $ | 28,502 | $ | 27,655 | ||||||||||||||
|
|
|
|
|
|
|
|
|
|
|
|
|
|
|
|||||||||||||||
The table below sets forth a reconciliation of GAAP net income (loss) to Adjusted Net Income:
| Three Months Ended | ||||||||||||||||||||||||||||
| Mar. 31, 2012 |
Jun. 30, 2012 |
Sep. 30, 2012 |
Dec. 31, 2012 |
Mar. 31, 2013 |
Jun. 30, 2013 |
Sep. 30, 2013 |
||||||||||||||||||||||
| Net income |
$ | 13,527 | $ | 2,774 | $ | 6,659 | $ | 8,872 | $ | 10,537 | $ | 4,343 | $ | (7,740 | ) | |||||||||||||
| Stock-based compensation |
1,166 | 1,265 | 965 | 965 | 1,360 | 1,505 | 1,495 | |||||||||||||||||||||
| Amortization of intangible assets |
2,276 | 2,895 | 2,682 | 9,588 | 10,306 | 10,178 | 15,442 | |||||||||||||||||||||
| Income tax impact of pre-tax adjustments at the effective tax rate |
(1,342 | ) | (1,622 | ) | (1,422 | ) | (4,114 | ) | (4,107 | ) | (4,113 | ) | (5,964 | ) | ||||||||||||||
|
|
|
|
|
|
|
|
|
|
|
|
|
|
|
|||||||||||||||
| Adjusted Net Income |
$ | 15,627 | $ | 5,312 | $ | 8,884 | $ | 15,311 | $ | 18,096 | $ | 11,913 | $ | 3,233 | ||||||||||||||
|
|
|
|
|
|
|
|
|
|
|
|
|
|
|
|||||||||||||||
68
Table of Contents
Quarterly Revenues and Insurance Costs Trends
Our professional service revenues have increased in each quarter starting with the first quarter of 2012 due to our acquisitions of Accord in the second quarter of 2012, SOI in the fourth quarter of 2012 and Ambrose in the third quarter of 2013, combined with net total client increases due to expansion of our Total Sales Representatives and an increase in professional service revenues charged per WSE.
Our insurance service revenues consist of insurance-related billings and administrative fees. Administrative fees generally fluctuate with our Total WSEs. Insurance costs are adversely impacted by claims activities. We have historically experienced higher claim volumes in the second and third quarters of a fiscal year than in the first and fourth quarters of a fiscal year, which have increased our insurance costs in the second and third quarters of a fiscal year. Insurance claims activity can fluctuate significantly based on the volume and severity of claims in any quarter.
Quarterly Operating Expense Trends
Cost of providing services generally varies in responding to the growth of WSEs and from costs associated with client related legal claims. In the fourth quarter of 2012 and third quarter of 2013, cost of providing services increased significantly as a result of the acquisitions of SOI and Ambrose, respectively.
Sales and marketing expense generally varies from quarter to quarter based on the timing of promotional activities and when we add sales representatives. Typically sales and marketing expenses increase in the third fiscal quarter because we invest during that quarter in our annual sales meeting and promotional campaigns. In addition, in the second quarter of 2012 we aggressively expanded our sales representative team to allow us to further penetrate different vertical markets and expand our national presence. Sales and marketing expense also increased in the fourth quarter of 2012 primarily related to our acquisition of SOI.
General and administrative expense varies from quarter to quarter based on the timing of expenses related to corporate initiatives such as financing and acquisition activities, legal and other professional services such as audit, tax, valuation, actuarial and recruiting. General and administrative expense increased significantly in fourth quarter of 2012 primarily as a result of our acquisition of SOI.
Systems development and programming costs are most significantly affected by changes in the stage of development of our internal use software, which determines whether amounts spent are capitalized or expensed. Our systems development and programming costs increased starting in the fourth quarter of 2012 primarily as a result of our acquisition of SOI.
Depreciation expense has increased moderately from 2012 to 2013 as we continued to acquire and develop software to enhance our services and for our internal use. In addition, we regularly review the useful life of our assets and assess the appropriateness of the remaining useful lives. As a result of our regular review, for the second quarter of 2012, we accelerated the depreciation of certain software and recorded an additional depreciation expense of $2.8 million, resulting in a significant increase in depreciation expense for that quarter.
Amortization of intangible assets expense has increased from $2.1 million in the first quarter of 2012 to $9.6 million in fourth quarter of 2012, $10.3 million in the first quarter of 2013 and $15.4 million in the third quarter of 2013, primarily as a result of our acquisitions of SOI and Ambrose. We generally amortize intangible assets acquired from business combinations over a period of three to five years. Amortization of intangible assets is significantly affected by the timing of any additional acquisitions and it could be impacted by our regular impairment analysis. Impairment charges are recorded in the period when such impairment is identified.
Stock compensation expense varies from quarter to quarter and is generally impacted by the stock option grant activities such as timing of new option grants, forfeitures and the change in our common stock value.
Internal Control Over Financial Reporting
In preparing and reviewing our consolidated financial statements as of and for the nine months ended September 30, 2013, we and our independent registered public accounting firm identified a material weakness in
69
Table of Contents
our internal control over financial reporting. A material weakness is a deficiency, or a combination of deficiencies, in internal control over financial reporting such that there is a reasonable possibility that a material misstatement of our financial statements will not be prevented or detected on a timely basis. The material weakness identified related to our incorrectly recording a deferred tax asset in connection with our accounting for our acquisition of Ambrose that should have been recorded as goodwill. As such, our controls over financial reporting were not designed or operating effectively, and as a result there were adjustments required in connection with closing our books and records and preparing our consolidated financial statements for the nine months ended September 30, 2013.
In response to this material weakness, we plan to hire additional personnel to build our financial management and reporting infrastructure, and further develop and document our accounting policies and financial reporting procedures. However, we cannot assure you that we will be successful in pursuing these measures or that these measures will significantly improve or remediate the material weakness described above. We also cannot assure you that we have identified all of our existing material weaknesses, or that we will not in the future have additional material weaknesses.
Neither we nor our independent registered public accounting firm has performed an evaluation of our internal control over financial reporting during any period in accordance with the provisions of the Sarbanes-Oxley Act. In light of the material weakness that was identified as a result of the limited procedures performed, we believe that it is possible that, had we and our independent registered public accounting firm performed an evaluation of our internal control over financial reporting in accordance with the provisions of the Sarbanes-Oxley Act, additional material weaknesses or significant control deficiencies may have been identified.
Liquidity and Capital Resources
Our principal source of liquidity for operations is derived from cash provided by operating activities. We rely on cash provided by operating activities to meet our short-term liquidity requirements, which primarily relate to the payment of corporate payroll and other operating costs, and capital expenditures. Our credit facilities have been used to fund acquisitions and dividends, and we have not relied on these facilities to provide liquidity for our operations. Our cash flow related to WSE payroll and benefits is generally matched by advance collection from our clients. To minimize the credit risk associated with remitting the payroll and associated taxes and benefits costs, we require clients to prefund the payroll and related payroll taxes and benefits costs. To the extent this does not occur, our results of operations and cash flow may be negatively impacted.
WSE-related liabilities can fluctuate significantly due to various factors, including the day of the week on which a client payroll period ends, the existence of holidays at or immediately following a client payroll period-end and various federal and state compliance calendars. We report the advance collection from our clients as payroll funds collected within WSE-related assets on our balance sheet. Our cash and cash equivalents reported on our balance sheet represent our corporate cash available to meet corporate liquidity requirements, capital spending and expansion plans, potential acquisitions, debt service requirements and other corporate operating cash needs.
The following table shows our capital resources for the stated periods:
| As of | As
of September 30, 2013 |
|||||||||||
| December 31, | ||||||||||||
| 2011 | 2012 | |||||||||||
| (in thousands) | ||||||||||||
| Cash and cash equivalents |
$ | 31,620 | $ | 63,749 | $ | 112,161 | ||||||
| Working capital: |
||||||||||||
| Corporate working capital |
$ | 23,207 | $ | 16,019 | $ | 77,132 | ||||||
| WSE-related assets, net of WSE-related liabilities |
$ | 3,217 | $ | 11,361 | $ | 8,409 | ||||||
We had cash and cash equivalents of $63.7 million and $112.2 million as of December 31, 2012 and September 30, 2013, respectively. The increase was primarily due to the cash generated from operations during
70
Table of Contents
the nine months ended September 30, 2013 and borrowings under our new credit facilities. In August 2013, we borrowed an aggregate of $820.0 million under our new credit facilities. We used approximately $448.3 million of that amount to repay indebtedness outstanding under our previous credit facility and $310.8 million to pay a special cash dividend to holders of our capital stock. We believe that our existing cash and cash equivalents, working capital and cash provided by operating activities will be sufficient to meet our working capital and capital expenditure needs for at least the next 12 months.
WSE-related assets consist of cash and investments restricted for current workers compensation deductible payments, payroll funds collected, accounts receivable, unbilled revenues and refundable or prepaid amounts related to our sponsored workers compensation and health plan programs. WSE-related liabilities consist of customer prepayments, wages and payroll taxes accrued and payable and liabilities related to our sponsored workers compensation and health plan programs resulting from deductible reserves and premium amounts due to providers for enrolled employees expected to be disbursed within the next 12 months.
Our working capital asset accounts consist of cash and cash equivalents, accounts receivables, prepaid assets, WSE-related assets and other current assets. Liabilities included within working capital include accounts payable, accrued expenses, WSE-related liabilities and other current liabilities and the current portion of our notes payable. As of September 30, 2013, we had $77.1 million in corporate working capital and $8.4 million in WSE-related assets net of WSE-related liabilities. Corporate working capital increased by $61.1 million as compared to December 31, 2012 primarily due to an increase in cash and cash equivalents resulting from positive cash flow from operations and borrowings under our August 2013 credit facilities. Net WSE-related assets decreased by $3.0 million as compared to December 31, 2012 mainly due to the timing of collections from clients and payments of associated WSE-related liabilities. Included in WSE-related assets as of September 30, 2013 is $207.7 million of payroll funds collected from customers, which represents cash available to settle short-term WSE-related operating liabilities. Changes in WSE-related assets and liabilities are included in operating cash flow in our consolidated statement of cash flows.
Under the terms of the agreements with our workers compensation insurance carriers, we are required to maintain collateral accounts to fund the carriers’ claim payments within our deductible layer. The collateral amount is determined at the beginning of each plan year based on estimated workers compensation wages and claim histories and the insurance carrier may adjust the balance when facts and circumstances change. As of September 30, 2013, we had $21.5 million of restricted cash included in WSE-related assets and $37.0 million of marketable securities designated as long-term restricted cash and investments on the consolidated balance sheet. Our restricted marketable securities investment portfolio represents U.S. long-term treasuries and mutual funds. We regularly review the collateral balances with our insurance carriers, and we do not anticipate any material additional collateral obligations to be required in 2013 for our workers compensation arrangements.
At September 30, 2013, we had approximately $820 million of outstanding debt under our credit facilities. Of this outstanding indebtedness, $175 million represents borrowings under our first lien tranche B-1 term loan, which is due in August 2016. We intend to repay $ million of outstanding indebtedness with proceeds of this offering, including approximately $ million of the first lien tranche B-1 term loan. See “Use of Proceeds.” The repayment of the remaining portion of the first lien tranche B-1 term loan could adversely affect our liquidity if we have not generated sufficient cash from our operations to meet this obligation when it is due.
71
Table of Contents
Cash Flows
We generated positive cash flows from operating activities during each of 2010, 2011 and 2012 and the nine months ended September 30, 2012 and 2013. We also have the ability to generate cash through our financing arrangements under our credit facility to meet short-term funding requirements related to WSE-related obligations. The following table shows our cash flows from operating activities, investing activities and financing activities for the stated periods:
| Year
Ended December 31, |
Nine Months
Ended September 30, |
|||||||||||||||||||
| 2010 | 2011 | 2012 | 2012 | 2013 | ||||||||||||||||
| (in thousands) | ||||||||||||||||||||
| Consolidated Cash Flow Data: |
||||||||||||||||||||
| Net cash provided by (used in): |
||||||||||||||||||||
| Operating activities |
$ | 71,433 | $ | 46,572 | $ | 80,254 | $ | 49,597 | $ | 62,080 | ||||||||||
| Investing activities |
(7,137 | ) | (7,154 | ) | (262,608 | ) | (61,499 | ) | (206,794 | ) | ||||||||||
| Financing activities |
(56,491 | ) | (53,326 | ) | 214,478 | 26,091 | 193,146 | |||||||||||||
| Effect of exchange rates on cash and cash equivalents |
(12 | ) | (7 | ) | 5 | 73 | (20 | ) | ||||||||||||
|
|
|
|
|
|
|
|
|
|
|
|||||||||||
| Net increase (decrease) in cash and cash equivalents |
$ | 7,793 | $ | (13,915 | ) | $ | 32,129 | $ | 14,262 | $ | 48,412 | |||||||||
|
|
|
|
|
|
|
|
|
|
|
|||||||||||
Cash Flows from Operating Activities
Net cash provided by operating activities was $62.1 million for the nine months ended September 30, 2013, $49.6 million for the nine months ended September 30, 2012, and $80.3 million, $46.6 million and $71.4 million for 2012, 2011 and 2010, respectively. Historically, cash provided by operating activities has been affected by our net income (loss), adjusted for non-cash expense items (such as depreciation, amortization of intangible assets, deferred income taxes, expense associated with stock-based compensation) and changes in working capital accounts. The fluctuation in our working capital accounts was primarily driven by WSE-related assets and liabilities.
Cash Flows from Investing Activities
Net cash used in investing activities was $206.8 million for the nine months ended September 30, 2013, as compared to $61.5 million for the same period in 2012. In the first nine months of 2012, we used $27.5 million for the acquisitions of Accord and ExpenseCloud and a $27.5 million investment in marketable securities compared to $193.7 million (net of cash acquired) for the acquisition of Ambrose and $7.3 million invested in debt securities in 2013. Net cash used in investing activities was $262.6 million in 2012, compared to net cash used in investing activities of $7.2 million and $7.1 million in 2011 and 2010, respectively. The significant increase in net cash used in investing activities in 2012 as compared to 2010 and 2011 was primarily related to our acquisitions of SOI and Accord, increased capital expenditures and our investment in debt securities to match our long-term liabilities under our workers compensation program.
Cash Flows from Financing Activities
Net cash provided by financing activities was $193.1 million for the nine months ended September 30, 2013, compared to $26.1 million for the same period in 2012. Net cash provided by financing activities during the nine months ended September 30, 2013 was largely attributable to the borrowing of $150.0 million from our previous credit facility in connection with our acquisition of Ambrose and the borrowing of $820.0 million from our new credit facilities, partially offset by $24.6 million in payments for debt issuance costs, $450.1 million in loan repayments, $11.8 million in common stock repurchases and a $310.9 million special dividend. During the nine months ended September 30, 2012, net cash provided by financing activities was largely attributable to the borrowing of $105.0 million pursuant to a term loan, offset by the payment of a $75.3 million special dividend. Net
72
Table of Contents
cash provided by financing activities was $214.5 million for 2012, compared with net cash used in financing activities of $53.3 million and $56.5 million for 2011 and 2010, respectively. Net cash provided by financing activities during 2012 was largely attributable to our borrowing of $405.0 million under our credit facility and receipt of $5.4 million in proceeds from stock option exercises, offset by $105.7 million in repayments of notes payable, the payment of a $75.4 million special dividend and the payment of $14.0 million in debt issuance costs. During 2011, net cash used in financing activities was mainly attributable to our payment of a $50.9 million special dividend. During 2010, net cash used in financing activities was mainly related to our repayment of $52.7 million in notes payable.
Credit Facilities
In August 2013, we, as guarantor, our subsidiary TriNet HR Corporation, as borrower, and certain of our other subsidiaries as subsidiary guarantors entered into two senior secured credit facilities:
| • | a $705.0 million first lien credit facility with JPMorgan Chase Bank, N.A., as administrative agent; and |
| • | a $190.0 million second lien credit facility with Wilmington Trust, National Association, as administrative agent. |
We refer to these as our first lien credit facility and our second lien credit facility, respectively, and collectively as our credit facilities. The credit facilities are secured by substantially all of our assets and the assets of the borrower and of our subsidiary guarantors, other than specifically excluded assets. Certain of the underwriters acted as syndication agents, arrangers and book-runners for our credit facilities. See “Underwriting.”
The first lien credit facility provides for a five-year revolving credit facility of $75.0 million, three-year first lien tranche B-1 term loan of $175.0 million and seven-year first lien tranche B-2 term loan of $455.0 million. A second lien credit facility provides for a seven-year-and-six-month term loan of $190.0 million. All first lien and second lien term loans were fully drawn in August 2013. The $75.0 million revolving credit facility includes capacity for a $30.0 million letter of credit facility and a $10.0 million swingline facility. The total unused portion of the revolving credit facility was $52.2 million as of September 30, 2013, because $22.8 million of the facility was used to backstop letters of credit outstanding under a previous credit facility. The proceeds of the first and second lien credit facilities were used to repay approximately $448.3 million of indebtedness outstanding under our previous credit facility, declare a special dividend, provide cash collateral to guarantee a letter of credit and pay transaction costs. In connection with the credit facilities, we incurred $23.1 million of debt issuance costs.
Borrowings under our credit facilities bear interest, at our option at a rate based on the London Interbank Offered Rate, or LIBOR, or based on the prime rate plus, in each case, an applicable margin. LIBOR loans under the tranche B-2 term loan and the second lien credit facility are subject to a 1.00% LIBOR floor. The applicable margin with respect to our tranche B-1 term loan is equal to (i) 3.75% per annum for LIBOR loans and (ii) 2.75% per annum for prime rate loans. The applicable margin with respect to our tranche B-2 term loan is equal to (x) at such times as any indebtedness is outstanding under our second lien credit facility (i) 4.00% per annum for LIBOR loans, and (ii) 3.00% per annum for prime rate loans, and (y) at such times as no indebtedness is outstanding under our second lien credit facility (i) 3.75% per annum for LIBOR loans, and (ii) 2.75% per annum for prime rate loans. The applicable margin with respect to our second lien term loans is equal to (i) 7.75% per annum for LIBOR loans and (ii) 6.75% per annum for prime rate loans. The applicable margin with respect to our revolving credit facility is subject to adjustment based on our first lien leverage ratio. The tranche B-1 term loan has a maturity date of August 20, 2016, the tranche B-2 term loan has a maturity date of August 20, 2020 and the second lien term loan has a maturity date of February 20, 2021 and the revolving credit facility has a maturity date of August 20, 2018.
We may make prepayments of principal under the first lien credit facility at any time and from time to time, without premium or penalty, except that a 1% premium would apply to a repayment via a repricing of the loan under the tranche B-2 term loan effected on or prior to August 20, 2014. We may make prepayments of principal
73
Table of Contents
under our second lien facility at any time and from time to time. However, voluntary prepayments and mandatory prepayments of the second lien credit facility are subject to a 2% premium for prepayments prior to August 20, 2014 and a 1% premium for prepayments on or after August 20, 2014 but prior to August 20, 2015; provided that prepayments with the proceeds from our initial public offering are subject to a premium of only 1% if made on or prior to December 18, 2013.
We are required to make quarterly principal repayments of the tranche B-1 and B-2 term loans beginning on December 31, 2013 equal to 0.25% of the original principal amount. We are required to make prepayments of borrowings under the credit facilities (without payment of a premium) with (i) net cash proceeds from certain non-ordinary course asset sales and casualty and condemnation proceeds (subject to reinvestment rights and other exceptions), (ii) net cash proceeds from issuances of debt (other than certain permitted debt), and (iii) beginning with the fiscal year ending December 31, 2014, 50% of our excess cash flow as defined in the credit agreements related to each of the credit facilities (subject to decrease to (x) 25% if our total leverage ratio as of the last day of such fiscal year is less than 3.75 to 1.0 and equal to or greater than 3.00 to 1.00 and (y) 0% if our total leverage ratio as of the last day of such fiscal year is less than 3.00 to 1.0), provided that we may defer prepayments based on excess cash flow to the extent such payments would result in our GAAP working capital being less than $10.0 million (after giving effect to such prepayments). In addition, we are required to apply the net proceeds from the initial public offering of our common stock to prepay the second lien term loans.
Our credit facilities contain customary representations and warranties and customary affirmative and negative covenants applicable to us and our subsidiaries, including, among other things, restrictions on indebtedness, liens, investments, mergers, dispositions, prepayment of other indebtedness, and dividends and other distributions. The credit facilities contain the following events of default subject in certain cases to customary grace periods and notice requirements: (i) failure to pay principal, interest and other obligations when due, (ii) material misrepresentations by us, the borrower or any of the subsidiary guarantors, (iii) breach by us, the borrower or any subsidiary guarantor of covenants, conditions or agreements in the credit facilities, (iv) failure by us, the borrower or any subsidiary to make any payments when due under material indebtedness, (v) certain acceleration events with respect to material indebtedness, (vi) certain bankruptcy events with respect to us or any of our material subsidiaries, (vii) failure by us or any material subsidiary to pay judgments for the payment of money in an aggregate amount in excess of $10,000,000, (viii) the occurrence of certain ERISA events that could reasonably be expected to result in a material adverse effect on our business, assets, operations or financial condition, our ability to perform our obligations under the credit facilities or the rights and remedies of the lenders and the administrative agents; (ix) failure of certain liens securing the credit facilities to be, or asserted by us or any guarantor not to be, valid and perfected, (x) failure of any guarantee by the subsidiary guarantors to be in full force and effect, (xi) failure of the first lien/second lien intercreditor agreement to be enforceable against the parties thereto, and (xii) the occurrence of a change of control.
Our previous credit facility consisted of a revolving credit facility, a term A loan and a term B loan. Borrowings under our previous credit facility bore interest, at our option, at a rate based on LIBOR or the prime rate plus, in each case, an applicable margin. The applicable margin with respect to the term B loan was equal to (i) 5.25% per annum for LIBOR loans, subject to a 1.25% LIBOR floor, and (ii) 4.25% per annum for prime rate loans, subject to a 2.25% prime rate floor. The applicable margin with respect to the term A loan and the previous revolving credit facility was subject to adjustment based on our consolidated total leverage ratio. The term A loan and the previous revolving credit facility had a maturity date of October 24, 2017 and the term B loan had a maturity date of October 24, 2018. The remaining balance of associated loan fees of $11.4 million was fully amortized in August 2013.
74
Table of Contents
Contractual Obligations and Commitments
The following table summarizes our contractual obligations and commercial commitments as of September 30, 2013, and the effect they are expected to have on our liquidity and capital resources (in thousands):
| Payments Due by Period | ||||||||||||||||||||
| Total | Less than 1 year |
1-3 years | 3-5 years | More than 5 years |
||||||||||||||||
| Long-term debt obligations |
$ | 820,000 | $ | 1,575 | $ | 12,600 | $ | 180,163 | $ | 625,662 | ||||||||||
| Interest on debt obligations |
303,928 | 17,133 | 93,358 | 82,928 | 110,509 | |||||||||||||||
| Workers compensation liabilities |
75,140 | 19,921 | 19,704 | 10,862 | 24,653 | |||||||||||||||
| Capital lease obligation |
636 | 179 | 448 | 9 | — | |||||||||||||||
| Operating lease obligations |
26,071 | 2,341 | 16,154 | 4,033 | 3,543 | |||||||||||||||
| Purchase obligations |
49,961 | 49,284 | 677 | — | — | |||||||||||||||
| Uncertain tax positions |
2,960 | 2,487 | 473 | — | — | |||||||||||||||
|
|
|
|
|
|
|
|
|
|
|
|||||||||||
| Total |
$ | 1,278,696 | $ | 92,920 | $ | 143,414 | $ | 277,995 | $ | 764,367 | ||||||||||
|
|
|
|
|
|
|
|
|
|
|
|||||||||||
Workers compensation liabilities represented in the table above are considered contractual obligations because they represent the estimated costs of reimbursing the carriers for paying claims within the deductible layer in accordance with workers compensation insurance policies. Workers compensation liabilities include estimates for reported claims, plus estimates for claims incurred but not reported, and estimates of certain expenses associated with processing and settling the claims. These estimates are subject to significant uncertainty. The actual amount to be paid is not finally determined until we reach a settlement with the insurance carrier. Final claim settlements may vary significantly from the present estimates, particularly because many claims will not be settled until well into the future. In estimating the timing of future payments by year, we have assumed that our historical payment patterns will continue. However, the actual timing of future payments could vary materially from these estimates due to, among other things, changes in claim reporting and payment patterns and large unanticipated settlements.
Our purchase obligations represented in the table above primarily consist of obligations for renewal premiums on workers compensation policies, software licenses and maintenance, sales and marketing events and professional and consulting fees. These are associated with agreements that we believe are enforceable and legally binding and that specify all significant terms, including fixed or minimum services to be used, fixed, minimum or variable price provisions, and the approximate timing of the transaction. Obligations under contracts that we can cancel without a significant penalty are not included in the table above.
To support our growth and expansion, we may lease additional office space. Many of our operating lease agreements provide us with the option to renew. Our future operating lease obligations would change if we exercised these options and if we entered into additional operating lease agreements as we expand our operations.
In the normal course of business, we make representations and warranties that guarantee the performance of services under service arrangements with clients. Historically, there has been no material losses related to such guarantees. In addition, in connection with our initial public offering, we will be entering into indemnification agreements with our officers and directors, which require us to defend and, if necessary, indemnify these individuals for certain pending or future legal claims as they relate to their services provided to us. Such indemnification obligations are not included in the table above.
Critical Accounting Policies, Estimates and Judgments
Our consolidated financial statements have been prepared in accordance with U.S. generally accepted accounting principles. The preparation of these consolidated financial statements requires us to make significant estimates, assumptions and judgments that affect the amounts of assets, liabilities, service revenues and expenses and related disclosures. We base our estimates and judgments on historical experience and on various other
75
Table of Contents
assumptions that we believe to be reasonable under the circumstances. Significant estimates include allowances for accounts receivable, workers compensation related assets and liabilities, health plan assets and liabilities, recoverability of goodwill and other intangible assets, income taxes, stock-based compensation and other contingent liabilities. Actual results could differ from those estimates.
The following accounting policies are critical and/or require significant judgments and estimates in the preparation of our consolidated financial statements.
Revenue Recognition
Professional service revenues represent service fees charged to clients for co-employment services including processing HR transactions such as payroll and employment tax withholding and labor and benefit law compliance based on either a fixed fee per WSE per month or per transaction, or a percentage of WSEs’ payroll. Professional service revenues also include fees billed for other HR-related services such as talent acquisitions, performance management and time and expense reporting services in accordance with separate written service agreements. We recognize professional service revenues in the period the services are rendered and earned under service arrangements with clients where service fees are fixed or determinable and collectability is reasonably assured.
Insurance service revenues consist of insurance-related amounts and administrative fees collected from clients and withheld from WSEs for risk-based insurance plans provided through third-party insurance carriers, primarily employee health benefit insurance and workers compensation insurance. We recognize insurance service revenues in the period amounts are due and collectability is reasonably assured.
The professional service revenues and insurance service revenues are each considered separate units of accounting and the associated fees and insurance premiums are billed as such for the majority of our clients. For clients billed through a bundled invoice, the selling price of significant deliverables is determined based on the best estimate of selling price.
We are not the primary obligor for payroll and payroll tax payments and therefore these payments are not reflected as either revenue or expense. The gross payroll and payroll tax payments made on behalf of our clients, combined, were $8.5 billion, $7.9 billion and $10.0 billion for the years ended December 31, 2010, 2011, and 2012 respectively, and $6.7 billion and $7.7 billion for the nine months ended September 30, 2012 and 2013, respectively.
We record a liability relating to work performed by WSEs but unpaid at the end of each period in the period in which the WSE performs work along with the related receivable for the same period. We generally charge an upfront non-refundable set-up fee for which the performance of such services is not a discrete earnings event and therefore the revenue is recognized on a straight-line basis over the estimated average client tenure.
Insurance Costs
Insurance costs includes insurance premiums paid to the insurance carriers for the health and workers compensation insurance coverage and the reimbursements paid to the insurance carriers for claim payments made by them within the insurance deductible layer.
Workers Compensation Insurance Reserves
We establish workers compensation insurance reserves to provide for our estimated costs of reimbursing our workers compensation insurance carriers for paying claims within the deductible layer in accordance with workers compensation insurance policies. These reserves include estimates for reported losses, plus amounts for those claims not yet reported, and estimates of certain expenses incurred by our carriers and third-party administrators in the course of processing and settling the claims. In establishing our workers compensation insurance reserves, we use an independent actuarial estimate of undiscounted future cash payments that would be made to settle the claims.
In estimating these reserves, we utilize our historical loss experience, exposure data and actuarial judgment, together with a range of inputs that are primarily based upon the WSEs’ job responsibilities, their location, the
76
Table of Contents
historical frequency and severity of workers compensation claims, and an estimate of future cost trends. All of these components can materially impact the reserves as reported in our consolidated financial statements. For each reporting period, we incorporate changes in the actuarial assumptions resulting from changes in our actual claims experience and other trends into our workers compensation claims cost estimates. Accordingly, final claim settlements may vary from the present estimates, particularly when those payments may not occur until well into the future.
We review the adequacy of our workers compensation insurance reserves on a quarterly basis. We reflect adjustments to previously established reserves in our results of operations for the period in which the adjustments are identified. These adjustments can be significant, reflecting any variety of new and adverse or favorable trends. Any unexpected increases in the severity or frequency of claims could harm our operating results.
We do not discount loss reserves accrued under these programs. We record claim costs that we expect to be paid within one year as accrued workers compensation costs and include them in worksite employee related liabilities as short-term liabilities, and we include costs that we expect to be paid beyond one year in long-term liabilities on our consolidated balance sheets.
At policy inception, we estimate annual premiums based on projected wages over the duration of the policy period. As actual wages are realized, the amounts paid for premiums may differ from the estimates we record, creating an asset or liability throughout the policy year. These differences can have a material effect on our consolidated financial position and results of operations.
Health Benefits Insurance Reserves
We establish health benefits insurance reserves to provide for our estimated costs of reimbursing our health benefits insurance carriers for paying claims within the deductible layer in accordance with health insurance policies. These reserves include estimates for reported losses, plus amounts for those claims not yet reported. We determine our health benefits insurance reserves based upon a number of factors, including actuarial calculations, our current and historical claims payment patterns, plan enrollment and medical trend rates. We record these reserves within health benefits payable and include them in WSE-related liabilities on our consolidated balance sheets.
Under certain contracts, based on plan performance, we may be entitled to receive refunds of premiums that we pay to our health benefits insurance carriers. We estimate these refunds based on our premium and claims data and record the prepaid health plan assets within WSE-related assets on our consolidated balance sheets. These prepaid health plan assets require our management to make assumptions and to apply judgment based on actuarial assumptions, claim history, medical trends and other industry-specific factors. If actual results are not consistent with our estimates or assumptions, it could harm our financial condition and results of operations.
We review the adequacy of our health benefits insurance reserves on a quarterly basis. We reflect adjustments to previously established reserves in our results of operations for the period in which the adjustments are identified. These adjustments can be significant, reflecting any variety of new and adverse or favorable trends. Any unexpected increases in the severity or frequency of claims could harm our operating results.
Goodwill and Other Intangible Assets
Our goodwill and identifiable intangible assets with indefinite useful lives are not amortized, but instead are tested for impairment annually in the fourth quarter or when an event occurs or circumstances change in a way to indicate that there has been a potential decline in the fair value of the reporting unit. Impairment is determined by comparing the estimated fair value of the reporting unit to its carrying amount, including goodwill. Our business is largely homogeneous and, as a result, all the goodwill is associated with one reporting unit. In 2011, we adopted the accounting standard that provides for performing a qualitative assessment to determine whether it is more likely than not that the fair value of the reporting unit has declined below carrying value. This assessment requires significant management judgment to evaluate the impact of various financial, macroeconomic, industry, and reporting unit specific qualitative factors.
Intangible assets with finite useful lives include purchased client lists, trade names, developed technologies and contractual agreements. Fair value of our intangible assets acquired in business combinations are corroborated using
77
Table of Contents
appraisals that are performed by independent third-party valuation firms. The assumptions utilized to determine the fair value of our intangible assets requires management’s assessment of various factors including business strategies and future expectations. Intangible assets are amortized over their respective estimated useful lives using either the straight-line method or an accelerated method, ranging from two to six years. Intangible assets are reviewed for indicators of impairment at least annually and evaluated for impairment whenever events or changes in circumstances indicate that the carrying amount of an asset may not be recoverable.
These types of analyses contain uncertainties requiring management to make assumptions and to apply judgment to estimate industry economic factors and the profitability of future business strategies. It is our policy to conduct impairment testing based on our current business strategy in light of present industry and economic conditions, as well as our future expectations. We do not believe that there is a reasonable likelihood that there will be a material change in the future estimates or assumptions we use to test for impairment losses for goodwill and other intangible assets. However, if actual results are not consistent with our estimates or assumptions, we may be exposed to an impairment charge that could be material.
Impairment of Long-Lived Assets
Long-lived assets, such as property, equipment and capitalized internal use software subject to amortization, are reviewed for impairment whenever events or changes in circumstances indicate that the carrying amount of an asset may not be recoverable such as: (i) a significant adverse change in the extent or manner in which it is being used or in its physical condition, (ii) a significant adverse change in legal factors or in business climate that could affect its value, or (iii) a current-period operation or cash flow loss combined with a history of operating or cash flow losses or a projection or forecast that demonstrates continuing losses associated with its use.
An asset is considered impaired if the carrying amount exceeds the undiscounted future net cash flows the asset is expected to generate. An impairment charge is recognized for the amount by which the carrying amount of the assets exceeds its fair value. The adjusted carrying amount of the asset becomes its new cost basis. For a depreciable long-lived asset, the new cost basis will be depreciated or amortized over the remaining useful life of that asset. Assets to be disposed of are reported at the lower of the carrying amount or fair value, less selling costs.
Our impairment loss calculations contain uncertainties which require management to make assumptions and to apply judgment to estimate future cash flows and asset fair values, including forecasting useful lives of the assets and selecting the discount rate that reflects the risk inherent in future cash flows.
Stock-Based Compensation
We have historically issued two types of stock-based awards to employees: restricted stock units and stock options. We have not issued any restricted stock units since 2010. Compensation expense associated with restricted stock units is based on the fair value of our common stock on the grant date. Compensation expense associated with stock options is based on the estimated grant date fair value method using the Black-Scholes valuation model. Expense is recognized, net of estimated forfeitures, using a straight-line amortization method over the respective vesting period for awards during which the employee is required to perform service in exchange for such award.
Our option-pricing model requires the input of highly subjective assumptions, including the fair value of our common stock, the expected term of the option, the expected volatility of the price of our common stock, risk-free interest rates and the expected dividend yield of our common stock. Because our common stock is not publicly traded, we estimate the fair value of the underlying common stock as discussed in “Common Stock Valuations” below. Other variables are estimated as follows:
| • | Risk-free interest rate is based on the implied yield available on U.S. Treasury zero-coupon issues with an equivalent remaining term of the options. |
| • | Expected term represents the period that our share-based awards are expected to be outstanding. We estimated the expected term for a “plain vanilla” option using the simplified method allowed under current guidance, which uses the midpoint between the graded vesting period and the contractual termination date. |
78
Table of Contents
| • | Expected volatility is determined by taking the average historical volatilities of our peer group based on daily price observations over a period equivalent to the expected term of the option. Our peer group consists of public companies primarily in HR service industry and are similar to us in size, stage of life cycle, and financial leverage. We intend to continue to consistently apply this process using the same or similar public companies until a sufficient amount of historical information regarding the volatility of our own common stock share price becomes available, or unless circumstances change such that the identified companies are no longer similar to us, in which case, more suitable companies whose share prices are publicly available would be utilized in the calculation. |
| • | We declared special dividends in May 2011, March 2012 and August 2013. These dividends are considered extraordinary and non-recurring event. Consequently, we used an expected dividend yield of zero. |
We estimate forfeitures based on historical forfeitures of equity awards and adjust the rate to reflect voluntary termination behaviors as well as trends of actual forfeitures. We will continue to evaluate our estimated forfeiture rate if actual forfeitures differ from our initial estimates. Quarterly changes in the estimated forfeiture rate can have a significant impact on our share-based compensation expense as the cumulative effect of adjusting the rate is recognized in the period the forfeiture estimate is changed.
The following table sets forth the assumptions made with respect to these assumptions for the periods presented:
| Year Ended December 31, | Nine Months
Ended September 30, |
|||||||||||||||||||
| 2010 | 2011 | 2012 | 2012 | 2013 | ||||||||||||||||
| Expected volatility |
50 | % | 48 | % | 46 | % | 46 | % | 48 | % | ||||||||||
| Expected term (in years) |
6.00 | 5.77 | 6.04 | 6.03 | 6.04 | |||||||||||||||
| Risk-free interest rate |
2.04 | % | 2.29 | % | 1.01 | % | 1.03 | % | 1.22 | % | ||||||||||
| Expected dividend yield |
0 | % | 0 | % | 0 | % | 0 | % | 0 | % | ||||||||||
| Weighted-average grant-date fair value of stock options |
$ | 4.33 | $ | 4.04 | $ | 3.01 | $ | 3.17 | $ | 7.59 | ||||||||||
These assumptions represent management’s best estimates which involve inherent uncertainties and the application of management’s judgment. If facts and circumstances change and different assumptions are used, our share-based compensation expense could be materially different in the future. As we continue to accumulate additional data related to our common stock, we may have refinements to our estimates, which could materially impact our future share-based compensation expense.
Common Stock Valuations
We are required to estimate the fair value of our common stock underlying our share-based awards when performing the fair value calculations with the Black-Scholes option-pricing model. The fair values of our common stock underlying our share-based awards were determined by our board of directors, with input from management and contemporaneous valuations. We believe that our board of directors has the relevant experience and expertise to determine the fair value of our common stock. Our board of directors determined the fair value of our common stock on each date of grant based on a number of factors including:
| • | a contemporaneous valuation analysis performed by an independent valuation firm; |
| • | our performance, growth rate, financial condition and future financial projections at the approximate time of the option grant; |
| • | the value of companies that we consider peers based on a number of factors including, but not limited to, similarity to us with respect to industry, business model, stage of growth, financial risk or other factors; |
| • | changes in our business and our prospects since the last time our board of directors approved option grants and made a determination of fair value; |
| • | lack of marketability of our common stock; |
79
Table of Contents
| • | likelihood of achieving a liquidity event, such as an initial public offering or a merger or acquisition of our company given prevailing market conditions; and |
| • | the rights, preferences and privileges of our preferred stock relative to those of our common stock. |
For the periods presented, in the absence of a public trading market of our common stock, our board of directors exercised reasonable judgment and considered numerous objective and subjective factors to determine the best estimate of the fair value of our common stock in accordance with the American Institute of Certified Public Accountants Practice Guide, Valuation of Privately-Held-Company Equity Securities Issued as Compensation. In valuing our common stock, our board of directors determined the equity value of our business, based on an independent contemporaneous valuation analysis generally using the income approach, and the market comparable approach valuation methods. The income approach estimates value based on the expectation of future cash flows that a company will generate—such as cash earnings, cost savings, tax deductions, and proceeds from disposition. The value beyond the projection period was captured using the Gordon Growth Model. These future cash flows and terminal value were discounted to their present values using a discount rate derived from an analysis of the cost of capital of comparable publicly traded companies in our industry or similar lines of business as of each valuation date and is adjusted to reflect the risks inherent in our cash flows forecast.
The market comparable approach estimates value based on a comparison of the subject company to comparable public companies in a similar line of business. From the comparable companies, a representative market value multiple is determined which is applied to the subject company’s operating results to estimate the value of the subject company. In our valuations, the multiple of the comparable companies was determined using a ratio of the market value of invested capital less cash to each of trailing 12-month Adjusted EBITDA and the forecasted Adjusted EBITDA for the then-current fiscal year. To determine our peer group of companies, we selected public companies in the HR-related service industry.
Once we determined an equity value, we utilized the option pricing method, or OPM, to allocate the equity value to each of our classes of stock. OPM values each equity class by creating a series of call options on our equity value, with exercise prices based on the liquidation preferences, participation rights, and strike prices of derivatives. Lastly, we applied a marketability discount to the resulting common stock value to reflect the increased risk arising from the inability to readily sell the shares in a liquid market.
The OPM is generally preferred when future outcomes are difficult to predict and dissolution or liquidation is not imminent. Starting in July 2013, due to greater clarity on potential exit scenarios, we began using a hybrid of the Probability Weighted Expected Return Method, or PWERM, and OPM, to allocate our equity value among the various outcomes, where two main scenarios were considered:
| • | An initial public offering, or IPO, of our common stock in the near term, where the common stock value was determined based on expected implied enterprise values at the time of the IPO; or |
| • | A sale or merger scenario, which captured the value of the common stock if a near-term IPO is not completed and the company remains privately-held until it actively pursues a sale or merger, based on the income approach and the market approach. |
In the IPO scenario, a range of enterprise and equity values is estimated based on public company comparable Adjusted EBITDA and net income multiples which were applied to Adjusted EBITDA and net income estimates by, and expectations of, our board of directors and management. For each equity value scenario, we determined the appropriate aggregate value to be allocated to holders of our shares of common stock based on the rights and preferences of each class and series of our stock at that time. Next, we estimated the timing of possible IPO dates and applied a discount rate, based on our estimated cost of capital, to the implied future equity values to account for the time-value of money. We then multiplied the discounted value of common stock under each scenario by an estimated probability for each of the possible events, resulting in a probability-weighted value per share of common stock. Finally, we applied a discount for lack of marketability to the weighted value per share to determine a value per common share. As noted, application of this approach involves the use of estimates, judgment and assumptions, such as future cash flows and selection of comparable companies. Changes in our assumptions or the interrelationship of those assumptions impacted the valuations as of each valuation date.
80
Table of Contents
The sale or merger scenario was performed in a manner similar to how our valuations had been done prior to July 2013, where our enterprise value was determined based on the income and market approaches, and the equity value was allocated among the securities comprising our capital structure using the OPM.
Upon introduction of the IPO scenario, we assigned an increasing probability to the initial public offering scenario at each valuation date compared to the other scenarios, assuming a 80% probability beginning July 2013. We have assumed a higher probability of an initial public offering because of our belief that consummating an initial public offering will increase awareness of our company among potential clients and improve our competitive position, thereby facilitating growth.
When considering comparable public companies for the purposes of valuing our common stock, we utilized comparable company sets primarily composed of public companies in the HR-related service industry. We believed that these companies had service offerings, cost structures and compliance environments generally similar to our own and we therefore believed that these companies were comparable to us for the purposes of valuing our common stock. All the material factors considered as of each option grant date are explained below.
The following table summarizes, by grant date, information regarding stock options granted from January 1, 2012 through September 30, 2013:
| Option Grant Date |
Number of Shares Underlying Options |
Exercise Price Per Share |
Common Stock Fair Value Per Share |
|||||||||
| February 9, 2012 |
370,000 | $ | 7.25 | $ | 7.25 | |||||||
| March 6, 2012 |
675,000 | $ | 7.25 | $ | 7.25 | |||||||
| July 30, 2012 |
243,780 | $ | 6.37 | $ | 6.37 | |||||||
| November 14, 2012 |
182,000 | $ | 6.37 | $ | 6.37 | |||||||
| February 5, 2013 |
110,000 | $ | 8.62 | $ | 8.62 | |||||||
| March 13, 2013 |
1,283,200 | $ | 16.40 | $ | 16.40 | |||||||
| May 8, 2013 |
100,000 | $ | 16.40 | $ | 16.40 | |||||||
| June 5, 2013 |
18,000 | $ | 16.40 | $ | 16.40 | |||||||
| July 10, 2013 |
228,000 | $ | 26.42 | $ | 26.42 | |||||||
| August 13, 2013 |
52,500 | $ | 26.42 | $ | 26.42 | |||||||
The aggregate intrinsic value of vested and nonvested stock options as of September 30, 2013, based on a price of $ per share, the midpoint of the price range set forth on the cover of this prospectus, was $ million and $ million, respectively.
The following discussion relates primarily to our determination of the fair value per share of our common stock for purposes of calculating share-based compensation costs since January 2012. No single event caused the valuation of our common stock to increase or decrease. Instead, a combination of the factors described below in each period led to the changes in the fair value of our common stock. Notwithstanding the fair value reassessments described below, we believe we applied a reasonable valuation method to determine the stock option exercise prices on the respective stock option grant dates.
February 2012
Based on our assessment of future growth potential and our financial forecasts for each of the four years ended December 31, 2015, an independent contemporaneous valuation analysis was performed in December 2011. The results of the valuation indicated the fair value of our common stock to be $7.25 per share as of December 1, 2011. The primary valuation considerations were:
| • | an enterprise value determined from a weighted average of the market-based approach (50% weighting) and income approach (50% weighting); |
| • | the market-based approach utilized a mean peer group multiple of 10.0x trailing 12 months Adjusted EBITDA and 9.5x 2011 estimated Adjusted EBITDA; |
| • | the income approach utilized a terminal value based on the Gordon Growth model, using a capitalization rate of 17% based on a discount rate of 22% and a long term growth rate of 5%; |
81
Table of Contents
| • | a discount rate of 22%, based on our estimated weighted average cost of capital; and |
| • | a lack of marketability discount of 41% was applied to reflect the fact that private company common stock is not directly comparable to the value of publicly traded shares due to the fact that stockholders of private company common stock do not have access to the same type of trading markets that stockholders of publicly traded companies possess. |
Our indicated enterprise value was allocated to the shares of preferred stock, common stock and options using an OPM. The OPM utilized the following assumptions: a time to liquidity event of 3.45 years; a risk free rate of 0.54%; and volatility of 60% over the time to a liquidity event. Estimates of the volatility of our common stock were based on available information on the volatility of common stock of comparable, publicly traded companies.
Based on the factors noted above and the most recent available contemporaneous valuation, our board of directors determined that the fair value of our common stock was $7.25 per share and granted option awards with an exercise price of $7.25 per share on February 9, 2012. For financial reporting purposes, we determined the fair value of our common stock for option awards granted in February 2012 to be at $7.25 per share.
March 2012
Given that the option grants made on March 6, 2012 occurred approximately 30 days after the option grants made on February 9, 2012 and that there were no significant changes to the business or our prospects during this period, we used the same analysis in assessing the fair value of our common stock as of March 6, 2012 that we did for our assessment as of February 9, 2012.
July 2012
Subsequent to obtaining a $140.0 million credit facility in connection with a special dividend payment of $3.13 per share in March 2012 and our acquisition of Accord in April 2012, an independent contemporaneous valuation analysis was performed with our updated forecast and capital structure. The results of the valuation indicated the fair value of our common stock to be $6.37 per share as of May 17, 2012. The valuation was completed in June 2012 and the primary valuation considerations were:
| • | an enterprise value determined from a weighted average of the market-based approach (50% weighting) and income approach (50% weighting); |
| • | the market-based approach utilized a mean peer group multiple of 8.5x trailing 12 months Adjusted EBITDA and 7.0x 2012 estimated Adjusted EBITDA; |
| • | the income approach utilized a terminal value based on the Gordon Growth model, using a capitalization rate of 15.0% based on a discount rate of 20% and a long-term growth rate of 5%; |
| • | a discount rate of 20%, based on our estimated weighted average cost of capital; and |
| • | a lack marketability discount of 38.8% was applied to reflect the fact that private company common stock is not directly comparable to the value of publicly traded shares due to the fact that stockholders of private company common stock do not have access to the same type of trading markets that stockholders of publicly traded companies possess. |
Our indicated enterprise value was allocated to the shares of preferred stock, common stock and options using an OPM. The OPM utilized the following assumptions: a time to liquidity event of three years; a risk free rate of 0.40%; and volatility of 60% over the time to a liquidity event. Estimates of the volatility of our common stock were based on available information on the volatility of common stock of comparable, publicly traded companies.
The decrease from $7.25 per share as of December 2011 was primarily attributed to the payment of the dividend in March 2012 and offset by changes in valuation assumptions related to changes in our forecasts and comparable public-company multiples, discount for lack of marketability due to the passage of time to an exit event.
Based on the factors noted above and the most recent contemporaneous valuation available, our board of directors determined that the fair value of our common stock was $6.37 per share and, we granted option awards
82
Table of Contents
with an exercise price of $6.37 per share on July 30, 2012. For financial reporting purposes, we determined the fair value of our common stock for option awards granted in July 2012 to be at $6.37 per share.
November 2012
At the time our board of directors approved the option grants on November 14, 2012, our most recent available valuation analysis, which had an effective date of May 17, 2012, indicated a fair value of $6.37 per share. Given there were no significant changes to the business or our prospects since May 2012, we granted option awards on November 14, 2012 with an exercise price of $6.37 per share. For financial reporting purposes, we determined the fair value of our common stock for option awards granted in November 2012 to be $6.37 per share.
February 2013
In October 2012, based on our assessment of future growth potential, we revised our financial forecasts for each of the four years ended December 31, 2015, and an independent contemporaneous valuation analysis was performed by using our updated forecast. The results of the valuation indicated the fair value of our common stock to be $8.62 per share as of October 15, 2012. The valuation was completed in November 2012 and the primary valuation considerations were:
| • | an enterprise value determined from a weighted average of the market-based approach (50% weighting) and income approach (50% weighting); |
| • | the market-based approach utilized a mean peer group multiple of 8.5x trailing 12 months Adjusted EBITDA and 7.0x 2013 estimated Adjusted EBITDA; |
| • | the income approach utilized a terminal value based on the Gordon Growth model, using a capitalization rate of 14% based on a discount rate of 19% and a long-term growth rate of 5%; |
| • | a discount rate of 19%, based on our estimated weighted average cost of capital; and |
| • | a lack marketability discount of 31% was applied to reflect the fact that private company common stock is not directly comparable to the value of publicly traded shares due to the fact that stockholders of private company common stock do not have access to the same type of trading markets that stockholders of publicly traded companies possess. |
Our indicated enterprise value was allocated to the shares of preferred stock, common stock and options using an OPM. The OPM utilized the following assumptions: a time to liquidity event of approximately 2.6 years; a risk free rate of 0.31%; and volatility of 49% over the time to a liquidity event. Estimates of the volatility of our common stock were based on available information on the volatility of common stock of comparable, publicly traded companies.
The increase from $6.37 per share to $8.62 was primarily attributed to the changes in valuation assumptions related to changes in our forecasts, comparable public-company multiples, discount for lack of marketability due to the passage of time to an exit event.
At the time our board of directors approved the option grants on February 5, 2013, our most recent available valuation analysis indicated a fair value of $8.62 per share. We granted option awards with an exercise price of $8.62 per share on February 5, 2013. For financial reporting purposes, we determined the fair value of our common stock for option awards granted in February 2013 to be $8.62 per share.
March 2013
In January 2013, based on our assessment of future growth potential, we revised our financial forecasts for each of the four years ended December 31, 2015, and an independent contemporaneous valuation analysis was performed by using our updated forecast. The results of the valuation indicated the fair value of our common
83
Table of Contents
stock to be $16.40 per share as of February 8, 2013. The valuation was completed in March 2013 and the primary valuation considerations were:
| • | an enterprise value determined from a weighted average of the market-based approach (50% weighting) and income approach (50% weighting); |
| • | the market-based approach utilized a mean peer group multiple of 9.5x trailing 12 months Adjusted EBITDA and 6.5x 2013 estimated Adjusted EBITDA; |
| • | the income approach utilized a terminal value based on the Gordon Growth model, using a capitalization rate of 14% based on a discount rate of 19% and a long-term growth rate of 5%; |
| • | a discount rate of 19%, based on our estimated weighted average cost of capital; and |
| • | a lack of marketability discount of 15% was applied to reflect the fact that private company common stock is not directly comparable to publicly traded shares due to the fact that stockholders of private companies do not have access to the same type of trading markets as stockholders of publicly traded companies. |
Our indicated enterprise value was allocated to the shares of preferred stock, common stock and options using an OPM. The OPM utilized the following assumptions: a time to liquidity event of one year; a risk free rate of 0.14%; and volatility of 33% over the time to a liquidity event. Estimates of the volatility of our common stock were based on available information on the volatility of common stock of comparable, publicly traded companies.
The increase from $8.62 per share to $16.40 was primarily attributed to the changes in valuation assumptions related to estimated timing of an exit event, our forecasts, comparable public-company multiples and discount for lack of marketability.
Based on the factors noted above and the most recent contemporaneous valuation available, our board of directors determined that the fair value of our common stock was $16.40 per share and, we granted option awards with an exercise price of $16.40 per share on March 13, 2013. For financial reporting purposes, we determined the fair value of our common stock for option awards granted in March 2013 to be at $16.40 per share.
May and June 2013
In estimating the fair value of our common stock to set the exercise price of such options, our board of directors considered the most recent contemporaneous valuation available for our common stock as of February 8, 2013 and there were no significant changes to the business or our prospects. We granted option awards on May 8, 2013 and June 5, 2013 with an exercise price of $16.40.
July and August 2013
Starting in July 2013, due to greater clarity on potential exit scenarios, we began using a hybrid of the PWERM and OPM, to allocate our equity value among the various outcomes.
In July 2013, based on our assessment of future growth potential, we revised our financial forecasts for each of the four years ended December 31, 2015, and an independent contemporaneous valuation analysis was performed by using our updated forecast. The results of the valuation indicated the fair value of our common stock to be $26.42 per share as of July 1, 2013. The valuation was completed in August 2013 and the primary valuation considerations were:
For the sales and merger scenario:
| • | an enterprise value was determined from a weighted average of the market-based approach (50% weighting) and income approach (50% weighting); |
| • | the market-based approach utilized a mean peer group multiple of 9.5x trailing 12 months Adjusted EBITDA, 9x 2013 estimated Adjusted EBITDA and 8x 2014 estimated Adjusted EBITDA, and a mean peer group multiple of 16.0x trailing 12 months Adjusted Net Income, 16.0x 2013 estimated Adjusted Net Income and a 13.5x 2014 estimated Adjusted Net Income; |
84
Table of Contents
| • | the income approach utilized a terminal value based on the Gordon Growth model, using a capitalization rate of 14% based on a discount rate of 19% and a long-term growth rate of 5%; and |
| • | we used a discount rate of 19%, based on our estimated weighted average cost of capital. |
Our indicated enterprise value was allocated to shares of preferred stock, common stock and options using an OPM. The OPM utilized the following assumptions: a time to liquidity event of one year; a risk free rate of 0.12%; and volatility of 44% over the time to a liquidity event. Estimates of the volatility of our common stock were based on available information on the volatility of common stock of comparable, publicly traded companies.
For the IPO scenario:
| • | the PWERM utilized a mean peer group multiple of 9.5x trailing 12 months Adjusted EBITDA, 9.0x 2014 estimated Adjusted EBITDA and 8.0x 2015 estimated Adjusted EBITDA, and a mean peer group multiple of 16.0x trailing 12 months Adjusted Net Income, 16.0x 2014 estimated Adjusted Net Income and 13.5x 2015 estimated Adjusted Net Income; and |
| • | we used a discount rate of 22.5%, based on our estimated cost of equity. |
Lack of marketability discounts of 15% and 17% were applied to IPO and sales or merger scenarios, respectively, to reflect the fact that private company common stock is not directly comparable to the value of publicly traded shares due to the fact that stockholders of private company common stock do not have access to the same type of trading markets that stockholders of publicly traded companies possess.
The increase from $16.40 per share to $26.42 was primarily attributed to the changes in valuation assumptions related to estimated timing of an exit event, our forecasts, comparable public-company multiples and discount for lack of marketability.
At the time our board of directors approved the option grants on July 10, 2013, our most recent available valuation analysis indicated a fair value of $16.40 per share. Our board of directors set the exercise price per share at $16.40, consistent with the indicated fair value reflected in the valuation analysis. However, as discussed above, a valuation analysis as of July 1 that was finalized in August, which analysis reflected a fair value of our common stock of $26.42. Although our board of directors believed the assumptions in the prior valuation report to be reasonable as of the date of grant, we increased the exercise prices of such options to $26.42 on the basis of the recent analysis.
Based on the factors noted above and the most recent contemporaneous valuation available, our board of directors determined that the fair value of our common stock was $26.42 per share and, we granted option awards with an exercise price of $26.42 per share on August 13, 2013. For financial reporting purposes, we determined the fair value of our common stock for option awards granted in July and August 2013 to be at $26.42 per share.
Income Taxes
We are subject to income taxes in the United States and Canada and we conduct our business primarily in the United States. Significant judgments are required in determining our provision for income taxes and income tax assets and liabilities, including evaluating uncertainties in the application of accounting principles and complex tax laws.
We use the asset and liability method to account for income taxes. Deferred tax assets and liabilities are recognized for the future tax consequences attributable to differences between the financial statement carrying amounts of existing assets and liabilities and their respective tax bases and net operating loss carryforwards. Deferred tax assets and liabilities are measured using enacted tax rates expected to apply to taxable income in the years in which those temporary differences are expected to be recovered or settled. The effect on deferred tax assets and liabilities of a change in tax rates is recognized in income in the period that includes the enactment date.
For transactions and calculations for which the ultimate tax determination is uncertain, we recognize tax liabilities based on estimates of whether additional taxes and interest will be due. These tax liabilities are recognized when, despite the belief that our tax return positions are supportable, we believe that certain positions
85
Table of Contents
may not be more likely than not of being sustained upon review by tax authorities. As of December 31, 2012 and September 30, 2013, we had recognized tax liabilities of approximately $3.3 million and $3.0 million, respectively, related to uncertain income tax positions.
We periodically evaluate if it is more likely than not that some or all of the deferred tax assets will be realized. In making such determination, we consider all available positive and negative evidence, including scheduled reversals of deferred tax liabilities, projected future taxable income, tax planning strategies and recent financial performance. In order to support a conclusion that a valuation allowance is not needed, positive evidence of sufficient quantity and quality (objective compared to subjective) is necessary to overcome negative evidence. Because certain federal and state net operating loss carryforwards may not be utilized prior to expiration, a valuation allowance on our deferred tax asset balance was recognized as of December 31, 2012.
We believe that our accruals for tax liabilities are adequate for all open audit years based on our assessment of many factors, including past experience and interpretations of tax law. This assessment relies on estimates and assumptions and may involve a series of complex judgments about future events. We do not anticipate any adjustments would result in a material change to our financial position. To the extent that the final tax outcome of these matters is different than the amounts recorded, such differences will impact income tax expense in the period in which such determination is made.
In March 2011, we executed a settlement agreement with the IRS Office of Appeals providing for our payment of $3.2 million, effectively closing the IRS’ examination of Gevity’s consolidated U.S. income tax returns for 2002 through 2004, with the exception of a continuing refund claim for employment tax credits of $3.2 million. IRS examinations with respect to Gevity’s tax years 2005 through June 1, 2009 were concluded during 2012. However, revenue agent reports issued in connection with notices of proposed assessments disallowing employment tax credits totaling $10.5 million are subject to further consideration by the IRS Office of Appeals. Additionally, we, together with the IRS Office of Appeals and the IRS examination team, formally requested a technical advice memorandum, or TAM, from the IRS to determine our ability to realize FICA tip tax credits on its federal corporate income tax returns as a statutory employer. The TAM, issued on August 29, 2013 by the IRS’s National Office, reached an unfavorable conclusion for us. We are requesting reconsideration from the IRS’s National Office because we believe some facts were misstated or misinterpreted in the TAM and the TAM failed to completely respond to the ultimate request. However, we believe the reconsideration will be denied based on discussions with the IRS Office of Appeals. Should that be the case, we have requested alternative actions, including a request for revocation or prospective application based on statutory authority. With regard to the FICA tip tax matter, we believe it is more likely than not that we will prevail. Therefore, we have not recognized a reserve for this matter.
Quantitative and Qualitative Disclosures About Market Risk
As a result of our credit facilities, we are exposed to changes in interest rates. To mitigate this risk, we entered into an interest rate cap arrangement with a bank in May 2012, which we refer to as the May 2012 cap, to protect the interest payment cash flows through March 30, 2015 on our initial credit facility from adverse market interest changes due to fluctuations in the 3-month LIBOR benchmark interest rate with an initial notional amount of $51.8 million and final notional amount of $42.0 million at a strike price of 2%. Upon the amendment and restatement of our initial credit facility, the May 2012 cap was re-designated to hedge a portion of the amended and restated credit facility and subsequently our credit facility. In December 2012, we entered into an interest rate cap arrangement with another bank, which we refer to as the December 2012 cap, to hedge the interest payment cash flows of 50% of the incremental total loan balance through October 24, 2015. The December 2012 cap has an initial notional amount of $99.5 million and final notional amount of $137.6 million at a strike price of 2%. At inception, the interest rate caps were determined to be perfectly effective and were designated as a cash flow hedge for accounting purposes. With the new credit facilities entered into in August 2013, the timing of payments and interest rate basis have changed and no longer match the terms of the interest rate caps. As a result, the interest rate caps are no longer considered perfectly effective. With an increase in interest rates of 100 basis points at September 30, 2013, our interest expense for the remainder of 2013 would be
86
Table of Contents
$13.9 million and from 2014 through 2021 would be $334.6 million. On the other hand, with a decrease in interest rates of 100 basis points at September 30, 2013, our interest expense for the remainder of 2013 would be $9.8 million and from 2014 through 2021 would be $238.7 million.
We had cash and cash equivalents, restricted cash, restricted investments and payroll funds collected, interest bearing receivable in connection with workers compensation premiums totaling $447.0 million at September 30, 2013. Included in this amount was $39.4 million in time deposits and U.S. Treasuries. Our investments are made for capital preservation purposes. The cash and cash equivalents, restricted cash, payroll funds collected and workers compensation premium receivable are held for working capital purposes.
Our cash equivalents, payroll funds collected, workers compensation receivable and our investments are subject to market risk due to changes in interest rates. Fixed rate securities may have their market value adversely impacted due to a rise in interest rates, while floating rate securities may produce less income than expected if interest rates fall. Due in part to these factors, our future investment income may fall short of expectation due to changes in interest rates or we may suffer losses in principal if we are forced to sell securities that decline in market value due to changes in interest rates. However, because we classify our debt securities as “available for sale,” no gains or losses are recognized due to changes in interest rates unless such securities are sold prior to maturity or declines in fair value are determined to be other-than-temporary. Our fixed-income portfolio is subject to interest rate risk.
An immediate increase or decrease in interest rates of 100-basis points at September 30, 2013 would not result in a material market value reduction or increase. This estimate is based on a sensitivity model that measures market value changes when changes in interest rates occur. Fluctuations in the value of our investment securities caused by a change in interest rates (gains or losses on the carrying value) are recorded in other comprehensive income, and are realized only if we sell the underlying securities.
87
Table of Contents
Company Overview
TriNet is a leading provider of a comprehensive human resources solution for small to medium-sized businesses, or SMBs. We enhance business productivity by enabling our clients to outsource their HR function to one strategic partner and allowing them to focus on operating and growing their core businesses. Our HR solution includes services such as payroll processing, human capital consulting, employment law compliance and employee benefits, including health insurance, retirement plans and workers compensation insurance. Our services are delivered by our expert team of HR professionals and enabled by our proprietary, cloud-based technology platform, which allows our clients and their employees to efficiently conduct their HR transactions anytime and anywhere. As of September 30, 2013, we served over 8,000 clients in 47 states, the District of Columbia and Canada and co-employed approximately 218,000 of our clients’ employees, which we refer to as worksite employees, or WSEs. In 2012, we processed over $10 billion in payroll and insurance premiums for our clients.
HR is a mission-critical function for businesses. Businesses of all sizes face increasing levels of complexity in managing HR processes, including regulatory pressures and escalating healthcare costs. These challenges are especially acute for SMBs, which typically lack the scale and capability to solve many of these issues on their own. In 2011, there were approximately 5.7 million SMBs that employed approximately 55 million people in the United States, or 49% of all U.S. employees, and represented over 99% of all U.S. employers in 2011. We estimate that in 2013 SMBs will spend approximately $90 billion on in-house HR resources, payroll processing and other HR services. We believe that this in-house approach is more challenging for SMBs to manage, and is less effective and more costly as compared to our comprehensive, outsourced solution. Therefore, we believe that this presents a significant opportunity for us to continue to penetrate and expand our presence in the SMB market.
We offer our clients a bundled solution that enables them to outsource their HR function to a single provider. We believe that the combination of our HR professionals, full suite of services, vertical market orientation, broad geographic reach and powerful technology platform enables us to solve the HR challenges of our SMB clients. Our solution helps reduce the complexity, cost and risk of managing the HR function for our SMB clients while helping SMBs better retain their employees. In addition, our tailored approach allows us to serve a diverse range of industries with varying levels of HR requirements. For our clients’ employees, we provide access to high-caliber, big-company benefits, timely payroll processing and anytime and anywhere system access. We are also able to leverage our strong and diverse partner relationships to provide a broad and rich suite of services and benefits for our clients and their employees. We believe that this provides us with a highly referenceable customer base that allows us to further penetrate our target vertical markets.
Our proprietary, cloud-based technology platform and our team of HR professionals make HR transactions simple, seamless and efficient for employers and employees. Our platform is designed to function as the core system of record for all of our clients’ HR activities and allows our clients to enjoy 24/7, ubiquitous access. Our platform is also highly scalable, allowing us to efficiently add new clients and grow with our existing clients.
We sell our services primarily through our direct sales force, which we align around target vertical markets, including technology, life sciences, property management, professional services, banking and financial services, retail, manufacturing and hospitality services. The HR needs of our clients vary depending on the industry in which they operate. For example, wage and hour compliance and workers compensation are a large part of our solution for clients in the food service industry, whereas retirement plans and specialized employee perquisites are of greater significance for certain clients in the financial services industry. We believe that our vertical market expertise and tailored service offerings are highly differentiated in the market and allow us to compete effectively. We acquire this expertise organically, by hiring individuals who are experienced in the markets that we target for our services. For example, we hire experienced sales persons and human capital consultants within the technology industry in order to build service teams that will understand the needs of our technology clients. Attracting employees with these skills in turn increases the expertise and sophistication of our employees as they serve clients within a vertical industry. We also acquire vertical market expertise through our acquisitions. For example, we acquired significant expertise in blue- and gray-collar vertical markets like property management
88
Table of Contents
and food services with our acquisition of SOI Holdings, Inc., and in the high-end financial services industry with our acquisition of Ambrose Employer Group, LLC. This industry-specific expertise allows us to better understand the needs of our clients and package the services we provide accordingly.
Our total revenues consist of professional service revenues and insurance service revenues. For 2012 and the nine months ended September 30, 2013, 15% and 17% of our total revenues, respectively, consisted of professional service revenues, and 85% and 83% of our total revenues, respectively, consisted of insurance service revenues. We earn professional service revenues by processing HR transactions, such as payroll and employment tax withholding, and providing labor and benefit law compliance services, on behalf of our clients. We earn insurance service revenues by providing risk-based, third-party plans to our clients, primarily employee health benefit plans and workers compensation insurance.
For professional service revenues, we recognize as revenues the fees we earn for processing HR transactions, which fees do not include the payroll that is paid to us by the client and paid out to WSEs or remitted as taxes. We recognize as insurance service revenues all insurance-related billings and administrative fees collected from clients and withheld from WSEs for risk-based insurance plans provided through third-party insurance carriers, primarily employee health insurance and workers compensation insurance. We in turn pay premiums to third-party insurance carriers for these insurance benefits, as well as reimburse them for claim payments within our insurance deductible layer. These premiums and reimbursements are classified as insurance costs on our statements of operations. To augment our financial information prepared in accordance with GAAP, we use internally a non-GAAP financial measure, Net Insurance Service Revenues, which consists of insurance service revenues less insurance costs. We also use a measure of total non-GAAP revenue, or Net Service Revenues, which is the sum of professional service revenues and Net Insurance Service Revenues. For 2012 and the nine months ended September 30, 2013, 55% and 66% of our Net Service Revenues, respectively, consisted of professional service revenues and 45% and 34% of our Net Service Revenues, respectively, consisted of Net Insurance Service Revenues.
We have grown our business organically and through strategic acquisitions. For 2010, 2011 and 2012, our total revenues were $906.2 million, $840.4 million and $1.0 billion, respectively, Net Service Revenues were $192.5 million, $189.3 million and $269.0 million, respectively, and our net income (loss) was $(9.6 million), $15.5 million and $31.8 million, respectively. For the nine months ended September 30, 2012 and 2013, our total revenues were $696.9 million and $1.2 billion, respectively, our Net Service Revenues were $178.5 million and $296.0 million, respectively, and our net income was $23.0 million and $7.1 million, respectively. For 2010, 2011 and 2012, our Adjusted EBITDA was $29.8 million, $47.3 million and $95.4 million, respectively. For the nine months ended September 30, 2012 and 2013, our Adjusted EBITDA was $61.5 million and $92.3 million, respectively.
Our Market Opportunity
We serve the HR needs of SMBs in the United States. The growing complexity of managing HR processes today presents a significant challenge for SMBs. Traditionally, SMBs have managed HR processes in-house through a range of separately delivered services rather than seeking a holistic and comprehensive solution, which we believe has further aggravated many of these challenges. We believe that a bundled HR solution better addresses these needs and allows SMBs to focus in-house resources on business operations instead of managing HR activities. As a result, we believe that this represents a significant opportunity for TriNet’s solution.
Large and Underpenetrated Market. SMBs employ a large percentage of the total employee base in the United States today. According to the U.S. Census Bureau, in 2011, approximately 55 million employees were employed by organizations with fewer than 500 employees, representing approximately 49% of U.S. employees. These SMBs comprised approximately 5.7 million business organizations, representing over 99% of U.S. employers in 2011.
Though smaller, these companies have HR needs similar to their larger counterparts, including payroll, employee benefits and many other HR services for employees, and spend significant amounts on managing these processes. We estimate that in 2013 SMBs will spend approximately $90 billion in providing HR services, and that most of this spending will be on in-house resources.
89
Table of Contents
SMB Employee Base and Human Resources Spending
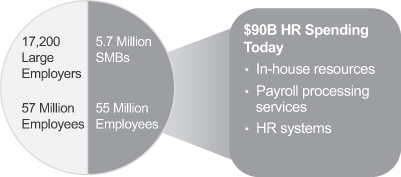
Based on data published by the National Association of Professional Employer Organizations, we estimate that in 2012 fewer than 5% of U.S. employees of businesses with fewer than 500 employees were part of a co-employment arrangement, in which all or some portion of the HR function was outsourced to a single third-party provider such as TriNet. We believe that our growth opportunity is primarily a function of our ability to increase our penetration of the SMB market.
We believe that we can grow our business in periods of both expanding and contracting macroeconomic conditions. During periods of economic stability and growth, employer payrolls grow and unemployment falls. As clients add employees and grow along with the broader economy, the demand for HR-related services grows as well. In the SMB segment in particular, a rebounding economy also positively impacts new business creation, which helps expand the addressable market for our solution. During periods of declining economic conditions, we believe that our bundled services are attractive to SMBs looking to control costs and drive efficiencies.
HR Management Increasing in Complexity. The HR function is becoming increasingly complex. The scope of responsibilities and demands on HR departments continues to expand beyond the management of payroll and benefits as firms compete to attract, retain and motivate employees. In addition, external pressures continue to mount as firms must deal with the increased complexity of the laws and regulations that govern the provision and administration of HR services, including effectively managing multiple and disparate state and federal laws and regulations. As a recent example, the Patient Protection and Affordable Care Act, enacted in March 2010, imposes a staggered schedule of sweeping health care reforms, which began in 2010 and will continue through 2018, and which will put increased burdens on many employers.
90
Table of Contents
The Growing Burden of Employment Law and Regulation
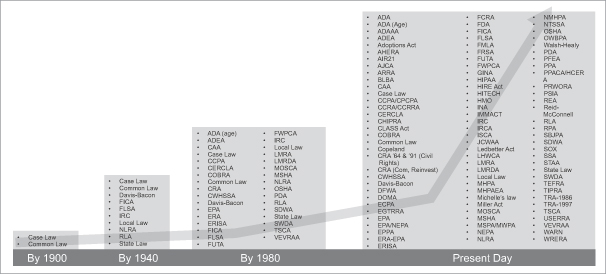
Source National Association of Professional Employer Organizations
Additionally, organizations both large and small recognize the strategic importance of the HR function. Traditionally, HR processes were viewed as manual, back-office processes, such as payroll and benefits, that had little impact on business performance. Today, however, we believe that management teams are increasingly reliant on HR organizations to help them gain competitive advantages in the marketplace. They recognize that taking a strategic approach to HR allows them to acquire best-in-class talent, align workforce goals with company objectives, drive performance and productivity, and develop and mentor future leaders. These organizations also harness the benefits of technology platforms to drive efficiency and effectiveness by automating and improving processes that were once manually driven.
Challenges Are Especially Acute for SMBs. SMBs typically confront an array of challenges as they seek to address increasingly complex HR requirements. These organizations frequently lack the dedicated and specialized personnel and systems that are necessary to provide complex HR solutions. According to The Bureau of National Affairs, Inc., in 2013, 39% of the smallest (fewer than 250 workers) organizations surveyed do not have an HR specialist on staff. Conversely, 90% of the largest (more than 2,500 workers) organizations surveyed have at least one employee devoted to just one or two areas of HR.
A large portion of HR-related spending by SMBs has traditionally been on a range of disparate products and services, where companies utilize a combination of third-party service and technology providers and in-house resources to administer the HR function. This approach has often resulted in SMBs using different providers for payroll processing and the provision of employee benefits, such as health insurance, retirement plans and workers compensation insurance. We believe that this approach of utilizing a combination of various third-party providers further complicates the delivery of HR services, dilutes the benefit that HR processes can have on an organization, and is typically more costly than a bundled solution. Additionally, SMBs typically cannot afford to invest in a comprehensive technology platform to manage their HR processes and often lack the scale required to negotiate favorable employee health benefit and workers compensation plan terms with insurance companies and other large employee benefits providers. As a result, we believe that SMBs will increasingly look to a bundled solution to help solve these issues.
Our Solution
We offer our clients a bundled solution that enables them to outsource their HR function to a single, trusted provider so they can focus on operating and growing their core businesses. Our bundled solution, which includes
91
Table of Contents
services such as payroll processing, human capital consulting, employment law compliance, employee benefits, workers compensation insurance and strategic human capital services, holistically addresses the HR needs of both our clients and their employees. For each of our clients, we offer timely payroll processing and access to a team of HR professionals with specific knowledge of its industry to help reduce the complexity, cost and risk of managing the HR function, while helping them better retain their workforce. For employees, we provide access to high-caliber, big-company benefits and other services such as expert HR guidance and anytime, anywhere access to comprehensive HR information and services. We leverage our strong and diverse partner relationships to provide a broad and rich suite of services for our clients and their employees.
Our vertical market expertise allows us to tailor our services for our target industries, which helps to further embed us within our clients and helps us to deliver meaningful business impact. Our solution is delivered by a team of HR professionals with expertise in our clients’ industries, enabled by our proprietary, cloud-based technology platform, which simplifies the day-to-day HR transactions of our clients and their employees. Our platform provides SMBs with the knowledge and features of large-business support and technology, as well as anywhere and any-device access to their HR systems. Our technology platform is also highly scalable, allowing our clients to efficiently add new employees and us to grow with our existing clients. Its seamless integration with partner systems allows single-sign-on functionality that enhances the employee and employer experience.
92
Table of Contents
We serve a number of large vertical markets. Businesses in these vertical markets have HR requirements that vary across two primary dimensions, as depicted in the diagram below: (1) the complexity of HR needs and (2) the importance of employee benefits and a high touch service experience. We believe that our ability to address our target vertical markets across these dimensions is a clear competitive differentiator.
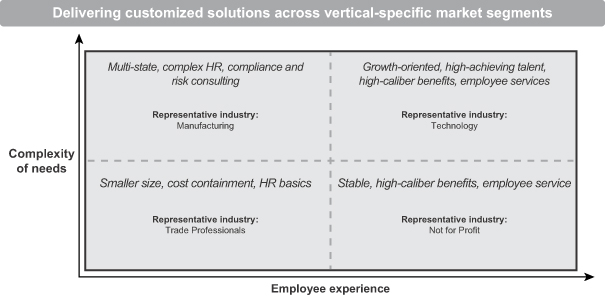
Our Competitive Advantages
We believe that we have the following key competitive advantages:
Comprehensive Suite of HR Capabilities. We are the strategic HR partner to our clients. Our innovative bundled solution, developed over our 25-year operating history, allows our clients to outsource their HR function to a single provider in an effective and cost-efficient manner. As the provider of a bundled solution, we deliver our services in a coordinated and comprehensive manner, which provides significant value to our clients by reducing the complexity of managing the HR function. The services that we provide are delivered through a combination of HR professionals and our proprietary, cloud-based technology platform. Each TriNet client is guided by a team of HR professionals with expertise in both complex and day-to-day HR questions and challenges, ensuring a high level of customer service and attention throughout the client’s organization. In addition to our core HR services such as payroll processing and consulting, we also offer our clients and their employees access to a broad range of big-company employee benefits plans, including workers compensation and employee practices liability insurance, and our risk management programs, practices and analytics allow us to significantly mitigate employer risk, such as compliance, legal and related risks. These risk management programs, practices and analytics are more fully described in the section entitled “—Benefit Programs and Risk Management.”
Deep Vertical Market Expertise. We focus on serving clients in specific industry vertical markets. We have developed deep expertise around the HR functions within our target industries, which enables us to provide our clients with a solution tailored to the industries in which they operate. Our direct sales force and go-to-market strategy is aligned with these vertical markets, which enhances our client value proposition and allows us to leverage our strong institutional knowledge to further expand our presence within these target industries. We believe that this verticalized approach allows us to target clients across a range of industries in which SMBs have varying levels of need for services based on the complexity of their HR environment and required employee experience.
Proprietary, Cloud-Based Technology Platform. Our proprietary, cloud-based technology platform enables our clients and their employees to conduct their HR transactions anytime and anywhere. Our platform
93
Table of Contents
offers online self-service tools for managing employee payroll, creating compensation reports, managing employee hiring and termination and managing health benefits. As a result of our long-standing partnerships and the significant investments that we have made in our platform, our technology and benefits services partners are able to integrate their systems with our platform, allowing employees to access a unified view of all of their pertinent HR information. In addition, our platform allows clients to leverage information about their workforce in real time to keep tactical HR demands under control. Our platform is also highly scalable, which allows our clients to efficiently add new employees.
Scale. We are able to leverage our national presence and large WSE base to provide a comprehensive and cost-effective solution to our clients. SMBs typically lack the scale required to negotiate favorable employee health benefit plan prices and other features with insurance companies and other large employee benefits providers. Leveraging the economies of scale arising from serving approximately 218,000 employees, we are able to make significant investments in our technology platform and are typically able to secure a broader range of benefits plans at rates and with features that are more competitive than those that an SMB would be able to procure on its own. In addition, our scale has allowed us to specialize our workforce by industry vertical markets and deliver more relevant services to our clients.
Strong Strategic Partnerships. We have developed strong relationships with our insurance and risk management partners, as well as other vendors and suppliers, which we believe enable us to provide a broader array of services to our clients and their employees more cost-effectively than if they attempted to purchase these offerings themselves. We have long-standing relationships with large health benefits insurers, such as Aetna, Blue Shield of California, Blue Cross and Blue Shield of Florida, Kaiser Permanente, MetLife and United Healthcare, as well as retirement plan providers, such as Transamerica Retirement Services and MassMutual. We believe that we are a valuable partner for our insurance and other service vendors, as we provide them with an attractive channel to the hard-to-reach SMB market through our large scale presence across the United States and Canada, and across a wide range of industry vertical markets.
Our Growth Strategies
Our goal is to become the leading HR solutions provider to SMBs. Our strategies to achieve that goal include the following:
| • | Continue to Penetrate the SMB Market Using Our Vertical Market Approach. Our focus on serving clients in specific industry vertical markets has given us deep, substantive knowledge of the HR needs facing SMBs in those industries. This enables us to provide a bundled solution of services to each client that is tailored to its specific needs and better enables us to attract sales professionals with industry expertise. We intend to continue this focus on industry vertical markets. We also regularly assess additional and new industry vertical markets and intend to add them, either through acquisition or internal development, selectively based on what we believe the market opportunity is. |
| • | Expand Our Direct Sales Force. We believe that the SMB market remains significantly underpenetrated for a bundled HR solution such as ours. We intend to continue to invest in our direct sales force to enable us to identify and acquire new clients across our target vertical markets, in addition to expanding our sales force to target new vertical markets. |
| • | Grow With Our Clients by Enhancing the Breadth and Quality of Our Services. We intend to continue to expand the breadth and quality of our HR solution. We believe that this will allow us to continue to enhance the value proposition for our clients and to grow with them by providing additional high-quality service offerings. |
| • | Continue to Enhance Our Technology Platform. We intend to continue to invest in and improve our proprietary, cloud-based technology platform, including mobile applications, in order to provide our clients with enhanced features and functionality with which to conduct their HR transactions, manage employees and analyze employee benefits data. This may include acquiring or developing additional functionality or technology. |
94
Table of Contents
| • | Continue to Grow Through Strategic Acquisitions. We have successfully completed numerous strategic acquisitions over the course of the past decade, which has allowed us to enhance and expand our presence in both existing and new target industries, as well as expand our solution and technology platform. We intend to continue to pursue strategic acquisitions that will enable us to leverage our existing assets and offer our clients more comprehensive and attractive services. |
We believe that if effectively pursued, these strategies represent opportunities for us to increase the demand for our services. We also face challenges to our growth strategy. We must be able to convince SMBs of the benefits of outsourcing their HR function, effectively execute our strategies and minimize client attrition, in addition to addressing or responding to other issues identified above under “Risk Factors.”
Our Services
We provide a comprehensive suite of core HR services that allows our clients to outsource their HR function. We also provide a set of strategic services to support and enhance each stage of our clients’ growth. Our services are supported by our network of HR experts and integrated through a single-sign-on, proprietary, cloud-based SaaS platform, designed so that our clients have access to big-company benefits, excellent service and a scalable HR infrastructure. The following diagram depicts the services that we offer:
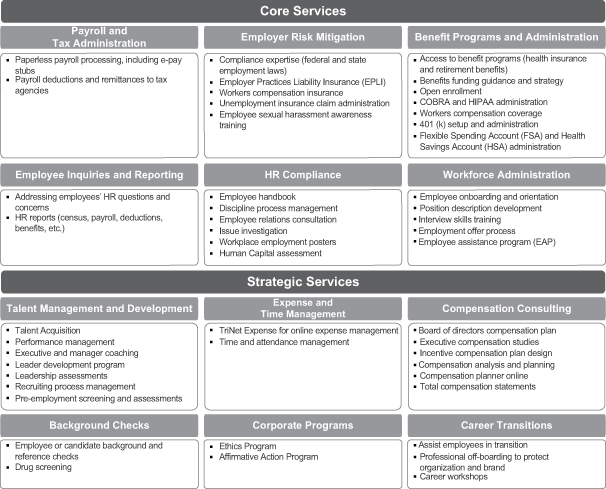
95
Table of Contents
Benefits Programs and Risk Management
We provide benefits to our WSEs and clients under arrangements with a variety of vendors that provide employee benefit plans, workers compensation insurance and employee practices liability insurance. These agreements typically have a term of one year and generally may be terminated by either us or the insurance carrier partner on 90 days’ notice.
Risk management is a core competency of our company. We leverage the insight that we have gained over our 25-year operating history as well as our robust risk management capabilities to mitigate the risks associated with providing workers compensation and employee benefit plans to our clients. Our programs are fully insured by top-rated insurance carriers, which limits our ultimate exposure or potential losses. We assess all workers compensation and medical benefits risks on an individual client basis and annually adjust pricing to reflect their current risk based on HIPAA-compliant analytics.
Employee Benefit Plans
We sponsor a number of fully-insured employee benefit plans, including group health, dental, vision and group and individual life insurance, legal services, commuter benefits, home insurance, critical illness insurance, pet insurance and auto insurance, as an employer plan sponsor under Section 3(5) of ERISA, 29 U.S.C. §1002(5). We estimate that approximately 40% of our 2013 health insurance premiums are for policies with respect to which our carriers set the premiums and we are not responsible for any deductible. The remainder of our health insurance premiums are for policies with respect to which we agree to reimburse our carriers for any claims that they pay within our deductible layer. Our agreements with our health insurance carriers with respect to these policies typically include limits to our exposure for individual claims, which we refer to as pooling limits, and limits to our maximum aggregate exposure for claims in a given policy year, which we refer to as stop losses. We manage the risk that we assume in connection with these policies by utilizing group risk assessments and HIPAA-compliant analytics and pricing these policies accordingly. Following our initial pricing of these policies, we analyze claims data for each client on an ongoing basis and seek to adjust our prices as appropriate.
We believe that our provision of group health insurance is one of the most important employee benefits we provide to our WSEs. We provide group health insurance coverage to our WSEs through a national network of carriers including Aetna, Blue Shield of California, Blue Cross and Blue Shield of Florida, Kaiser Permanente, MetLife and United Healthcare, all of which provide fully insured policies for our WSEs.
Workers Compensation Insurance
We provide fully-insured workers compensation insurance coverage to our WSEs through agreements that we negotiate with our third-party insurance providers Chartis, The Hartford, Lumberman’s Mutual and American Zurich Insurance Company. These agreements typically obligate us to reimburse our carriers up to $1 million per claim. We manage the risk that we assume in connection with these policies by: being selective in terms of the types of businesses that we take on as clients; performing workplace assessment, safety consultation, accident investigation and other risk management services at our client locations to help prevent claims and remediate them when they occur; and monitoring claims data and the performance of our carriers and third-party claims management services to improve our actuarial projections.
Employment Practices Liability Insurance
We provide employment practices liability insurance, or EPLI, through several insurance carriers, including Allied World Assurance Company, Lexington Insurance Company and Beazley. Most of these policies, as is customary for such insurance policies, provide for a per-claim deductible. For most of our clients, the deductible is split evenly between the client and TriNet, with the client paying its half of the deductible first. Our legal department manages all employee practices liabilities claims processing and defense, while the actual litigation defense is conducted by one of several employment law firms that we retain to assist with the cases.
96
Table of Contents
Our Technology Platform
We have a proprietary, cloud-based technology platform that allows clients and employees real-time access to a suite of secure online HR resources. Our platform is designed to function as the core system of record for all of our clients’ HR activities and allows our clients to enjoy 24/7, ubiquitous access. Through the use of our online self-service tools, managers can effectively manage employee hiring and termination, administer employee payroll, view real-time benefits data and create compensation reports. Single-sign-on system functionality allows employees to manage their own payroll information, enroll in benefits and view paystubs, W-2s and more. Employees can also view real-time workflow data, such as requests and approvals for personal time off. As a result of our long-standing partnerships and the significant investments that we have made in our platform, our technology and benefits services partners have integrated with our platform, allowing employees to access a unified view of all of their pertinent HR information.
We invest significant capital to create and offer state-of-the-art HR technology tailored to our vertical markets. Our proprietary, cloud-based platform enables us to provide our clients with the best and latest version of our software. We leverage our existing online platform to build additional products and features, including a full-service mobile platform.
We maintain a proprietary, cloud-based HR information system. Our clients receive the efficiencies of an enterprise-level platform without the significant cost of in-house installation or ongoing maintenance. Features include:
| • | multi-tenant system enabling multiple clients and WSEs to share one version of our system while isolating each client’s and WSE’s data; |
| • | rule-based provisioning ensuring that all users are authenticated, authorized and validated before they can access our platform; |
| • | redundant processing centers to protect client data from loss; and |
| • | integrated benefits and payroll processing for faster, more accurate data; and flexible and extensible platform architecture. |
From 2008 through 2012, we invested approximately $88.0 million in our technology platform. We plan to continue to invest to upgrade and improve our platform.
Sales and Marketing
We sell our solutions primarily through our direct sales organization, which consists of sales representatives, sales management and sales operations and support personnel. Our sales representatives focus on serving clients in specific vertical markets. The number of sales representatives has grown substantially in recent years, from 114 Total Sales Representatives as of December 31, 2010 to 301 Total Sales Representatives as of September 30, 2013. We recruit and hire sales professionals who have experience in a specific industry vertical market, and we also seek sales professionals with a background in selling business services such as accounting, HR or sales solutions. As of September 30, 2013, we have approximately 60 regional sales offices.
We also employ a broad range of awareness and demand-generation marketing programs, including billboards, digital and print advertising, e-mail, direct mail and social media. We have an internal public relations team that works with an external agency to promote relevant content to target media outlets. We sponsor and participate in associations and events around the country and utilize these forums to target specific vertical and geographic markets.
Clients
We serve thousands of clients in a variety of industries, including technology, life sciences, property management, professional services, banking and financial services, retail, manufacturing and hospitality services, as well as non-profit entities. We have grown our number of clients from approximately 5,600 as of December 31, 2010 to over 8,000 clients as of September 30, 2013. We have also grown our number of WSEs
97
Table of Contents
from approximately 97,000 in 46 states and the District of Columbia as of December 31, 2010 to approximately 218,000 in 47 states, the District of Columbia and Canada as of September 30, 2013.
The Co-Employment Model
We deliver our services through a co-employment model, pursuant to which both we and our clients are employers of our clients’ workforce. Our co-employment model affords us a close and embedded relationship with our clients and their employees. In this arrangement, we assume certain aspects of the employer/employee relationship, according to a contract between us and our client. Each of our clients enters into a client service agreement with us that defines the bundled suite of services and benefits to be provided by us, the fees payable to us, and the division of responsibilities between us and our client as co-employers. We currently co-employ employees only in the United States and Canada, but in some cases also provide payroll processing services for our clients’ employees outside these countries utilizing third-party vendors. Each of our customer services agreements has a one-year term that guarantees its pricing terms and typically may be terminated by either party upon 30 days’ prior written notice. The division of responsibilities under our client service agreements is typically as follows:
TriNet Responsibilities
| • | Payment to WSEs of salaries, commissions, bonuses, vacations, paid time off, sick pay, paid leaves of absence and severance payments as reported by the client, related tax reporting and remittance and processing of garnishment and wage deduction orders; |
| • | maintenance of workers compensation insurance and workers compensation claims processing; |
| • | provision and administration of employee benefits that we provide to the WSEs; |
| • | compliance with applicable law for employee benefits offered to WSEs; |
| • | processing of unemployment claims; |
| • | provision and promulgation of HR policies, including an employee handbook describing the co-employment relationship; and |
| • | HR consulting services. |
Client Responsibilities
| • | Compliance with laws associated with the classification of employees as exempt or non-exempt, such as overtime pay and minimum wage law compliance; |
| • | accurate and timely reporting to TriNet of compensation and deduction information, including information relating to salaries, commissions, bonuses, vacations, paid time off, sick pay, paid leaves of absence and severance payments; |
| • | accurate and timely reporting to TriNet of information relating to workplace injuries, employee hires and termination, and other information relevant to TriNet’s services; |
| • | provision and administration of any employee benefits not provided by TriNet (e.g., equity incentive plans); |
| • | compliance with all laws and regulations applicable to the client’s workplace and business, including work eligibility laws, laws relating to workplace safety or the environment, laws relating to family and medical leave, laws pertaining to employee organizing efforts and collective bargaining and employee termination notice requirements; and |
| • | all other matters for which TriNet does not assume responsibility under the client service agreement, such as intellectual property ownership and protection and liability for products produced and/or services provided. |
As a result of our co-employment relationship with each of our WSEs, we are liable for payment of salary, wages and other compensation to the WSEs as reported by the client and are responsible for providing specified employee benefits to such persons, regardless of whether the client pays the associated amounts to us. In most
98
Table of Contents
instances, clients are required to remit payment prior to the applicable payroll date by wire transfer or automated clearinghouse transaction. Although we are ultimately liable under the terms of our client service agreements, as the employer for payroll purposes, to pay employees for work previously performed, we are not obligated to continue to provide services to the client if payment has not been made. For the nine months ended September 30, 2013, our bad debt expense was approximately $0.3 million.
We also assume responsibility for payment and liability for the withholding and remittance of federal and state income and employment taxes with respect to wages and salaries paid to WSEs. In the event we fail to meet these obligations, the client may be held ultimately liable for those obligations. We secure insurance to ensure that our clients are not required to be responsible for taxes in the event we fail to meet these obligations.
U.S. Legal and Regulatory Environment
General
Numerous federal and state laws and regulations relating to employment matters, benefit plans and income and employment taxes affect our operations. Many of these laws, such as ERISA, were enacted before the development of the co-employment relationship that we use and other non-traditional employment relationships, such as temporary employment and other employment-related outsourcing arrangements. Therefore, many of these laws do not specifically address the obligations and responsibilities of our industry, the participants in which are referred to as professional employer organizations. Other federal and state laws and regulations, such as the Patient Protection and Affordable Care Act, are relatively new, and administrative agencies and federal and state courts have only begun to interpret and apply these regulations to our industry. The development of additional regulations and interpretation of those regulations can be expected to evolve over time.
While we believe that our operations are currently in compliance in all material respects with applicable federal and state statutes and regulations, the topics discussed below summarize what we believe are the most important regulatory aspects of our business.
Employer Status
In order for WSEs to receive the full benefit of our benefits offerings, it is important that we constitute the “employer” of the WSEs under the Code and ERISA. The definitions of “employer” under both the Code and ERISA are not clear and are defined in part by complex multi-factor tests under common law. We believe that we qualify as an “employer” of our WSEs in the United States under both the Code and ERISA, and we implement processes to protect and preserve this status.
Tax Qualified Plans. In order to qualify for favorable tax treatment under the Code, certain employee benefit plans such as 401(k) retirement plans and cafeteria plans must be established and maintained by an employer for the exclusive benefit of its employees. Generally, an entity is an “employer” of certain workers for federal employment tax purposes if an employment relationship exists between the entity and the workers under the common law test of employment. The common law test of employment, as applied by the IRS, involves an examination of many factors to ascertain whether an employment relationship exists between a worker and a purported employer. Our 401(k) retirement plans are operated pursuant to guidance provided by the IRS for the operation of defined contribution plans maintained by co-employers that benefit WSEs. This guidance provides qualification standards for such plans. All of our 401(k) retirement plans have received determination letters from the IRS confirming the qualified status of the plans. The IRS 401(k) guidance and qualification requirement are not applicable to the operation of our cafeteria plans.
ERISA Regulations. Employee pension and welfare benefit plans are also governed by ERISA. ERISA defines an “employer” as “any person acting directly as an employer, or indirectly in the interest of an employer, in relation to an employee benefit plan.” ERISA defines the term “employee” as “any individual employed by an employer.” The courts have held that the common law test of employment must be applied to determine whether an individual is an employee or an independent contractor under ERISA. However, in applying that test, control and supervision are less important for ERISA purposes when determining whether an employer has assumed responsibility for an individual’s benefits status. A definitive judicial interpretation of “employer” in the context of a
99
Table of Contents
professional employer organization has not been established, and the U.S. Department of Labor has issued guidance that certain entities in the HR outsourcing industry do not qualify as common law employers of WSEs for ERISA purposes. If we were found not to be an employer for ERISA purposes, our plans would not comply with ERISA, and fines and penalties could be imposed. In addition, our ERISA plans would not enjoy, with respect to WSEs, the full preemption of state laws provided by ERISA and could be subject to various state laws and regulation.
Patient Protection and Affordable Care Act
The Act implements sweeping health care reforms with staggered effective dates from 2010 through 2018, and many provisions in the Act require the issuance of additional guidance from the U.S. Department of Labor, the IRS, the U.S. Department of Health and Human Services and the states. The Act imposes a number of new mandates on the coverage required to be provided under health insurance plans beginning in 2011, with additional requirements staged in subsequent years. We believe that our group health plans comply with existing mandates. However, the guidance issued to date by the IRS and the U.S. Department of Health and Human Services have not addressed, or in some instances are unclear, as to their application in the co-employer context or whether such provisions should be applied at the client level. As a result, we are not yet able to predict all of the impacts to our business, and to our clients, resulting from the Act.
State Unemployment Taxes
State unemployment taxes are based on taxable wages and tax rates assigned by each state. The tax rates vary by state and are determined, in part, based on our prior years’ compensation experience in each state. Certain rates are also determined, in part, by each client’s own compensation experience. In addition, states have the ability under law to increase unemployment tax rates, including retroactively, to cover deficiencies in the unemployment tax funds. Due to the adverse U.S. economic conditions during recent years and the associated reductions in employment levels, the state unemployment funds have experienced a significant increase in the number of unemployment claims. Accordingly, state unemployment tax rates increased substantially over the past few years. Employers in certain states are also experiencing higher federal unemployment tax rates as a result of certain states not repaying their unemployment loans from the federal government in a timely manner. We have taken steps to mitigate the risk of fluctuations in state and federal unemployment tax rates, including reporting and remitting unemployment insurance taxes or contributions at the customer level and/or under the customer’s own account number in approximately 30 states, and we will continue to seek such reporting relationships in the future.
State Regulation of Co-Employers
Forty-two states have adopted provisions for licensing, registration, certification or recognition of co-employers, and others are considering such regulation. Such laws vary from state to state but generally provide for monitoring or ensuring the fiscal responsibility of professional employer organizations, and in some cases codify and clarify the co-employment relationship for unemployment, workers compensation and other purposes under state law. We believe we are in compliance in all material respects with the requirements in all 42 states. Regardless of whether a state has licensing, registration or certification requirements for co-employers, we must comply with a number of other state and local regulations that could impact our operations, such as state and local taxes, licensing, zoning and business regulations.
Competition
We face significant competition on a national and regional level from a number of companies purporting to deliver a range of bundled services that are generally similar to the services we provide. The National Association of Professional Employer Organizations, or NAPEO, estimates that there are between 700 and 900 such entities currently operating in the United States. We are one of only four PEOs accredited by the Employer Services Assurance Corporation that offers services in all 50 states and believe that we are one of the largest PEOs in the industry. Our competitors include large professional employer organizations such as the TotalSource unit of Automatic Data Processing, Inc. and Insperity, Inc., as well as specialized and small professional employer organization service providers. If and to the extent that we and other companies providing these
100
Table of Contents
services are successful in growing our businesses, we anticipate that future competitors will enter this industry. Some of our current, and any future, competitors have or may have greater marketing and financial resources than we do, and may be better positioned than we are in certain markets. Increased competition in our industry could result in price reductions or loss of market share, any of which could harm our business. We expect that we will continue to experience competitive pricing pressure. If we cannot compete effectively, our market share, business, results of operations and financial condition may suffer.
In addition to competition from other professional employer organizations, we also face competition in the form of companies serving their HR needs in traditional manners. These forms of competition include:
| • | HR and information systems departments and personnel of companies that perform their own administration of benefits, payroll and HR; |
| • | providers of certain endpoint HR services, including payroll, benefits and business process outsourcers with high-volume transaction and administrative capabilities, such as Automatic Data Processing, Inc., Paychex, Inc. and other third-party administrators; and |
| • | benefits exchanges that provide benefits administration services over the Internet to companies that otherwise maintain their own benefit plans. |
We believe that our services are attractive to many SMBs in part because of our ability to provide workers compensation, health care and other benefits programs to them on a cost-effective basis. We compete with insurance brokers and other providers of this coverage in this regard, and our offerings must be priced competitively with those provided by these competitors in order for us to attract and retain our clients.
We believe the principal competitive factors in our market include the following:
| • | level of customer satisfaction; |
| • | ease of customer setup and on-boarding; |
| • | breadth and depth of benefit plans and online functionality; |
| • | vertical market expertise; |
| • | total cost of service; |
| • | brand awareness and reputation; |
| • | ability to innovate and respond to customer needs rapidly; and |
| • | subject matter expertise. |
We believe that we compete favorably on the basis of each of these factors.
We may not be successful in convincing potential clients that the use of our services is a superior, cost-effective means of satisfying their HR obligations relative to the way in which they currently satisfy these obligations.
If we cannot compete effectively against other professional employer organizations or against the alternative means by which companies meet their HR obligations, our market share, business, results of operations and financial condition may suffer.
Intellectual Property
Our success depends in part on intellectual property rights to the services that we develop. We rely on a combination of contractual rights, including non-disclosure agreements, trade secrets, copyrights and trademarks, to establish and protect our intellectual property rights in our names, services, methodologies and related technologies. If we lose intellectual property protection or the ability to secure intellectual property protection on any of our names, confidential information or technology, this could harm our business. Our intellectual property
101
Table of Contents
rights may not prevent competitors from independently developing services and methodologies similar to ours, and the steps we take might be inadequate to deter infringement or misappropriation of our intellectual property by competitors, former employees or other third parties, any of which could harm our business. We do not currently have any registered patents or pending patent applications covering any of our technology. We own registered trademarks in the United States and Canada that have various expiration dates unless renewed through customary processes. Our trademark registrations may be unenforceable or ineffective in protecting our trademarks. Our trademarks may be unenforceable in countries outside of the United States, which may adversely affect our ability to build our brand outside of the United States.
Although we believe that our conduct of our business does not infringe on the intellectual property rights of others, third parties may nevertheless assert infringement claims against us in the future. We may be required to modify our products, services, internal systems or technologies, or obtain a license to permit our continued use of those rights. We may be unable to do so in a timely manner, or upon reasonable terms and conditions, which could harm our business. In addition, future litigation over these matters could result in substantial costs and resource diversion. Adverse determinations in any litigation or proceedings of this type could subject us to significant liabilities to third parties and could prevent us from using some of our services, internal systems or technologies.
Corporate Employees
We refer to our employees, excluding employees that we co-employ on behalf of our clients, as our corporate employees. We had 1,713 corporate employees as of September 30, 2013. We believe our relations with our corporate employees are good. None of our corporate employees is covered by a collective bargaining agreement.
Properties
We lease space for our client service centers in Bradenton, Florida, Reno, Nevada, Fort Mill, South Carolina, Oklahoma City, Oklahoma and New York, New York, approximately 60 regional sales offices in various states in the United States and our corporate headquarters in San Leandro, California. All of these leases expire at various times through 2023.
We believe our current facilities are adequate for the purposes for which they are intended and provide for further expansion to accommodate our long-term growth and expansion goals. We believe that short-term leased facilities are readily available if needed to accommodate near-term needs if they arise. We will continue to evaluate the need for additional facilities based on the extent of our product and service offerings, the rate of client growth, the geographic distribution of our client base and our long-term service delivery requirements.
Legal Proceedings
As a co-employer, we are regularly involved in legal proceedings and are subject to WSE claims arising in the ordinary course of our business. Some of these claims and legal proceedings arise out of our clients’ conduct by virtue of our co-employer relationship, over which we have no control.
We are not presently a party to any legal proceedings that in the opinion of our management, if determined adversely to us, would have a material adverse effect on our business, financial condition, operating results or cash flows. Regardless of the outcome, litigation can have an adverse impact on us because of defense and settlement costs, diversion of management resources and other factors.
102
Table of Contents
Executive Officers, Other Key Employees and Directors
Our executive officers, other key employees and directors, their respective positions and their respective ages as of September 30, 2013 are as follows:
| Name |
Age | Position(s) | ||||
| Executive Officers |
||||||
| Burton M. Goldfield |
58 | President, Chief Executive Officer and Director | ||||
| William Porter |
59 | Vice President and Chief Financial Officer | ||||
| Gregory L. Hammond |
58 | Executive Vice President and Chief Legal Officer | ||||
| John Turner |
48 | Senior Vice President of Sales | ||||
| Other Key Employees |
||||||
| Steven Apfelberg |
43 | Vice President of Marketing | ||||
| James Franzone |
38 | Vice President of Corporate Development | ||||
| Madhukar Govindaraju |
47 | Vice President of Products and Software Development | ||||
| Jonathan Hubley |
45 | Vice President of Operations | ||||
| Meredith Johnson |
51 | Vice President of Human Resources | ||||
| Pasquale (“Patrick”) Villella |
52 | Vice President of Client Services | ||||
| Non-Employee Directors |
||||||
| H. Raymond Bingham(1) |
68 | Chairman | ||||
| Katherine August-deWilde(2) |
65 | Director | ||||
| Martin Babinec |
58 | Director | ||||
| Kenneth Goldman(2) |
64 | Director | ||||
| David C. Hodgson(2) |
56 | Director | ||||
| Wayne B. Lowell(1)(2) |
58 | Director | ||||
| (1) | Member of the compensation committee. |
| (2) | Member of the audit committee. |
| (3) | Member of the nominating and corporate governance committee. |
Executive Officers
Burton M. Goldfield joined TriNet in May 2008 succeeding Martin Babinec, TriNet’s founder, as Chief Executive Officer. From 2006 to 2008, Mr. Goldfield was Chief Executive Officer of Ketera Technologies, Inc., a provider of on-demand Software-as-a-Service management solutions. From 2004 to 2006, he was the Senior Vice President of Worldwide Field Operations at Hyperion Solutions Corporation, a business performance management software company, which was ultimately acquired by Oracle Corporation. Earlier, he was with Rational Software Corporation for 13 years in a variety of management capacities, and subsequently Vice President of Worldwide Sales for IBM Corporation, Rational Software division upon the acquisition of Rational by IBM. Mr. Goldfield holds a B.S. in biomedical engineering from Syracuse University and an M.B.A. from Villanova University. Mr. Goldfield’s significant business experience both inside and outside our industry and role as our Chief Executive Officer brings unique insight to our board of directors.
William Porter joined TriNet in August 2010 as Chief Financial Officer. Prior to joining TriNet, Mr. Porter was most recently at Cadence Design Systems, Inc., a computer-aided design company, where he served in a series of executive roles over a 15-year period, including Chief Financial Officer from May 1999 to April 2008
103
Table of Contents
and Executive Vice President and Chief Administrative Officer from April 2008 to October 2008. Prior to Cadence, Mr. Porter spent six years at Apple Inc., where he held various accounting, reporting and operational roles. He began his career at Arthur Andersen, where he served small and medium-sized businesses and high-tech clients and gained 12 years’ experience in accounting, audits, business consulting and mergers and acquisitions. Mr. Porter holds a B.A. in accounting and an M.B.A. in finance, both from the University of California at Berkeley.
Gregory Hammond has served as our Chief Legal Officer since joining TriNet in 1997. For 20 years prior to joining TriNet, Mr. Hammond practiced outsourced human resources law at various private law firms, including Seyfarth, Shaw, Fairweather & Geraldson, a predecessor to Seyfarth Shaw LLP, Millisor & Nobil, Co., which was subsequently acquired by Fisher & Phillips LLP, Hahn Loeser & Parks LLP and Hammond & Kazaglis Co., L.P.A. From 1987 to 1991, Mr. Hammond served as general counsel to the National Association of Professional Employer Organizations, or NAPEO. Mr. Hammond also serves on the board of directors of Big Sunday, a nonprofit organization. Mr. Hammond holds a B.A. from Mercer University and a J.D. from the University of Chicago.
John Turner joined TriNet in April 2012 as the Senior Vice President of Sales. From January 2011 to March 2012, Mr. Turner was the Vice President of American Sales at FalconStor Software, Inc., a provider of data protection and storage virtualization solutions. From 2004 to January 2011, Mr. Turner also served as the Vice President of Sales for Symantec Corporation, a security software company. Mr. Turner joined Symantec in connection with its acquisition of VERITAS, where he served as the Senior Director for Western U.S., Emerging Solutions. Prior to joining VERITAS, he was Vice President of Sales for Gartner CIO Programs. Mr. Turner holds a B.A. in Marketing from Santa Clara University and an M.B.A. from San Jose State University.
Other Key Employees
Steven Apfelberg joined TriNet in November 2012 as our Vice President of Marketing. From May 2011 to June 2012, he was the Chief Marketing Officer at Skire Solutions Inc., a provider of project management software for capital construction, real estate and facilities that was acquired by Oracle Corporation in 2012. From October 2009 to January 2011, he was the Vice President of Marketing at Yammer Inc., an enterprise social networking solutions company. From October 2004 to September 2009, Mr. Apfelberg held various positions at Callidus Software Inc., a provider of cloud-based sales, marketing, learning and hiring solutions, including serving as the Senior Vice President of Marketing and Business Development from April 2008 to September 2009. He also held senior roles in marketing and finance at Siebel Systems, Remedy and Oracle Corporation. Mr. Apfelberg holds a B.A. in Economics from Stanford University.
James Franzone joined TriNet in July 2010 as our Vice President of Corporate Development. From July 2005 to July 2010, Mr. Franzone was Vice President at General Atlantic LLC, a leading global growth equity firm. Mr. Franzone also previously served as senior associate for Technology Crossover Ventures, a venture capital firm. He began his career as a business analyst at McKinsey & Company, a management consulting firm, where he drove growth initiatives through organic and acquisitive means in partnership with senior management teams. Mr. Franzone holds an A.B. in economics from Dartmouth College and an M.B.A. from Stanford University.
Madhukar Govindaraju joined TriNet in 2013 as the Vice President of Products and currently serves as the Vice President of Products and Software Development. From 2012 to 2013, Mr. Govindaraju served as the Senior Vice President of Engineering and Technology at Spigit, Inc. From 2010 to 2012, Mr. Govindaraju served as the Senior Vice President of Engineering at Saba Software, Inc. From 2009 to 2010, Mr. Govindaraju was the Chief Development Architect within the Technology and Innovation Platform Group at SAP, where he was responsible for the SAP Business Objects Suite of On-Premise and On-Demand / SaaS BI products. From 2007 to 2009, Mr. Govindaraju served in multiple roles at SAP Labs, LLC and Business Objects, S.A., and from March 2006 to April 2007 he served as Vice President, Engineering at Cloud9 Analytics. Prior to March 2006, Mr. Govindaraju served as Vice President of Engineering at Hyperion Solutions Corporation, CTO and Vice President of Engineering at Promptu Corporation and CTO and Senior Vice President, Engineering at ChipCenter, LLC. Mr. Govindaraju holds a M.S. in Computer Science from the Indian Institute of Science,
104
Table of Contents
Bangalore, India. Mr. Govindaraju has also been a Visiting Fellow at the Tsinghua (Peking) University’s Business Performance Management Research Institute.
Jonathan Hubley joined TriNet in 2009 as Vice President of Service Operations and currently serves as our Vice President of Operations. In 2006, Mr. Hubley began his tenure with Gevity as Director in Service Delivery, and was subsequently promoted to Vice President of Service Delivery, Operations at Gevity, a title he held until 2009. From 2002 to 2006, Mr. Hubley also worked at Ceridian Corporation, a human resources services company, as its Director of Operations. Prior to 2002, Mr. Hubley held management positions at Scholastic Inc., J. Crew and IBM. Mr. Hubley holds a B.B.A. from the University of Notre Dame.
Meredith Johnson joined TriNet in 2009 as Vice President of Human Resources and currently serves as our Vice President of Human Resources. From 1996 to 2009, Ms. Johnson served for over 12 years at Gevity in roles including corporate HR, service, sales, and operations, most recently as Chief People Officer. Ms. Johnson holds a B.S. in Journalism from the University of Florida.
Pasquale (“Patrick”) Villella joined TriNet in January 2007 as our Director of Sales for the Northeast, Midwest and Mid-Atlantic regions. In January 2011, he was promoted to Vice President, Human Capital Services and in July 2012, he was promoted to the newly-created position of Vice President of Client Services. Prior to joining TriNet, Mr. Villella served in a variety of individual contributor and management roles at Insperity, a human resources services company, from April 2002 through January 2007. Mr. Villella holds a B.A. from Providence College, a J.D. from the New England School of Law and a Masters of Law and Letters from Boston University School of Law.
Board of Directors
H. Raymond Bingham has been a director since July 2008 and has served as our Chairman since January 2010. He is an Advisory Director of General Atlantic and served as a Managing Director from September 2006 to December 2009. He was Executive Chairman of the Board of Directors of Cadence Design Systems, Inc., a supplier of electronic design automation software and services, from May 2004 to July 2005, and served as a director of Cadence from November 1997 to July 2005. Prior to his role as Executive Chairman, he served as President and Chief Executive Officer of Cadence from April 1999 to May 2004 and as Executive Vice President and Chief Financial Officer from April 1993 to April 1999. Mr. Bingham also serves as a director of Spansion, Inc., Flextronics International Ltd., Oracle Corporation, Dice Holdings, Inc. and Fusion-io, Inc. Mr. Bingham holds a B.S. in Economics from Weber State University and an M.B.A. from Harvard Business School. Additionally, he was awarded an Honorary Doctorate of Humanities from Weber State University. Mr. Bingham was appointed to serve on our board of directors based on his broad and extensive experience serving in management roles at technology companies, including as chief executive officer and chief financial officer, as well as his experience as an Advisory Director of General Atlantic. Mr. Bingham’s significant service on the board of directors of other publicly traded technology companies and his extensive knowledge and experience managing portfolio companies both within and outside our industry brings unique insight to our board of directors.
Katherine August-deWilde has been a director since October 2013. Since September 2007, Ms. August-deWilde has served as the President and Chief Operating Officer of First Republic Bank, a commercial bank specializing in private banking, business banking and wealth management. Ms. August-deWilde has served in various roles at First Republic Bank since 1985, including as Chief Financial Officer and Executive Vice President and Chief Operating Officer. Prior to joining First Republic Bank, Ms. August-deWilde served as Vice President and Treasurer, and later as Senior Vice President and Chief Financial Officer, at PMI Mortgage Insurance Co. from 1979 to 1985. From 1975 to 1979, she was an associate at McKinsey & Company. Ms. August-deWilde has also served on the board of directors of First Republic Bank since 1988. She is a Trustee of the Boys & Girls Clubs of San Francisco, a member of the Advisory Council of the Stanford Center on Longevity, and a member of the Stanford Graduate School of Business Advisory Council. Ms. August-deWilde holds a B.A. from Goucher College and an M.B.A. from Stanford University. Ms. August-deWilde was appointed to serve on our board of directors based on her business acumen and financial expertise and her experience as a chief financial officer.
105
Table of Contents
Martin Babinec founded TriNet in 1988 and has served on our board of directors since that time, acting as Chairman until December 2009. From 1988 until May 2008, he also served as our Chief Executive Officer. Mr. Babinec also founded and serves as Chairman of Upstate Venture Connect and co-founded and serves as Chairman of the StartFast Venture Accelerator. Prior to founding TriNet, Mr. Babinec served in senior human resources management positions at the Navy Exchange, an international retailer. Mr. Babinec holds a B.S. in Business Administration from Shippensburg University. Mr. Babinec’s significant business experience both inside and outside our industry and role as our founder and former Chief Executive Officer brings unique insight to our board of directors.
Kenneth Goldman has been a director since August 2009. Since October 2012, Mr. Goldman has served as the Chief Financial Officer of Yahoo! Inc., an internet services company. Prior to joining Yahoo!, Mr. Goldman served as Chief Financial Officer of Fortinet Inc., a provider of unified threat management solutions, from September 2007 to October 2012. From November 2006 to August 2007, Mr. Goldman served as Executive Vice President and Chief Financial Officer of Dexterra, Inc., a provider of mobile enterprise software. From August 2000 until March 2006, Mr. Goldman served as Senior Vice President, Finance and Administration, and Chief Financial Officer of Siebel Systems, Inc., a supplier of customer software solutions and services which was acquired by Oracle Corporation in January 2006. Mr. Goldman serves on the board of directors of Infinera Corporation, NXP Semiconductors N.V., Gigamon Inc. and Yahoo! Japan. Mr. Goldman is also a Trustee Emeritus on the board of trustees of Cornell University. Mr. Goldman holds a B.S. in Electrical Engineering from Cornell University and an M.B.A. from Harvard Business School. Mr. Goldman was appointed to serve on our board of directors based on his significant experience as a chief financial officer of public companies.
David C. Hodgson has been a director since 2005 and is a Managing Director of General Atlantic. He joined General Atlantic in 1982, helped found their partnership, and has over 30 years of experience identifying and assisting portfolio companies worldwide in all areas of their development. Mr. Hodgson serves on the boards of directors of a number of public and private companies including Pierpont Securities, Hyperion Insurance Group Limited, and Dice Holdings, Inc. Mr. Hodgson is chairman of the boards of trustees of Johns Hopkins Medicine, Johns Hopkins Hospital System, Manhattan Theatre Club and Echoing Green. He also serves as a trustee of Dartmouth College and Johns Hopkins University. Mr. Hodgson holds an A.B. in Mathematics and Social Sciences from Dartmouth College and a M.B.A. from the Stanford University Graduate School of Business. Mr. Hodgson was appointed to serve on our board of directors based on his experience as a Managing Director of General Atlantic.
Wayne B. Lowell has been a director since 2009. Since early 2012, Mr. Lowell has been serving as Chairman and Chief Executive Officer of Senior Whole Health Holdings, Inc., a health insurance company focused on providing health insurance coverage to senior citizens. From October 2007 to July 2008, Mr. Lowell served as Chief Executive Officer of Wellmed Medical Management, Inc., a physician healthcare services company. From 1998 to September 2007 and July 2008 to June 2012, he served as President of Jonchra Associates, LLC, which provides strategic, operating and financial advice to senior management of private-equity funded and publicly held entities. From 1986 to 1998, he worked for PacifiCare Health Systems (now part of United Healthcare). At PacifiCare, he held various positions of increasing authority, ultimately serving as Executive Vice President, Chief Financial Officer and Chief Administrative Officer. From January 2010 to June 2013, Mr. Lowell served on the board of directors of Addus Homecare Corp., and from August 2007 to March 2011, he served on the board of directors of Insight Health Services Holdings Corp. Mr. Lowell holds a B.S. in accounting from the University of Maryland and an M.B.A. from the University of California at Irvine. Mr. Lowell is a Certified Public Accountant. Mr. Lowell was appointed to serve on our board of directors based on his years of experience in the health care industry and his experience as a chief financial officer.
Each of our officers serves at the discretion of our board of directors. Each of our directors holds office until his or her successor is duly elected and qualified or until his or her earlier resignation or removal. There are no family relationships among any of our directors or executive officers.
106
Table of Contents
Board Composition
Certain members of our board of directors were elected pursuant to the provisions of our amended and restated stockholders agreement entered into in June 2009. Under this agreement, our stockholders that are party to the agreement have agreed to vote their shares to elect to our board of directors as follows: (i) four directors designated by GA TriNet LLC; (ii) the person serving as Chief Executive Officer; and (iii) two independent directors. This agreement will terminate effective upon the completion of this offering.
Our board of directors may establish the authorized number of directors from time to time by resolution and currently consists of seven members. In accordance with our amended and restated certificate of incorporation that will be effective upon the completion of this offering, our board of directors will be divided into three classes with staggered three-year terms. At each annual general meeting of stockholders, the successors to directors whose terms then expire will be elected to serve from the time of election and qualification until the third annual meeting following election. Our directors will be divided among the three classes as follows:
| • | the Class I directors will be and , and their terms will expire at the annual general meeting of stockholders to be held in 2014; |
| • | the Class II directors will be and , and their terms will expire at the annual general meeting of stockholders to be held in 2015; and |
| • | the Class III directors will be , and , and their terms will expire at the annual general meeting of stockholders to be held in 2016. |
We expect that any additional directorships resulting from an increase in the number of directors will be distributed among the three classes so that, as nearly as possible, each class will consist of one third of the directors. The division of our board of directors into three classes with staggered three-year terms may delay or prevent a change of our management or a change in control. See “Description of Capital Stock—Anti-takeover Provisions—Amended and Restated Certificate of Incorporation and Amended and Restated Bylaws.”
Board of Director Independence
Generally, under the listing requirements and rules of , independent directors must comprise a majority of a listed company’s board of directors within one year of the completion of this offering. Our board of directors has undertaken a review of its composition, the composition of its committees and the independence of each director. Our board of directors has determined that, other than Burton S. Goldfield, by virtue of his position as Chief Executive Officer, none of our directors has a relationship that would interfere with the exercise of independent judgment in carrying out the responsibilities of a director and that each is “independent” as that term is defined under the listing requirements and rules of . Accordingly, a majority of our directors is independent, as required under applicable rules. In making this determination, our board of directors considered the current and prior relationships that each non-employee director has with our company and all other facts and circumstances our board of directors deemed relevant in determining their independence, including the beneficial ownership of our capital stock by each non-employee director.
Lead Independent Director
Our board of directors has appointed Mr. Bingham, our Chairman, to serve as our lead independent director. As lead independent director, Mr. Bingham presides over periodic meetings of our independent directors, serves as a liaison between our Chief Executive Officer and the independent directors and performs such additional duties as our board of directors may otherwise determine and delegate.
Board Committees
Our board of directors has established an audit committee and a compensation committee and will, prior to the completion of this offering, establish a nominating and corporate governance committee. Our board of directors may establish other committees to facilitate the management of our business. The expected composition
107
Table of Contents
and functions of each committee upon completion of this offering are described below. Members serve on these committees until their resignation or until otherwise determined by our board of directors.
Audit Committee
Our audit committee consists of Ms. August-deWilde and Messrs. Hodgson, Goldman and Lowell. Upon the completion of this offering, our audit committee will be composed solely of independent directors under the listing standards and Rule 10A-3(b)(1) promulgated under the Exchange Act. Mr. Hodgson intends to resign from the audit committee upon the completion of this offering.
The chair of our audit committee is Mr. Goldman. Our board of directors has determined that Ms. August-deWilde and Messrs. Goldman and Lowell are “audit committee financial experts” within the meaning of SEC regulations. Our board of directors has also determined that each member of our audit committee has the requisite financial expertise required under the applicable requirements of . In arriving at this determination, our board of directors has examined each audit committee member’s scope of experience and the nature of their employment in the corporate finance sector. The primary functions of this committee include:
| • | reviewing and pre-approving the engagement of our independent registered public accounting firm to perform audit services and any permissible non-audit services; |
| • | evaluating the performance of our independent registered public accounting firm and deciding whether to retain their services; |
| • | monitoring the rotation of partners on our engagement team of our independent registered public accounting firm; |
| • | reviewing our annual and quarterly financial statements and reports and discussing the statements and reports with our independent registered public accounting firm and management, including a review of disclosures under “Management’s Discussion and Analysis of Financial Condition and Results of Operations”; |
| • | considering and approving or disapproving of all related party transactions; |
| • | reviewing, with our independent registered public accounting firm and management, significant issues that may arise regarding accounting principles and financial statement presentation, as well as matters concerning the scope, adequacy and effectiveness of our financial controls; |
| • | conducting an annual assessment of the performance of the audit committee and its members, and the adequacy of its charter; and |
| • | establishing procedures for the receipt, retention and treatment of complaints received by us regarding financial controls, accounting or auditing matters. |
Compensation Committee
Our compensation committee consists of Messrs. Bingham and Lowell, each of whom our board of directors has determined to be independent under the listing standards and Rule 10C-1 promulgated under the Exchange Act, a “non-employee director” as defined in Rule 16b-3 promulgated under the Exchange Act and an “outside director” as that term is defined in Section 162(m) of the Code. The chair of our compensation committee is Mr. Bingham. The functions of this committee include:
| • | determining the compensation and other terms of employment of our chief executive officer and our other executive officers and reviewing and approving corporate performance goals and objectives relevant to such compensation; |
| • | reviewing and recommending to the full board of directors the compensation of our directors; |
108
Table of Contents
| • | evaluating, adopting and administering the equity incentive plans, compensation plans and similar programs advisable for us, as well as modification or termination of existing plans and programs; |
| • | establishing policies with respect to equity compensation arrangements; |
| • | reviewing with management our disclosures under the caption “Compensation Discussion and Analysis” and recommending to the full board of directors its inclusion in our periodic reports to be filed with the SEC; and |
| • | reviewing and evaluating, at least annually, the performance of the compensation committee and the adequacy of its charter. |
Nominating and Corporate Governance Committee
Our nominating and corporate governance committee consists of and , each of whom our board of directors has determined to be independent under the listing standards. The chair of our nominating and corporate governance committee is . The functions of this committee include:
| • | reviewing periodically and evaluating director performance on our board of directors and its applicable committees, and recommending to our board of directors and management areas for improvement; |
| • | interviewing, evaluating, nominating and recommending individuals for membership on our board of directors; |
| • | reviewing and recommending to our board of directors any amendments to our corporate governance policies; and |
| • | reviewing and assessing, at least annually, the performance of the nominating and corporate governance committee and the adequacy of its charter. |
Code of Business Conduct and Ethics
In connection with this offering, our board of directors will adopt a code of business conduct and ethics that applies to all of our corporate employees, officers and directors, including those officers responsible for financial reporting. Upon completion of this offering, our code of business conduct and ethics will be available on our website at www.trinet.com. We intend to disclose any amendments to the code, or any waivers of its requirements, on our website or in public filings to the extent required by applicable SEC rules or exchange requirements. The inclusion of our website address in this prospectus does not include or incorporate by reference into this prospectus the information on or accessible through our website.
Compensation Committee Interlocks and Insider Participation
None of the members of the compensation committee is currently or has been at any time one of our officers or employees. None of our executive officers currently serves, or has served during the last year, as a member of the board of directors or compensation committee of any entity that has one or more executive officers serving as a member of our board of directors or compensation committee.
Non-Employee Director Compensation
Our compensation committee has approved an outside director compensation policy that provides that each non-employee director, other than Mr. Hodgson, receives the following cash compensation for board services:
| • | $35,000 per year for service as a board member, or $50,000 per year for service as the Chairman of the Board; |
| • | $10,000 per year for service as the chair of the audit committee or compensation committee; |
| • | $1,000 for attendance at each board meeting (whether in person or by telephone); and |
| • | $500 to non-chair committee members for attendance at each committee meeting (whether in person or by telephone). |
109
Table of Contents
In addition, pursuant to the policy, each non-employee director is granted an option to purchase 10,000 shares of our common stock (15,000, in the case of the Chairman of the Board) at the time of the first board of directors meeting of each calendar year, and each new non-employee director is granted an option to purchase 30,000 shares of our common stock upon election to the board of directors. The number of shares to be granted to our non-employee directors pursuant to our policy was not affected by our stock split in July 2013. We also have a policy of reimbursing our directors for their reasonable out-of-pocket expenses incurred in attending board and committee meetings.
The following table sets forth information regarding compensation earned by or paid to our non-employee directors during 2013:
| Name |
Fees Earned or Paid in Cash ($) |
Option Awards ($)(1) |
Total ($) |
|||||||||
| Katherine August-deWilde |
11,750 | 614,100 | 625,850 | |||||||||
| Martin Babinec |
41,000 | 172,400 | 213,400 | |||||||||
| Raymond H. Bingham |
66,000 | 258,600 | 324,600 | |||||||||
| Kenneth Goldman |
51,000 | 172,400 | 223,400 | |||||||||
| Wayne B. Lowell |
45,000 | 172,400 | 217,400 | |||||||||
| (1) | The amounts reported do not reflect the amounts actually received by our non-employee directors. Instead, these amounts reflect the aggregate grant date fair value of each stock option granted to our non-employee directors during 2013, as computed in accordance with FASB ASC 718. Assumptions used in the calculation of these amounts are included in Note 7 to our consolidated financial statements included in this prospectus. As required by SEC rules, the amounts shown exclude the impact of estimated forfeitures related to service-based vesting conditions. Our non-employee directors who have received options will only realize compensation with regard to these options to the extent the trading price of our common stock is greater than the exercise price of such options. |
110
Table of Contents
Compensation Discussion and Analysis
This Compensation Discussion and Analysis explains our executive compensation philosophy, objectives and design, our compensation-setting process, our executive compensation program components, as well as the specific decisions made for 2013 compensation for each of our named executive officers, or NEOs. Our named executive officers for 2013 were:
| Burton M. Goldfield | President and Chief Executive Officer | |
| William Porter | Vice President and Chief Financial Officer | |
| Gregory L. Hammond | Executive Vice President and Chief Legal Officer | |
| John Turner | Senior Vice President, Sales |
All references to employees in this Executive Compensation section are to our corporate employees.
Compensation Philosophy, Objectives and Design
Philosophy. As a professional employer organization, we operate in a new and rapidly evolving industry sector. To succeed in this environment, we must attract and retain a highly talented executive team, including executives with strong leadership skills who can run our business functions, achieve results that meet our clients’ objectives, and sell our services. We have designed our compensation programs to accomplish these goals, while at the same time creating a “pay for performance” environment that aligns the long-term interests of our executive team with those of our stockholders.
Objectives. To be successful in our industry requires that we continually build on our deep knowledge of specific vertical markets, expand the breadth and quality of our HR solution, enhance our technology platform, and manage our expanding operations efficiently and effectively, while maintaining our reputation and building trust with both current and prospective clients. Our executive compensation programs are designed to achieve these objectives, so that we are able to:
| • | attract and retain talented and experienced executives, who possess the knowledge, skills and leadership criteria critical to our success; |
| • | motivate these executives to achieve our business objectives and uphold our core values; |
| • | promote teamwork within the executive team, while also recognizing the unique role each executive plays in our success; and |
| • | ensure the alignment of the long-term interests of our executives with those of our stockholders. |
Design. Our NEOs receive total compensation consisting of a combination of base salary, annual variable cash compensation, and long-term equity incentive awards. They also participate in the standard employee benefit plans available to most of our U.S. employees, and receive a small amount of additional benefits and perquisite reimbursements. In addition, our executive officers are eligible for modest severance and change in control benefits under certain circumstances.
Having been a privately-held company, our compensation structure has taken into account the fact that our executives are taking a significant financial risk in their employment, and so we have sought to provide sufficient annual cash compensation (in the form of both salary and annual bonus) in order to maintain a stable executive team, while at the same time providing meaningful equity compensation opportunities. We believe this balance of cash and equity compensation has served us well, by allowing us to conserve cash during our early years, while also aligning the long-term interests of our executive team with those of our stockholders. The limited severance and change in control benefits we provide allow our executives to focus on pursuing business strategies that, while in the best interest of our stockholders, may result in a disruption in their normal employment.
Compensation Setting Process
Role of Our Compensation Committee. Our compensation committee oversees our executive compensation and benefit plans and policies, administers our equity incentive plans, and reviews and approves annually the
111
Table of Contents
compensation decisions relating to our executive officers, with the exception of our chief executive officer. Compensation decisions for our Chief Executive Officer are made by the independent members of the board of directors, as informed by the analysis and recommendations made by the compensation committee. During 2013, our compensation committee members were Raymond Bingham and Wayne Lowell.
The factors considered by our compensation committee in determining executive compensation for 2013 included:
| • | the recommendations of our Chief Executive Officer; |
| • | corporate growth and other elements of financial performance; |
| • | individual achievement by each executive against his or her management objectives; |
| • | the executive’s existing equity awards and stock holdings; and |
| • | the potential dilutive effect of new equity awards on our stockholders. |
Role of Management. Our Chief Executive Officer works closely with members of our compensation committee in determining compensation for our named executive officers. Our Chief Executive Officer reviews the performance of the other executive officers, and then shares those evaluations and makes recommendations to our compensation committee for each element of compensation. Our Chief Executive Officer also works with our Chief Financial Officer and Chief Legal Officer to recommend the structure of the annual Executive Bonus Plan, and individual and corporate performance objectives, and to evaluate actual performance against the selected metrics. Our Chief Executive Officer also makes recommendations on new hire compensation packages. In all cases, however, final decision making is done by the committee. Moreover, no executive officer participates in the determination of the amounts or components of his or her compensation.
Use of Compensation Survey and Peer Group Data. As a private company, the members of our compensation committee have relied heavily upon their own substantial knowledge and experience gained in overseeing and managing this and similar business ventures in making compensation-related decisions. That knowledge included oversight and approval of executive-level hiring at our company, as well as familiarity with the market forces for talent in the region and in other markets in which we compete for talent. In this context, our compensation committee was able to benchmark both elements of executive compensation and amounts awarded on an informal basis.
Beginning in 2013, in anticipation of this offering, our compensation committee engaged in a more formalized analysis of executive compensation survey data, including review of both the Towers Watson Data Services’ Compensation Data Bank General Industry Executive Compensation Survey (for base salary and annual variable compensation) and the Advanced-HR’s Option Impact survey (for equity awards) for comparison purposes. The Towers Watson survey data was current as of March 1, 2011, and covered over 400 companies in a broad range of industries. Our management team worked with Towers Watson Data Services to normalize the data by applying an assumed 3% annual rate of increase since the report date, and we also used regression analysis to account for the fact that most of the participants in the survey had revenues and number of employees in excess of TriNet’s. The Advanced-HR Option Impact survey data reviewed by our compensation committee was not aged or otherwise normalized, as the data comprised only privately-held and venture-backed companies, and the survey reporting date was more recent.
In addition to the survey data discussed above, our compensation committee reviewed the compensation of each of our executive officers against compensation levels at three public companies that may be included in any future peer group, namely, Automatic Data Processing, Inc., Insperity, Inc. and Paychex, using the information published in their most recent annual proxy statements. While this number of companies was not sufficient to produce statistically valid benchmark data, our compensation committee did find review of this information useful and informative in evaluating our own programs of executive compensation, and the amounts awarded under each program.
Following the closing of this offering, our compensation committee will continue to be responsible for developing and implementing our executive compensation policies, and for establishing and approving the
112
Table of Contents
compensation for all of our executive officers (other than the Chief Executive Officer, whose compensation, as discussed above, is set by the independent members of the board of directors). We also expect that our compensation committee will continue to review compensation survey data in connection with the establishment of cash and equity compensation and related policies, and individual award amounts, as our company and our industry further develop. We expect that this type of market data and reports from external consultants will provide useful context for the committee’s compensation decisions, although we expect that the factors such as corporate and individual performance will continue to remain at the forefront when the committee arrives at final compensation decisions for our executive team.
Executive Compensation Program Components
The compensation of the named executive officers consists of the following principal components:
| • | Base salary; |
| • | Annual variable cash compensation; |
| • | Long-term equity incentive awards; |
| • | Benefits consistent with those offered to other U.S. employees; and |
| • | A modest level of additional benefits and perquisites. |
In addition, our executives participate in the standard employee benefit plans generally available to our other U.S. employees, and they receive a very small amount of perquisites relative to overall compensation. We also provide severance to our named executive officers for certain involuntary terminations, as discussed below under the heading “—Potential Payments upon Termination or Change in Control.”
Each of the elements of our executive compensation is discussed in detail below, including a description of the particular element and how it fits into our overall executive compensation and a discussion of the amounts of compensation paid to our named executive officers in 2012 and 2013 under each of these elements.
Base Salary
We believe that a competitive base salary is a necessary element of our executive compensation program, so that we can attract and retain a stable management team. Base salaries for our named executive officers are also intended to be competitive with those received by other individuals in similar positions at the companies with which we compete for talent, as well as equitable across the executive team. The base salaries for our named executive officers for 2012 and 2013 were as follows:
| Named Executive Officer |
2012 Base Salary |
% increase from 2011 |
2013 Base Salary |
% increase from 2012 |
||||||||||||
| Burton M. Goldfield |
$ | 460,000 | 2.2 | % | $ | 500,000 | 8.7 | % | ||||||||
| William Porter |
$ | 340,000 | 4.6 | % | $ | 340,000 | 0 | % | ||||||||
| Gregory Hammond |
$ | 295,000 | 3.5 | % | $ | 295,000 | 0 | % | ||||||||
| John Turner |
$ | 250,000 | n/a | $ | 250,000 | 0 | % | |||||||||
The base salaries of our named executive officers are reviewed annually and adjusted to reflect individual contributions, company performance and market data. In connection with its review of the Towers Watson survey data discussed above, our compensation committee determined that the existing base salaries of each of the named executive officers (other than the Chief Executive Officer) were either at or slightly below the 50th percentile range for comparable positions. Based on this information, the committee determined not to provide any additional increase for 2013. In the case of our Chief Executive Officer, however, the Towers Watson survey data indicated that his base salary was below the 25th percentile of base salaries for that role, and therefore recommended an 8.7% increase in his base salary to $500,000, which the independent members of the board of directors approved. In this regard, both the committee and the independent members of the board of directors determined that Mr. Goldfield’s base salary be moderately increased in relation to the rest of the executive team,
113
Table of Contents
as a step toward competitive parity, even though his salary would in the near term remain well below the median survey range applicable to other chief executive officers.
Variable Cash Compensation
A portion of our executive compensation is paid under our annual Executive Bonus Plan. Under this program, annual variable cash compensation is awarded based on company-wide financial goals and individual and departmental performance metrics selected by the compensation committee. The compensation committee reviews the performance of each of our named executive officers relative to his annual fiscal year target bonus plan objectives at its regularly scheduled February meeting, which is typically its first meeting following the end of our fiscal year. Based on this review, the compensation committee determines and approves the annual cash bonuses for each of our executive officers. These determinations are subject to the review of the board of directors.
Financial Goals. For the past several years, the financial metrics selected by the compensation committee have been Net Service Revenues and Adjusted EBITDA. We believe these two performance metrics are appropriate for our business because they provide a balance between growing revenue and managing our expenses, which we believe most directly influences long-term stockholder value. Both of these financial metrics are calculated after applying adjustments to the applicable GAAP financial measures. For an explanation of how we adjust these metrics, see “Selected Consolidated Financial and Other Data—Non-GAAP Financial Results.”
Each named executive officer is assigned a target cash bonus, expressed as a fixed dollar value. Actual bonuses under the Executive Bonus Plan are determined by reference to a matrix to measure the effects of overachievement or underachievement, as follows:
| • | For each 1.5% increase or decrease in actual Net Service Revenues against the goal, there is a corresponding 10% increase or decrease in the amount of the cash bonus (or 15% for our Senior Vice President of Sales). |
| • | For each 0.8% increase or 1.0% decrease in actual Adjusted EBITDA against the goal, there is a corresponding 10% increase or decrease in the amount of the cash bonus (or 15% for our Senior Vice President of Sales). |
Our compensation committee also sets a target Adjusted EBITDA as a percentage of Net Service Revenues goal. For both 2012 and 2013, no bonus is payable if we achieve less than 92.5% of the target Adjusted EBITDA as a percentage of Net Service Revenues. Further, no bonus amount is payable with achievement of less than 50% of target (40% for our Senior Vice President of Sales). The maximum bonus amount payable is 200% of target (235% for our Senior Vice President of Sales).
MBOs. In addition to financial metrics, annual variable compensation for our executives takes into account that executive’s achievement against his or her management business objectives, or MBOs. The MBOs may be objectively determinable or qualitative goals, depending on the organizational priorities for a given year, and typically focus on key departmental or operational objectives or functions. Most of the MBOs are intended to provide a set of common objectives that facilitate collaborative management and engagement, although our named executive officers may also be assigned individual goals. In all cases, the MBOs are intended to be ambitious, but attainable, and designed to produce annual performance bonus payments to reflect meaningful performance requirements. MBOs are determined in the first instance by our Chief Executive Officer for his direct reports, and then reviewed and approved by the compensation committee. In the case of the Chief Executive Officer, his MBOs are determined by the independent members of the board of directors, based on recommendations made both by the Chief Executive Officer and members of the compensation committee.
Relative Weight of Financial Goals and MBOs. While financial performance and individual and departmental achievement are considered for all executive awards, in the case of our Chief Executive Officer and Chief Financial Officer, annual bonuses are determined 75% on financial metrics, and 25% on achievement against their MBOs. For the remainder of the executive team, annual bonuses are determined 50% on financial metrics, and 50% on achievement against MBOs. This difference in allocation has been determined to be
114
Table of Contents
appropriate by our compensation committee (and in the case of the Chief Executive Officer, by the board of directors) due to the greater responsibility of the Chief Executive Officer and Chief Financial Officer for the overall direction and success of our business.
Fiscal 2012 and 2013 Target Goals. Our compensation committee established the following financial goals and MBOs for our named executive officers in 2012 and 2013:
| 2012 |
2013 | |||||
| Financial Goal |
Target |
Actual |
Target* | |||
| Net Service Revenues |
$183.5 million | $269.0 million | $348.5 million | |||
| Adjusted EBITDA |
$40.017 million | $95.4 million | $107.7 million | |||
| Adjusted EBITDA as a percentage of Net Service Revenues |
21.8% | 35.4% | 30.9% | |||
| * | Actual achievement of 2013 financial targets is expected to be determined in February 2014. |
| 2012 MBOs |
2013 MBOs* | |||
| Goal Description |
Attainment of Goal |
Goal Description | ||
| Increase year-over-year client satisfaction in 2012 as measured by Net Promoter Score, or NPS | Achieved 33 point increase in NPS measure of client satisfaction in 12-month period | Increase year-over-year client satisfaction in 2013 as measured by NPS | ||
| Build organic sales channel as determined by the final board-approved business plan | Exceeded goal of number of sales personnel deployed | Build sales leadership team, increase Total Sales Representatives by 25%, and meet other sales team objectives | ||
| Build a scalable systems platform to deliver quarterly open enrollment | Completed | Enhance platform for product delivery and process improvement | ||
| Complete a dividend recap by June 30, 2012 | Completed | Successfully integrate acquisitions | ||
| Complete acquisition(s) of PEOs resulting in increase of at least 10,000 WSEs | Acquired Accord and SOI in 2012 | Contribute to market expansion or technology enhancement through acquisitions | ||
| Identify target vertical markets and deliver specific client offerings | ||||
| * | Actual achievement of 2013 MBOs is expected to be determined in February 2014. |
Named Executive Officers’ Fiscal Year 2012 and 2013 Bonuses. Our compensation committee reviewed the performance of the company, its business units and the individual named executive officers for the 2012 fiscal year against the financial goals, and departmental and individual MBOs reported above. Based on these results, our compensation committee determined total cash bonus amounts in respect of 2012 performance and set new bonus targets for 2013 as follows:
| Named Executive Officer |
2012 Variable Compensation | 2013 Target Variable Compensation |
||||||||||||||
| Target Bonus Amount |
Actual | % of Target |
||||||||||||||
| Burton M. Goldfield |
$ | 270,000 | $ | 556,875 | 206 | % | $ | 375,000 | ||||||||
| William Porter |
$ | 160,000 | $ | 330,000 | 206 | % | $ | 188,000 | ||||||||
| Gregory L. Hammond |
$ | 130,000 | $ | 260,000 | 200 | % | $ | 150,000 | ||||||||
| John Turner |
$ | 175,000 | $ | 301,030 | (1) | 172 | % | $ | 195,000 | |||||||
| (1) | Mr. Turner joined TriNet in April 2012, and as a result, his actual bonus payments were prorated. |
The committee determined that each goal for the 2012 fiscal year was satisfied by our named executive officers as set forth in the table below. As indicated below, our compensation committee elected to pay
115
Table of Contents
discretionary cash bonuses in excess of each named executive officer’s MBO target bonus in recognition of our achievements against target goals, and particularly our financial goals, as reflected below.
| Goals |
Mr. Goldfield | Mr. Porter | Mr. Hammond | Mr. Turner | ||||||||||||||||||||||||||||||||||||||||||||
| Target Weight |
Cash Bonus Amount |
Payout as % of Target |
Target Weight |
Cash Bonus Amount |
Payout as % of Target |
Target Weight |
Cash Bonus Amount |
Payout as % of Target |
Target Weight |
Cash Bonus Amount(1) |
Payout as % of Target(1) |
|||||||||||||||||||||||||||||||||||||
| Net Service Revenues |
37.5 | % | $ | 202,500 | 200 | % | 37.5 | % | $ | 120,000 | 200 | % | 25.0 | % | $ | 65,000 | 200 | % | 25.0 | % | $ | 102,812 | 235 | % | ||||||||||||||||||||||||
| Adjusted EBITDA |
37.5 | % | $ | 202,500 | 200 | % | 37.5 | % | $ | 120,000 | 200 | % | 25.0 | % | $ | 65,000 | 200 | % | 25.0 | % | $ | 102,812 | 235 | % | ||||||||||||||||||||||||
| MBOs |
25.0 | % | $ | 151,875 | 225 | % | 25.0 | % | $ | 90,000 | 225 | % | 50.0 | % | $ | 130,000 | 200 | % | 50.0 | % | $ | 196,875 | 225 | % | ||||||||||||||||||||||||
| (1) | Represents amounts approved by our compensation committee prior to prorating for Mr. Turner’s partial year of service. |
As of the date of this prospectus, we are in the process of finalizing our 2013 year end results. We expect that our compensation committee will determine our actual achievement against 2013 goals and award bonuses for 2013 performance in February 2014.
Long-Term Equity Incentive Awards
We believe that if our executive officers own shares of our common stock with values that are significant to them, they will have an incentive to act to maximize long-term stockholder value. We also believe that equity compensation is an integral component of our efforts to attract and retain exceptional executives, senior management and employees. In recent years, we have relied on stock options granted under our 2009 Equity Incentive Plan as the principal component of our equity compensation program. We believe this approach has allowed us to attract and retain key talent in our industry and aligns our executive team’s interests with the long-term interests of our company and our stockholders.
Under our 2009 Equity Incentive Plan, we have not granted stock options to our executive officers with an exercise price less than the fair market value of our common stock on the date of grant. As a result, our stock options have value only if the fair market value of our common stock increases over time. Typically, the stock options granted to our employees, including our executive officers, vest over four years and generally expire ten years after the date of grant, allowing them to serve as an effective retention tool while also motivating these executive officers to work toward corporate objectives that provide a meaningful return to our stockholders. From time to time, our board of directors has also granted restricted stock awards and restricted stock unit awards to our Chief Executive Officer.
Historically, our grants of stock options have not been formula-based, but have been based on the recommendations of our Chief Executive Officer and the compensation committee’s own judgment. These judgments have taken into account a broad range of factors, including the executive’s level of responsibility, the competitive market for the executive’s position, the executive’s past contribution to results, and the executive’s potential for contribution to future results. The compensation committee also considers dilution, and the overall impact that employee grants will have on stockholder value.
For awards granted in 2013, our compensation committee also reviewed compensation survey data from the Advanced-HR Option Impact survey and considered each named executive officer’s total and vested equity holdings as of December 31, 2012. For each named executive officers other than Mr. Goldfield, the Advanced-HR Option Impact survey data indicated that such executives’ holdings were above the 50th percentile for comparable executives of private companies, prior to any new option grant, while Mr. Goldfield’s holdings were between the 25th and 50th percentiles. Based on this information, the committee awarded modest option grants in 2013 to each named executive officers other than Mr. Goldfield in recognition of the company’s performance in 2013, and provided Mr. Goldfield with a larger option grant to bring his ownership stake closer to the 50th percentile.
116
Table of Contents
Other Benefits and Perquisites
Our named executive officers are eligible to participate in all of the employee benefit plans offered to our U.S. employees, such as medical, dental, vision, group life, short and long-term disability, and our 401(k) plan, in each case on the same basis as other employees. We provide a 401(k) plan matching contribution up to $2,500 annually to each employee, including our NEOs, which is fully vested. We also provide vacation and other paid holidays to all employees, including our named executive officers. We do not offer a non-qualified deferred compensation plan or pension plan.
Additionally, our named executive officers are each entitled to company-paid premiums of up to $15,000 for supplemental life insurance. We also reimburse such executives for financial planning and income tax services up to a maximum of $10,000 per year. Periodically, when our executive officers attend Company-related functions, their spouses are also invited, in which case we may incur incremental travel and other event-related expenses for those spouses, the cost of which is taxable to the executive. In these cases, our compensation committee has approved a policy providing for a tax gross-up on the reimbursement of such expenses. Our compensation committee believes that these limited perquisites are important for attracting and retaining key talent, as well as fostering teamwork and cohesion among the executive team.
Post-Employment and Change in Control Compensation
The initial terms and conditions of employment for each of our named executive officers are set forth in their employment agreements. These employment agreements generally provide for severance benefits in the event of a qualifying termination, and provide for lump sum cash payment calculated based on the individual’s base salary, payment of continued health insurance premiums and life or disability insurance premiums, and partial accelerated vesting of equity awards. A qualifying termination includes termination without cause or resignation for good reason, and in each case requires that the executive sign a release of claims in favor of the company. Mr. Goldfield, Mr. Porter and Mr. Hammond are also entitled to payment of their target variable compensation at certain specified levels upon a qualifying termination. In the case of a termination following a change of control, our named executive officers are also entitled to full acceleration of equity. We consider these severance and change in control benefits critical to attracting and retaining high caliber executives and the compensation committee members believe, based on their experiences, that these benefits are comparable to benefits provided to similarly situated executives at other private companies.
For a summary of the material terms and conditions of the key employee agreements with each of our executive officers, see “—Employment Arrangements” below. For a summary of the material terms and conditions of the severance and change in control arrangements, see “—Potential Payments upon Termination or Change in Control.”
Equity Granting Policies
We encourage our named executive officers to hold an equity interest in our company, but have not set specific ownership guidelines. Prior to this offering, we did not have any program, plan or obligation that required us to grant equity compensation on specified dates and, because we have not been a public company, we have not made equity grants in connection with the release or withholding of material non-public information. Following this offering, we intend to adopt granting policies or practices which will ensure that we do not time the making of grants to coincide with the release of material non-public information.
In the absence of a public trading market for our common shares, our board of directors has historically determined the fair value of our common shares in good faith based upon consideration of a number of relevant factors including our financial condition, the likelihood of a liquidity event, the liquidation preference of our participating preferred stock, the price at which our preferred stock was sold, the enterprise values of comparable companies, our cash needs, operating losses, market conditions, material risks to our business and valuation reports obtained from independent valuation firms.
117
Table of Contents
Tax and Accounting Considerations
Deductibility of Executive Compensation. Our board of directors and compensation committee is mindful of the benefit to TriNet of full deductibility of compensation, and intends to operate our executive compensation program to be most efficient and effective for our stockholders, which may include compliance with Section 162(m) of the Code. However, we intend to reserve flexibility in compensating our executive officers in a manner that can best promote our corporate objectives, even if not all such compensation is deductible.
Taxation of “Parachute” Payments and Deferred Compensation. We did not provide any executive officer, including any named executive officer, with a “gross-up” or other reimbursement payment for any tax liability that he or she might owe as a result of the application of the golden parachute tax rules under Section 280G of the Code or as a result of the nonqualified deferred compensation tax rules under Section 409A of the Code.
Accounting Treatment. The accounting impact of our compensation programs is one of many factors that are considered in determining the size and structure of our compensation programs, so that we can ensure that our compensation programs are reasonable and in the best interests of our stockholders. Authoritative accounting guidance on stock compensation requires companies to measure the compensation expense for all share-based payment awards made to employees and directors, including stock options, based on the grant date “fair value” of these awards. This calculation is reported in the compensation tables below, even though our executive officers may never realize any value from their awards. In making compensation decisions, we do not consider the accounting cost to be equal to the potential gain that an executive officer may recognize from the compensation.
Compensation Recovery Policies
As a private company, we have not adopted, nor felt the need to adopt, a formal clawback policy. Once we become a public company, and therefore become subject to Section 304 of the Sarbanes-Oxley Act of 2002, we will operate under the requirements of that Section, under which our board may seek reimbursement from our Chief Executive Officer and Chief Financial Officer if, as a result of their misconduct, we restate our financial results due to our material noncompliance with any financial reporting requirements under the federal securities laws. In addition, we will comply with the requirements of the Dodd-Frank Wall Street Reform and Consumer Protection Act and will adopt a compensation recovery policy once final regulations on the subject have been adopted.
Compensation Risk Assessment
Following the completion of this offering, our compensation committee expects to review the potential risks associated with the structure and design of our various compensation plans, including a comprehensive review of the material compensation plans and programs for all employees. Our material plans and programs operate within our larger corporate governance and review structure that serves and supports risk mitigation.
118
Table of Contents
Summary Compensation Table
The following table sets forth information regarding the compensation awarded to or earned by our named executive officers during 2012 and 2013.
| Name and Principal Position |
Year | Salary ($) |
Bonus ($)(1) |
Option Awards ($)(2) |
Non-Equity Incentive Plan Compensation ($)(3) |
All
Other Compensation ($)(4) |
Total ($) |
|||||||||||||||||||||
| Burton M. Goldfield |
2012 | 457,308 | 84,375 | 579,600 | 472,500 | 51,199 | (5) | 1,644,982 | ||||||||||||||||||||
| President and Chief Executive Officer |
2013 | 2,623,200 | ||||||||||||||||||||||||||
| William Porter |
2012 | 335,961 | 50,000 | 362,250 | 280,000 | 9,507 | (6) | 1,037,718 | ||||||||||||||||||||
| Vice President and Chief Financial Officer |
2013 | 655,800 | ||||||||||||||||||||||||||
| Gregory L. Hammond |
2012 | 292,308 | 65,000 | 289,800 | 195,000 | 19,968 | (7) | 862,076 | ||||||||||||||||||||
| Chief Legal Officer and Executive Vice President |
2013 | 393,480 | ||||||||||||||||||||||||||
| John Turner |
2012 | 87,287 | (8) | 7,905 | 1,593,900 | (9) | 293,125 | 3,565 | (10) | 1,985,782 | ||||||||||||||||||
| Senior Vice President, Sales |
2013 | 262,320 | ||||||||||||||||||||||||||
| (1) | Amounts in this column for our named executive officers represent discretionary bonuses awarded by our compensation committee during 2012 and 2013. |
| (2) | Amounts reported in this column do not reflect the amounts actually received by our named executive officers. Instead, these amounts reflect the aggregate grant date fair value of each stock option granted to the named executive officers as computed in accordance with FASB ASC 718. Assumptions used in the calculation of these amounts are included in Note 7 to our consolidated financial statements included in this prospectus. As required by SEC rules, the amounts shown exclude the impact of estimated forfeitures related to service-based vesting conditions. Our named executive officers will only realize compensation to the extent the trading price of our common stock is greater than the exercise price of such stock options. |
| (3) | Amounts in this column represent bonuses paid under our Executive Bonus Plan for the 2012 and 2013 plan years upon achievement of Net Service Revenues and Adjusted EBITDA goals and MBOs. |
| (4) | Amounts in this column include company 401(k) plan matching contributions for each named executive officer of $2,500 in 2012 and 2013. |
| (5) | Amount includes the following payments in 2012: $7,397 in spousal travel, $10,060 in reimbursements for tax preparation and estate planning services, $12,552 in life insurance premiums and $18,689 in tax gross-up payments. |
| (6) | Amount includes the following payments in 2012: $4,481 in life insurance premiums and $2,527 in tax gross-up payments. |
| (7) | Amount includes the following payments in 2012: $200 service award, $11,495 in life insurance premiums and $5,773 in tax gross-up payments. |
| (8) | Mr. Turner joined TriNet in April 2012. |
| (9) | Mr. Turner received an option to purchase 220,000 shares of common stock (as adjusted for a 2-for-1 forward stock split in July 2013) as a new hire grant. |
| (10) | Amount includes the following payments in 2012: $416 in life insurance premiums and $352 in tax gross-up payments. |
119
Table of Contents
Outstanding Equity Awards at December 31, 2013
The following table provides information regarding outstanding option awards held by our named executive officers as of December 31, 2013. No named executive officer held any restricted stock or restricted stock unit awards as of December 31, 2013.
| Name |
Grant Date | Option Awards(1)(2) | ||||||||||||||||||
| Number of Securities Underlying Unexercised Options (#) |
Option Exercise Price ($) |
Option Expiration Date |
||||||||||||||||||
| Exercisable | Unexercisable | |||||||||||||||||||
| Burton M. Goldfield |
9/20/2010 | 1,250 | 11,250 | 1.00 | 9/20/2020 | |||||||||||||||
| 3/6/2012 | 43,334 | 1.00 | 3/6/2022 | |||||||||||||||||
| 3/13/2013 | 160,000 | 4.65 | 3/13/2023 | |||||||||||||||||
| William Porter |
8/23/2010 | 9,376 | 75,000 | 1.00 | 8/23/2020 | |||||||||||||||
| 2/9/2012 | 27,084 | 1.00 | 2/9/2022 | |||||||||||||||||
| 3/13/2013 | 40,000 | 4.65 | 3/13/2023 | |||||||||||||||||
| Gregory L. Hammond |
8/17/2010 | 628 | 5,000 | 1.00 | 8/17/2020 | |||||||||||||||
| 2/9/2012 | 21,668 | 1.00 | 2/9/2022 | |||||||||||||||||
| 3/13/2013 | 24,000 | 4.65 | 3/13/2023 | |||||||||||||||||
| John Turner |
5/17/2012 | 21,250 | 123,750 | 1.00 | 2/9/2022 | |||||||||||||||
| 3/13/2013 | 16,000 | 4.65 | 3/13/2023 | |||||||||||||||||
| (1) | Unless otherwise noted, all awards referenced in this table were granted under our 2009 Equity Incentive Plan, and are subject to a 4-year vesting schedule, with 25% vesting upon the 12-month anniversary of the date of grant, and 1/48th of the total number of shares vesting each month thereafter. The awards are also subject to accelerated vesting upon certain events, as summarized under “—Potential Payments upon Termination or Change in Control.” |
| (2) | Pursuant to provisions in our equity incentive plans, the exercise price and number of shares subject to certain of these options were adjusted in connection with special cash distributions of $2.20, $3.13 and $11.75 per share of common stock that occurred on July 15, 2011, May 15, 2012 and August 30, 2013, respectively. In addition, we effected a 2-for-1 forward stock split in July 2013. Accordingly, the share totals and exercise prices shown in the table above (and in the corresponding footnotes) reflect our named executive officers’ post-cash distribution and post-split holdings. |
120
Table of Contents
Grants of Plan-Based Awards During 2013
The following table provides information with regard to potential cash bonuses paid or payable in 2013 under our performance-based, non-equity incentive plan, and with regard to each stock option award granted to each named executive officer under our equity incentive plans during 2013.
| Name |
Grant Date |
Possible Payouts Under Non-Equity Incentive Plan Awards(1) |
All Other Option Awards: Number of Securities Underlying Options |
Exercise or Base Price of Option Awards $/sh(2) |
Grant Date Fair Value of Option Awards ($) |
|||||||||||||||||||||||
| Threshold ($) | Target ($) | Maximum ($) | ||||||||||||||||||||||||||
| Burton M. Goldfield |
140,625 | 375,000 | 656,250 | |||||||||||||||||||||||||
| 3/13/2013 | 160,000 | 4.645 | 2,623,200 | |||||||||||||||||||||||||
| William Porter |
70,500 | 188,000 | 329,000 | |||||||||||||||||||||||||
| 3/13/2013 | 40,000 | 4.645 | 655,800 | |||||||||||||||||||||||||
| Gregory L. Hammond |
37,500 | 150,000 | 225,000 | |||||||||||||||||||||||||
| 3/13/2013 | 24,000 | 4.645 | 393,480 | |||||||||||||||||||||||||
| John Turner |
39,000 | 195,000 | 326,625 | |||||||||||||||||||||||||
| 3/13/2013 | 16,000 | 4.645 | 262,320 | |||||||||||||||||||||||||
| (1) | Amounts represent the range of possible cash payouts under our Executive Bonus Plan and in connection with MBOs. The threshold amount that could have been earned by each named executive officer was 50% of the target bonus under the Executive Bonus Plan (or 40% for Mr. Turner), and the maximum amount that could have been earned was 200% of the target bonus under the Executive Bonus Plan (or 235% for Mr. Turner) and 100% of the MBO bonus. There was no separate minimum threshold for MBO bonuses. |
| (2) | Grant date fair value was calculated using $16.395 (post stock split). These exercise prices in the total reflect adjusted exercise prices after giving effect to payment of special cash distributions. See footnote (2) to the Outstanding Equity Awards at December 31, 2013 table for a more detailed explanation of adjustments to the exercise prices of certain options listed in this table. |
Option Exercises and Stock Awards Vested in 2013
The following table shows for 2013 certain information regarding option exercises and stock awards accrued on vesting during the last fiscal year with respect to the named executive officers:
| Option Awards | Stock Awards | |||||||||||||||
| Name |
Number of Shares Acquired on Exercise (#) |
Value Realized on Exercise ($)(1) |
Number of Shares Acquired on Vesting (#) |
Value Realized on Vesting ($)(2) |
||||||||||||
| Burton M. Goldfield |
634,504 | 12,190,876 | 17,956 | 305,315 | ||||||||||||
| William Porter |
126,040 | 1,673,046 | ||||||||||||||
| Gregory L. Hammond |
336,736 | 7,911,427 | ||||||||||||||
| John Turner |
75,000 | 1,672,500 | ||||||||||||||
| (1) | Represents the value realized based upon the difference between the fair market value of our common stock on the exercise date less the exercise price of such shares. |
| (2) | Represents the value based upon the fair market value of our common stock on the issuance date multiplied by the number of shares issued. |
121
Table of Contents
Employment Arrangements
Employment agreements or written offer letters are used from time to time on a case by case basis to attract and/or to retain executives. We currently maintain written employment agreements with all of our named executive officers. These arrangements provide for “at will” employment and set forth the terms and conditions of employment of each executive officer, including base salary, annual bonus opportunity, employee benefit plan participation, and equity awards. These agreements were each subject to execution of our standard proprietary information and inventions agreement.
Each of our named executive officers is entitled to certain severance and change of control benefits pursuant to their employment agreements, the terms of which are described below under the heading “—Potential Payments Upon Termination or Change in Control.” In addition, each employment agreement with our named executive officers provides that TriNet will pay up to $15,000 in annual premiums for a supplemental life insurance policy for such executive with a benefit amount of at least $500,000, and TriNet will reimburse such executive for financial planning and income tax services, up to a maximum of $10,000 per year.
Employment Agreement with Mr. Goldfield
We entered into an employment agreement with Mr. Goldfield in November 2009 setting forth the terms of Mr. Goldfield’s employment as our President and Chief Executive Officer. Mr. Goldfield’s current annual base salary is $500,000. Mr. Goldfield is eligible to receive annual performance-based bonuses determined by our compensation committee and based on the achievement of corporate and individual performance goals. For fiscal 2013, Mr. Goldfield’s target bonus was $375,000.
Employment Agreement with Mr. Porter
We entered into an employment agreement with Mr. Porter in August 2010 setting forth the terms of Mr. Porter’s employment as our Vice President and Chief Financial Officer. Mr. Porter’s current annual base salary is $340,000. Mr. Porter is eligible to receive annual performance-based bonuses determined by our compensation committee and based on the achievement of corporate and individual performance goals. For fiscal 2013, Mr. Porter’s target bonus was $188,000.
Employment Agreement with Mr. Hammond
We entered into an employment agreement with Mr. Hammond in November 2009 setting forth the terms of Mr. Hammond’s employment as our Chief Legal Officer and Executive Vice President. Mr. Hammond’s current annual base salary is $295,000. Mr. Hammond is eligible to receive annual performance-based bonuses determined by our compensation committee and based on the achievement of corporate and individual performance goals. For fiscal 2013, Mr. Hammond’s target bonus was $150,000.
Employment Agreement with Mr. Turner
We entered into an employment agreement with Mr. Turner in March 2012 setting forth the terms of Mr. Turner’s employment as our Senior Vice President, Sales. Mr. Turner’s current annual base salary is $250,000. Mr. Turner is eligible to receive annual performance-based bonuses determined by our compensation committee and based on the achievement of corporate and individual performance goals. For fiscal 2013, Mr. Turner’s target bonus was $195,000.
Potential Payments upon Termination or Change in Control
If we terminate one of our named executive officers without cause or if such executive resigns for good reason, such executive will be entitled to receive the following benefits, subject to his execution of an effective release of claims in our favor:
| • | A lump sum cash payment in an amount equal to 12 months (for Mr. Porter, Mr. Hammond and Mr. Turner) or 18 months (for Mr. Goldfield) of his then-current base salary; |
122
Table of Contents
| • | 100% of the actual performance bonus earned by Mr. Porter and Mr. Hammond, and 150% of the actual performance bonus earned by Mr. Goldfield in the year prior to such termination; |
| • | Accelerated vesting of the portion of the executive’s unvested equity awards that would have vested during the 6 months (for Mr. Turner), 12 months (for Mr. Porter and Mr. Hammond) and 18 months (for Mr. Goldfield) following his termination date, or 100% accelerated vesting of all then-unvested equity awards if the qualifying termination occurs within the six month period following a change in control of TriNet; |
| • | Company-paid COBRA premiums for the executive and his covered dependents until the earlier of (i) the end of the 6 months (for Mr. Turner), 12 months (for Mr. Porter and Mr. Hammond) and 18 months (for Mr. Goldfield) following his termination date or (ii) such time as he qualifies for health insurance benefits through another source; and |
| • | If the executive elects to convert his life insurance or disability insurance coverage into an individual policy, we will pay the premiums for the first 6 months (for Mr. Turner), 12 months (for Mr. Porter and Mr. Hammond) and 18 months (for Mr. Goldfield) following his termination date, or such earlier date as he ceases to maintain coverage. |
The amounts in the table below assumes that the named executive officer terminated employment from TriNet as of December 31, 2013 and sets forth the estimated payments that each would have received under their employment agreements described above.
| Name |
Change in Control | No Change in Control | ||||||||||||||||||||||||||||||||||||||
| Salary | Bonus | Health
Benefits(1) |
Equity Acceleration(2) |
Total | Salary | Bonus | Health
Benefits(1) |
Equity Acceleration(2) |
Total | |||||||||||||||||||||||||||||||
| Burton M. Goldfield |
750,000 | 562,500 | 24,872 | 3,594,750 | 4,932,122 | 750,000 | 562,500 | 24,872 | 1,752,599 | 3,089,970 | ||||||||||||||||||||||||||||||
| William Porter |
340,000 | 188,000 | 19,724 | 2,620,575 | 3,168,299 | 340,000 | 188,000 | 19,724 | 1,861,812 | 2,409,536 | ||||||||||||||||||||||||||||||
| Gregory L. Hammond |
295,000 | 150,000 | 22,821 | 899,026 | 1,366,847 | 295,000 | 150,000 | 22,821 | 387,000 | 854,821 | ||||||||||||||||||||||||||||||
| John Turner |
250,000 | — | 11,351 | 2,662,613 | 2,923,963 | 250,000 | — | 11,351 | 567,043 | 828,394 | ||||||||||||||||||||||||||||||
| (1) | Amount only includes estimated monthly premium for continued health benefits under our existing group health insurance plans. Does not include monthly premiums for individual conversion life insurance or disability insurance policies. |
| (2) | Based on the fair market value of our common stock as of September 9, 2013 (the date of our last valuation), which was $20.47 per share. |
Equity Incentive Plans
The principal features of our equity incentive plans are summarized below. These summaries are qualified in their entirety by reference to the actual text of the plans, which are filed as exhibits to the registration statement of which this prospectus is a part.
2000 Equity Incentive Plan
Our board of directors adopted, and our stockholders approved, our 2000 Equity Incentive Plan, or the 2000 Plan, in November 2000. The 2000 Plan was amended and restated most recently in June 2005. No grants have been made from the 2000 Plan since the adoption of our 2009 Equity Incentive Plan, and the 2000 Plan terminated pursuant to its terms in November 2010. Awards of incentive stock options, nonstatutory stock options, restricted stock awards, stock appreciation rights and restricted stock units, collectively, the stock awards, were available for grant under the 2000 Plan. However, any outstanding stock awards granted under the 2000 Plan will remain outstanding, subject to the terms of our 2000 Plan and the applicable award agreements, until such outstanding awards are exercised, or until they terminate or expire by their terms. As of September 30, 2013, options to purchase 104,484 shares of our common stock remained outstanding under the 2000 Plan.
Plan Administration
Our board of directors or a duly authorized committee of our board of directors administers our 2000 Plan and the stock awards granted under it.
123
Table of Contents
Changes to Capitalization
In the event that there is a specified type of change in our capital structure not involving the receipt of consideration by us, such as a stock split, stock dividend or other recapitalization, the 2000 Plan provides for the proportional adjustment of the number of shares reserved under the 2000 Plan, the number of shares available for incentive stock option awards under the 2000 Plan and the number of shares and exercise price or strike price, if applicable, of all outstanding stock awards.
Corporate Transactions
In the event of certain corporate transactions, as defined in the 2000 Plan, each outstanding stock award may be assumed or continued or an equivalent stock award may be substituted by a successor corporation and any reacquisition or repurchase rights held by us in respect of common stock issued pursuant to prior stock awards may be assigned to the successor corporation. If the successor corporation does not agree to assume stock awards or to substitute equivalent stock awards, all such stock awards held by current service providers will become fully vested and exercisable for a period of time prior to the corporate transaction, and any reacquisition or repurchase rights will lapse. Any awards that have not been assumed, continued, substituted, or exercised prior to the corporate transaction and that are held by persons other than current service providers will terminate at the closing of the transaction. In the event a stock award will terminate if not exercised prior to the closing of the transaction, our board of directors may provide that the holder will receive a payment equal in value to the excess, if any, of (i) the value of the property the holder would have received upon the exercise of the stock award, over (ii) any exercise price payable by such holder in connection with such exercise.
In the event of our dissolution or liquidation, all outstanding stock awards under the 2000 Plan will terminate immediately prior to such event.
Transferability
A participant may not transfer stock awards under our 2000 Plan other than by will, the laws of descent and distribution, or as otherwise provided under our 2000 Plan.
2009 Equity Incentive Plan
Our board of directors adopted our 2009 Equity Incentive Plan, or the 2009 Plan, in November 2009, and our stockholders approved our 2009 Plan in March 2010. The 2009 Plan was amended and restated most recently in 2014. Our 2009 Plan provides for the grant of incentive stock options, or ISOs, within the meaning of Section 422 of the Code, to our employees, and for the grant of nonstatutory stock options, or NSOs, stock appreciation rights, restricted stock awards, restricted stock unit awards, performance stock awards, performance cash awards, and other forms of equity compensation, collectively, the stock awards, to our employees, directors, and consultants. As of September 30, 2013, 3,238,888 shares of common stock were issuable upon the exercise of options, 3,266 shares of common stock were issuable upon the settlement of restricted stock units, and 1,039,454 shares of common stock remained available for issuance under the 2009 Plan.
Authorized Shares
The maximum number of shares of our common stock that may be issued under our 2009 Plan is 6,618,954. Additionally, the number of shares of our common stock reserved for issuance under our 2009 Plan will automatically increase on January 1 of each year for a period of up to 10 years, beginning on January 1, 2015 and ending on and including January 1, 2024, by % of the total number of shares of our capital stock outstanding on December 31 of the preceding calendar year, or a lesser number of shares determined by our board of directors. The maximum number of shares that may be issued upon the exercise of ISOs under our 2009 Plan is . Shares subject to stock awards granted under our 2009 Plan that expire or terminate without all of the shares covered by the stock award being issued or that are paid out in cash rather than in shares, do not reduce the number of shares available for issuance under our 2009 Plan. Additionally, shares issued pursuant to stock awards under our 2009
124
Table of Contents
Plan that we repurchase or that are forfeited, as well as shares used to pay the exercise price of a stock award, shares subject to stock awards that are cancelled in substitution for a new stock award or to satisfy the tax withholding obligations related to a stock award, become available for future grant under our 2009 Plan.
No participant under the 2009 Plan will be eligible to receive more than 800,000 shares in any calendar year under the 2009 Plan. Such limitation is designed to help assure that any deductions to which we would otherwise be entitled with respect to such awards will not be subject to the $1 million limitation on the income tax deductibility of compensation paid per covered executive officer imposed by Section 162(m) of the Code.
Plan Administration
Our board of directors or a duly authorized committee of our board of directors administers our 2009 Plan and the stock awards granted under it. Our board of directors may also delegate to one or more of our officers the authority to (i) designate employees (other than officers) to receive specified stock awards, and (ii) determine the number of shares subject to such stock awards; provided, however, that the board of directors must specify the total number of shares of common stock that may be subject to the stock awards granted by such officer or officers. Subject to the terms of our 2009 Plan, our board of directors has the authority to determine and amend the terms of awards, including recipients, the exercise, purchase or strike price of stock awards, if any, the number of shares subject to each stock award, the fair market value of a share of our common stock, the vesting schedule applicable to the awards, together with any vesting acceleration, and the form of consideration, if any, payable upon exercise or settlement of the award and the terms of the award agreements for use under our 2009 Plan. Our board of directors has the power to modify outstanding awards under our 2009 Plan. Our board of directors has the authority to reprice any outstanding option or stock appreciation right, cancel any outstanding stock award in exchange for new stock awards, cash or other consideration, or take any other action that is treated as a repricing under generally accepted accounting principles, with the consent of any adversely affected participant.
Performance Awards
Our 2009 Plan permits the grant of performance-based stock and cash awards. Our compensation committee may structure awards so that the stock or cash will be issued or paid only following the achievement of certain pre-established performance goals during a designated performance period. Our compensation committee may establish performance goals by selecting from one or more of a variety of performance criteria set forth in the 2009 Plan.
Changes to Capitalization
In the event that there is a specified type of change in our capital structure not involving the receipt of consideration by us, such as a stock split, stock dividend or other recapitalization, the 2009 Plan provides for the proportional adjustment of the number of shares reserved under the 2009 Plan, the number of shares available for ISO awards, the limit on the number of shares a participant may be awarded in a calendar year, and the number of shares and exercise price or strike price, if applicable, of all outstanding stock awards.
Corporate Transactions
Our 2009 Plan provides that in the event of certain specified significant corporate transactions, as defined in the 2009 Plan, except as otherwise provided in the applicable award agreement, each outstanding award will be treated as our board of directors determines. Our board of directors may (i) arrange for the assumption, continuation or substitution of a stock award by a successor corporation; (ii) arrange for the assignment of any reacquisition or repurchase rights held by us to a successor corporation; (iii) accelerate the vesting, in whole or in part, of the stock award and provide for its termination prior to the transaction; (iv) arrange for the lapse, in whole or in part, of any reacquisition or repurchase rights held by us; (v) cancel or arrange for the cancellation of the stock award prior to the transaction in exchange for a cash payment, if any, determined by our board of directors, or (vi) make a payment, in the form determined by our board of directors, equal to (A) the value of the property that the award holder would have received on the exercise of a stock awards, over (B) any exercise price
125
Table of Contents
payable by such holder in connection with such exercise. Our board of directors is not obligated to treat all stock awards or portions of stock awards, even those that are of the same type, in the same manner.
Transferability
A participant may not transfer stock awards under our 2009 Plan other than by will, the laws of descent and distribution, or as otherwise provided under our 2009 Plan.
Plan Amendment or Termination
Our board of directors has the authority to amend, suspend, or terminate our 2009 Plan, provided that such action is approved by our stockholders to the extent stockholder approval is necessary and that such action does not impair the existing rights of any participant without such participant’s written consent. Unless sooner terminated, the 2009 Plan will terminate on the day before the tenth anniversary of the date the Plan was adopted by our board of directors. No stock awards may be granted under our 2009 Plan while it is suspended or after it is terminated.
2014 Employee Stock Purchase Plan
Our board of directors adopted, and our stockholders approved, our 2014 Employee Stock Purchase Plan, or our ESPP, in 2014. Our ESPP includes both a component that is intended to qualify as an employee stock purchase plan under Section 423 of the Code and a component that is not intended to so qualify. The purposes of the non-423 component of our ESPP is to authorize the grant of purchase rights that do not meet the requirements of an employee stock purchase plan because of deviations necessary or desirable to permit participation in our ESPP by employees who are foreign nationals or employed outside of the United States, while complying with applicable foreign laws.
Authorized Shares
The maximum aggregate number of shares of our common stock that may be issued under our ESPP is shares. Additionally, the number of shares of our common stock reserved for issuance under our ESPP will increase automatically each year for a period of up to 10 years, beginning on January 1, 2015 and continuing through and including January 1, 2024, by the lesser of (i) % of the total number of shares of our common stock outstanding on December 31 of the preceding calendar year; (ii) shares of common stock; or (iii) such lesser number as determined by our board of directors. The stock purchasable under the ESPP will be shares of authorized but unissued or reacquired common stock, including shares repurchased by us in the open market. Shares subject to purchase rights granted under our ESPP that terminate without having been exercised in full will be available for grant under our ESPP.
Plan Administration
Our board of directors will administer our ESPP. Our board of directors may delegate authority to administer our ESPP to our compensation committee. The administrator may approve offerings with a duration of not more than 27 months, and may specify one or more shorter purchase periods within each offering. Each offering will have one or more purchase dates on which shares of our common stock will be purchased for the employees who are participating in the offering. The administrator, in its discretion, will determine the terms of offerings under our ESPP including determining which of our designated affiliates will be eligible to participate in the 423 component of our ESPP and which of our designated affiliates will be eligible to participate in the non-423 component of our ESPP.
Eligibility
Our employees, including executive officers, may have to satisfy one or more of the following service requirements before participating in our ESPP, as determined by the administrator: (i) customary employment for more than 20 hours per week and more than five months per calendar year, or (ii) continuous employment for a minimum
126
Table of Contents
period of time, not to exceed two years. An employee may not be granted rights to purchase stock under our ESPP if such employee (i) immediately after the grant would own stock possessing 5% or more of the total combined voting power or value of our common stock, or (ii) holds rights to purchase stock under our ESPP that would accrue at a rate that exceeds $25,000 worth of our stock for each calendar year that the rights remain outstanding.
Purchase Rights and Purchase Price
Our ESPP permits participants to purchase shares of our common stock through payroll deductions or other methods with up to % of their earnings. The purchase price of the shares will be not less than 85% of the lower of the fair market value of our common stock on the first day of an offering or on the date of purchase. No participant will be permitted to purchase more than shares during any one purchase period, unless otherwise provided under the terms of an offering as determined by our board of directors or the compensation committee.
Transferability
A participant may not transfer purchase rights under our ESPP other than by will, the laws of descent and distribution, or as otherwise provided under our ESPP.
Corporate Transactions
In the event of a specified corporate transaction, such as a merger or change in control, a successor corporation may assume, continue or substitute each outstanding purchase right. If the successor corporation does not assume, continue or substitute for the outstanding purchase rights, the offering in progress may be shortened and a new exercise date will be set, so that the participants’ purchase rights can be exercised and terminate immediately thereafter.
Plan Amendment or Termination
Our board of directors has the authority to amend, suspend or terminate our ESPP, at any time and for any reason. Any benefits, privileges, entitlements and obligations under any outstanding purchase rights granted before an amendment, suspension or termination of the ESPP will not be materially impaired except (i) with the participant’s consent, (ii) to comply with any laws, listing requirements, or regulations, or (iii) to obtain or maintain favorable tax, listing, or regulatory treatment.
401(k) Plan
We maintain a tax-qualified retirement plan that provides eligible U.S. employees with an opportunity to save for retirement on a tax advantaged basis. Eligible employees are able to defer eligible compensation subject to applicable annual Code limits. We make annual matching contributions equal to 50% of an employee’s annual contributions, up to a maximum of $2,500. Employees’ pre-tax contributions are allocated to each participant’s individual account and are then invested in selected investment alternatives according to the participants’ directions. Employees are immediately and fully vested in their contributions and the annual employer match. The 401(k) plan is intended to be qualified under Section 401(a) of the Code with the 401(k) plan’s related trust intended to be tax exempt under Section 501(a) of the Code. As a tax-qualified retirement plan, contributions to the 401(k) plan and earnings on those contributions are not taxable to the employees until distributed from the 401(k) plan.
Limitation on Liability and Indemnification Matters
Our amended and restated certificate of incorporation and restated bylaws, each to be effective upon the completion of this offering, will provide that we will indemnify our directors and officers, and may indemnify our employees and other agents, to the fullest extent permitted by the Delaware General Corporation Law. However, Delaware law prohibits our amended and restated certificate of incorporation from limiting the liability of our directors for the following:
| • | any breach of the director’s duty of loyalty to us or to our stockholders; |
| • | acts or omissions not in good faith or that involve intentional misconduct or a knowing violation of law; |
127
Table of Contents
| • | unlawful payment of dividends or unlawful stock repurchases or redemptions; and |
| • | any transaction from which the director derived an improper personal benefit. |
If Delaware law is amended to authorize corporate action further eliminating or limiting the personal liability of a director, then the liability of our directors will be eliminated or limited to the fullest extent permitted by Delaware law, as so amended. Our amended and restated certificate of incorporation does not eliminate a director’s duty of care and, in appropriate circumstances, equitable remedies, such as injunctive or other forms of non-monetary relief, remain available under Delaware law. This provision also does not affect a director’s responsibilities under any other laws, such as the federal securities laws or other state or federal laws. Under our amended and restated bylaws, we will also be empowered to enter into indemnification agreements with our directors, officers, employees and other agents and to purchase insurance on behalf of any person whom we are required or permitted to indemnify.
In addition to the indemnification required in our amended and restated certificate of incorporation and amended and restated bylaws, we intend to enter into indemnification agreements with each of our current directors and officers. These agreements provide for the indemnification of such persons for all reasonable expenses and liabilities incurred in connection with any action or proceeding brought against them by reason of the fact that they are or were serving in such capacity. We believe that these bylaw provisions and indemnification agreements are necessary to attract and retain qualified persons as directors and officers. Furthermore, we have obtained director and officer liability insurance to cover liabilities our directors and officers may incur in connection with their services to us and expect to increase the level upon completion of this offering.
The limitation of liability and indemnification provisions in our amended and restated certificate of incorporation and amended and restated bylaws may discourage stockholders from bringing a lawsuit against directors for breach of their fiduciary duties. They may also reduce the likelihood of derivative litigation against directors and officers, even though an action, if successful, might benefit us and our stockholders. A stockholder’s investment may be harmed to the extent we pay the costs of settlement and damage awards against directors and officers pursuant to these indemnification provisions. Insofar as indemnification for liabilities arising under the Securities Act may be permitted to our directors, officers and controlling persons pursuant to the foregoing provisions, or otherwise, we have been advised that, in the opinion of the SEC, such indemnification is against public policy as expressed in the Securities Act, and is, therefore, unenforceable. There is no pending litigation or proceeding naming any of our directors or officers as to which indemnification is being sought, nor are we aware of any pending or threatened litigation that may result in claims for indemnification by any director or officer.
128
Table of Contents
CERTAIN RELATIONSHIPS AND RELATED PERSON TRANSACTIONS
Other than compensation arrangements for our directors and executive officers, in this section we describe transactions since January 1, 2011 to which we were a party or will be a party, in which:
| • | the amounts involved exceeded or will exceed $120,000; and |
| • | any of our directors, executive officers or holders of more than 5% of our capital stock, or any member of the immediate family of, or person sharing the household with, the foregoing persons, had or will have a direct or indirect material interest. |
We believe the terms of the transactions described below were comparable to terms we could have obtained in arm’s length dealings with unrelated third parties.
Tender Offer
In November 2012, we made a tender offer to purchase up to 1,100,000 shares of our outstanding common stock for $8.62 per share in cash, which we refer to as the November 2012 tender offer. In order to participate in the November 2012 tender offer, stockholders must have held shares of our common stock as of November 30, 2012 and must have held such shares for at least six months as of such date. We completed the November 2012 tender offer in December 2012, purchasing 304,270 shares of common stock for an aggregate purchase price of $2.6 million. No directors sold shares in the November 2012 tender offer. One executive officer, Mr. Hammond, sold 4,000 shares in the November 2012 tender offer.
Also, in March 2013, we made a tender offer to purchase up to 900,000 shares of our outstanding common stock for $16.40 per share in cash, which refer to as the March 2013 tender offer. In order to participate in the March 2013 tender offer, stockholders must have held shares of our common stock as of March 29, 2013 and must have held such shares for at least six months as such date. We completed the March 2013 tender offer in May 2013, purchasing 203,864 shares of common stock for an aggregate purchase price of $3.3 million. No directors or executive officers sold shares in the March 2013 tender offer.
Other Transactions
In connection with our initial public offering, we intend to enter into indemnification agreements with our directors and officers as described in “Executive Compensation—Limitation on Liability and Indemnification Matters.”
See “Executive Compensation—Outstanding Equity Awards at December 31, 2013” and “Executive Compensation—Employment Arrangements” for additional information regarding our compensation of and employment agreements with our named executive officers. See “Management—Non-Employee Director Compensation” for additional information regarding our compensation of our non-employee directors.
Policies and Procedures for Transactions with Related Persons
We intend to adopt a policy that our executive officers, directors, nominees for election as a director, beneficial owners of more than 5% of any class of our common stock and any members of the immediate family of any of the foregoing persons are not permitted to enter into a related person transaction with us without the prior consent of our audit committee. Any request for us to enter into a transaction with an executive officer, director, nominee for election as a director, beneficial owner of more than 5% of any class of our common stock or any member of the immediate family of any of the foregoing persons, in which the amount involved exceeds $100,000 and such person would have a direct or indirect interest, must first be presented to our audit committee for review, consideration and approval. In approving or rejecting any such proposal, our audit committee is to consider the material facts of the transaction, including, but not limited to, whether the transaction is on terms no less favorable than terms generally available to an unaffiliated third party under the same or similar circumstances and the extent of the related person’s interest in the transaction. All of the transactions described above were entered into after presentation, consideration and approval by our board of directors.
129
Table of Contents
PRINCIPAL AND SELLING STOCKHOLDERS
The following table sets forth, as of September 30, 2013, information regarding beneficial ownership of our capital stock by:
| • | each person, or group of affiliated persons, known by us to beneficially own more than 5% of our common stock; |
| • | each of our named executive officers; |
| • | each of our directors; |
| • | all of our current executive officers and directors as a group; and |
| • | each of the selling stockholders. |
Beneficial ownership is determined according to the rules of the SEC and generally means that a person has beneficial ownership of a security if he, she or it possesses sole or shared voting or investment power of that security, including securities that person has the right to acquire, such as through exercise of an option, warrant or right, or through the conversion of another security, within 60 days. Except as indicated by the footnotes below, we believe, based on the information furnished to us, that the persons named in the table below have sole voting and investment power with respect to all shares of common stock shown that they beneficially own, subject to community property laws where applicable. The information does not necessarily indicate beneficial ownership for any other purpose, including for purposes of Sections 13(d) and 13(g) of the Securities Act. Unless otherwise indicated, based on the information supplied to us by or on behalf of the selling stockholders, no selling stockholder is a broker-dealer or an affiliate of a broker-dealer.
Our calculation of the percentage of beneficial ownership prior to this offering is based on 26,449,910 shares of our common stock (including preferred stock on an as-converted basis) outstanding as of September 30, 2013. We have based our calculation of the percentage of beneficial ownership after this offering on shares of our common stock outstanding immediately after the closing of this offering (assuming no exercise of the underwriters’ option to purchase additional shares of common stock and the sale of shares of our common stock by the selling stockholders).
Common stock subject to stock options currently exercisable or exercisable within 60 days of September 30, 2013, or issuable upon settlement of restricted stock units within 60 days of September 30, 2013, is deemed to be outstanding for computing the percentage ownership of the person holding these options or restricted stock units and the percentage ownership of any group of which the holder is a member but is not deemed outstanding for computing the percentage of any other person.
130
Table of Contents
Unless otherwise indicated, the address of each beneficial owner listed in the table below is c/o TriNet Group, Inc., 1100 San Leandro Blvd., Suite 400, San Leandro, CA 94577.
| Shares beneficially owned prior to the offering |
Number of shares being offered |
Shares beneficially owned after the offering | ||||||||||||
| Name of beneficial owner |
Number | Percentage | Number | Percentage | ||||||||||
| 5% Stockholders: |
||||||||||||||
| David C. Hodgson(1) |
19,175,648 | 72.5 | % | |||||||||||
| Funds Affiliated with General Atlantic(1) |
19,032,854 | 72.0 | % | |||||||||||
| Martin Babinec |
2,693,372 | 10.2 | % | |||||||||||
| Named Executive Officers and Directors: |
||||||||||||||
| Katherine August-deWilde |
— | — | ||||||||||||
| Martin Babinec(2) |
2,693,372 | 10.2 | % | |||||||||||
| H. Raymond Bingham |
242,788 | * | ||||||||||||
| Burton M. Goldfield(3) |
796,782 | 3.0 | % | |||||||||||
| Kenneth Goldman |
120,000 | * | ||||||||||||
| Gregory L. Hammond(4) |
213,364 | * | ||||||||||||
| David C. Hodgson(1) |
19,175,648 | 72.5 | % | |||||||||||
| Wayne B. Lowell |
120,000 | * | ||||||||||||
| William Porter(5) |
387,496 | 1.5 | % | |||||||||||
| John Turner(6) |
91,666 | * | ||||||||||||
| All executive officers and directors as a group (10 persons)(7) |
23,841,116 | 89.9 | % | |||||||||||
| Certain Other Selling Stockholders: |
||||||||||||||
| * | Represents beneficial ownership of less than 1% of the outstanding common stock. |
| (1) | Includes (i) 10,782,882 shares and 7,189,936 shares owned by GA TriNet, LLC (“GA TriNet”) upon the conversion of 5,391,441 shares of Series G Preferred Stock and 3,594,968 shares of Series H Preferred Stock, respectively, and (ii) 1,060,036 shares owned by HR Acquisitions, LLC (“HR Acquisitions”) upon the conversion of 530,018 shares of Series H Preferred Stock. The members of GA TriNet are General Atlantic Partners 79, L.P., a Delaware limited partnership (“GAP 79”), General Atlantic Partners 84, L.P., a Delaware limited partnership (“GAP 84”), GAP-W, LLC, a Delaware limited liability company (“GAP-W”), GapStar, LLC, a Delaware limited liability company (“GapStar”), GAP Coinvestments CDA, L.P., a Delaware limited partnership (“GAPCO CDA”), GAP Coinvestments III, LLC, a Delaware limited liability company (“GAPCO III”), GAP Coinvestments IV, LLC, a Delaware limited liability company (“GAPCO IV”), and GAPCO GmbH & Co. KG, a German limited partnership (“GAPCO KG”). The members of HR Acquisitions are GAP 84, GAP-W, GapStar, GAPCO CDA, GAPCO III, GAPCO IV and GAPCO KG (together with GAP 79, the “GA Funds”). General Atlantic GenPar, L.P. (“GA GenPar”) is the general partner of GAP 84 and the manager of GAP-W. General Atlantic LLC (“GA LLC”) is the general partner of GA GenPar, the general partner of GAP 79 and GAPCO CDA and the managing member of GAPCO III and GAPCO IV. GAPCO Management GmbH (“Management GmbH”) is the general partner of GAPCO KG. The Managing Directors of GA LLC (the “GA Managing Directors”) control the voting and investment decisions made by GAPCO KG and Management GmbH. The GA Managing Directors are Steven Denning (Chairman), William E. Ford (Chief Executive Officer), John Bernstein, J. Frank Brown, Gabriel Caillaux, Mark Dzialga, Cory Eaves, Martin Escobari, Patricia Hedley, Rene Kern, Jonathan Korngold, Christopher Lanning, Jeff Leng, Anton Levy, Adrianna Ma, Thomas Murphy, Sandeep Naik, Andrew Pearson, Brett Rochkind, David Rosenstein, Philip Trahanas, Robbert Vorhoff and Mr. Hodgson, who is a member of our board of directors. Certain GA Managing Directors are the members of GapStar. GA TriNet, HR Acquisitions, GAP 79, GAP 84, GAP-W, GAPCO III, GAPCO IV, GAPCO CDA, GAPCO KG, GapStar, Management GmbH, GA GenPar and GA LLC are a “group” within the meaning of Rule 13d-5 of the Exchange Act. The GA Managing Directors may be deemed to share voting and dispositive power with respect to shares and interests held by the GA Funds. The GA Funds control GA TriNet and HR Acquisitions by virtue of their ownership of all of the interests of GA TriNet and HR Acquisitions. Consequently, GA TriNet and HR Acquisitions, the GA Funds, GA LLC and GA Managing Directors may, from time to time, consult among themselves and coordinate the voting and disposition of the shares held by GA TriNet and HR Acquisitions. Mr. Hodgson disclaims beneficial ownership of all of such shares except to the extent of his pecuniary interest therein. Funds affiliated with General Atlantic have been investors in the Company since June 2005, when GA TriNet, LLC purchased approximately $59.3 million in shares of our Series G convertible preferred stock. In June 2009, GA TriNet, LLC and HR Acquisitions, LLC purchased approximately $75.0 million in shares of our Series H convertible preferred stock. The mailing address of the foregoing General Atlantic entities is c/o General Atlantic Service Company, LLC, 55 East 52nd Street, 32nd Floor, New York, NY 10055. The mailing address of GAPCO KG and Management GmbH is c/o General Atlantic GmbH, Maximilianstrasse 35b, 80539 Munich, Germany. |
131
Table of Contents
| (2) | Includes 1,943,372 shares held by The Babinec Family Trust, for which Mr. Babinec shares voting and investment power, and 750,000 shares held by The Martin Babinec 2012 GRAT 2012 DTD 01/30/2012, for which Mr. Babinec has sole voting and investment power. |
| (3) | Includes (i) 23,034 shares issuable pursuant to stock options exercisable within 60 days of September 30, 2013, (ii) 3,266 shares issuable upon settlement of restricted stock units within 60 days of September 30, 2013 and (iii) 260,000 shares held by Burton M. Goldfield and Maud Carol Goldfield, Trustees, u/a/d 11/6/00, for which Mr. Goldfield shares voting and investment power. |
| (4) | Includes 10,042 shares issuable pursuant to stock options exercisable within 60 days of September 30, 2013. |
| (5) | Includes 31,250 shares issuable pursuant to stock options exercisable within 60 days of September 30, 2013. |
| (6) | Consists of 16,666 shares issuable pursuant to stock options exercisable within 60 days of September 30, 2013. |
| (7) | Consists of (i) 23,756,858 shares held by the directors and executive officers, (ii) 80,992 shares issuable pursuant to stock options held by such persons that are exercisable within 60 days of September 30, 2013 and (iii) 3,266 shares issuable upon settlement of restricted stock units within 60 days of September 30, 2013. |
132
Table of Contents
General
The following description of our capital stock summarizes the most important terms of our capital stock as they are expected to be in effect upon the closing of this offering. The descriptions of our capital stock and certain provisions of our amended and restated certificate of incorporation and amended and restated bylaws are summaries and are qualified by reference to the amended and restated certificate of incorporation and the amended and restated bylaws that will be in effect upon the closing of this offering. Copies of these documents will be filed with the SEC as exhibits to our registration statement, of which this prospectus forms a part.
Upon the completion of this offering, our authorized capital stock will consist of 770,000,000 shares, all with a par value of $0.00005 per share, of which 750,000,000 shares are designated as common stock and 20,000,000 shares are designated as preferred stock.
As of September 30, 2013, we had outstanding 26,419,910 shares of common stock, which assumes the conversion of all outstanding shares of preferred stock into 19,032,854 shares of common stock immediately prior to the completion of this offering. Our outstanding capital stock was held by approximately 204 stockholders of record as of September 30, 2013. As of September 30, 2013, we also had outstanding options to acquire 104,484 shares of common stock held by employees, directors and consultants pursuant to our 2000 Plan having a weighted average exercise price of $1.14 per share and outstanding options to acquire 3,238,888 shares of common stock held by employees, directors and consultants pursuant to our 2009 Plan having a weighted average exercise price of $2.90 per share.
Common Stock
The holders of our common stock are entitled to one vote per share on all matters submitted to a vote of our stockholders. Subject to preferences that may be applicable to any preferred stock outstanding at the time, the holders of outstanding shares of common stock are entitled to receive ratably any dividends declared by our board of directors out of assets legally available therefor. In the event that we liquidate, dissolve or wind up, holders of our common stock are entitled to share ratably in all assets remaining after payment of liabilities and the liquidation preference of any then outstanding shares of preferred stock. Holders of common stock have no preemptive or conversion rights or other subscription rights. There are no redemption or sinking fund provisions applicable to the common stock. All outstanding shares of common stock are, and all shares of common stock to be outstanding upon completion of this offering will be, fully paid and nonassessable.
Preferred Stock
As of September 30, 2013, there were 9,516,427 shares of our preferred stock outstanding. Immediately prior to the closing of this offering, all outstanding shares of our preferred stock will convert on a two-for-one basis into 19,032,854 shares of our common stock.
Upon the closing of this offering, our board of directors may, without further action by our stockholders, fix the rights, preferences, privileges and restrictions of up to an aggregate of 20,000,000 shares of preferred stock in one or more series and authorize their issuance, subject to the approval rights of the common stock described above. These rights, preferences and privileges could include dividend rights, conversion rights, voting rights, terms of redemption, liquidation preferences, sinking fund terms and the number of shares constituting any series or the designation of such series, any or all of which may be greater than the rights of our common stock or common stock. The issuance of our preferred stock could adversely affect the voting power of holders of our common stock or common stock and the likelihood that such holders will receive dividend payments and payments upon liquidation. In addition, the issuance of preferred stock could have the effect of delaying, deferring or preventing a change of control or other corporate action. Upon the closing of this offering, no shares of preferred stock will be outstanding, and we have no present plan to issue any shares of preferred stock.
133
Table of Contents
Registration Rights
We are party to an amended and restated registration rights agreement that provides that holders of our preferred stock have certain registration rights with regard to the shares of common stock issuable upon conversion of such preferred stock, as set forth below. Our preferred stock will convert into 19,032,854 shares of common stock upon the completion of this offering. The primary holder of our preferred stock is GA TriNet LLC, which holds shares of preferred stock convertible into 17,972,818 shares of common stock. In this section, we refer to GA TriNet LLC and its affiliates and successors as the General Atlantic stockholders.
The registration of shares of our common stock pursuant to the exercise of registration rights described below would enable the holders to sell these shares without restriction under the Securities Act of 1933, or the Securities Act, when the applicable registration statement is declared effective. We will pay the registration expenses, other than the underwriting discounts and commissions, of the shares registered pursuant to the demand, piggyback and Form S-3 registrations described below. The demand, piggyback and Form S-3 registration rights described below will expire as to a given stockholder when such stockholder owns less than 1% of our outstanding common stock on an as-converted, fully-diluted basis and when all of the common stock held by such holder may be sold in a single sale under Rule 144.
Demand Registration Rights
At any time beginning six months after the closing of this offering, the General Atlantic stockholders may, on not more than three occasions, demand that we register all or a portion of their shares. In the event of such a demand, we must use our reasonable best efforts to cause such shares to be registered for sale under the Securities Act, subject to exceptions specified in the agreement. Such request for registration must cover shares with an anticipated aggregate offering price, net of the underwriting discounts and commissions, in excess of $10,000,000.
Piggyback Registration Rights
In the event that we propose to register any of our securities under the Securities Act in another offering, either for our own account or for the account of security holders other than the General Atlantic stockholders, the General Atlantic stockholders will be entitled to “piggyback” registration rights allowing them to include their shares in such registration. As a result, whenever we propose to file a registration statement under the Securities Act, including a registration statement on Form S-3 as discussed below, other than with respect to a demand registration or a registration statement on Forms S-4 or S-8, the General Atlantic stockholders are entitled to notice of the registration and have the right, subject to limitations that the underwriters may impose on the number of shares included in the registration, to include their shares in the registration.
Form S-3 Registration Rights
At any time beginning after we are eligible to use Form S-3 under the Securities Act, the General Atlantic stockholders may demand that we register all or a portion of their shares on Form S-3. In the event of such a demand, we must use our reasonable best efforts to cause such shares to be registered for sale under the Securities Act, subject to exceptions specified in the agreement. Such request for registration must cover shares with an anticipated aggregate offering price, net of the underwriting discounts and commissions, equal to or in excess of $5,000,000.
Anti-Takeover Provisions
Amended and Restated Certificate of Incorporation and Amended and Restated Bylaws to be in Effect upon the Closing of this Offering
Because our stockholders do not have cumulative voting rights, our stockholders holding a majority of the outstanding shares of common stock outstanding will be able to elect all of our directors. Our amended and restated certificate of incorporation and amended and restated bylaws to be effective upon the closing of this offering will provide that all stockholder actions must be effected at a duly called meeting of stockholders and
134
Table of Contents
not by written consent. A special meeting of stockholders may be called by holders of a majority of our common stock or by the majority of our whole board of directors, chair of our board of directors or our chief executive officer.
As described above in “Management—Board Composition,” in accordance with our amended and restated certificate of incorporation to be filed in connection with this offering, immediately after this offering, our board of directors will be divided into three classes with staggered three-year terms.
The foregoing provisions will make it more difficult for our existing stockholders to replace our board of directors as well as for another party to obtain control of us by replacing our board of directors. Because our board of directors has the power to retain and discharge our officers, these provisions could also make it more difficult for existing stockholders or another party to effect a change in management. In addition, the authorization of undesignated preferred stock makes it possible for our board of directors to issue preferred stock with voting or other rights or preferences that could impede the success of any attempt to change our control.
These provisions are intended to enhance the likelihood of continued stability in the composition of our board of directors and its policies and to discourage certain types of transactions that may involve an actual or threatened acquisition of us. These provisions are also designed to reduce our vulnerability to an unsolicited acquisition proposal and to discourage certain tactics that may be used in proxy fights. However, such provisions could have the effect of discouraging others from making tender offers for our shares and may have the effect of deterring hostile takeovers or delaying changes in our control or management. As a consequence, these provisions also may inhibit fluctuations in the market price of our stock that could result from actual or rumored takeover attempts.
Section 203 of the Delaware General Corporation Law
We are subject to Section 203 of the Delaware General Corporation Law, which prohibits a Delaware corporation from engaging in any business combination with any interested stockholder for a period of three years after the date that such stockholder became an interested stockholder, with the following exceptions:
| • | before such date, the board of directors of the corporation approved either the business combination or the transaction that resulted in the stockholder becoming an interested stockholder; |
| • | upon closing of the transaction that resulted in the stockholder becoming an interested stockholder, the interested stockholder owned at least 85% of the voting stock of the corporation outstanding at the time the transaction began, excluding for purposes of determining the voting stock outstanding (but not the outstanding voting stock owned by the interested stockholder) those shares owned by (i) persons who are directors and also officers and (ii) employee stock plans in which employee participants do not have the right to determine confidentially whether shares held subject to the plan will be tendered in a tender or exchange offer; or |
| • | on or after such date, the business combination is approved by the board of directors and authorized at an annual or special meeting of the stockholders, and not by written consent, by the affirmative vote of at least 66 2/3% of the outstanding voting stock that is not owned by the interested stockholder. |
In general, Section 203 defines business combination to include the following:
| • | any merger or consolidation involving the corporation and the interested stockholder; |
| • | any sale, transfer, pledge or other disposition of 10% or more of the assets of the corporation involving the interested stockholder; |
| • | subject to certain exceptions, any transaction that results in the issuance or transfer by the corporation of any stock of the corporation to the interested stockholder; |
| • | any transaction involving the corporation that has the effect of increasing the proportionate share of the stock or any class or series of the corporation beneficially owned by the interested stockholder; or |
135
Table of Contents
| • | the receipt by the interested stockholder of the benefit of any loss, advances, guarantees, pledges or other financial benefits by or through the corporation. |
| • | In general, Section 203 defines an “interested stockholder” as an entity or person who, together with the person’s affiliates and associates, beneficially owns, or within three years prior to the time of determination of interested stockholder status did own, 15% or more of the outstanding voting stock of the corporation. |
Choice of Forum
Our amended and restated certificate of incorporation will provide that the Court of Chancery of the State of Delaware will be the exclusive forum for any derivative action or proceeding brought on our behalf; any action asserting a breach of fiduciary duty; any action asserting a claim against us arising pursuant to the Delaware General Corporation Law, our amended and restated certificate of incorporation or our bylaws; or any action asserting a claim against us that is governed by the internal affairs doctrine.
Limitations of Liability and Indemnification
See “Executive Compensation—Limitation on Liability and Indemnification Matters.”
Listing
We intend to apply to have our common stock approved for listing on under the symbol “ .”
Transfer Agent and Registrar
Upon the closing of this offering, the transfer agent and registrar for our common stock will be .
136
Table of Contents
SHARES ELIGIBLE FOR FUTURE SALE
Prior to this offering, there has been no public market for our capital stock. Future sales of our common stock in the public market, or the availability of such shares for sale in the public market, could adversely affect market prices prevailing from time to time. As described below, only a limited number of shares will be available for sale shortly after this offering due to contractual and legal restrictions on resale. Nevertheless, sales of our common stock in the public market after such restrictions lapse, or the perception that those sales may occur, could adversely affect the prevailing market price at such time and our ability to raise equity capital in the future.
Based on the number of shares outstanding as of September 30, 2013, upon the closing of this offering, shares of common stock will be outstanding, assuming no exercise of the underwriters’ option to purchase additional shares of common stock, no exercise of outstanding options and no issuance of shares upon settlement of restricted stock units. Of the outstanding shares, all of the shares sold in this offering will be freely tradable, except that any shares held by our affiliates, as that term is defined in Rule 144 under the Securities Act, may only be sold in compliance with the limitations described below.
The remaining shares of our common stock outstanding after this offering are restricted securities as such term is defined in Rule 144 under the Securities Act and are subject to lock-up agreements with us as described below. Following the expiration of the lock-up period, restricted securities may be sold in the public market only if registered or if they qualify for an exemption from registration under Rule 144 or 701 promulgated under the Securities Act, described in greater detail below.
Rule 144
In general, a person who has beneficially owned restricted shares of our common stock for at least six months would be entitled to sell their securities provided that (i) such person is not deemed to have been one of our affiliates at the time of, or at any time during the 90 days preceding, a sale and (ii) we are subject to the Exchange Act periodic reporting requirements for at least 90 days before the sale. Persons who have beneficially owned restricted shares of our common stock for at least six months but who are our affiliates at the time of, or any time during the 90 days preceding, a sale, would be subject to additional restrictions, by which such person would be entitled to sell within any three-month period only a number of securities that does not exceed the greater of either of the following:
| • | 1% of the number of shares of our common stock outstanding after this offering, which will equal shares assuming no exercise of the underwriters’ option to purchase additional shares of common stock; or |
| • | the average weekly trading volume of our common stock on the during the four calendar weeks preceding the filing of a notice on Form 144 with respect to the sale; |
| • | provided, in each case, that we are subject to the Exchange Act periodic reporting requirements for at least 90 days before the sale. Such sales both by affiliates and by non-affiliates must also comply with the manner of sale, current public information and notice provisions of Rule 144. |
Rule 701
Rule 701 under the Securities Act, as in effect on the date of this prospectus, permits re-sales of shares in reliance upon Rule 144 but without compliance with certain restrictions of Rule 144, including the holding period requirement. Most of our employees, executive officers, directors or consultants who purchased shares under a written compensatory plan or contract may be entitled to rely on the resale provisions of Rule 701, but all holders of Rule 701 shares are required to wait until 90 days after the date of this prospectus before selling their shares. However, substantially all Rule 701 shares are subject to lock-up agreements as described below and under “Underwriting” and will become eligible for sale at the expiration of those agreements.
Lock-Up Agreements
We, our directors and executive officers, and substantially all of our stockholders and option holders have agreed with the underwriters that for a period of 180 days following the date of this prospectus, subject to certain
137
Table of Contents
exceptions, we and they will not, directly or indirectly, offer, sell, contract to sell, pledge, grant any option to purchase, make any short sale, or otherwise dispose of or hedge any of our shares of common stock, any options or warrants to purchase shares of our common stock, or any securities convertible into, or exchangeable for or that represent the right to receive shares of our common stock. J.P. Morgan Securities LLC and Morgan Stanley & Co. LLC may, in their sole discretion, at any time, release all or any portion of the shares from the restrictions in such agreement.
Employees can only sell vested shares. Employees who do not hold vested shares, including shares subject to options, upon expiration of these selling restrictions will not be able to sell shares until they vest.
See “Underwriting” for a more complete description of the lock-up agreements with the underwriters.
Registration Rights
On the date beginning 180 days after the date of this prospectus, the holders of approximately 19,032,854 shares of our common stock, or their transferees, will be entitled to certain rights with respect to the registration of those shares under the Securities Act. For a description of these registration rights, see “Description of Capital Stock—Registration Rights.” If these shares are registered, they will be freely tradable without restriction under the Securities Act.
Equity Incentive Plans
As soon as practicable after the completion of this offering, we intend to file a registration statement on Form S-8 under the Securities Act to register shares of our common stock subject to outstanding options, issued or reserved for issuance under our equity compensation plans and agreements. This registration statement will become effective immediately upon filing, and shares covered by this registration statement will thereupon be eligible for sale in the public markets, subject to vesting restrictions, the lock-up agreements described above and Rule 144 limitations applicable to affiliates. For a more complete discussion of our equity compensation plans, see “Executive Compensation—Employee Benefit Plans.”
138
Table of Contents
MATERIAL UNITED STATES FEDERAL INCOME TAX CONSEQUENCES TO
NON-U.S. HOLDERS OF OUR COMMON STOCK
The following summary describes the material U.S. federal income tax consequences of the acquisition, ownership and disposition of our common stock acquired in this offering by Non-U.S. Holders (as defined below). This discussion does not address all aspects of U.S. federal income taxes and does not deal with state, local or non-U.S. tax consequences that may be relevant to Non-U.S. Holders in light of their particular circumstances, nor does it address U.S. federal tax consequences other than income taxes. Special rules different from those described below may apply to certain Non-U.S. Holders that are subject to special treatment under the Code such as financial institutions, insurance companies, tax-exempt organizations, broker-dealers and traders in securities, U.S. expatriates, “controlled foreign corporations,” “passive foreign investment companies,” corporations that accumulate earnings to avoid U.S. federal income tax, persons that hold our common stock as part of a “straddle,” “hedge,” “conversion transaction,” “synthetic security” or integrated investment or other risk reduction strategy, partnerships and other pass-through entities, and investors in such pass-through entities or entities that are treated as disregarded entities for U.S. federal income tax purposes (regardless of their places of organization or formation). Such Non-U.S. Holders are urged to consult their own tax advisors to determine the U.S. federal, state, local and other tax consequences that may be relevant to them. Furthermore, the discussion below is based upon the provisions of the Code, and Treasury regulations, rulings and judicial decisions thereunder as of the date hereof, and such authorities may be repealed, revoked or modified, perhaps retroactively, so as to result in U.S. federal income tax consequences different from those discussed below. We have not requested a ruling from the IRS with respect to the statements made and the conclusions reached in the following summary, and there can be no assurance that the IRS will agree with such statements and conclusions. This discussion assumes that the Non-U.S. Holder holds our common stock as a “capital asset” within the meaning of Section 1221 of the Code (generally, property held for investment).
The following discussion is for general information only and is not tax advice. Persons considering the purchase of our common stock pursuant to this offering should consult their own tax advisors concerning the U.S. federal income tax consequences of acquiring, owning and disposing of our common stock in light of their particular situations as well as any consequences arising under the laws of any other taxing jurisdiction, including any state, local or non-U.S. tax consequences or any U.S. federal non-income tax consequences.
For the purposes of this discussion, a “Non-U.S. Holder” is, for U.S. federal income tax purposes, a beneficial owner of common stock that is not a U.S. Holder. A “U.S. Holder” means a beneficial owner of our common stock that is for U.S. federal income tax purposes (a) an individual who is a citizen or resident of the United States, (b) a corporation or other entity treated as a corporation created or organized in or under the laws of the United States, any state thereof or the District of Columbia, (c) an estate the income of which is subject to U.S. federal income taxation regardless of its source or (d) a trust if it (1) is subject to the primary supervision of a court within the United States and one or more U.S. persons have the authority to control all substantial decisions of the trust or (2) has a valid election in effect under applicable U.S. Treasury regulations to be treated as a U.S. person. Also, partnerships, or other entities that are treated as partnerships for U.S. federal income tax purposes (regardless of their place of organization or formation) and entities that are treated as disregarded entities for U.S. federal income tax purposes (regardless of their place of organization or formation) are not addressed by this discussion and are, therefore, not considered to be Non-U.S. Holders for the purposes of this discussion.
Distributions
Subject to the discussion below, distributions, if any, made on our common stock to a Non-U.S. Holder of our common stock to the extent made out of our current or accumulated earnings and profits (as determined under U.S. federal income tax principles) generally will constitute dividends for U.S. tax purposes and will be subject to withholding tax at a 30% rate or such lower rate as may be specified by an applicable income tax treaty. To obtain a reduced rate of withholding under a treaty, a Non-U.S. Holder generally will be required to provide us with a properly executed IRS Form W-8BEN, or other appropriate form, certifying the Non-U.S. Holder’s entitlement to benefits under that treaty. In the case of a Non-U.S. Holder that is an entity, Treasury
139
Table of Contents
Regulations and the relevant tax treaty provide rules to determine whether, for purposes of determining the applicability of a tax treaty, dividends will be treated as paid to the entity or to those holding an interest in that entity. If a Non-U.S. Holder holds stock through a financial institution or other agent acting on the holder’s behalf, the holder will be required to provide appropriate documentation to such agent. The holder’s agent will then be required to provide certification to us or our paying agent, either directly or through other intermediaries. If you are eligible for a reduced rate of U.S. federal withholding tax under an income tax treaty, you should consult with your own tax advisor to determine if you are able to obtain a refund or credit of any excess amounts withheld by timely filing an appropriate claim for a refund with the IRS.
We generally are not required to withhold tax on dividends paid to a Non-U.S. Holder that are effectively connected with the Non-U.S. Holder’s conduct of a trade or business within the United States (and, if required by an applicable income tax treaty, are attributable to a permanent establishment that such holder maintains in the United States) if a properly executed IRS Form W-8ECI, stating that the dividends are so connected, is furnished to us (or, if stock is held through a financial institution or other agent, to such agent). In general, such effectively connected dividends will be subject to U.S. federal income tax, on a net income basis at the regular graduated rates, unless a specific treaty exemption applies. A corporate Non-U.S. Holder receiving effectively connected dividends may also be subject to an additional “branch profits tax,” which is imposed, under certain circumstances, at a rate of 30% (or such lower rate as may be specified by an applicable treaty) on the corporate Non-U.S. Holder’s effectively connected earnings and profits, subject to certain adjustments.
To the extent distributions on our common stock, if any, exceed our current and accumulated earnings and profits, they will first reduce your adjusted basis in our common stock as a non-taxable return of capital, but not below zero, and then any excess will be treated as gain and taxed in the same manner as gain realized from a sale or other disposition of common stock as described in the next section.
Gain on Disposition of Our Common Stock
Subject to the discussion below regarding backup withholding and foreign accounts, a Non-U.S. Holder generally will not be subject to U.S. federal income tax with respect to gain realized on a sale or other disposition of our common stock unless (a) the gain is effectively connected with a trade or business of such holder in the United States (and, if required by an applicable income tax treaty, is attributable to a permanent establishment that such holder maintains in the United States), (b) the Non-U.S. Holder is a nonresident alien individual and is present in the United States for 183 or more days in the taxable year of the disposition and certain other conditions are met, or (c) we are or have been a “United States real property holding corporation” within the meaning of Code Section 897(c)(2) at any time within the shorter of the five-year period preceding such disposition or such holder’s holding period.
If you are a Non-U.S. Holder described in (a) above, you will be required to pay tax on the net gain derived from the sale at regular graduated U.S. federal income tax rates, unless a specific treaty exemption applies, and corporate Non-U.S. Holders described in (a) above may be subject to the additional branch profits tax at a 30% rate or such lower rate as may be specified by an applicable income tax treaty. If you are an individual Non-U.S. Holder described in (b) above, you will be required to pay a flat 30% tax on the gain derived from the sale, which gain may be offset by U.S. source capital losses (even though you are not considered a resident of the United States). With respect to (c) above, in general, we would be a U.S. real property holding corporation if interests in U.S. real estate comprised (by fair market value) at least half of our assets. We believe that we are not, and do not anticipate becoming, a U.S. real property holding corporation, however, there can be no assurance that we will not become a U.S. real property holding corporation in the future. Even if we are treated as a U.S. real property holding corporation, gain realized by a Non-U.S. Holder on a disposition of our common stock will not be subject to U.S. federal income tax so long as (1) the Non-U.S. Holder owned, directly, indirectly and constructively, no more than five percent of our common stock at all times within the shorter of (i) the five-year period preceding the disposition or (ii) the holder’s holding period and (2) our common stock is regularly traded on an established securities market. There can be no assurance that our common stock will qualify as regularly traded on an established securities market.
140
Table of Contents
Information Reporting Requirements and Backup Withholding
Generally, we or certain financial middlemen must report information to the IRS with respect to any dividends we pay on our common stock including the amount of any such dividends, the name and address of the recipient, and the amount, if any, of tax withheld. A similar report is sent to the holder to whom any such dividends are paid. Pursuant to tax treaties or certain other agreements, the IRS may make its reports available to tax authorities in the recipient’s country of residence.
Dividends paid by us (or our paying agents) to a Non-U.S. Holder may also be subject to U.S. backup withholding. U.S. backup withholding generally will not apply to a Non-U.S. Holder who provides a properly executed IRS Form W-8BEN or otherwise establishes an exemption.
Under current U.S. federal income tax law, U.S. information reporting and backup withholding requirements generally will apply to the proceeds of a disposition of our common stock effected by or through a U.S. office of any broker, U.S. or non-U.S., except that information reporting and such requirements may be avoided if the holder provides a properly executed IRS Form W-8BEN or otherwise meets documentary evidence requirements for establishing Non-U.S. Holder status or otherwise establishes an exemption. Generally, U.S. information reporting and backup withholding requirements will not apply to a payment of disposition proceeds to a Non-U.S. Holder where the transaction is effected outside the United States through a non-U.S. office of a non-U.S. broker. For information reporting purposes, certain non-U.S. brokers with substantial U.S. ownership or operations will generally be treated in a manner similar to U.S. brokers.
If backup withholding is applied to you, you should consult with your own tax advisor to determine if you are able to obtain a tax benefit, refund or credit with respect to such backup withholding.
Foreign Accounts
A U.S. federal withholding tax of 30% may apply on dividends and the gross proceeds of a disposition of our common stock paid to a foreign financial institution (as specifically defined by applicable rules ) unless such institution enters into an agreement with the U.S. government to withhold on certain payments and to collect and provide to the U.S. tax authorities substantial information regarding U.S. account holders of such institution (which includes certain equity holders of such institution, as well as certain account holders that are foreign entities with U.S. owners). This U.S. federal withholding tax of 30% will also apply on dividends and the gross proceeds of a disposition of our common stock paid to a non-financial foreign entity unless such entity provides the withholding agent with either a certification that it does not have any substantial direct or indirect U.S. owners or provides information regarding direct and indirect U.S. owners of the entity. The withholding tax described above will not apply if the foreign financial institution or non-financial foreign entity otherwise qualifies for an exemption from the rules. Under certain circumstances, a Non-U.S. Holder might be eligible for refunds or credits of such taxes. Holders are encouraged to consult with their own tax advisors regarding the possible implications of the legislation on their investment in our common stock. The withholding provisions described above will generally apply to payments of dividends made on or after July 1, 2014 and to payments of gross proceeds from a sale or other disposition of common stock on or after January 1, 2017.
THE PRECEDING DISCUSSION OF MATERIAL U.S. FEDERAL INCOME TAX CONSIDERATIONS IS FOR GENERAL INFORMATION ONLY. IT IS NOT TAX ADVICE. EACH PROSPECTIVE INVESTOR SHOULD CONSULT ITS OWN TAX ADVISOR REGARDING THE TAX CONSEQUENCES OF PURCHASING, HOLDING AND DISPOSING OF OUR COMMON STOCK, INCLUDING THE CONSEQUENCES OF ANY PROPOSED CHANGE IN APPLICABLE LAW, AS WELL AS TAX CONSEQUENCES ARISING UNDER ANY STATE, LOCAL, NON-U.S. OR U.S. FEDERAL NON-INCOME TAX LAWS.
141
Table of Contents
We and the selling stockholders are offering the shares of common stock described in this prospectus through a number of underwriters. J.P. Morgan Securities LLC, Morgan Stanley & Co. LLC and Deutsche Bank Securities Inc. are acting as joint book-running managers of the offering and as representatives of the underwriters. We and the selling stockholders will enter into an underwriting agreement with the underwriters. Subject to the terms and conditions of the underwriting agreement, we will agree to sell to the underwriters, and each underwriter will severally agree to purchase, at the public offering price less the underwriting discounts and commissions set forth on the cover page of this prospectus, the number of shares of common stock listed next to its name in the following table:
| Name |
Number of Shares | |
| J.P. Morgan Securities LLC |
||
| Morgan Stanley & Co. LLC |
||
| Deutsche Bank Securities Inc. |
||
| Jefferies LLC |
||
| Stifel, Nicolaus & Company, Incorporated |
||
| William Blair & Company, L.L.C. |
||
| Total |
The underwriters will be committed to purchase all shares offered by us and the selling stockholders if they purchase any shares. The underwriting agreement will also provide that if an underwriter defaults, the purchase commitments of non-defaulting underwriters may also be increased or the offering may be terminated.
The underwriters propose to offer the shares directly to the public at the initial public offering price set forth on the cover page of this prospectus and to certain dealers at that price less a concession not in excess of $ per share. Any such dealers may resell shares to certain other brokers or dealers at a discount of up to $ per share from the initial public offering price. After the initial public offering of the shares, the offering price and other selling terms may be changed by the underwriters. Sales of shares made outside of the United States may be made by affiliates of the underwriters. The representatives have advised us that the underwriters do not intend to confirm discretionary sales in excess of 5% of the common shares offered in this offering.
The underwriters will have an option to buy up to additional shares of common stock from to cover sales of shares by the underwriters which exceed the number of shares specified in the table above. To the extent this over-allotment option is exercised for a number of shares of common stock less than the full amount of the option, , who will provide shares to be sold pursuant to this option will provide such shares proportionally. The underwriters will have 30 days from the date of this prospectus to exercise this over-allotment option. If any shares are purchased with this over-allotment option, the underwriters will purchase shares in approximately the same proportion as shown in the table above. If any additional shares of common stock are purchased, the underwriters will offer the additional shares on the same terms as those on which the shares are being offered.
The underwriting fee is equal to the public offering price per share of common stock less the amount paid by the underwriters to us per share of common stock. The underwriting fee is $ per share. The following table shows the per share and total underwriting discounts and commissions to be paid to the underwriters assuming both no exercise and full exercise of the underwriters’ option to purchase additional shares.
| Per Share | Total | |||||||||||||||
| Without over- allotment exercise |
With full over- allotment exercise |
Without over- allotment exercise |
With full over- allotment exercise |
|||||||||||||
| Underwriting discounts and commissions paid by us |
$ | $ | $ | $ | ||||||||||||
| Underwriting discounts and commissions paid by selling stockholders |
$ | $ | $ | $ | ||||||||||||
142
Table of Contents
We estimate that the total expenses of this offering, including registration, filing and listing fees, printing fees and legal and accounting expenses, including selling stockholder expenses and expenses, but excluding the underwriting discounts and commissions, will be approximately $ million.
A prospectus in electronic format may be made available on the websites maintained by one or more underwriters, or selling group members, if any, participating in the offering. The underwriters may agree to allocate a number of shares to underwriters and selling group members for sale to their online brokerage account holders. Internet distributions will be allocated by the representatives to underwriters and selling group members that may make Internet distributions on the same basis as other allocations.
For a period of 180 days after the date of this prospectus, we will agree that we will not (i) offer, pledge, sell, contract to sell, sell any option or contract to purchase, purchase any option or contract to sell, grant any option, right or warrant to purchase, or otherwise transfer or dispose of, directly or indirectly, or file with the SEC a registration statement under the Securities Act relating to, any shares of our common stock or any securities convertible into or exercisable or exchangeable for shares of our common stock, or publicly disclose the intention to make any offer, sale, pledge, disposition or filing, or (ii) enter into any swap or other agreement that transfers, in whole or in part, any of the economic consequences of ownership of any shares of our common stock or any such other securities, whether any such transaction described in clause (i) or (ii) above is to be settled by delivery of shares of our common stock or such other securities, in cash or otherwise, without the prior written consent of J.P. Morgan Securities LLC or Morgan Stanley & Co. LLC, other than the shares of our common stock to be sold hereunder and certain other exceptions. Notwithstanding the foregoing, if (1) during the last 17 days of the 180-day restricted period, we issue an earnings release or material news or a material event relating to our company occurs; or (2) prior to the expiration of the 180-day restricted period, we announce that we will release earnings results during the 16-day period beginning on the last day of the 180-day period, the restrictions described above shall continue to apply until the expiration of the 18-day period beginning on the issuance of the earnings release or the occurrence of the material news or material event.
Our executive officers, senior management and directors and substantially all of the holders of our capital stock have entered into lock-up agreements with the underwriters prior to the commencement of this offering pursuant to which each of these persons or entities, with limited exceptions, for a period of 180 days after the date of this prospectus, may not, without the prior written consent of J.P. Morgan Securities LLC and Morgan Stanley & Co. LLC (1) offer, pledge, sell, contract to sell, sell any option or contract to purchase, purchase any option or contract to sell, grant any option, right or warrant to purchase, or otherwise transfer or dispose of, directly or indirectly, any shares of our common stock or any securities convertible into or exercisable or exchangeable for shares of our common stock (including, without limitation, common stock or such other securities that may be deemed to be beneficially owned by the such directors, executive officers and stockholders in accordance with the rules and regulations of the Securities and Exchange Commission and securities that may be issued upon exercise of a stock option or warrant), or publicly disclose the intention to make any offer, sale, pledge or disposition, or (2) enter into any swap or other agreement that transfers, in whole or in part, any of the economic consequences of ownership of our common stock or such other securities, whether any such transaction described in clause (1) or (2) above is to be settled by delivery of common stock or such other securities, in cash or otherwise, or (3) make any demand for or exercise any right with respect to the registration of any shares of our common stock or any security convertible into or exercisable or exchangeable for common stock. Notwithstanding the foregoing, if (1) during the last 17 days of the 180-day restricted period, we issue an earnings release or material news or a material event relating to our company occurs; or (2) prior to the expiration of the 180-day restricted period, we announce that we will release earnings results during the 16-day period beginning on the last day of the 180-day period, the restrictions described above will continue to apply until the expiration of the 18-day period beginning on the issuance of the earnings release or the occurrence of the material news or material event.
We and the selling stockholders will agree to indemnify the underwriters, and we will also agree to indemnify in its capacity as qualified independent underwriter and their controlling persons against certain liabilities, including liabilities under the Securities Act of 1933. We will apply to have our common stock approved for listing/quotation on the under the symbol “ .”
143
Table of Contents
In connection with this offering, the underwriters may engage in stabilizing transactions, which involves making bids for, purchasing and selling shares of common stock in the open market for the purpose of preventing or retarding a decline in the market price of the common stock while this offering is in progress. These stabilizing transactions may include making short sales of the common stock, which involves the sale by the underwriters of a greater number of shares of common stock than they are required to purchase in this offering, and purchasing shares of common stock on the open market to cover positions created by short sales. Short sales may be “covered” shorts, which are short positions in an amount not greater than the underwriters’ over-allotment option referred to above, or may be “naked” shorts, which are short positions in excess of that amount. The underwriters may close out any covered short position either by exercising their over-allotment option, in whole or in part, or by purchasing shares in the open market. In making this determination, the underwriters will consider, among other things, the price of shares available for purchase in the open market compared to the price at which the underwriters may purchase shares through the over-allotment option. A naked short position is more likely to be created if the underwriters are concerned that there may be downward pressure on the price of the common stock in the open market that could adversely affect investors who purchase in this offering. To the extent that the underwriters create a naked short position, they will purchase shares in the open market to cover the position.
The underwriters have advised us that, pursuant to Regulation M of the Securities Act, they may also engage in other activities that stabilize, maintain or otherwise affect the price of the common stock, including the imposition of penalty bids. This means that if the representatives of the underwriters purchase common stock in the open market in stabilizing transactions or to cover short sales, the representatives can require the underwriters that sold those shares as part of this offering to repay the underwriting discount received by them.
These activities may have the effect of raising or maintaining the market price of the common stock or preventing or retarding a decline in the market price of the common stock, and, as a result, the price of the common stock may be higher than the price that otherwise might exist in the open market. If the underwriters commence these activities, they may discontinue them at any time. The underwriters may carry out these transactions on the , as applicable, in the over-the-counter market or otherwise.
Prior to this offering, there has been no public market for our common stock. The initial public offering price will be determined by negotiations between us, the selling stockholders and the representatives of the underwriters. In determining the initial public offering price, we, the selling stockholders and the representatives of the underwriters expect to consider a number of factors including:
| • | the information set forth in this prospectus and otherwise available to the representatives; |
| • | our prospects and the history and prospects for the industry in which we compete; |
| • | an assessment of our management; |
| • | our prospects for future earnings; |
| • | the general condition of the securities markets at the time of this offering; |
| • | the recent market prices of, and demand for, publicly traded common stock of generally comparable companies; and |
| • | other factors deemed relevant by the underwriters and us. |
Neither we, the selling stockholders nor the underwriters can assure investors that an active trading market will develop for our common stock, or that the shares will trade in the public market at or above the initial public offering price.
The underwriters and their respective affiliates are full service financial institutions engaged in various activities, which may include securities trading, commercial and investment banking, financial advisory, investment management, investment research, principal investment, hedging, financing and brokerage activities. Certain of the underwriters and their affiliates have provided in the past to us and our affiliates and may provide
from time to time in the future certain commercial banking, (including pursuant to the debt refinancing) financial
144
Table of Contents
advisory, investment banking and other services for us and such affiliates in the ordinary course of their business, for which they have received and may continue to receive customary fees and commissions. For instance, affiliates of J.P. Morgan Securities LLC, Morgan Stanley & Co. LLC and Deutsche Bank Securities Inc. are lenders under our credit facilities. In addition, in the ordinary course of their various business activities, the underwriters and their respective affiliates may make or hold a broad array of investments and actively trade debt and equity securities (or related derivative securities) and financial instruments (including bank loans) for their own account and for the accounts of their customers, and such investment and securities activities may involve our securities and/or instruments. The underwriters and their respective affiliates may also make investment recommendations and/or publish or express independent research views in respect of such securities or instruments and may at any time hold, or recommend to clients that they acquire, long and/or short positions in such securities and instruments.
Conflicts of Interest
We expect to use more than 5% of the net proceeds from the sale of our common stock in this offering to repay indebtedness under our credit facilities owed by us to affiliates of certain of the underwriters. See “Use of Proceeds” and “Management’s Discussion and Analysis of Financial Condition and Results of Operations—Liquidity and Capital Resources—Credit Facilities” for additional information regarding our credit facilities. As a result, J.P. Morgan Securities LLC, Morgan Stanley & Co. LLC and Deutsche Bank Securities Inc. may have a conflict of interest within the meaning of Rule 5121 of the Financial Industry Regulatory Authority’s conduct rules (Rule 5121). Accordingly, the offering is being made in compliance with the requirements of Rule 5121. Rule 5121 provides generally that if at least 5% of the net proceeds from the sale of securities, not including underwriting compensation, is paid to the underwriters or their affiliates, a “qualified independent underwriter,” as defined in Rule 5121, must participate in the preparation of the registration statement of which this prospectus forms a part and perform its usual standard of due diligence with respect thereto. To comply with Rule 5121, each of J.P. Morgan Securities LLC, Morgan Stanley & Co. LLC and Deutsche Bank Securities, Inc. will not confirm any sales to any account over which it exercises discretionary authority without the specific written approval of the transaction from the account holder and only to the extent that it retains documentation of such approval in its records. Jefferies LLC is assuming the responsibilities of acting as the qualified independent underwriter in conducting due diligence. We have agreed to indemnify Jefferies LLC against certain liabilities incurred in connection with acting as “qualified independent underwriter” for this offering, including liabilities under the Securities Act.
Selling Restrictions
Other than in the United States, no action has been taken by us, the selling stockholders or the underwriters that would permit a public offering of the securities offered by this prospectus in any jurisdiction where action for that purpose is required. The securities offered by this prospectus may not be offered or sold, directly or indirectly, nor may this prospectus or any other offering material or advertisements in connection with the offer and sale of any such securities be distributed or published in any jurisdiction, except under circumstances that will result in compliance with the applicable rules and regulations of that jurisdiction. Persons into whose possession this prospectus comes are advised to inform themselves about and to observe any restrictions relating to the offering and the distribution of this prospectus. This prospectus does not constitute an offer to sell or a solicitation of an offer to buy any securities referred to by this prospectus in any jurisdiction in which such an offer or solicitation is unlawful.
145
Table of Contents
Cooley LLP, San Francisco, California, will pass upon the validity of the shares of common stock offered hereby. The underwriters are being represented by Fenwick & West LLP of Mountain View, California, in connection with the offering.
The consolidated financial statements of TriNet Group, Inc. and its subsidiaries at December 31, 2011 and 2012, and for each of the three years in the period ended December 31, 2012 appearing in this prospectus and Registration Statement have been audited by Ernst & Young LLP, an independent registered public accounting firm, as set forth in their report thereon appearing elsewhere herein, and are included in reliance upon such report given on the authority of such firm as experts in accounting and auditing.
The consolidated financial statements of SOI Holdings, Inc. and its subsidiaries for the three years in the period ended December 31, 2011 included in this prospectus have been so included in reliance on the report of PricewaterhouseCoopers LLP, independent accountants, given on the authority of said firm as experts in auditing and accounting.
The consolidated financial statements of Ambrose Employer Group, LLC and Subsidiary as of December 31, 2011 and 2012 and for each of the three years in the period ended December 31, 2012 included in this prospectus have been so included in reliance on the report of CohnReznick LLP, independent auditors, given on the authority of said firm as experts in accounting and auditing.
WHERE YOU CAN FIND MORE INFORMATION
We have filed with the SEC a registration statement on Form S-1 under the Securities Act with respect to this offering of our common stock. This prospectus, which constitutes a part of the registration statement, does not contain all of the information set forth in the registration statement, some items of which are contained in exhibits to the registration statement as permitted by the rules and regulations of the SEC. For further information with respect to us and our common stock, we refer you to the registration statement, including the exhibits and the financial statements and notes filed as a part of the registration statement. Statements contained in this prospectus concerning the contents of any contract or any other document are not necessarily complete. If a contract or document has been filed as an exhibit to the registration statement, please see the copy of the contract or document that has been filed. Each statement in this prospectus relating to a contract or document filed as an exhibit is qualified in all respects by the filed exhibit. The exhibits to the registration statement should be referenced for the complete contents of these contracts and documents. A copy of the registration statement and the exhibits filed therewith may be inspected without charge at the public reference room of the SEC, located at 100 F Street, N.E., Room 1580, Washington, D.C. 20549. You may obtain information on the operation of the public reference rooms by calling the SEC at 1-800-SEC-0330. The SEC also maintains an Internet website that contains reports, proxy statements and other information about issuers, like us, that file electronically with the SEC. The address of that website is www.sec.gov.
As a result of this offering, we will become subject to the information and reporting requirements of the Exchange Act and, in accordance with this law, will file periodic reports, proxy statements and other information with the SEC. These periodic reports, proxy statements and other information will be available for inspection and copying at the SEC’s public reference facilities and the website of the SEC referred to above. We also maintain a website at www.trinet.com. After the closing of this offering, you may access our annual reports on Form 10-K, quarterly reports on Form 10-Q, current reports on Form 8-K and amendments to those reports filed or furnished pursuant to Section 13(a) or 15(d) of the Exchange Act with the SEC free of charge at our website as soon as reasonably practicable after such material is electronically filed with, or furnished to, the SEC. The information contained in, or that can be accessed through, our website is not part of this prospectus.
146
Table of Contents
INDEX TO CONSOLIDATED FINANCIAL STATEMENTS
| Page | ||||
| Consolidated Financial Statements of TriNet Group, Inc. and Subsidiaries |
||||
| F-2 | ||||
| F-3 | ||||
| F-4 | ||||
| F-5 | ||||
| F-6 | ||||
| F-7 | ||||
| F-8 | ||||
| Consolidated Financial Statements of SOI Holdings, Inc. |
||||
| F-41 | ||||
| F-42 | ||||
| F-43 | ||||
| F-44 | ||||
| F-45 | ||||
| Consolidated Financial Statements of Ambrose Employer Group, LLC |
||||
| F-55 | ||||
| F-56 | ||||
| F-57 | ||||
| F-58 | ||||
| F-59 | ||||
| F-60 | ||||
| Unaudited Pro Forma Combined Financial Information |
||||
| F-67 | ||||
| F-69 | ||||
F-1
Table of Contents
REPORT OF INDEPENDENT REGISTERED PUBLIC ACCOUNTING FIRM
The Board of Directors and stockholders of
TriNet Group, Inc.
We have audited the accompanying consolidated balance sheets of TriNet Group, Inc. and Subsidiaries as of December 31, 2012 and 2011, and the related consolidated statements of operations, comprehensive income (loss), stockholders’ deficit and cash flows for each of the three years in the period ended December 31, 2012. Our audits also included the financial statement schedule listed at Item 16(b). These financial statements and schedule are the responsibility of the Company’s management. Our responsibility is to express an opinion on these financial statements and schedule based on our audits.
We conducted our audits in accordance with the standards of the Public Company Accounting Oversight Board (United States). Those standards require that we plan and perform the audit to obtain reasonable assurance about whether the financial statements are free of material misstatement. We were not engaged to perform an audit of the Company’s internal control over financial reporting. Our audits included consideration of internal control over financial reporting as a basis for designing audit procedures that are appropriate in the circumstances, but not for the purpose of expressing an opinion on the effectiveness of the Company’s internal control over financial reporting. Accordingly, we express no such opinion. An audit also includes examining, on a test basis, evidence supporting the amounts and disclosures in the financial statements, assessing the accounting principles used and significant estimates made by management, and evaluating the overall financial statement presentation. We believe that our audits provide a reasonable basis for our opinion.
In our opinion, the financial statements referred to above present fairly, in all material respects, the consolidated financial position of TriNet Group, Inc. and Subsidiaries at December 31, 2012 and 2011, and the consolidated results of their operations and their cash flows for each of the three years in the period ended December 31, 2012, in conformity with U.S. generally accepted accounting principles. Also, in our opinion, the related financial statement schedule, when considered in relation to the basic financial statements taken as a whole, presents fairly in all material respects the information set forth therein.
/s/ Ernst & Young LLP
San Francisco, California
November 20, 2013
F-2
Table of Contents
TriNet Group, Inc. and Subsidiaries
CONSOLIDATED BALANCE SHEETS
(In thousands, except share and per share data)
| December 31, | September
30, 2013 |
Pro forma Stockholders’ Deficit September 30, 2013 |
||||||||||||||
| 2011 | 2012 | |||||||||||||||
| (unaudited) | ||||||||||||||||
| Assets |
||||||||||||||||
| Current assets: |
||||||||||||||||
| Cash and cash equivalents |
$ | 31,620 | $ | 63,749 | $ | 112,161 | ||||||||||
| Restricted cash |
8,305 | 8,996 | 15,607 | |||||||||||||
| Prepaid income taxes |
2,071 | 8,900 | 11,117 | |||||||||||||
| Prepaid expenses |
3,752 | 4,785 | 7,781 | |||||||||||||
| Deferred loan costs and other current assets |
516 | 4,730 | 5,690 | |||||||||||||
| Worksite employee related assets |
188,936 | 410,862 | 509,101 | |||||||||||||
|
|
|
|
|
|
|
|||||||||||
| Total current assets |
235,200 | 502,022 | 661,457 | |||||||||||||
| Workers compensation receivable |
36,533 | 33,945 | 31,361 | |||||||||||||
| Restricted investments available for sale |
— | 29,929 | 37,035 | |||||||||||||
| Property and equipment, net |
17,408 | 24,360 | 23,412 | |||||||||||||
| Goodwill |
12,363 | 195,966 | 289,463 | |||||||||||||
| Other intangible assets, net |
11,890 | 91,009 | 149,463 | |||||||||||||
| Deferred income taxes |
20,050 | — | — | |||||||||||||
| Deferred loan costs and other assets |
1,925 | 10,496 | 23,406 | |||||||||||||
|
|
|
|
|
|
|
|||||||||||
| Total assets |
$ | 335,369 | $ | 887,727 | $ | 1,215,597 | ||||||||||
|
|
|
|
|
|
|
|||||||||||
| Liabilities and stockholders’ deficit |
||||||||||||||||
| Current liabilities: |
||||||||||||||||
| Accounts payable |
$ | 4,366 | $ | 5,250 | $ | 7,140 | ||||||||||
| Accrued corporate wages |
11,277 | 15,896 | 23,435 | |||||||||||||
| Deferred income taxes |
520 | 33,960 | 28,460 | |||||||||||||
| Current portion of notes payable and borrowings under capital leases |
1,423 | 9,803 | 6,714 | |||||||||||||
| Other current liabilities |
5,471 | 10,232 | 9,475 | |||||||||||||
| Worksite employee related liabilities |
185,719 | 399,501 | 500,692 | |||||||||||||
|
|
|
|
|
|
|
|||||||||||
| Total current liabilities |
208,776 | 474,642 | 575,916 | |||||||||||||
| Notes payable and borrowings under capital leases, less current portion |
260 | 291,531 | 813,896 | |||||||||||||
| Workers compensation liabilities |
27,537 | 39,327 | 42,916 | |||||||||||||
| Deferred income taxes |
— | 18,026 | 9,922 | |||||||||||||
| Other liabilities |
5,198 | 6,881 | 5,513 | |||||||||||||
|
|
|
|
|
|
|
|||||||||||
| Total liabilities |
241,771 | 830,407 | 1,448,163 | |||||||||||||
| Commitments and contingencies (Note 13) |
||||||||||||||||
| Series G convertible preferred stock, $.0001 per share stated value (aggregate liquidation preference of $59,306); 5,391,441 shares authorized, issued and outstanding at December 31, 2011 and 2012 and September 30, 2013; no shares authorized, issued and outstanding pro forma (unaudited) |
59,059 | 59,059 | 59,059 | — | ||||||||||||
| Series H convertible preferred stock, $.0001 per share stated value (aggregate liquidation preference of $60,000); 4,124,986 shares authorized, issued and outstanding at December 31, 2011 and 2012 and September 30, 2013; no shares authorized, issued and outstanding pro forma (unaudited) |
63,819 | 63,819 | 63,819 | — | ||||||||||||
| Stockholders’ deficit: |
||||||||||||||||
| Common stock, $.00005 per share stated value; 32,000,000 shares authorized; 4,199,356, 5,354,612 and 7,417,056 shares issued and outstanding at December 31, 2011 and 2012 and September 30, 2013, respectively; 51,032,854 shares authorized, 26,449,910 shares issued and outstanding pro forma (unaudited) |
35,440 | 45,488 | 71,017 | 193,895 | ||||||||||||
| Accumulated deficit |
(64,550 | ) | (110,851 | ) | (426,303 | ) | (426,303 | ) | ||||||||
| Accumulated other comprehensive loss |
(170 | ) | (195 | ) | (158 | ) | (158 | ) | ||||||||
|
|
|
|
|
|
|
|
|
|||||||||
| Total stockholders’ deficit |
(29,280 | ) | (65,558 | ) | (355,444 | ) | (232,566 | ) | ||||||||
|
|
|
|
|
|
|
|
|
|||||||||
| Total liabilities and stockholders’ deficit |
$ | 335,369 | $ | 887,727 | $ | 1,215,597 | ||||||||||
|
|
|
|
|
|
|
|||||||||||
See accompanying notes.
F-3
Table of Contents
TriNet Group, Inc. and Subsidiaries
CONSOLIDATED STATEMENTS OF OPERATIONS
(In thousands, except share and per share data)
| Year Ended December 31, | Nine Months
Ended September 30, |
|||||||||||||||||||
| 2010 | 2011 | 2012 | 2012 | 2013 | ||||||||||||||||
| (unaudited) | ||||||||||||||||||||
| Professional service revenues |
$ | 139,495 | $ | 113,279 | $ | 148,233 | $ | 94,892 | $ | 195,642 | ||||||||||
| Insurance service revenues |
766,695 | 727,111 | 870,828 | 601,967 | 959,246 | |||||||||||||||
|
|
|
|
|
|
|
|
|
|
|
|||||||||||
| Total revenues |
906,190 | 840,390 | 1,019,061 | 696,859 | 1,154,888 | |||||||||||||||
|
|
|
|
|
|
|
|
|
|
|
|||||||||||
| Costs and operating expenses: |
||||||||||||||||||||
| Insurance costs |
713,653 | 651,094 | 750,025 | 518,386 | 858,862 | |||||||||||||||
| Cost of providing services (exclusive of depreciation and amortization of intangible assets) |
72,073 | 59,388 | 63,563 | 44,944 | 74,042 | |||||||||||||||
| Sales and marketing |
46,454 | 38,087 | 59,931 | 39,377 | 79,387 | |||||||||||||||
| General and administrative |
28,366 | 31,421 | 37,879 | 24,147 | 39,821 | |||||||||||||||
| Systems development and programming costs |
15,045 | 15,646 | 16,718 | 11,893 | 15,140 | |||||||||||||||
| Amortization of intangible assets |
17,960 | 12,388 | 17,441 | 7,853 | 35,926 | |||||||||||||||
| Depreciation |
12,042 | 9,201 | 11,676 | 9,100 | 8,908 | |||||||||||||||
| Restructuring |
5,922 | 2,358 | — | — | — | |||||||||||||||
|
|
|
|
|
|
|
|
|
|
|
|||||||||||
| Total costs and operating expenses |
911,515 | 819,583 | 957,233 | 655,700 | 1,112,086 | |||||||||||||||
|
|
|
|
|
|
|
|
|
|
|
|||||||||||
| Operating income (loss) |
(5,325 | ) | 20,807 | 61,828 | 41,159 | 42,802 | ||||||||||||||
| Other income (expense): |
||||||||||||||||||||
| Interest expense |
(4,444 | ) | (751 | ) | (9,709 | ) | (2,835 | ) | (32,091 | ) | ||||||||||
| Other, net |
67 | 127 | 57 | 22 | 309 | |||||||||||||||
|
|
|
|
|
|
|
|
|
|
|
|||||||||||
| Income (loss) before provision for (benefit from) income taxes |
(9,702 | ) | 20,183 | 52,176 | 38,346 | 11,020 | ||||||||||||||
| Provision for (benefit from) income taxes |
(100 | ) | 4,646 | 20,344 | 15,386 | 3,880 | ||||||||||||||
|
|
|
|
|
|
|
|
|
|
|
|||||||||||
| Net income (loss) |
$ | (9,602 | ) | $ | 15,537 | $ | 31,832 | $ | 22,960 | $ | 7,140 | |||||||||
|
|
|
|
|
|
|
|
|
|
|
|||||||||||
| Net income (loss) per share: |
||||||||||||||||||||
| Basic |
$ | (2.58 | ) | $ | 0.68 | $ | 1.33 | $ | 0.97 | $ | 0.29 | |||||||||
|
|
|
|
|
|
|
|
|
|
|
|||||||||||
| Diluted |
$ | (2.58 | ) | $ | 0.65 | $ | 1.26 | $ | 0.92 | $ | 0.27 | |||||||||
|
|
|
|
|
|
|
|
|
|
|
|||||||||||
| Weighted average common stock outstanding: |
||||||||||||||||||||
| Basic |
3,727,195 | 3,921,341 | 4,902,692 | 4,728,686 | 5,750,789 | |||||||||||||||
|
|
|
|
|
|
|
|
|
|
|
|||||||||||
| Diluted |
3,727,195 | 5,051,990 | 6,238,046 | 6,002,628 | 7,598,197 | |||||||||||||||
|
|
|
|
|
|
|
|
|
|
|
|||||||||||
| Pro forma net income per share (unaudited): |
||||||||||||||||||||
| Basic |
$ | $ | ||||||||||||||||||
|
|
|
|
|
|||||||||||||||||
| Diluted |
$ | $ | ||||||||||||||||||
|
|
|
|
|
|||||||||||||||||
| Pro forma weighted average common stock outstanding (unaudited): |
||||||||||||||||||||
| Basic |
||||||||||||||||||||
|
|
|
|
|
|||||||||||||||||
| Diluted |
||||||||||||||||||||
|
|
|
|
|
|||||||||||||||||
See accompanying notes.
F-4
Table of Contents
TriNet Group, Inc. and Subsidiaries
CONSOLIDATED STATEMENTS OF COMPREHENSIVE INCOME (LOSS)
(In thousands)
| Year Ended December 31, | Nine Months Ended September 30, |
|||||||||||||||||||
| 2010 | 2011 | 2012 | 2012 | 2013 | ||||||||||||||||
| (unaudited) | ||||||||||||||||||||
| Net income (loss) |
$ | (9,602 | ) | $ | 15,537 | $ | 31,832 | $ | 22,960 | $ | 7,140 | |||||||||
|
|
|
|
|
|
|
|
|
|
|
|||||||||||
| Other comprehensive loss, net of tax |
||||||||||||||||||||
| Unrealized gains (losses) on investments |
— | — | 36 | 60 | (9 | ) | ||||||||||||||
| Unrealized (losses) gains on interest rate cap |
— | — | (66 | ) | (73 | ) | 66 | |||||||||||||
| Foreign currency translation adjustments |
(12 | ) | (7 | ) | 5 | 7 | (20 | ) | ||||||||||||
|
|
|
|
|
|
|
|
|
|
|
|||||||||||
| Total other comprehensive income (loss), net of tax |
(12 | ) | (7 | ) | (25 | ) | (6 | ) | 37 | |||||||||||
|
|
|
|
|
|
|
|
|
|
|
|||||||||||
| Comprehensive income (loss) |
$ | (9,614 | ) | $ | 15,530 | $ | 31,807 | $ | 22,954 | $ | 7,177 | |||||||||
|
|
|
|
|
|
|
|
|
|
|
|||||||||||
See accompanying notes.
F-5
Table of Contents
TriNet Group, Inc. and Subsidiaries
CONSOLIDATED STATEMENTS OF STOCKHOLDERS’ DEFICIT
(In thousands, except share and per share data)
| Preferred Stock– Series G |
Preferred Stock– Series H |
Common Stock | Accumulated Deficit |
Accumulated Other Comprehensive Loss |
Total Stockholders’ Equity (Deficit) |
|||||||||||||||||||||||||||||||||
| Shares | Amount | Shares | Amount | Shares | Amount | |||||||||||||||||||||||||||||||||
| Balance at December 31, 2010 |
5,391,441 | $ | 59,059 | 4,124,986 | $ | 63,819 | 3,742,882 | $ | 26,040 | $ | (22,981 | ) | $ | (163 | ) | $ | 2,896 | |||||||||||||||||||||
|
|
|
|
|
|
|
|
|
|
|
|
|
|
|
|
|
|
|
|||||||||||||||||||||
| Net income |
— | — | — | — | — | — | 15,537 | — | 15,537 | |||||||||||||||||||||||||||||
| Other comprehensive loss |
— | — | — | — | — | — | — | (7 | ) | (7 | ) | |||||||||||||||||||||||||||
| Issuance of common stock from vested restricted stock units |
— | — | — | — | 61,974 | — | — | — | — | |||||||||||||||||||||||||||||
| Issuance of common stock from exercise of stock options |
— | — | — | — | 1,133,778 | 4,774 | — | — | 4,774 | |||||||||||||||||||||||||||||
| Repurchase of common stock |
— | — | — | — | (739,278 | ) | — | (6,103 | ) | — | (6,103 | ) | ||||||||||||||||||||||||||
| Stock-based compensation expense |
— | — | — | — | — | 4,825 | — | — | 4,825 | |||||||||||||||||||||||||||||
| Excess tax benefit from equity incentive plan activity |
— | — | — | — | — | (199 | ) | — | — | (199 | ) | |||||||||||||||||||||||||||
| Special dividend |
— | — | — | — | — | — | (51,003 | ) | — | (51,003 | ) | |||||||||||||||||||||||||||
|
|
|
|
|
|
|
|
|
|
|
|
|
|
|
|
|
|
|
|||||||||||||||||||||
| Balance at December 31, 2011 |
5,391,441 | 59,059 | 4,124,986 | 63,819 | 4,199,356 | 35,440 | (64,550 | ) | (170 | ) | (29,280 | ) | ||||||||||||||||||||||||||
|
|
|
|
|
|
|
|
|
|
|
|
|
|
|
|
|
|
|
|||||||||||||||||||||
| Net income |
— | — | — | — | — | — | 31,832 | — | 31,832 | |||||||||||||||||||||||||||||
| Other comprehensive loss |
— | — | — | — | — | — | — | (25 | ) | (25 | ) | |||||||||||||||||||||||||||
| Issuance of common stock from vested restricted stock units |
— | — | — | — | 37,996 | — | — | — | — | |||||||||||||||||||||||||||||
| Issuance of common stock from exercise of stock options |
— | — | — | — | 1,429,392 | 5,391 | — | — | 5,391 | |||||||||||||||||||||||||||||
| Repurchase of common stock |
— | — | — | — | (312,132 | ) | — | (2,683 | ) | — | (2,683 | ) | ||||||||||||||||||||||||||
| Stock-based compensation expense |
— | — | — | — | — | 4,360 | — | — | 4,360 | |||||||||||||||||||||||||||||
| Excess tax benefit from equity incentive plan activity |
— | — | — | — | — | 297 | — | — | 297 | |||||||||||||||||||||||||||||
| Special dividend |
— | — | — | — | — | — | (75,450 | ) | — | (75,450 | ) | |||||||||||||||||||||||||||
|
|
|
|
|
|
|
|
|
|
|
|
|
|
|
|
|
|
|
|||||||||||||||||||||
| Balance at December 31, 2012 |
5,391,441 | 59,059 | 4,124,986 | 63,819 | 5,354,612 | 45,488 | (110,851 | ) | (195 | ) | (65,558 | ) | ||||||||||||||||||||||||||
|
|
|
|
|
|
|
|
|
|
|
|
|
|
|
|
|
|
|
|||||||||||||||||||||
| Net income (unaudited) |
— | — | — | — | — | — | 7,140 | 7,140 | ||||||||||||||||||||||||||||||
| Other comprehensive income (unaudited) |
— | — | — | — | — | — | — | 37 | 37 | |||||||||||||||||||||||||||||
| Issuance of common stock from vested restricted stock units (unaudited) |
— | — | — | — | 14,990 | — | — | — | — | |||||||||||||||||||||||||||||
| Issuance of common stock from exercise of stock options (unaudited) |
— | — | — | — | 2,645,252 | 6,888 | — | — | 6,888 | |||||||||||||||||||||||||||||
| Repurchase of common stock (unaudited) |
— | — | — | — | (597,798 | ) | — | (11,767 | ) | — | (11,767 | ) | ||||||||||||||||||||||||||
| Stock-based compensation expense (unaudited) |
— | — | — | — | — | 4,360 | — | — | 4,360 | |||||||||||||||||||||||||||||
| Excess tax benefit from equity incentive plan activity (unaudited) |
— | — | — | — | — | 14,281 | — | — | 14,281 | |||||||||||||||||||||||||||||
| Special dividend (unaudited) |
(310,825 | ) | (310,825 | ) | ||||||||||||||||||||||||||||||||||
|
|
|
|
|
|
|
|
|
|
|
|
|
|
|
|
|
|
|
|||||||||||||||||||||
| Balance at September 30, 2013 (unaudited) |
5,391,441 | $ | 59,059 | 4,124,986 | $ | 63,819 | 7,417,056 | $ | 71,017 | $ | (426,303 | ) | $ | (158 | ) | $ | (355,444 | ) | ||||||||||||||||||||
|
|
|
|
|
|
|
|
|
|
|
|
|
|
|
|
|
|
|
|||||||||||||||||||||
See accompanying notes.
F-6
Table of Contents
TriNet Group, Inc. and Subsidiaries
CONSOLIDATED STATEMENTS OF CASH FLOWS
(In thousands)
| Year Ended December 31, | Nine Months Ended September 30, |
|||||||||||||||||||
| 2010 | 2011 | 2012 | 2012 | 2013 | ||||||||||||||||
| (unaudited) | ||||||||||||||||||||
| Operating activities: |
||||||||||||||||||||
| Net income (loss) |
$ | (9,602 | ) | $ | 15,537 | $ | 31,832 | $ | 22,960 | $ | 7,140 | |||||||||
| Adjustments to reconcile net income (loss) to net cash provided by operating activities: |
||||||||||||||||||||
| Depreciation and amortization |
29,814 | 20,303 | 31,196 | 16,153 | 56,027 | |||||||||||||||
| Deferred income taxes |
(7,400 | ) | 3,215 | 7,658 | 756 | (9,534 | ) | |||||||||||||
| Stock-based compensation |
5,053 | 4,825 | 4,360 | 3,396 | 4,360 | |||||||||||||||
| Excess tax benefit from equity incentive plan activity |
(199 | ) | 199 | (297 | ) | (15 | ) | (14,281 | ) | |||||||||||
| Accretion of workers compensation and leases fair value adjustment |
(2,306 | ) | (1,660 | ) | (1,371 | ) | (873 | ) | (958 | ) | ||||||||||
| Changes in operating assets and liabilities: |
||||||||||||||||||||
| Restricted cash |
2,211 | (1,447 | ) | 6,738 | 3,577 | (6,522 | ) | |||||||||||||
| Prepaid expenses and other current assets |
(229 | ) | 694 | (1,026 | ) | (2,320 | ) | (8,049 | ) | |||||||||||
| Workers compensation receivables |
23,674 | (247 | ) | 3,776 | 2,420 | 3,624 | ||||||||||||||
| Other assets |
4,049 | 328 | 753 | 355 | 3,995 | |||||||||||||||
| Accounts payable |
(778 | ) | (506 | ) | (150 | ) | (747 | ) | 1,598 | |||||||||||
| Income tax payable/receivable |
6,039 | (4,523 | ) | (6,273 | ) | 211 | 12,314 | |||||||||||||
| Other current liabilities |
705 | 5,575 | 1,501 | 1,079 | 7,447 | |||||||||||||||
| Other liabilities |
9,096 | 5,413 | 1,564 | 1,053 | 1,968 | |||||||||||||||
| Worksite employee related assets |
11,071 | (22,013 | ) | (75,598 | ) | (26,940 | ) | (41,062 | ) | |||||||||||
| Worksite employee related liabilities |
235 | 20,879 | 75,591 | 28,532 | 44,013 | |||||||||||||||
|
|
|
|
|
|
|
|
|
|
|
|||||||||||
| Net cash provided by operating activities |
71,433 | 46,572 | 80,254 | 49,597 | 62,080 | |||||||||||||||
|
|
|
|
|
|
|
|
|
|
|
|||||||||||
| Investing activities: |
||||||||||||||||||||
| Proceeds from sale and maturity of debt securities |
— | — | 1,364 | — | 500 | |||||||||||||||
| Acquisitions of businesses, net of cash acquired |
— | — | (225,817 | ) | (27,525 | ) | (193,727 | ) | ||||||||||||
| Purchase of debt securities |
— | — | (28,497 | ) | (27,499 | ) | (7,253 | ) | ||||||||||||
| Purchase of property and equipment |
(7,137 | ) | (7,154 | ) | (9,658 | ) | (6,475 | ) | (6,314 | ) | ||||||||||
|
|
|
|
|
|
|
|
|
|
|
|||||||||||
| Net cash used in investing activities |
(7,137 | ) | (7,154 | ) | (262,608 | ) | (61,499 | ) | (206,794 | ) | ||||||||||
|
|
|
|
|
|
|
|
|
|
|
|||||||||||
| Financing activities: |
||||||||||||||||||||
| Borrowing under notes payable |
— | 723 | 405,000 | 105,000 | 970,000 | |||||||||||||||
| Proceeds from issuance of common stock on exercised options |
558 | 4,774 | 5,391 | 4,066 | 6,889 | |||||||||||||||
| Excess tax benefit from equity incentive plan activity |
199 | (199 | ) | 297 | 15 | 14,281 | ||||||||||||||
| Repayment of notes payable |
(52,667 | ) | (129 | ) | (105,681 | ) | (3,339 | ) | (450,104 | ) | ||||||||||
| Payments of special dividend |
— | (50,880 | ) | (75,353 | ) | (75,323 | ) | (310,922 | ) | |||||||||||
| Payments of debt issuance costs |
(86 | ) | (284 | ) | (14,001 | ) | (3,309 | ) | (24,611 | ) | ||||||||||
| Repayments under capital leases |
(1,978 | ) | (1,403 | ) | (825 | ) | (669 | ) | (620 | ) | ||||||||||
| Repurchase of common stock |
(2,430 | ) | (5,815 | ) | (350 | ) | (350 | ) | (11,767 | ) | ||||||||||
| Repurchase of stock options |
(87 | ) | (113 | ) | — | — | — | |||||||||||||
|
|
|
|
|
|
|
|
|
|
|
|||||||||||
| Net cash (used in) provided by financing activities |
(56,491 | ) | (53,326 | ) | 214,478 | 26,091 | 193,146 | |||||||||||||
|
|
|
|
|
|
|
|
|
|
|
|||||||||||
| Effect of exchange rate changes on cash and cash equivalents |
(12 | ) | (7 | ) | 5 | 73 | (20 | ) | ||||||||||||
|
|
|
|
|
|
|
|
|
|
|
|||||||||||
| Net increase (decrease) in cash and cash equivalents |
7,793 | (13,915 | ) | 32,129 | 14,262 | 48,412 | ||||||||||||||
| Cash and cash equivalents at beginning of year |
37,742 | 45,535 | 31,620 | 31,620 | 63,749 | |||||||||||||||
|
|
|
|
|
|
|
|
|
|
|
|||||||||||
| Cash and cash equivalents at end of year |
$ | 45,535 | $ | 31,620 | $ | 63,749 | $ | 45,882 | $ | 112,161 | ||||||||||
|
|
|
|
|
|
|
|
|
|
|
|||||||||||
| Supplemental disclosures of cash flow information: |
||||||||||||||||||||
| Cash paid for interest |
$ | 3,052 | $ | 209 | $ | 5,355 | $ | 2,125 | $ | 18,557 | ||||||||||
| Cash paid for income taxes, net of refunds |
2,263 | 7,320 | 19,595 | 14,667 | 719 | |||||||||||||||
| Supplemental schedule of non-cash investing and financing activities: |
||||||||||||||||||||
| Repurchase of common stock not paid |
$ | — | $ | 288 | $ | 2,621 | $ | — | $ | — | ||||||||||
| Receivable from purchase price reduction for a business acquisition |
— | — | 1,893 | — | — | |||||||||||||||
| Special dividend payable on unvested restricted stock units |
— | 123 | 97 | 128 | 56 | |||||||||||||||
See accompanying notes.
F-7
Table of Contents
TriNet Group, Inc. and Subsidiaries
NOTES TO CONSOLIDATED FINANCIAL STATEMENTS
(Information as of September 30, 2013 and for the nine months ended September 30, 2012 and 2013 is unaudited)
NOTE 1. DESCRIPTION OF BUSINESS AND SIGNIFICANT ACCOUNTING POLICIES
Description of Business
TriNet Group, Inc. (the Company or TriNet), a Delaware corporation incorporated in January 2000, provides a comprehensive human resources solution for small to medium-sized businesses. The Company’s solution includes payroll processing, human capital consulting, employment law compliance and employee benefits, including health insurance, retirement plans and workers compensation insurance.
The Company provides its services through co-employment relationships with its customers, under which the Company and its customers each take responsibility for certain portions of the employer-employee relationship for worksite employees, or WSEs. The Company is the employer of record for most administrative and regulatory purposes, including the following: (i) compensation through wages and salaries; (ii) employer payroll-related taxes payment; (iii) employee payroll-related taxes withholding and payment; (iv) employee benefit programs including health and life insurance, and others; and (v) workers compensation coverage.
Segment Information
As a result of acquisitions, the Company had three operating segments as of September 30, 2013. Discrete financial information is available to the Company’s Chief Operating Decision Maker for each operating segment, while the acquired companies are in the process of integration. The Company, together with newly acquired subsidiaries, provides services to small and medium-sized businesses in strategically selected industry vertical markets throughout North America. These three operating segments were aggregated into one operating and reportable segment in accordance with ASC 280 because they sell similar services through similar production processes to similar customers using similar distribution channels in similar regulatory environments, and the segments have similar economic characteristics. All of the Company’s service revenues are generated from external customers. Less than 1% of revenues are generated outside of the United States of America (U.S.). Substantially all of the Company’s long-lived assets are located in the U.S.
Basis of Presentation
The accompanying consolidated financial statements and footnotes thereto of the Company and its wholly owned subsidiaries have been prepared in accordance with U.S. generally accepted accounting principles (GAAP). All intercompany accounts and transactions have been eliminated in consolidation.
The Company’s accompanying consolidated balance sheets present the current assets and current liabilities directly related to the processing of human resources transactions as WSE-related assets and WSE-related liabilities, respectively. WSE-related assets comprise cash and investments restricted for current workers compensation claim payments, payroll funds collected, accounts receivable, unbilled service revenues, and refundable or prepaid amounts related to the Company-sponsored workers compensation and health plan programs. WSE-related liabilities comprise customer prepayments, wages and payroll taxes accrued and payable, and liabilities related to the Company-sponsored workers compensation and health plan programs resulting from workers compensation case reserves, premium amounts due to providers for enrolled employees, and workers compensation and health reserves that are expected to be disbursed within the next 12 months.
Use of Estimates
The preparation of financial statements in conformity with U.S. generally accepted accounting principals requires management to make estimates and assumptions that affect certain reported amounts and disclosures. These estimates include, but are not limited to, allowances for accounts receivable, workers compensation related
F-8
Table of Contents
TriNet Group, Inc. and Subsidiaries
NOTES TO CONSOLIDATED FINANCIAL STATEMENTS (Continued)
(Information as of September 30, 2013 and for the nine months ended September 30, 2012 and 2013 is unaudited)
assets and liabilities, health plan assets and liabilities, recoverability of goodwill and other intangible assets, income taxes, stock-based compensation and other contingent liabilities. Such estimates are based on historical experience and on various other assumptions that Company management believes to be reasonable under the circumstances. Actual results could differ from those estimates.
Restatement of Previously Issued Consolidated Financial Statements
The Company previously restated its consolidated financial statements presented herein to report insurance service revenues and insurance cost related to health and workers’ compensation insurance on a gross basis. These amounts were previously reported on a net basis as a component of service revenues. This restatement only impacted the statements of operations, and did not impact previously reported operating income (loss) or net income (loss).
Unaudited Consolidated Interim Financial Information
The consolidated balance sheet as of September 30, 2013, the consolidated statements of operations, consolidated statements of comprehensive income (loss) and the consolidated statements of cash flows for the nine months ended September 30, 2012 and 2013 and the consolidated statement of stockholders’ equity for the nine months ended September 30, 2013 are unaudited. The unaudited interim financial statements have been prepared on the same basis as the annual financial statements and, in our opinion, reflect all adjustments, consisting only of normal recurring adjustments, necessary for fair presentation. The financial data and other information disclosed in these notes to the consolidated financial statements related to the six month periods are unaudited. The results of the nine months ended September 30, 2013 are not necessarily indicative of the results to be expected for the year ending December 31, 2013.
Unaudited Pro Forma Stockholders’ Equity and Net Income Per Share Attributable to Common Stockholders
Upon the completion of the Company’s initial public offering, all outstanding shares of our preferred stock will convert into an aggregate of 19,032,854 shares of common stock. The unaudited pro forma stockholders’ equity data as of September 30, 2013 has been prepared assuming the conversion of the preferred stock outstanding into shares of common stock. Unaudited pro forma net income per share attributable to common stockholders for the year ended December 31, 2012 and the nine months ended September 30, 2013 has been computed to give effect to the conversion of preferred stock into common stock as though the conversion had occurred on the original dates of issuance. The conversion has no effect on net income per share attributable to common stockholders because the preferred stock is participating.
Revenue Recognition
Professional service revenues represent service fees charged to clients for co-employment services, including processing payroll and employment tax withholding; payment to WSEs; and labor and benefit law compliance based on either a fixed fee per WSE per month or per transaction, or a percentage of WSEs’ payroll. Professional service revenues also include fees billed for other human resource-related services, such as talent acquisitions, performance management, and time and expense reporting services in accordance with separate written service agreements. Professional service revenues are recognized in the period the services are rendered and earned under service arrangements with clients where service fees are fixed or determinable and collectability is reasonably assured.
Insurance service revenues consist of insurance-related amounts and administrative fees collected from clients and withheld from WSEs for risk-based insurance plans provided through third-party insurance carriers,
F-9
Table of Contents
TriNet Group, Inc. and Subsidiaries
NOTES TO CONSOLIDATED FINANCIAL STATEMENTS (Continued)
(Information as of September 30, 2013 and for the nine months ended September 30, 2012 and 2013 is unaudited)
primarily employee health benefit insurance and workers compensation insurance. Insurance service revenues are recognized in the period amounts are due and collectibility is reasonably assured.
The professional service revenues and insurance service revenues are each considered separate units of accounting and the associated fees and insurance premiums are billed as such for the majority of the Company’s clients. For clients billed through a bundled invoice, the selling price of significant deliverables is determined based on the best estimate of the selling price.
The Company is not the primary obligor for payroll and payroll tax payments and therefore these payments are not reflected as either revenue or expense. The gross payroll and payroll tax payments made on behalf of the clients, combined, were $8.5 billion, $7.9 billion and $10.0 billion for the years ended December 31, 2010, 2011, and 2012, respectively, and $6.7 billion and $7.7 billion for the nine months ended September 30, 2012 and 2013, respectively.
The Company records a liability relating to work performed by WSEs but unpaid at the end of each period in the period in which the WSEs performs work, along with the related receivable for the same period. The Company generally charges an upfront non-refundable set-up fee for which the performance of such services is not a discrete earnings event, and therefore the revenue is recognized on a straight-line basis over the estimated average client tenure.
Insurance Costs
Insurance premiums paid to the insurance carriers for the health and workers compensation insurance coverage and the reimbursements paid to the insurance carriers for claim payments made to the WSEs within the insurance deductible layer are included in cost and operating expense as insurance costs.
Workers Compensation Insurance Reserves
Workers compensation insurance reserves are established to provide for the estimated costs of paying claims within the deductible layer in accordance with workers compensation insurance policies. These reserves include estimates for reported losses, plus amounts for those claims incurred but not reported, and estimates of certain expenses associated with processing and settling the claims. In establishing the workers compensation insurance reserves, the Company uses an independent actuarial estimate of undiscounted future cash payments that would be made to settle the claims.
In estimating these reserves, the Company utilizes historical loss experience, exposure data, and actuarial judgment, together with a range of inputs which are primarily based upon the WSE job responsibilities, their location, the historical frequency and severity of workers compensation claims, and an estimate of future cost trends. All of these components could materially impact the reserves as reported in the consolidated financial statements. For each reporting period, changes in the actuarial assumptions resulting from changes in actual claims experience and other trends are incorporated into the workers compensation claims cost estimates. Accordingly, final claim settlements may vary from the present estimates, particularly when those payments may not occur until well into the future.
The Company regularly reviews the adequacy of workers compensation insurance reserves. Adjustments to previously established reserves are reflected in the results of operations for the period in which the adjustment is identified. Such adjustments could possibly be significant, reflecting any variety of new and adverse or favorable trends. Any unexpected increases in the severity or frequency of claims could result in material adverse effects to the operating results.
F-10
Table of Contents
TriNet Group, Inc. and Subsidiaries
NOTES TO CONSOLIDATED FINANCIAL STATEMENTS (Continued)
(Information as of September 30, 2013 and for the nine months ended September 30, 2012 and 2013 is unaudited)
The Company does not discount loss reserves accrued under these programs. Claim costs expected to be paid within one year are recorded as accrued workers compensation costs and included in short-term worksite employee related liabilities, while costs expected to be paid beyond one year are included in long-term liabilities on the consolidated balance sheets.
At policy inception, annual premiums are estimated based on projected wages over the duration of the policy period. As actual wages are realized, the amounts paid for premiums may differ from the estimates recorded by the Company, creating an asset or liability throughout the policy year. Such differences could have a material effect on the Company’s consolidated financial position and results of operations.
Health Benefits
Health benefits insurance reserves are established to provide for the estimated costs of reimbursing the carriers for paying claims within the deductible layer in accordance with health insurance policies. These reserves include estimates for reported losses, plus estimates for claims incurred but not reported. Reserves are determined regularly by the Company based upon a number of factors, including but not limited to actuarial calculations, current and historical claims payment patterns, plan enrollment and medical trend rates. Ultimate health insurance reserves may vary in subsequent years from the amounts estimated. As of December 31, 2011 and 2012 and September 30, 2013, liability reserves of $3.0 million, $17.4 million, and $28.2 million, respectively, were recorded within health benefits payable and are included in WSE-related liabilities in the accompanying consolidated balance sheets.
Under certain contracts, based on plan performance the Company may be entitled to receive refunds of premiums. We estimate these refunds based on premium and claims data and record the prepaid health plan asset within worksite employee related assets on the consolidated balance sheet. As of December 31, 2011 and 2012 and September 30, 2013, the Company had $13.1 million, $36.5 million, and $2.7 million, respectively, as prepaid health plan expenses included within WSE-related assets.
Cash and Cash Equivalents
Cash and cash equivalents include bank deposits and short-term, highly liquid investments. Investments with original maturity dates of three months or less are considered cash equivalents.
Investments
The Company classifies its investments as available-for-sale. Unrealized gains and losses are reported as a component of accumulated other comprehensive income. The amortized cost of debt securities is adjusted for amortization of premiums and accretion of discounts from the date of purchase to maturity or sale. Such amortization is included in interest income as an addition to or deduction from the coupon interest earned on the investments. The Company uses the specific identification method of determining the cost basis in computing realized gains and losses on the sale of its available-for-sale securities. Realized gains and losses are included in other income in the accompanying consolidated statement of operations.
The Company assesses whether an other-than-temporary impairment loss has occurred due to declines in fair value or other market conditions. With respect to debt securities, this assessment takes into account our current intent to sell, or not sell, the security, and whether it is more likely than not that we will not be required to sell the security before recovery of its amortized cost.
F-11
Table of Contents
TriNet Group, Inc. and Subsidiaries
NOTES TO CONSOLIDATED FINANCIAL STATEMENTS (Continued)
(Information as of September 30, 2013 and for the nine months ended September 30, 2012 and 2013 is unaudited)
Accounts Receivable
The Company’s accounts receivable, which represent outstanding gross billings to customers, are reported net of an allowance for doubtful accounts. The Company establishes an allowance for doubtful accounts based on historical experience, the age of the accounts receivable balances, credit quality of customers, current economic conditions and other factors that may affect customers’ ability to pay.
Property and Equipment
The Company records property and equipment at historical cost and computes depreciation using the straight-line method over the estimated useful lives of the assets or the lease terms, generally three to five years for software and office equipment, five to seven years for furniture and fixtures, and the shorter of the asset life or the remaining lease term for leasehold improvements. The Company expenses the cost of maintenance and repairs as incurred and capitalizes betterments.
Internal Use Software
The Company capitalizes internal and external costs incurred to develop internal-use computer software during the application development stage. Application development stage costs include license fees paid to third-parties for software use, software configuration, coding, and installation. Capitalized costs are amortized on a straight-line basis over the estimated useful life, typically ranging from three to five years, commencing when the software is placed into service. The Company amortizes license fees for software use over the life of the license agreement. The Company expenses costs incurred during the preliminary project stage, as well as general and administrative, overhead, maintenance and training costs, and costs that do not add functionality to existing systems. For the nine months ended September 30, 2012 and 2013, internally developed software costs capitalized were $3.4 million and $2.8 million, respectively. For the years ended December 31, 2010, 2011 and 2012, internally developed software costs capitalized were $1.6 million, $3.4 million and $4.3 million, respectively.
Goodwill and Other Intangible Assets
The Company’s goodwill and identifiable intangible assets with indefinite useful lives are not amortized, but instead are tested for impairment on an annual basis or when an event occurs or circumstances change in a way to indicate that there has been a potential decline in the fair value of the reporting unit. Impairment is determined by comparing the estimated fair value of the reporting unit to its carrying amount, including goodwill. In 2011, the Company adopted the accounting standard that provides for performing a qualitative assessment to determine whether it is more likely than not that the fair value of the reporting unit has declined below carrying value. This assessment considers various financial, macroeconomic, industry, and reporting unit specific qualitative factors. The Company’s business is largely homogeneous and, as a result, all goodwill is associated with the Company’s one reporting unit.
Intangible assets with finite useful lives include purchased customer lists, trade names, developed technologies, and contractual agreements. Intangible assets are amortized over their respective estimated useful lives ranging from two to six years using either the straight-line method or an accelerated method. Intangible assets are reviewed for indicators of impairment at least annually and evaluated for impairment whenever events or changes in circumstances indicate that the carrying amount of an asset may not be recoverable.
The Company performs its annual impairment testing in its fiscal fourth quarter. Based on the results of the Company’s reviews, no impairment loss was recognized in the results of operations for the years ended December 31, 2010, 2011 and 2012.
F-12
Table of Contents
TriNet Group, Inc. and Subsidiaries
NOTES TO CONSOLIDATED FINANCIAL STATEMENTS (Continued)
(Information as of September 30, 2013 and for the nine months ended September 30, 2012 and 2013 is unaudited)
Impairment of Long-Lived Assets
The Company evaluates its long-lived assets for impairment whenever events or changes in circumstances indicate that the carrying amount of an asset may not be recoverable. An asset is considered impaired if the carrying amount exceeds the undiscounted future net cash flows the asset is expected to generate. An impairment charge is recognized for the amount by which the carrying amount of the assets exceeds its fair value. Assets to be disposed of are reported at the lower of the carrying amount or fair value, less selling costs.
Advertising Costs
The Company expenses the costs of producing advertisements at the time production occurs and expenses the cost of running advertisements in the period in which the advertising space or airtime is used as sales and marketing expense. Advertising costs were $5.1 million and $5.5 million for the nine months ended September 30, 2012 and 2013, respectively. Advertising costs were $5.2 million, $4.2 million and $6.4 million for the years ended December 31, 2010, 2011 and 2012, respectively.
Stock-Based Compensation
The Company has issued two types of stock-based awards to employees: restricted stock units and stock options. Compensation expense associated with restricted stock units is based on the fair value of common stock on the date of grant. Compensation expense associated with stock options is based on the estimated grant date fair value method using the Black-Scholes valuation model. Expense is recognized using a straight-line amortization method over the respective vesting period for awards that are ultimately expected to vest. Accordingly, stock-based compensation has been reduced for estimated forfeitures. When estimating forfeitures, the Company considers voluntary termination behaviors as well as trends of actual option forfeitures. A tax benefit from stock-based compensation is recognized in equity to the extent that an incremental tax benefit is realized.
Income Taxes
The Company recognizes deferred tax assets and liabilities for estimated future tax effects based on differences between the carrying amounts of assets and liabilities for financial reporting purposes and amounts used for income tax purposes under current tax laws. Deferred tax expense results from the change in the net liability for deferred income taxes between periods.
The Company maintains a reserve for uncertain tax positions. The Company evaluates tax positions taken or expected to be taken in a tax return for recognition in its consolidated financial statements. Prior to recording the related tax benefit in the consolidated financial statements, the Company must conclude that tax positions are more likely than not to be sustained, assuming those positions will be examined by taxing authorities with full knowledge of all relevant information. The benefit recognized in the consolidated financial statements is the amount the Company expects to realize after examination by taxing authorities. If a tax position drops below the more likely than not standard, the benefit can no longer be recognized. Assumptions, judgment and the use of estimates are required in determining if the more likely than not standard has been met when developing the provision for income taxes and in determining the expected benefit. A change in the assessment of the more likely than not standard could materially impact the Company’s results of operations or financial position. The Company recognizes interest and penalties related to uncertain tax positions as a component of income tax expense.
Derivative Financial Instruments
The Company records derivative financial instruments as either assets or liabilities in its consolidated balance sheets measured at fair value. Changes in the fair value of derivatives are reported in earnings or as a
F-13
Table of Contents
TriNet Group, Inc. and Subsidiaries
NOTES TO CONSOLIDATED FINANCIAL STATEMENTS (Continued)
(Information as of September 30, 2013 and for the nine months ended September 30, 2012 and 2013 is unaudited)
separate component of other comprehensive income, depending on the use of the derivative and whether it qualifies for hedge accounting. Gains and losses associated with changes in the fair value of derivatives and the effect on the consolidated financial statements depend on its hedge designation and whether the hedge is highly effective in achieving offsetting changes in the fair value or cash flow of the asset or liability hedged. The method used for assessing the effectiveness of a hedging derivative, as well as the measurement approach for determining the ineffective portion of the hedge, is established at the inception of the hedge. The effective portion of the designated derivatives’ gain or loss is initially reported as a component of accumulated other comprehensive income and is subsequently reclassified into the financial statement line item in which the hedged item is recorded and in the same period the forecasted transaction affects earnings. The Company’s derivative program is not designed or operated for trading or speculative purposes.
In 2012, the Company purchased interest rate cap contracts that qualify as cash flow hedges to reduce the volatility of cash flows related primarily to forecasted interest payments on its credit facility. The derivative asset is included within deferred loan costs and other assets on the consolidated balance sheets. In the event the hedge relationship is no longer considered effective, the changes in fair value of the derivative will be reclassified and reported in the consolidated statement of operations. See Note 8 for additional information related to interest rate cap contracts.
Concentrations of Credit Risk
Financial instruments that subject the Company to concentrations of credit risk include cash and cash equivalents, investments, restricted cash and restricted investments (including payroll funds collected), accounts receivable, and amounts due from insurance carriers. The Company maintains its cash and cash equivalents, investments, restricted cash and restricted investments (including payroll funds collected) principally in domestic financial institutions and performs periodic evaluations of the relative credit standing of these institutions. The Company’s exposure to credit risk in the event of default by the financial institutions holding these funds is limited to amounts currently held by the institution in excess of insured amounts.
Under the terms of professional services agreements, customers agree to maintain sufficient funds or other satisfactory credit at all times to cover the cost of its current payroll, all accrued paid time off, vacation or sick leave balances, and other vested wage and benefit obligations for all their work site employees. The Company generally requires payment from its customers on or before the applicable payroll date.
For certain customers, the Company requires an indemnity guarantee payment (IGP) supported by a letter of credit, bond, or a certificate of deposit from certain financial institutions. The IGP typically equals the total payroll and service fee for one average payroll period.
As of September 30, 2013, one customer accounted for 16% of accounts receivable and one customer accounted for 14% of accounts receivable. As of December 31, 2012, one customer accounted for 12% of accounts receivable. As of December 31, 2011, no customer accounted for more than 10% of accounts receivable. No customer accounted for more than 10% of service revenues in the years ended December 31, 2010, 2011 or 2012 or the nine months ended September 30, 2012 or September 30, 2013. Bad debt expense, net of recoveries was $1.4 million, $0.5 million, and $0.4 million for the years ended December 31, 2010, 2011 and 2012, respectively, and $0.2 million and $0.3 million for the nine months ended September 30, 2012 and 2013.
F-14
Table of Contents
TriNet Group, Inc. and Subsidiaries
NOTES TO CONSOLIDATED FINANCIAL STATEMENTS (Continued)
(Information as of September 30, 2013 and for the nine months ended September 30, 2012 and 2013 is unaudited)
Recent Accounting Pronouncements
In February 2013, the FASB issued ASU 2013-02—Comprehensive Income. The guidance does not change the current requirements for reporting net income or other comprehensive income in financial statements. However, the amendments require an entity to provide information about the amounts reclassified from accumulated other comprehensive income to net income by component. This standard is effective prospectively for reporting periods beginning after December 15, 2012 and December 15, 2013 for public and nonpublic entities, respectively. Early adoption is permitted. The Company adopted this guidance in 2013. There were no material reclassifications made from accumulated other comprehensive income to net income during the nine months ended September 30, 2013.
In July 2013, the FASB issued ASU 2013-11—Presentation of an Unrecognized Tax Benefit When a Net Operating Loss Carryforward, a Similar Tax Loss, or a Tax Credit Carryforward Exists, which requires that an unrecognized tax benefit, or portion of an unrecognized tax benefit, be presented as a reduction of a deferred tax asset for a net operating loss carryforward, a similar tax loss, or a tax credit carryforward. If an applicable deferred tax asset is not available or a company does not expect to use the applicable deferred tax asset, the unrecognized tax benefit should be presented as a liability in the financial statements and should not be combined with an unrelated deferred tax asset. ASU 2013-11 is effective for annual reporting periods, and interim periods within those years, beginning after December 15, 2013. The amendments should be applied prospectively to all unrecognized tax benefits that exist at the effective date, however retrospective application is permitted. The Company does not expect this guidance to have a material effect on its consolidated financial statements. The Company will adopt this guidance in 2014.
NOTE 2. WORKSITE EMPLOYEE-RELATED ASSETS AND LIABILITIES
The following schedule presents the components of the Company’s WSE-related assets and WSE-related liabilities (in thousands):
| December 31, | September
30, 2013 |
|||||||||||
| 2011 | 2012 | |||||||||||
| Restricted cash |
$ | 44,828 | $ | 25,186 | $ | 21,461 | ||||||
| Restricted investment |
2,311 | 2,315 | 2,316 | |||||||||
| Payroll funds collected |
44,771 | 137,618 | 207,719 | |||||||||
| Unbilled service revenues, net of advance collection of $7,107, $18,077 and $26,962 at December 31, 2011, December 31, 2012 and September 30, 2013, respectively |
65,195 | 172,951 | 219,872 | |||||||||
| Accounts receivable, net of allowance for doubtful accounts of $221, $819 and $136 at December 31, 2011, December 31, 2012 and September 30, 2013, respectively |
2,911 | 5,931 | 5,731 | |||||||||
| Prepaid health plan expenses |
13,063 | 36,505 | 2,697 | |||||||||
| Refundable health plan premiums |
4,644 | 17,331 | 28,175 | |||||||||
| Refundable workers compensation premiums |
7,559 | 9,412 | 19,306 | |||||||||
| Prepaid workers compensation expenses |
1,180 | 1,401 | 1,698 | |||||||||
| Other payroll assets |
2,474 | 2,212 | 126 | |||||||||
|
|
|
|
|
|
|
|||||||
| Total worksite employee related assets |
$ | 188,936 | $ | 410,862 | $ | 509,101 | ||||||
|
|
|
|
|
|
|
|||||||
F-15
Table of Contents
TriNet Group, Inc. and Subsidiaries
NOTES TO CONSOLIDATED FINANCIAL STATEMENTS (Continued)
(Information as of September 30, 2013 and for the nine months ended September 30, 2012 and 2013 is unaudited)
| December 31, | September
30, 2013 |
|||||||||||
| 2011 | 2012 | |||||||||||
| Unbilled wages accrual |
$ | 69,000 | $ | 179,357 | $ | 238,769 | ||||||
| Payroll taxes payable |
75,011 | 130,684 | 132,460 | |||||||||
| Health benefits payable |
13,228 | 34,477 | 42,041 | |||||||||
| Customer prepayments |
5,521 | 16,866 | 33,663 | |||||||||
| Workers compensation payable |
15,372 | 15,264 | 27,863 | |||||||||
| Other payroll deductions |
7,587 | 22,853 | 25,896 | |||||||||
|
|
|
|
|
|
|
|||||||
| Total worksite employee related liabilities |
$ | 185,719 | $ | 399,501 | $ | 500,692 | ||||||
|
|
|
|
|
|
|
|||||||
NOTE 3. WORKERS COMPENSATION
The Company has fully insured workers compensation agreements with various carriers to provide workers compensation insurance coverage for employees. Insurance carriers are responsible for administrating and paying claims. The Company is responsible to reimburse carrier up to a deductible limit per occurrence.
The following summarizes the activities in liability for unpaid claims and claims adjustment expenses (in thousands):
| Year Ended December 31, | Nine Months Ended September 30, 2013 |
|||||||||||||||
| 2010 | 2011 | 2012 | ||||||||||||||
| Liability for unpaid claims and claims adjustment expenses at beginning of period |
$ | 17,121 | $ | 33,877 | $ | 42,732 | $ | 53,900 | ||||||||
| Plans acquired through business combinations |
— | — | 7,971 | 481 | ||||||||||||
| Incurred related to: |
||||||||||||||||
| Current year |
28,817 | 24,353 | 23,230 | 19,758 | ||||||||||||
| Prior years |
1,638 | 2,146 | (3,344 | ) | (2,415 | ) | ||||||||||
|
|
|
|
|
|
|
|
|
|||||||||
| Total incurred |
30,455 | 26,499 | 19,886 | 17,343 | ||||||||||||
|
|
|
|
|
|
|
|
|
|||||||||
| Paid related to: |
||||||||||||||||
| Current year |
(12,615 | ) | (9,338 | ) | (6,778 | ) | (4,775 | ) | ||||||||
| Prior years |
(1,084 | ) | (8,306 | ) | (9,911 | ) | (8,431 | ) | ||||||||
|
|
|
|
|
|
|
|
|
|||||||||
| Total paid |
(13,699 | ) | (17,644 | ) | (16,689 | ) | (13,206 | ) | ||||||||
|
|
|
|
|
|
|
|
|
|||||||||
| Liability for unpaid claims and claims adjustment expenses at end of period |
33,877 | 42,732 | 53,900 | 58,518 | ||||||||||||
| Other liabilities |
1,263 | 177 | 691 | 12,263 | ||||||||||||
|
|
|
|
|
|
|
|
|
|||||||||
| Total workers compensation liabilities at end of period |
$ | 35,140 | $ | 42,909 | $ | 54,591 | $ | 70,781 | ||||||||
|
|
|
|
|
|
|
|
|
|||||||||
Under the terms of the reinsurance agreement with its workers compensation insurance carriers, the Company collects and holds premiums in restricted accounts pending claims payments by the claims administrator. As of December 31, 2011, December 31, 2012 and September 30, 2013, such restricted amounts of $47.1 million, $27.5 million and $22.2 million, respectively, are presented as restricted cash and restricted
F-16
Table of Contents
TriNet Group, Inc. and Subsidiaries
NOTES TO CONSOLIDATED FINANCIAL STATEMENTS (Continued)
(Information as of September 30, 2013 and for the nine months ended September 30, 2012 and 2013 is unaudited)
investment within WSE-related assets in the accompanying consolidated balance sheets. In addition, at December 31, 2012 and September 30, 2013, $29.9 million and $36.5 million are presented as long-term investments.
NOTE 4. BUSINESS COMBINATION
The purchase price for each business combination is allocated to tangible and identifiable intangible assets acquired and liabilities assumed based on the fair value at the date of purchase. Purchase price in excess of the identifiable assets and liabilities is recorded as goodwill. All acquisition-related costs are expensed as incurred and recorded in operating expenses. The Company includes operations associated with acquisitions from the date of acquisition.
Ambrose Employer Group, LLC (Ambrose)
On July 1, 2013 (the acquisition date), the Company acquired 100% of the outstanding equity of Ambrose Employer Group, LLC (Ambrose). The estimated acquisition date fair value of the consideration transferred totaled $193.7 million, which consisted of the following (in thousands):
| Cash paid to equity holders |
$ | 200,000 | ||
| Cash and cash equivalents acquired |
(6,273 | ) | ||
|
|
|
|||
| Total |
$ | 193,727 | ||
|
|
|
The following table summarizes the estimated fair value of the assets acquired and liabilities assumed at the acquisition date (in thousands):
| Restricted cash |
$ | 442 | ||
| WSE-related assets |
57,366 | |||
| Prepaid expenses and other current assets |
893 | |||
| Goodwill |
97,647 | |||
| Identifiable intangible assets |
94,380 | |||
| Property and equipment |
1,358 | |||
| Other noncurrent assets |
878 | |||
| WSE-related liabilities |
(53,115 | ) | ||
| Accounts payable and accrued liabilities |
(5,646 | ) | ||
| Deferred rent |
(126 | ) | ||
| Other long term liabilities |
(350 | ) | ||
|
|
|
|||
| Consideration transferred |
$ | 193,727 | ||
|
|
|
The goodwill of $97.6 million is primarily attributable to the synergies and economies of scale expected from the acquisition of Ambrose. Because the Company acquired a 100% interest in Ambrose, a partnership, the Company received a stepped-up tax basis in the fair market value of the assets. Therefore, the goodwill is deductible for income tax purposes. The estimated fair value of the acquired identifiable other intangible assets of $94.4 million consisted of customer contracts, trademarks and non-compete agreements valued at $90.4 million, $2.6 million and $1.4 million, respectively. The aggregate purchase price is subject to further adjustment based on the finalization of working capital.
F-17
Table of Contents
TriNet Group, Inc. and Subsidiaries
NOTES TO CONSOLIDATED FINANCIAL STATEMENTS (Continued)
(Information as of September 30, 2013 and for the nine months ended September 30, 2012 and 2013 is unaudited)
The Company recognized $0.4 million of acquisition-related costs for the Ambrose acquisition within general and administrative expenses in the accompanying consolidated statements of operations.
Ambrose contributed revenues of $10.9 million and minimal net income to the Company from July 1, 2013 to September 30, 2013.
SOI Holdings, Inc. (SOI)
On October 24, 2012 (the acquisition date), the Company acquired 100% of the outstanding equity of SOI Holdings, Inc. (SOI), the parent company of Strategic Outsourcing, Inc. The estimated acquisition date fair value of the consideration transferred totaled $195.8 million, which consisted of the following (in thousands):
| Cash paid to equity holders |
$ | 198,171 | ||
| Receivable from equity holders |
(1,893 | ) | ||
| Cash and cash equivalents acquired |
(504 | ) | ||
|
|
|
|||
| Total |
$ | 195,774 | ||
|
|
|
The following table summarizes the estimated fair value of the assets acquired and liabilities assumed at the acquisition date (in thousands):
| Restricted cash |
$ | 700 | ||
| WSE-related assets |
122,135 | |||
| Prepaid expenses and other current assets |
600 | |||
| Goodwill |
164,616 | |||
| Identifiable intangible assets |
81,500 | |||
| Property and equipment |
8,941 | |||
| Other noncurrent assets |
464 | |||
| WSE-related liabilities |
(115,902 | ) | ||
| Accrued corporate wages |
(2,611 | ) | ||
| Deferred income taxes |
(17,386 | ) | ||
| Current portion of notes payable and borrowings under capital leases |
(579 | ) | ||
| Other current liabilities |
(3,841 | ) | ||
| Other noncurrent liabilities |
(42,863 | ) | ||
|
|
|
|||
| Consideration transferred |
$ | 195,774 | ||
|
|
|
The goodwill of $164.6 million is primarily attributable to the synergies and economies of scale expected from the acquisition of SOI. None of the goodwill recognized is expected to be deductible for income tax purposes. The estimated fair value of the acquired identifiable other intangible assets of $81.5 million consisted of customer contracts and trademarks valued at $68.0 million and $13.5 million, respectively. The Company recorded $31.3 million in deferred tax liabilities associated with the identifiable intangible assets, $0.1 million of which is included in current deferred income taxes, while $31.2 million is included in other noncurrent liabilities above. Additionally, $17.3 million of current deferred tax liabilities and $9.4 million of noncurrent deferred tax liabilities were acquired in the transaction, for a total of $58.0 million in total deferred tax liabilities. During the nine months ended September 30, 2013, an adjustment to goodwill of $3.8 million was recorded, reducing the SOI goodwill balance to $160.8 million as a result of finalizing provisional income tax amounts.
F-18
Table of Contents
TriNet Group, Inc. and Subsidiaries
NOTES TO CONSOLIDATED FINANCIAL STATEMENTS (Continued)
(Information as of September 30, 2013 and for the nine months ended September 30, 2012 and 2013 is unaudited)
The Company recognized $0.6 million of acquisition-related costs for the SOI acquisition within general and administrative expenses in the accompanying consolidated statements of operations.
SOI contributed revenues of $17.2 million and a net loss of $1.4 million to the Company from October 24, 2012 to December 31, 2012.
210 Park Avenue Holding, Inc. (Accord)
On April 26, 2012, the Company acquired 100% of the stock of 210 Park Avenue Holding, Inc. (Accord), an Oklahoma-based professional employer organization, for total consideration of $25.5 million, net of cash and cash equivalents acquired of $2.1 million. The acquisition of Accord resulted in approximately $17.0 million of goodwill, which is not deductible for tax purposes. The goodwill of $17.0 million is primarily attributable to the synergies and economies of scale expected from the acquisition of Accord. During the nine months ended September 30, 2013, an adjustment to goodwill of $0.1 million was recorded, reducing the Accord goodwill balance to $16.9 million as a result of finalizing provisional income tax amounts. Identifiable intangible assets acquired, which totaled approximately $13.8 million, consist of customer list, trademarks and non-compete agreements. For the year ended December 31, 2012, the Company recognized $1.0 million of acquisition-related costs within general and administrative expenses in the accompanying consolidated statements of operations.
App7, Inc. (ExpenseCloud)
On May 3, 2012, the Company acquired 100% of the stock of App7, Inc. (ExpenseCloud), an expense management solution company, for total consideration of $2.7 million, net of cash. The purchase price includes $1.3 million in contingent payments expected to be paid within the next 12 months from the date of acquisition. The Company made $1.2 million of contingent payments during 2012. The acquisition of ExpenseCloud resulted in approximately $2.0 million of goodwill, which is not deductible for tax purposes. During the nine months ended September 30, 2013, an adjustment to goodwill of $0.2 million was recorded, reducing the ExpenseCloud goodwill balance to $1.8 million as a result of finalizing provisional income tax amounts. Identifiable intangible assets acquired, which totaled approximately $1.2 million, consist of developed technology and non-compete agreements. Acquisition-related costs are recognized within general and administrative expenses in the accompanying consolidated statements of operations.
The 2012 acquisitions reflect the Company’s continued business strategy to diversify and expand its customer base as well as to expand its human resources services and solutions available to the Company’s current and target clients. Operating results of SOI, Accord and ExpenseCloud have been combined with TriNet’s operating results from the respective dates of acquisition.
Pro forma combined operating results for the years ended December 31, 2011 and 2012 exclude Accord and ExpenseCloud because the results of operations of those businesses were not material. The acquired businesses contributed revenues of $27.7 million and a net loss of $3.2 million to the Company from April 26, 2012 to December 31, 2012.
The Company made no acquisitions during 2011 or 2010.
F-19
Table of Contents
TriNet Group, Inc. and Subsidiaries
NOTES TO CONSOLIDATED FINANCIAL STATEMENTS (Continued)
(Information as of September 30, 2013 and for the nine months ended September 30, 2012 and 2013 is unaudited)
Pro Forma Financial Information
The following unaudited pro forma financial information presents the combined results of TriNet, SOI and Ambrose for the year ended December 31, 2012 and of TriNet and SOI for the year ended December 31, 2011 as if the SOI and Ambrose acquisition had occurred as of the beginning of 2011 and 2012, respectively, by applying certain adjustments, principally adding acquisition financing costs and the amortization of acquired intangible assets and removing acquisition-related transaction expenses and SOI historical debt costs (in thousands):
| Year Ended December 31, | ||||||||
| 2011 | 2012 | |||||||
| Total revenues |
$ | 1,055,228 | $ | 1,424,876 | ||||
| Net income (loss) |
(3,669 | ) | 16,374 | |||||
This pro forma information is based on estimates and assumptions, which Company management believes are reasonable, and is not necessarily indicative of the results of operations in future periods or the results that actually would have been realized had TriNet and SOI been a combined company during the specified periods.
NOTE 5. PROPERTY AND EQUIPMENT, NET
Property and equipment, net, consist of the following (in thousands):
| December 31, | ||||||||||||
| 2011 | 2012 | September 30, 2013 | ||||||||||
| Software |
$ | 42,806 | $ | 33,782 | $ | 37,479 | ||||||
| Office equipment, including data processing equipment |
15,347 | 15,968 | 19,807 | |||||||||
| Leasehold improvements |
4,599 | 5,850 | 6,805 | |||||||||
| Furniture, fixtures, and equipment |
2,556 | 4,363 | 5,304 | |||||||||
| Projects in progress |
3,273 | 3,801 | 3,644 | |||||||||
|
|
|
|
|
|
|
|||||||
| 68,581 | 63,764 | 73,039 | ||||||||||
| Accumulated depreciation |
(51,173 | ) | (39,404 | ) | (49,627 | ) | ||||||
|
|
|
|
|
|
|
|||||||
| Property and equipment, net |
$ | 17,408 | $ | 24,360 | $ | 23,412 | ||||||
|
|
|
|
|
|
|
|||||||
Software and furniture, fixtures, and equipment include amounts for assets under capital leases of $5.6 million, $3.0 million and $2.1 million at December 31, 2011, December 31, 2012 and September 30, 2013, respectively. Accumulated depreciation of these assets was $4.3 million, $1.4 million and $1.0 million at December 31, 2011, December 31, 2012 and September 30, 2013, respectively. Amortization of assets held under capital leases is included with depreciation expense in the accompanying consolidated statements of operations.
Projects in progress consist primarily of software development costs. The Company capitalizes software development costs intended for internal use. The Company periodically assesses the likelihood of unsuccessful completion of projects in progress, as well as monitoring events or changes in circumstances, which might suggest that impairment has occurred and recoverability should be evaluated. An impairment loss is recognized if the carrying amount of the asset is not recoverable and exceeds the future net cash flows expected to be generated by the asset. Due to significant changes in the extent and manner in which assets were expected to be used, the Company recognized losses of $2.8 million and $0.4 million for the nine months ended September 30, 2012 and 2013, respectively, and $0.9 million, $0.4 million and $2.8 million for the years ended December 31, 2010, 2011
F-20
Table of Contents
TriNet Group, Inc. and Subsidiaries
NOTES TO CONSOLIDATED FINANCIAL STATEMENTS (Continued)
(Information as of September 30, 2013 and for the nine months ended September 30, 2012 and 2013 is unaudited)
and 2012, respectively, on certain internally developed software and included these charges in depreciation expense in the accompanying consolidated statements of operations.
NOTE 6. GOODWILL AND OTHER INTANGIBLE ASSETS
The following schedule summarizes goodwill and other intangible assets (in thousands):
| December 31, 2011 | ||||||||||||||
| Weighted Average Amortization Period |
Gross Carrying Amount |
Accumulated Amortization |
Net Carrying Amount |
|||||||||||
| Goodwill |
— | $ | 12,363 | $ | — | $ | 12,363 | |||||||
| Amortizable intangibles: |
||||||||||||||
| Customer contracts |
5 years | 44,530 | (32,907 | ) | 11,623 | |||||||||
| Trademark |
3 years | 3,125 | (2,858 | ) | 267 | |||||||||
| Noncompete agreements |
2 years | 10,602 | (10,602 | ) | — | |||||||||
|
|
|
|
|
|
|
|||||||||
| 4 years | 58,257 | (46,367 | ) | 11,890 | ||||||||||
|
|
|
|
|
|
|
|||||||||
| Total |
$ | 70,620 | $ | (46,367 | ) | $ | 24,253 | |||||||
|
|
|
|
|
|
|
|||||||||
| December 31, 2012 | ||||||||||||||
| Weighted Average Amortization Period |
Gross Carrying Amount |
Accumulated Amortization |
Net Carrying Amount |
|||||||||||
| Goodwill |
— | $ | 195,966 | $ | — | $ | 195,966 | |||||||
| Amortizable intangibles: |
||||||||||||||
| Customer contracts |
3-5 years | 119,450 | (43,079 | ) | 76,371 | |||||||||
| Trademark |
3 years | 14,300 | (929 | ) | 13,371 | |||||||||
| Developed technology |
5 years | 1,000 | (133 | ) | 867 | |||||||||
| Noncompete agreements |
2-3 years | 560 | (160 | ) | 400 | |||||||||
|
|
|
|
|
|
|
|||||||||
| 4 years | 135,310 | (44,301 | ) | 91,009 | ||||||||||
|
|
|
|
|
|
|
|||||||||
| Total |
$ | 331,276 | $ | (44,301 | ) | $ | 286,975 | |||||||
|
|
|
|
|
|
|
|||||||||
| September 30, 2013 | ||||||||||||||
| Weighted Average Amortization Period |
Gross Carrying Amount |
Accumulated Amortization |
Net Carrying Amount |
|||||||||||
| Goodwill |
— | $ | 289,463 | $ | — | $ | 289,463 | |||||||
| Amortizable intangibles: |
||||||||||||||
| Customer contracts |
3-5 years | 209,850 | (74,769 | ) | 135,081 | |||||||||
| Trademark |
3 years | 16,900 | (4,719 | ) | 12,181 | |||||||||
| Developed technology |
5 years | 1,000 | (283 | ) | 717 | |||||||||
| Noncompete agreements |
2-3 years | 1,940 | (456 | ) | 1,484 | |||||||||
|
|
|
|
|
|
|
|||||||||
| 4 years | 229,690 | (80,227 | ) | 149,463 | ||||||||||
|
|
|
|
|
|
|
|||||||||
| Total |
$ | 519,153 | $ | (80,227 | ) | $ | 438,926 | |||||||
|
|
|
|
|
|
|
|||||||||
F-21
Table of Contents
TriNet Group, Inc. and Subsidiaries
NOTES TO CONSOLIDATED FINANCIAL STATEMENTS (Continued)
(Information as of September 30, 2013 and for the nine months ended September 30, 2012 and 2013 is unaudited)
Amortization expense related to amortizable intangibles in future periods is expected to be as follows (in thousands):
| Year ending December 31 (unaudited): |
||||
| 2013 |
$ | 15,443 | ||
| 2014 |
52,304 | |||
| 2015 |
38,905 | |||
| 2016 |
18,375 | |||
| 2017 and thereafter |
24,437 | |||
|
|
|
|||
| Total |
$ | 149,464 | ||
|
|
|
NOTE 7. MARKETABLE SECURITIES AND FAIR VALUE MEASUREMENTS
The Company’s available-for-sale marketable securities consist of the following (in thousands):
| Amortized Cost |
Gross Unrealized Gains |
Gross Unrealized Losses |
Estimated Fair Value |
|||||||||||||
| December 31, 2012: |
||||||||||||||||
| U.S. treasuries |
$ | 29,371 | $ | 50 | $ | — | $ | 29,421 | ||||||||
| Mutual funds |
500 | 8 | — | 508 | ||||||||||||
|
|
|
|
|
|
|
|
|
|||||||||
| Total investments |
$ | 29,871 | $ | 58 | $ | — | $ | 29,929 | ||||||||
|
|
|
|
|
|
|
|
|
|||||||||
| September 30, 2013 (unaudited): |
||||||||||||||||
| U.S. treasuries |
$ | 35,964 | $ | 42 | $ | (20 | ) | $ | 35,986 | |||||||
| Mutual funds |
500 | 7 | — | 507 | ||||||||||||
|
|
|
|
|
|
|
|
|
|||||||||
| Total investments |
$ | 36,464 | $ | 49 | $ | (20 | ) | $ | 36,493 | |||||||
|
|
|
|
|
|
|
|
|
|||||||||
For the year ended December 31, 2012, $0.03 million in realized gains were recognized. There were no realized gains for the nine months ended September 30, 2013. As of December 31, 2012 and September 30, 2013, the contractual maturities of the U.S. treasuries were two to three years. There were no investments in marketable securities as of December 31, 2011.
As of September 30, 2013, five of the Company’s U.S. treasuries were in unrealized loss position for a period of less than 12 months. The unrealized losses with aggregate amortization represented (0.1) % from the Company’s amortized cost basis. These unrealized losses are principally due to changes in interest rates and credit spreads. In analyzing an issuer’s financial condition, the Company considers whether the securities are issued by the federal government or its agencies, whether downgrades by bond rating agencies have occurred, and industry analysts’ reports. The fair value of these securities represented 23% of the total fair value of all securities available for sale and their unrealized loss was $0.02 million as of September 30, 2013. As the Company has the ability to hold debt securities until maturity, or for the foreseeable future as classified as available for sale, no decline was deemed to be other-than-temporary.
Fair value is an exit price, representing the amount that would be received to sell an asset or paid to transfer a liability in an orderly transaction between market participants. As such, fair value is a market-based measurement that should be determined based on assumptions that market participants would use in pricing an asset or a liability.
F-22
Table of Contents
TriNet Group, Inc. and Subsidiaries
NOTES TO CONSOLIDATED FINANCIAL STATEMENTS (Continued)
(Information as of September 30, 2013 and for the nine months ended September 30, 2012 and 2013 is unaudited)
As a basis for considering such assumptions, the Company uses a three-tier value hierarchy, which prioritizes the inputs used in measuring fair value as follows:
| • | Level I—observable inputs such as quoted prices in active markets |
| • | Level II—inputs other than the quoted prices in active markets that are observable either directly or indirectly |
| • | Level III—unobservable inputs in which there is little or no market data, which requires the Company to develop its own assumptions |
This hierarchy requires the Company to use observable market data when available and to minimize the use of unobservable inputs when determining fair value. On a recurring basis, the Company measures its financial assets at fair value.
The following table summarizes the Company’s financial assets measured at fair value on a recurring basis (in thousands):
| Total Fair Value |
Level I | Level II | Level III | |||||||||||||
| Assets: |
||||||||||||||||
| December 31, 2011: |
||||||||||||||||
| Certificate of deposit |
$ | 2,311 | $ | 2,311 | $ | — | $ | — | ||||||||
|
|
|
|
|
|
|
|
|
|||||||||
| Total |
$ | 2,311 | $ | 2,311 | $ | — | $ | — | ||||||||
|
|
|
|
|
|
|
|
|
|||||||||
| December 31, 2012: |
||||||||||||||||
| Certificate of deposit |
$ | 2,315 | $ | 2,315 | $ | — | $ | — | ||||||||
| U.S. treasuries |
29,421 | 29,421 | — | — | ||||||||||||
| Mutual funds |
508 | 508 | — | — | ||||||||||||
| Interest rate cap (see also Note 8) |
138 | — | 138 | — | ||||||||||||
|
|
|
|
|
|
|
|
|
|||||||||
| Total |
$ | 32,382 | $ | 32,244 | $ | 138 | $ | — | ||||||||
|
|
|
|
|
|
|
|
|
|||||||||
| September 30, 2013 (unaudited): |
||||||||||||||||
| Certificates of deposit |
$ | 2,858 | $ | 2,858 | $ | — | $ | — | ||||||||
| U.S. treasuries |
35,986 | 35,986 | — | — | ||||||||||||
| Mutual funds |
507 | 507 | — | — | ||||||||||||
| Interest rate cap (see also Note 8) |
87 | — | 87 | — | ||||||||||||
|
|
|
|
|
|
|
|
|
|||||||||
| Total |
$ | 39,438 | $ | 39,351 | $ | 87 | $ | — | ||||||||
|
|
|
|
|
|
|
|
|
|||||||||
There were no transfers between Level I and Level II assets for the years ended December 31, 2011 or December 31, 2012 or the nine months ended September 30, 2013.
As of December 31, 2011, December 31, 2012 and September 30, 2013, certificate of deposit consisted of certificates of deposit held by domestic financial institutions, of which $2.3 million are presented as restricted investments within WSE-related assets and $0.5 million are presented as noncurrent restricted investments available for sale in the accompanying consolidated balance sheets.
The book value of the Company’s financial instruments not measured at fair value, including cash, restricted cash, WSE-related assets and liabilities, line of credit and accrued corporate wages approximates fair value due to the relatively short maturity, cash repayments or market interest rates of such instruments. The fair value of
F-23
Table of Contents
TriNet Group, Inc. and Subsidiaries
NOTES TO CONSOLIDATED FINANCIAL STATEMENTS (Continued)
(Information as of September 30, 2013 and for the nine months ended September 30, 2012 and 2013 is unaudited)
such financial instruments are determined using the income approach based on the present value of estimated future cash flows. The fair value of all of these instruments would be categorized as Level 2 of the fair value hierarchy, with the exception of cash and cash equivalents which would be categorized as Level 1.
At December 31, 2012 and September 30, 2013, the carrying value of our notes payable of $300.0 million and $820.0 million, respectively, approximated fair value. The estimate fair values of our notes payable are considered a level 2 valuation in the hierarchy for fair value measurement and are based on a cash flow model discounted at market interest rates that considers the underlying risks of unsecured debt.
NOTE 8. NOTES PAYABLE AND BORROWINGS UNDER CAPITAL LEASES
The following schedule summarizes the components of the Company’s notes payable and borrowings under capital leases balances (in thousands):
| December 31, | September 30, 2013 |
|||||||||||
| 2011 | 2012 | |||||||||||
| Notes payable under credit facility |
$ | — | $ | 300,000 | $ | 820,000 | ||||||
| Capital leases and other notes payable |
1,683 | 1,334 | 610 | |||||||||
| Less current portion |
(1,423 | ) | (9,803 | ) | (6,714 | ) | ||||||
|
|
|
|
|
|
|
|||||||
| $ | 260 | $ | 291,531 | $ | 813,896 | |||||||
|
|
|
|
|
|
|
|||||||
2011 Credit Facility
In June 2011, the Company obtained a revolving credit facility of $35.0 million, which was subsequently terminated in June 2012. The Company recorded loan fees of $0.3 million. The remaining balance of the loan fees was fully amortized in June 2012 upon termination.
2012 Credit Facility
In March 2012, TriNet Group, Inc., as guarantor, its subsidiary TriNet HR Corporation, as borrower, and certain other TriNet subsidiaries as subsidiary guarantors, which are referred to collectively as the loan parties, entered into a credit facility totaling $140.0 million, which we refer to as our initial credit facility. The initial credit facility provided for a five-year term loan facility of $105.0 million and a five-year revolving credit facility of $35.0 million. The $105.0 million term loan was fully drawn in March 2012, but no amounts were drawn under the revolving credit facility. In connection with the initial credit facility, the Company recorded loan fees of $3.1 million, which were fully amortized in October 2012.
In October 2012, the Company completed an amendment and restatement of its credit facility totaling $350.0 million, which provided for two new tranches of term loans totaling $300.0 million and a five-year revolving credit facility of $50.0 million, which we refer to as our amended and restated credit facility. The term loans consisted of a five-year term A loan of $150.0 million and a six-year term B loan of $150.0 million, both of which were fully drawn in October 2012. In April 2013, the Company amended the amended and restated credit facility to provide for an additional $50.0 million of term A loans, $100.0 million of term B loans and $25.0 million of availability under the revolving credit facility. The amended and restated credit facility, as amended in April 2013, is referred to herein as the previous credit facility; the term A loans under the amended and restated credit facility, as amended in April 2013, are collectively referred to as the term A loan; and the term B loans under the amended and restated credit facility, as amended in April 2013, are collectively referred to as the term B loan. The Company
F-24
Table of Contents
TriNet Group, Inc. and Subsidiaries
NOTES TO CONSOLIDATED FINANCIAL STATEMENTS (Continued)
(Information as of September 30, 2013 and for the nine months ended September 30, 2012 and 2013 is unaudited)
recorded loan fees of $10.8 million associated with the amended and restated credit facility and $2.6 million associated with the previous credit facility. The remaining balance of the loan fees was fully amortized in August 2013 upon termination.
2013 Credit Facility
In August 2013, the Company, as guarantor, its subsidiary TriNet HR Corporation, as borrower, and certain of its other subsidiaries as subsidiary guarantors entered into two senior secured credit facilities:
| • | a $705.0 million first lien credit facility with JPMorgan Chase Bank, N.A., as administrative agent; and |
| • | a $190.0 million second lien credit facility with Wilmington Trust, National Association, as administrative agent. |
The credit facilities are secured by substantially all of the Company’s assets and the assets of the borrower and of the subsidiary guarantors, other than specifically excluded assets.
The first lien credit facility provides for a five-year revolving credit facility of $75.0 million, three-year first lien tranche B-1 term loan of $175.0 million and seven-year first lien tranche B-2 term loan of $455.0 million. A second lien credit facility provides for seven-year-and-six-month term loan of $190.0 million. All first lien and second lien term loans were fully drawn in August 2013. The $75.0 million revolving credit facility includes capacity for a $30.0 million letter of credit facility and a $10.0 million swingline facility. The total unused portion of the revolving credit facility was $52.2 million as of September 30, 2013, since $22.8 million of the facility was used to backstop letters of credit outstanding in a previous credit facility. The proceeds of the first and second lien credit facilities were used to repay approximately $448.3 million of indebtedness outstanding under the Company’s previous credit facility, declare a special dividend, provide cash collateral to guarantee a letter of credit and pay transaction costs. In connection with the credit facilities, the Company incurred $23.1 million of debt issuance costs.
Borrowings under our credit facilities bear interest, at our option at a rate based on the LIBOR or based on the prime rate plus, in each case, an applicable margin. LIBOR loans under the tranche B-2 term loan and the second lien credit facility are subject to a 1.00% LIBOR floor. The applicable margin with respect to our tranche B-1 term loan is equal to (i) 3.75% per annum for LIBOR loans and (ii) 2.75% per annum for prime rate loans. The applicable margin with respect to our tranche B-2 term loan is equal to (x) at such times as any indebtedness is outstanding under our second lien credit facility (i) 4.00% per annum for LIBOR loans, and (ii) 3.00% per annum for prime rate loans, and (y) at such times as no indebtedness is outstanding under our second lien credit facility (i) 3.75% per annum for LIBOR loans, and (ii) 2.75% per annum for prime rate loans. The applicable margin with respect to our second lien term loans is equal to (i) 7.75% per annum for LIBOR loans and (ii) 6.75% per annum for prime rate loans. The applicable margin with respect to our revolving credit facility is subject to adjustment based on our first lien leverage ratio. The tranche B-1 term loan has a maturity date of August 20, 2016, the tranche B-2 term loan has a maturity date of August 20, 2020 and the second lien term loan has a maturity date of February 20, 2021 and the revolving credit facility has a maturity date of August 20, 2018.
The credit facilities contain customary representations and warranties and customary affirmative and negative covenants applicable to us and our subsidiaries, including, among other things, restrictions on indebtedness, liens, investments, mergers, dispositions, prepayment of other indebtedness, and dividends and other distributions. Under the revolving credit facility, so long as there are any outstanding revolving loans and/
F-25
Table of Contents
TriNet Group, Inc. and Subsidiaries
NOTES TO CONSOLIDATED FINANCIAL STATEMENTS (Continued)
(Information as of September 30, 2013 and for the nine months ended September 30, 2012 and 2013 is unaudited)
or outstanding letters of credit in excess of $15.0 million other than letters of credit that have been cash collateralized, we are required to comply with a financial covenant that requires us and our subsidiaries to maintain a maximum first lien leverage ratio, currently at 5.50 to 1.00 on a consolidated basis. The Company was in compliance with the restrictive covenants under the previous credit facility at December 31, 2012 and under the credit facilities at September 30, 2013.
The Company’s first lien credit facility permits cash dividend payments and stock repurchases in an amount equal to (a) $15.0 million plus (b) the available ECF amount (as defined in the credit agreements), in each case so long as no default has occurred and is continuing or would result therefrom, no ECF shortfall amount (as defined in the credit agreements) is outstanding and the Company’s first lien leverage ratio on a pro forma basis is not in excess of 3.75 to 1.00. However, if no default has occurred and is continuing or would result therefrom and no ECF shortfall amount is outstanding, but the Company’s first lien leverage ratio is above the threshold indicated above, then its cash dividend payments and stock repurchases are limited to $15.0 million. The Company’s second lien credit facility permits cash dividend payments and stock repurchases in an amount equal to (a) $17.25 million plus (b) the available ECF amount, in each case so long as no default has occurred and is continuing or would result therefrom, no ECF shortfall amount is outstanding and the Company’s total leverage ratio on a pro forma basis is not in excess of 5.00 to 1.00. However, if no default has occurred and is continuing or would result therefrom and no ECF shortfall amount is outstanding, but the Company’s total leverage ratio is above the threshold indicated above, then its cash dividend payments and stock repurchases are limited to $17.25 million. Notwithstanding the foregoing, the credit facilities permit (i) certain stock repurchases from former employees, officers, directors and consultants up to a certain amount during each fiscal year and (ii) one or more cash dividend payments in an aggregate amount not to exceed $360 million. As of September 30, 2013, the Company had utilized the exception in clause (ii) of the previous sentence to make $310.8 million in dividend payments.
While no amounts were drawn under the revolving credit facility as of September 30, 2013, there were outstanding letters of credit totaling $15 million as of September 30, 2013, which reduced borrowings available under the revolving credit facility. As of December 31, 2012 and September 30, 2013, the fair value of financing obligations under our credit facility approximates its book value.
As a result of the Company’s credit facility, it is exposed to changes in interest rates. To mitigate such risk, the Company entered into an interest rate cap arrangement with a bank in May 2012, which we refer to as the May 2012 cap, to protect the interest payment cash flows through March 30, 2015 on the initial credit facility from adverse market interest changes due to fluctuations in the 3-month LIBOR benchmark interest rate with an initial notional amount of $51.8 million and final notional amount of $42.0 million at a strike price of 2%. Upon the amendment and restatement of the Company’s initial credit facility, the May 2012 cap was re-designated to hedge a portion of the amended and restated credit facility and subsequently the credit facility. In December 2012, the Company entered into an interest rate cap arrangement with another bank, which is referred to as the December 2012 cap, to hedge the interest payment cash flows of 50% of the incremental total loan balance through October 24, 2015. The December 2012 cap has an initial notional amount of $99.5 million and final notional amount of $137.6 million at a strike price of 2%. At inception, the interest rate caps were determined to be perfectly effective and were designated as a cash flow hedge for accounting purposes. However, with the credit facility as discussed above, the interest rate basis and timing of payments have changed and no longer match the terms of the May 2012 and December 2012 caps. As a result, the interest rate caps were no longer considered perfectly effective, thus, the change in its fair value is charged to operations. In addition, $0.1 million of previously reported in unrealized (losses) gains on interest rate cap in the consolidated statements of other comprehensive income (loss) were reversed and charged to operations as a result of the dedesignation.
F-26
Table of Contents
TriNet Group, Inc. and Subsidiaries
NOTES TO CONSOLIDATED FINANCIAL STATEMENTS (Continued)
(Information as of September 30, 2013 and for the nine months ended September 30, 2012 and 2013 is unaudited)
Other Notes Payable
In July 2010, the Company entered into a $0.2 million noninterest-bearing note to purchase software, due in three annual installments of $0.1 million beginning in July 2010. The Company recorded the note at a discounted value of $0.2 million based on an imputed interest rate of 5.6%. The note was fully repaid in July 2012.
In August 2011, the Company entered into a $0.7 million noninterest-bearing note to purchase software, due in four installments beginning in August 2011. The Company recorded the note at a discounted value of $0.7 million based on an imputed interest rate of 4.5%. The note was fully repaid in July 2012.
NOTE 9. CONVERTIBLE PREFERRED STOCK
On June 7, 2005, the Company issued 5,391,441 shares of Series G convertible preferred stock (Series G) at $11.00 per share for an aggregate cash purchase price of $59.3 million. The Company recorded the issuance of Series G at $59.1 million, net of issuance costs of $0.2 million. On June 1, 2009, the Company issued 4,124,986 shares of Series H convertible preferred stock (Series H) at $16.69 per share for an aggregate cash purchase price of $68.8 million. The Company recorded the issuance of Series H at $63.8 million, net of issuance costs of $5.0 million. Upon the issuance of Series H, certain terms related to Series G were amended.
Upon the occurrence of a liquidation or sale of the Company, the distribution of the Company’s assets is first paid to the holders of the Series H, then to the holders of Series G, before any distribution is made to the holders of shares of common stock. Distribution to the holders of Series H would be in an amount equal to the greater of $16.69 per share, plus unpaid dividends, or the aggregate amount payable with respect to the number of shares of common stock into which the shares of Series H would be convertible. Distribution to the holders of Series G would be in an amount equal to the greater of $11.00 per share, plus unpaid dividends, or the aggregate amount payable with respect to the number of shares of common stock into which the shares of Series G would be convertible. If however, the liquidation payment would result in the holders of Series G receiving greater than 80% of the remaining assets available for distribution, then the payment would be reduced to 80% of the remaining assets available for distribution.
At any time, the holders of a majority of the outstanding shares of Series H and Series G may require shares of Series H and Series G to be converted into common stock. As a result of the stock split described in Note 14 below, each share of Series H and Series G is currently convertible into two shares of common stock. Each Series H and Series G share is convertible into a number of shares of common stock equal to the Series H Liquidation Payment and Series G Liquidation Payment divided by the then-effective conversion price (currently $8.35 and $5.50, respectively), subject to antidilution adjustments and adjustments for subsequent stock splits, stock dividends, combinations or other recapitalizations. The holders of Series H and Series G have voting rights similar to those of common stockholders, with each share entitling the holder to cast the number of votes they would have if they were to convert their preferred shares into common shares. The holders of Series G combined with the holders of Series H have the right to elect four members to the Company’s Board of Directors.
The holders of Series H and Series G have a redemption option if they own less than a majority of the voting stock of the Company on June 1, 2014. The redemption option is available for 90 days and can be exercised by a majority of the holders of Series H and Series G. The redemption option for Series H and Series G is equal to $16.69 and $11.00 per share, respectively, plus unpaid dividends. Redemption would not be allowed if it were to cause the Company to have a negative working capital balance. As of September 30, 2013, redemption value accretion has not been recognized as the probability of redemption is deemed remote. Series H and Series G stockholders are not entitled to receive dividends if dividends are declared and paid on common stock, Series H
F-27
Table of Contents
TriNet Group, Inc. and Subsidiaries
NOTES TO CONSOLIDATED FINANCIAL STATEMENTS (Continued)
(Information as of September 30, 2013 and for the nine months ended September 30, 2012 and 2013 is unaudited)
and Series G stockholders shall be entitled to share in dividends on a pro rata basis upon redemption as if their shares had been converted into shares of common stock.
NOTE 10: STOCKHOLDERS’ EQUITY
Equity-Based Incentive Plans
In 2000, the Company established the 2000 Equity Incentive Plan (the 2000 Plan), which provided for granting incentive stock options, nonstatutory stock options, bonus awards and restricted stock awards to eligible employees, directors, and consultants of the Company. In December 2009, the Board of Directors approved the 2009 Equity Incentive Plan (the 2009 Plan) as the successor to and continuation of the 2000 Plan. As of the 2009 Plan effective date, remaining shares available for issuance under the 2000 Plan were cancelled and became available for issuance under the 2009 Plan. No additional stock awards will be granted under the 2000 Plan. The 2009 Plan provides for the grant of the following awards to eligible employees, directors, and consultants: incentive stock options, nonstatutory stock options, stock appreciation rights, restricted stock awards, restricted stock unit awards, performance stock awards, performance cash awards, and other stock awards. Incentive stock options may only be granted to employees. Nonemployee directors are eligible to receive nonstatutory stock options automatically at designated intervals over their period of continuous service on the Board. In February 2013, the Board approved an amendment to the 2009 Equity Plan authorizing an additional 2,337,800 shares available for grant.
The exercise price per share of all incentive stock options granted under the 2000 Plan and the 2009 Plan must be at least equal to the fair market value of the shares at the date of grant as determined by the Board of Directors. Options issued to recipients other than nonemployee directors generally vest over four years with a one year cliff and monthly thereafter, and have a maximum contractual term of 10 years. Options issued to members of the Board of Directors are issued with varying vesting schedules. Incentive stock options granted at 110% of the fair market value to stockholders who have greater than 10% ownership have a maximum term of five years.
The Company also has granted restricted stock units to members of the Board of Directors. These restricted stock units represent rights to receive shares of the Company’s common stock on satisfaction of applicable vesting conditions. The fair value of restricted stock units is equal to the fair value of the Company’s common stock on the date of grant and generally vest at rates of 25% or 33% at the end of the first year and then pro rata monthly thereafter over the remaining vesting term of three or two years.
Stock plan activity under the 2000 Plan and the 2009 Plan is summarized as follows:
| Shares Available for Grant | ||||
| Balance at December 31, 2011 |
1,504,750 | |||
| Authorized |
— | |||
| Granted |
(1,513,584 | ) | ||
| Forfeited |
150,226 | |||
| Expired |
92,006 | |||
|
|
|
|||
| Balance at December 31, 2012 |
233,398 | |||
|
|
|
|||
| Authorized |
2,337,800 | |||
| Granted |
(1,791,700 | ) | ||
| Forfeited |
191,116 | |||
| Expired |
68,840 | |||
|
|
|
|||
| Balance at September 30, 2013 |
1,039,454 | |||
|
|
|
|||
F-28
Table of Contents
TriNet Group, Inc. and Subsidiaries
NOTES TO CONSOLIDATED FINANCIAL STATEMENTS (Continued)
(Information as of September 30, 2013 and for the nine months ended September 30, 2012 and 2013 is unaudited)
The following table summarizes stock option activity under the Company’s equity-based plans for the year ended December 31, 2012 and the nine months ended September 30, 2013:
| Number of Shares |
Weighted Average Exercise Price |
Weighted Average Remaining Contractual Term (Years) |
Aggregate Intrinsic Value (in thousands) |
|||||||||||||
| Balance at December 31, 2011 |
4,614,920 | $ | 5.38 | 7.17 | $ | 8,627 | ||||||||||
| Granted |
1,513,584 | 6.83 | ||||||||||||||
| Exercised |
(1,429,392 | ) | 3.77 | |||||||||||||
| Forfeited |
(150,226 | ) | 3.37 | |||||||||||||
| Expired |
(92,006 | ) | 3.63 | |||||||||||||
|
|
|
|||||||||||||||
| Balance at December 31, 2012 |
4,456,880 | 3.22 | 7.46 | 24,060 | ||||||||||||
|
|
|
|||||||||||||||
| Granted |
1,791,700 | 16.21 | ||||||||||||||
| Exercised |
(2,645,252 | ) | 2.60 | |||||||||||||
| Forfeited |
(191,116 | ) | 12.90 | |||||||||||||
| Expired |
(68,840 | ) | 2.88 | |||||||||||||
|
|
|
|||||||||||||||
| Balance at September 30, 2013 |
3,343,372 | 2.85 | 8.64 | 58,919 | ||||||||||||
|
|
|
|||||||||||||||
| Vested and exercisable: |
||||||||||||||||
| December 31, 2012 |
2,213,720 | 2.24 | 6.20 | 14,124 | ||||||||||||
|
|
|
|||||||||||||||
| September 30, 2013 |
425,814 | $ | 1.03 | 6.73 | $ | 8,276 | ||||||||||
|
|
|
|||||||||||||||
The weighted-average grant-date fair value of stock options granted in the years ended December 31, 2010, 2011 and 2012 and the nine months ended September 30, 2013 was $4.33, $4.04, $3.01 and $7.59 per share, respectively. The total fair value of options vested for the years ended December 31, 2010, 2011 and 2012 and the nine months ended September 30, 2013 was $3.9 million, $5.5 million, $3.6 million and $3.2 million, respectively.
The total intrinsic value of options exercised for the years ended December 31, 2010, 2011 and 2012 and the nine months ended September 30, 2013 and was $1.5 million, $4.9 million, $6.1 million and $47.1 million, respectively. Cash received from options exercised during the year ended December 31, 2012 and the nine months ended September 30, 2013 was $5.4 million and $6.9 million, respectively. The exercise price of all options granted was equal to the fair value of the common stock on the date of grant.
As of December 31, 2012 and September 30, 2013, unrecognized compensation expense, net of forfeitures, associated with nonvested options outstanding was $6.3 million and $14.9 million, respectively, and is expected to be recognized over a weighted-average period of 2.42 years and 2.99 years, respectively.
F-29
Table of Contents
TriNet Group, Inc. and Subsidiaries
NOTES TO CONSOLIDATED FINANCIAL STATEMENTS (Continued)
(Information as of September 30, 2013 and for the nine months ended September 30, 2012 and 2013 is unaudited)
The following table summarizes restricted stock unit activity under the Company’s equity-based plans for the year ended December 31, 2012 and the nine months ended September 30, 2013:
| Number of Units | Weighted Average Grant Date Fair Value |
|||||||
| Nonvested at December 31, 2011 |
56,252 | $ | 6.90 | |||||
| Granted |
— | — | ||||||
| Vested |
(37,996 | ) | $ | 7.05 | ||||
| Forfeited |
— | — | ||||||
|
|
|
|||||||
| Nonvested at December 31, 2012 |
18,256 | $ | 6.59 | |||||
|
|
|
|||||||
| Granted |
— | — | ||||||
| Vested |
(14,990 | ) | $ | 6.60 | ||||
| Forfeited |
— | — | ||||||
|
|
|
|||||||
| Nonvested at September 30, 2013 |
3,266 | $ | 6.55 | |||||
|
|
|
|||||||
No restricted stock units were granted in 2012 or 2013. The total grant date fair value of restricted stock units vested in years ended December 31, 2010, 2011 and 2012 and the nine months ended September 30, 2013 was $0.4 million, $0.4 million, $0.3 million and $0.1 million, respectively. As of December 31, 2012 and September 30, 2013, unrecognized compensation expense, net of forfeitures, associated with the nonvested restricted stock units outstanding was $0.1 million and $0.1 million, respectively, and is expected to be recognized over a weighted-average period of 0.88 years and 0.13 years, respectively.
Stock-Based Compensation
Stock-based compensation expense of $5.1 million, $4.8 million and $4.4 million was recognized for the years ended December 31, 2010, 2011 and 2012, respectively. An income tax benefit of $0.9 million, $3.4 million and $1.7 million was recognized relating to stock-based compensation expense for 2010, 2011 and 2012, respectively. The actual tax benefit realized from stock options exercised was $0.2 million, $0.2 million and $2.4 million for 2010, 2011 and 2012, respectively.
Stock-based compensation expense of $3.4 million and $4.4 million was recognized for the nine months ended September 30, 2012 and 2013, respectively. An income tax benefit of $0.6 million and $4.1 million was recognized relating to stock-based compensation expense for the nine months ended September 30, 2012 and 2013, respectively. The actual tax benefit realized from stock options exercised was $0.6 million and $18.3 million for the nine months ended September 30, 2012 and 2013, respectively.
The fair value of each option grant is estimated on the date of grant using the Black-Scholes option-pricing model with the following weighted-average assumptions:
| Year Ended December 31, | Nine Months Ended September 30, | |||||||||||||||||||
| 2010 | 2011 | 2012 | 2012 | 2013 | ||||||||||||||||
| Expected term (in years) |
6.00 | 5.77 | 6.04 | 6.03 | 6.04 | |||||||||||||||
| Expected volatility |
50 | % | 48 | % | 46 | % | 46 | % | 48 | % | ||||||||||
| Risk-free interest rate |
2.04 | % | 2.29 | % | 1.01 | % | 1.03 | % | 1.22 | % | ||||||||||
| Expected dividend yield |
0 | % | 0 | % | 0 | % | 0 | % | 0 | % | ||||||||||
F-30
Table of Contents
TriNet Group, Inc. and Subsidiaries
NOTES TO CONSOLIDATED FINANCIAL STATEMENTS (Continued)
(Information as of September 30, 2013 and for the nine months ended September 30, 2012 and 2013 is unaudited)
Earnings per Share
Basic and diluted earnings per share (EPS) are computed using the two-class method, which is an earnings allocation method that determines earnings per share for common stock and participating securities. The undistributed earnings are allocated between common stock and participating securities as if all earnings had been distributed during the period. Shares of convertible preferred stock are considered participating securities as they are entitled to share in dividends on a pro rata basis on redemption as if the shares had been converted to common stock.
Basic EPS is calculated by taking net income, less earnings available to participating securities, divided by the basic weighted average common stock outstanding.
Diluted earnings per share is calculated using the more dilutive of the if-converted method and the two-class method. Because the preferred stock participates in dividends on a pro rata basis as if the shares had been converted, the diluted earnings per share are the same under both methods. The two-class method has been presented below.
The following table sets forth the computation of the Company’s basic and diluted net income (loss) per share attributable to common stock for the years ended December 31, 2010, 2011 and 2012 and nine months ended September 30, 2012 and 2013 (in thousands, except per share data):
| Year
Ended December 31, |
Nine Months Ended September 30, |
|||||||||||||||||||
| 2010 | 2011 | 2012 | 2012 | 2013 | ||||||||||||||||
| Numerator (basic): |
||||||||||||||||||||
| Net (loss) income |
$ | (9,602 | ) | $ | 15,537 | $ | 31,832 | $ | 22,960 | $ | 7,140 | |||||||||
| Less net income allocated to participating securities |
— | (12,883 | ) | (25,312 | ) | (18,392 | ) | (5,484 | ) | |||||||||||
|
|
|
|
|
|
|
|
|
|
|
|||||||||||
| Net (loss) income attributable to common stock |
$ | (9,602 | ) | $ | 2,654 | $ | 6,520 | $ | 4,568 | $ | 1,656 | |||||||||
|
|
|
|
|
|
|
|
|
|
|
|||||||||||
| Denominator (basic): |
||||||||||||||||||||
| Weighted average common stock outstanding |
3,727 | 3,921 | 4,903 | 4,729 | 5,751 | |||||||||||||||
|
|
|
|
|
|
|
|
|
|
|
|||||||||||
| Basic EPS |
$ | (2.58 | ) | $ | 0.68 | $ | 1.33 | $ | 0.97 | $ | 0.29 | |||||||||
|
|
|
|
|
|
|
|
|
|
|
|||||||||||
| Numerator (diluted): |
||||||||||||||||||||
| Net (loss) income |
$ | (9,602 | ) | $ | 15,537 | $ | 31,832 | $ | 22,960 | $ | 7,140 | |||||||||
| Less net income allocated to participating securities |
— | (12,279 | ) | (23,974 | ) | (17,456 | ) | (5,103 | ) | |||||||||||
|
|
|
|
|
|
|
|
|
|
|
|||||||||||
| Net (loss) income attributable to common stock |
$ | (9,602 | ) | $ | 3,258 | $ | 7,858 | $ | 5,504 | $ | 2,037 | |||||||||
|
|
|
|
|
|
|
|
|
|
|
|||||||||||
| Denominator (diluted): |
||||||||||||||||||||
| Weighted average common stock outstanding |
3,727 | 3,921 | 4,903 | 4,729 | 5,751 | |||||||||||||||
| Add dilutive stock options and awards (RSUs) outstanding(1) |
— | 1,131 | 1,335 | 1,274 | 1,847 | |||||||||||||||
|
|
|
|
|
|
|
|
|
|
|
|||||||||||
| Net weighted average common stock outstanding |
3,727 | 5,052 | 6,238 | 6,003 | 7,598 | |||||||||||||||
|
|
|
|
|
|
|
|
|
|
|
|||||||||||
| Diluted EPS |
$ | (2.58 | ) | $ | 0.65 | $ | 1.26 | $ | 0.92 | $ | 0.27 | |||||||||
|
|
|
|
|
|
|
|
|
|
|
|||||||||||
| (1) | Diluted EPS includes any dilutive impact of stock options and restricted stock units. The shares included in the following table were not included in the computation of diluted earnings per share because the effect was antidilutive. However, these shares may be dilutive potential common shares in the future. |
F-31
Table of Contents
TriNet Group, Inc. and Subsidiaries
NOTES TO CONSOLIDATED FINANCIAL STATEMENTS (Continued)
(Information as of September 30, 2013 and for the nine months ended September 30, 2012 and 2013 is unaudited)
| Year
Ended December 31, |
Nine Months Ended September 30, |
|||||||||||||||||||
| 2010 | 2011 | 2012 | 2012 | 2013 | ||||||||||||||||
| (in thousands) | ||||||||||||||||||||
| Stock options |
6,493 | 2,060 | 1,474 | 1,546 | 820 | |||||||||||||||
The following table sets forth the computation of the Company’s pro forma basic and diluted net income per share attributable to common stock for the year ended December 31, 2012 and nine months ended September 30, 2013 (in thousands, except per share data):
| Year Ended December 31, |
Nine Months Ended September 30, |
|||||||
| 2012 | 2013 | |||||||
| Numerator (basic): |
||||||||
| Net (loss) income |
$ | 31,832 | $ | 7,140 | ||||
|
|
|
|
|
|||||
| Denominator (basic): |
||||||||
| Weighted average common stock outstanding |
4,903 | 5,751 | ||||||
| Add conversion of preferred stock |
19,033 | 19,033 | ||||||
| Add shares to replace dividends in excess of earnings |
||||||||
|
|
|
|
|
|||||
|
|
|
|
|
|||||
| Basic EPS |
$ | $ | ||||||
|
|
|
|
|
|||||
| Numerator (diluted): |
||||||||
| Net (loss) income |
$ | 31,832 | $ | 7,140 | ||||
|
|
|
|
|
|||||
| Denominator (diluted): |
||||||||
| Weighted average common stock outstanding |
4,903 | 5,751 | ||||||
| Add conversion of preferred stock |
19,033 | 19,033 | ||||||
| Add shares to replace dividends in excess of earnings |
||||||||
| Add dilutive stock options and awards (RSUs) oustanding |
1,335 | 1,847 | ||||||
|
|
|
|
|
|||||
| Net weighted average common stock outstanding |
||||||||
|
|
|
|
|
|||||
| Diluted EPS |
$ | $ | ||||||
|
|
|
|
|
|||||
Special Dividend
In May 2011, the Board of Directors declared a special dividend of $2.20 per common-equivalent share for holders of record of the Company’s preferred stock as of June 17, 2011, or a total of $41.9 million, and $2.20 per for holders of record of the Company’s common stock as of July 15, 2011, or a total of $9.0 million. Payment for these dividends has been fully paid in June 2011 and July 2011. Dividends have also been declared to holders of restricted stock units at $2.20 per common-equivalent share, or a total of $0.2 million, and are payable as the restricted stock units vest.
F-32
Table of Contents
TriNet Group, Inc. and Subsidiaries
NOTES TO CONSOLIDATED FINANCIAL STATEMENTS (Continued)
(Information as of September 30, 2013 and for the nine months ended September 30, 2012 and 2013 is unaudited)
In March 2012, the Board of Directors declared a special dividend of $3.13 per common-equivalent share for holders of record of the Company’s preferred stock as of March 30, 2012, or a total of $59.5 million, and $3.13 per share for holders of record of the Company’s common stock as of May 15, 2012, or a total of $15.9 million. These dividends were fully paid in March 2012 and May 2012. Dividends have also been declared to holders of restricted stock units at $3.13 per share, or a total of $0.1 million, and are payable as the restricted stock units vest.
In August 2013, the Board of Directors declared a special dividend of $11.75 per common-equivalent share for holders of record of the Company’s preferred stock as of August 21, 2013, or a total of $223.6 million, and $11.75 per share for holders of record of the Company’s common stock as of August 30, 2013, or a total of $87.1 million. These dividends were fully paid in August 2013 and September 2013. Dividends have also been declared to holders of restricted stock units at $11.75 per share, or a total of $0.1 million, and are payable as the restricted stock units vest.
As of September 30, 2013 and December 31, 2012 and 2011, dividends payable to holders of restricted stock units was $0.1 million, $0.1 million and $0.1 million, respectively.
As a result of the 2011 special dividend and in accordance with the provisions of the 2009 Plan, the Company adjusted the exercise prices on all outstanding options downward by $2.20, exactly equal to the amount of the dividend, except in two instances in which: (i) the exercise price was originally $0.85, or (ii) the holder did not consent to the adjustment when consent was required. For grants that were originally issued at $0.85, the Company adjusted the exercise price to $0.65 and increased the number of shares to maintain the ratio of strike price to stock value pre- and post-adjustment.
As a result of the 2012 special dividend and in accordance with the provisions of the 2009 Plan, the Company adjusted the exercise prices on all outstanding options downward by $3.13, exactly equal to the amount of the dividend, except in three instances in which: (i) the incentive stock option exercise price was lower than $1.58, (ii) the non-qualified stock option exercise price was lower than $4.13, or (iii) the holder did not consent to the adjustment when consent was required. For incentive stock options that were priced lower than $1.58 and non-qualified stock options priced lower than $4.13, the Company adjusted the exercise price to $0.44 and $1.00 respectively, and increased the number of shares to maintain the ratio of strike price to stock value pre- and post-adjustment.
As a result of the 2013 special dividend and in accordance with the provisions of the 2009 Plan, the Company adjusted the exercise prices on all outstanding options downward by $11.75, exactly equal to the amount of the dividend, except in three instances in which: i) the exercise price was lower than $12.75, ii) the holder of the Incentive Stock Option under the 2009 Plan did not consent to the adjustment when consent was required, or iii) the Incentive Stock Option under the 2000 Plan. For options that were priced lower than $12.75, the Company adjusted the exercise price to $1.00.
No changes were made to the original option grant-date fair value for the purpose of recognizing ongoing stock-based compensation cost. No changes were made to nonvested restricted stock units.
Tender Offer
In November 2012, the Company offered to purchase up to 1,100,000 shares of the Company’s outstanding common stock from eligible security holders for $8.62 per share. As a result, the Company purchased 304,270 shares for $2.6 million. The offer expired on December 31, 2012.
F-33
Table of Contents
TriNet Group, Inc. and Subsidiaries
NOTES TO CONSOLIDATED FINANCIAL STATEMENTS (Continued)
(Information as of September 30, 2013 and for the nine months ended September 30, 2012 and 2013 is unaudited)
In March 2013, the Company offered to purchase up to 900,000 shares of the Company’s outstanding common stock from eligible security holders for $16.40 per share. As a result, the Company purchased 203,864 shares for $3.3 million. The offer expired on May 31, 2013.
The purchase price of the stock repurchased is charged entirely to accumulated deficit in the statements of stockholders’ equity.
In June 2013, the Board of Directors and requisite stockholders of the Company approved a forward split of the Company’s common stock into two shares of common stock for each outstanding share of common stock. The stock split became effective July 1, 2013. Under the terms of our 2000 Plan and 2009 Plan, the number of shares reserved for issuance under such plans and all outstanding options and restricted stock units granted under such plans, and the exercise prices per share of such options, were automatically adjusted to give effect to the stock split. In addition, each share of Series G preferred stock and Series H preferred stock became convertible into two shares of common stock. All share and per share amounts contained in these financial statements have been revised to give effect to this stock split.
NOTE 11. 401(k) PLAN
Under the Company’s 401(k) plan, corporate participants may direct the investment of contributions to their accounts among certain investments. The Company matches individual employee 401(k) plan contributions at the rate of $0.50 for every dollar contributed by employees subject to a cap. The Company recorded matching contributions to the 401(k) plan of $1.1 million and $2.2 million during the nine months ended September 30, 2012 and 2013 and $1.2 million, $1.2 million and $1.5 million during the years ended December 31, 2010, 2011 and 2012, respectively, which are reflected in various operating expense lines within the accompanying consolidated statements of operations.
The Company also maintains a multiple employer defined contribution plan, which covers serviced employees for client companies electing to participate in the plan and for its internal staff employees. The Company contributes, on behalf of each participating client, varying amounts based on the clients’ policies and serviced employee elections.
NOTE 12. INCOME TAXES
The Company is subject to taxation in the United States and Canada. However, business is conducted primarily in the United States. The effective tax rate differs from the statutory rate primarily due to state taxes, tax credits and changes in uncertain tax positions. The Company makes estimates and judgments about its future taxable income that are based on assumptions that are consistent with the Company’s plans and estimates. Should the actual amounts differ from these estimates, the amount of the valuation allowance could be materially affected.
Income taxes are computed using the asset and liability method, under which deferred tax assets and liabilities are determined based on the difference between the financial statement and tax bases of assets and liabilities using enacted tax rates in effect for the year in which the differences are expected to affect taxable income. Valuation allowances are established when necessary to reduce deferred tax assets to the amount expected to be realized. Changes in valuation allowances are reflected as a component of provision for (benefit from) income taxes.
F-34
Table of Contents
TriNet Group, Inc. and Subsidiaries
NOTES TO CONSOLIDATED FINANCIAL STATEMENTS (Continued)
(Information as of September 30, 2013 and for the nine months ended September 30, 2012 and 2013 is unaudited)
Significant components of the Company’s deferred tax assets and liabilities are as follows (in thousands):
| December 31, | ||||||||
| 2011 | 2012 | |||||||
| Deferred tax assets: |
||||||||
| Net operating losses (federal and state) |
$ | 634 | $ | 11,686 | ||||
| Accrued expenses |
5,210 | 5,392 | ||||||
| Accrued workers compensation costs |
8,808 | 4,617 | ||||||
| Stock-based compensation |
4,452 | 3,942 | ||||||
| Tax benefits relating to uncertain positions |
138 | 70 | ||||||
| Depreciation and amortization |
4,606 | — | ||||||
| Deferred service revenues |
883 | — | ||||||
| Other |
301 | 279 | ||||||
|
|
|
|
|
|||||
| Total |
25,032 | 25,986 | ||||||
| Valuation allowance |
(431 | ) | (1,547 | ) | ||||
|
|
|
|
|
|||||
| Total deferred tax assets |
24,601 | 24,439 | ||||||
|
|
|
|
|
|||||
| Deferred tax liabilities: |
||||||||
| Depreciation and amortization |
— | (35,381 | ) | |||||
| Deferred service revenues |
— | (25,689 | ) | |||||
| Prepaid health plan expenses |
(5,071 | ) | (13,945 | ) | ||||
| Change in control expenses |
— | (1,410 | ) | |||||
|
|
|
|
|
|||||
| Total deferred tax liabilities |
(5,071 | ) | (76,425 | ) | ||||
|
|
|
|
|
|||||
| Net deferred tax assets (liabilities) |
$ | 19,530 | $ | (51,986 | ) | |||
|
|
|
|
|
|||||
The deferred tax assets and liabilities presented above are classified in the accompanying consolidated balance sheets as follows (in thousands):
| December 31, | ||||||||
| 2011 | 2012 | |||||||
| Net current deferred tax liabilities |
$ | (520 | ) | $ | (33,960 | ) | ||
| Net non-current deferred tax assets (liabilities) |
20,050 | (18,026 | ) | |||||
|
|
|
|
|
|||||
| Net deferred tax assets (liabilities) |
$ | 19,530 | $ | (51,986 | ) | |||
|
|
|
|
|
|||||
F-35
Table of Contents
TriNet Group, Inc. and Subsidiaries
NOTES TO CONSOLIDATED FINANCIAL STATEMENTS (Continued)
(Information as of September 30, 2013 and for the nine months ended September 30, 2012 and 2013 is unaudited)
The provision for (benefit from) income taxes consists of the following (in thousands):
| Year Ended December 31, | Nine Months
Ended September 30, |
|||||||||||||||||||
| 2010 | 2011 | 2012 | 2012 | 2013 | ||||||||||||||||
| Current: |
||||||||||||||||||||
| Federal |
$ | 6,585 | $ | 1,107 | $ | 10,699 | $ | 13,340 | $ | 12,083 | ||||||||||
| Foreign |
— | 184 | 142 | 104 | 159 | |||||||||||||||
| State |
715 | 140 | 1,845 | 1,220 | 1,173 | |||||||||||||||
|
|
|
|
|
|
|
|
|
|
|
|||||||||||
| 7,300 | 1,431 | 12,686 | 14,664 | 13,415 | ||||||||||||||||
| Deferred: |
||||||||||||||||||||
| Federal |
(6,676 | ) | 2,898 | 6,610 | 662 | (8,691 | ) | |||||||||||||
| State |
(724 | ) | 317 | 1,048 | 60 | (844 | ) | |||||||||||||
|
|
|
|
|
|
|
|
|
|
|
|||||||||||
| (7,400 | ) | 3,215 | 7,658 | 722 | (9,535 | ) | ||||||||||||||
|
|
|
|
|
|
|
|
|
|
|
|||||||||||
| $ | (100 | ) | $ | 4,646 | $ | 20,344 | $ | 15,386 | $ | 3,880 | ||||||||||
|
|
|
|
|
|
|
|
|
|
|
|||||||||||
The U.S. federal statutory income tax rate reconciled to the Company’s effective tax rate is as follows:
| Year Ended December 31, |
Nine Months
Ended September 30, |
|||||||||||||||||||
| 2010 | 2011 | 2012 | 2012 | 2013 | ||||||||||||||||
| U.S. federal statutory tax rate |
35.00 | % | 35.00 | % | 35.00 | % | 35.00 | % | 35.00 | % | ||||||||||
| State income taxes, net of federal benefit |
3.8 | 3.8 | 3.2 | 3.2 | 3.4 | |||||||||||||||
| Nondeductible transaction costs |
— | — | 0.6 | 0.4 | 0.3 | |||||||||||||||
| Prior year reconciliation adjustment |
3.6 | (5.9 | ) | 0.2 | 0.3 | 0.4 | ||||||||||||||
| Stock-based compensation |
(11.5 | ) | (5.0 | ) | 0.1 | 1.3 | (0.2 | ) | ||||||||||||
| Uncertain tax positions |
(38.7 | ) | (4.3 | ) | (0.2 | ) | (0.2 | ) | (4.2 | ) | ||||||||||
| Tax credits |
10.2 | (1.8 | ) | (0.7 | ) | (0.7 | ) | (3.4 | ) | |||||||||||
| Other |
(1.4 | ) | 1.2 | 0.8 | 0.8 | 3.9 | ||||||||||||||
|
|
|
|
|
|
|
|
|
|
|
|||||||||||
| 1.00 | % | 23.00 | % | 39.00 | % | 40.10 | % | 35.20 | % | |||||||||||
|
|
|
|
|
|
|
|
|
|
|
|||||||||||
Net deferred tax (liabilities) and assets of $(6.2) million, $(0.4) million, and $(31.4) million were established in connection with the revaluation of assets and liabilities with respect to the acquisition of Accord, ExpenseCloud and SOI, respectively. These net (liabilities) were reduced by a minimal amount for Accord; $0.2 million for ExpenseCloud, and $3.7 million for SOI respectively, as a result of their final pre-acquisition income tax returns filed during 2013. These deferred assets and liabilities are expected to generate timing differences through the year ending December 31, 2028.
The Company records a valuation allowance to reduce reported deferred tax assets if, based on the weight of available evidence, both positive and negative, for each respective tax jurisdiction, it is more likely than not that some or all of the deferred tax assets will not be realized. The Company recorded a valuation allowance of $0.4 million, $1.5 million and $4.0 million as of December 31, 2011, December 31, 2012 and September 30, 2013, respectively, related to certain federal and state net operating loss carryforwards that may not be utilized prior to expiration. The Company has federal and multiple state net operating loss carryforwards of approximately $36.2 million and
F-36
Table of Contents
TriNet Group, Inc. and Subsidiaries
NOTES TO CONSOLIDATED FINANCIAL STATEMENTS (Continued)
(Information as of September 30, 2013 and for the nine months ended September 30, 2012 and 2013 is unaudited)
$48.4 million, respectively that will expire in years 2014 through 2032. The net operating loss carryforwards increased between 2011 and 2012 as a result of recently acquired net operating losses that are subject to an IRC Section 382 limitation, which is partially offset by a valuation allowance of $1.6 million. Additionally, the Company has state tax credit carryforwards available from the 2011 and 2012 tax years, also recognized as a result of a recent acquisition. The state tax credit carryforwards for 2012 were also generated as a result of recently acquired state tax credit carryforwards, which are partially offset by a valuation allowance of $2.0 million. The December 31, 2012 current tax expense of $11.6 million is net of $1.1 million tax benefit of operating loss carry forwards. The valuation allowance increased (decreased) by $(1.0) million, $0.1 million, $1.1 million and $2.5 million, respectively, as of December 31, 2010, 2011 and 2012 and September 30, 2013, respectively.
The Company is subject to tax in U.S. federal and various state and local jurisdictions, as well as Canada. The Company has not been subject to any material income tax examinations in federal or state jurisdictions for tax years beginning prior to 2009.
The Company executed a Settlement Agreement with the Internal Revenue Service Office of Appeals (Appeals) in March 2011 with a payment of $3.2 million, effectively closing the IRS’ examination of Gevity HR, Inc.’s (Gevity) consolidated U.S. income tax returns for 2002 through 2004, with the exception of a continuing refund claim for employment tax credits of $3.2 million. Gevity was acquired by TriNet on June 1, 2009 and was later merged into TriNet, effective January 1, 2010. IRS examinations with respect to Gevity’s tax years 2005 through June 1, 2009 were concluded during 2012. However, Revenue Agent Reports issued in connection with Notices of Proposed Assessments disallowing employment tax credits totaling $10.5 million are subject to further consideration by Appeals. Additionally, the Company, together with Appeals and the IRS exam team, has formally requested a Technical Advice Memorandum (TAM) from the IRS to determine the Company’s ability to realize FICA tip tax credits on its federal corporate income tax returns as a statutory employer. The TAM was issued on August 29, 2013 by the IRS’s National Office and it ultimately reached an unfavorable conclusion for the Company. The Company is requesting reconsideration from the IRS’s National Office because some facts were misstated or misinterpreted in the TAM and the TAM failed to completely respond to the ultimate request. However, the Company believes the reconsideration will be denied based on discussions with Appeals. Should that be the case, the Company has requested alternative actions, including a request for revocation or prospective application based on statutory authority. With regard to the FICA tip tax matter, the Company believes it is more likely than not that the Company will prevail. Therefore, no reserve has been recognized related to this matter.
As of December 31, 2011, December 31, 2012 and September 30, 2013, the total unrecognized tax benefits related to uncertain income tax positions were $3.1 million, $3.3 million and $3.0 million, respectively. It is reasonably possible that $3.0 million and $2.5 million of the total unrecognized tax benefits as of December 31, 2012 and September 30, 2013, respectively, will settle within the next year; thus, the gross unrecognized tax benefit at December 31, 2012 and September 30, 2013 (including interest of $0.6 million and $0.7 million, respectively) could significantly decrease within 2013. Unrecognized tax benefits that may settle within the next year represent federal employment tax credits, which are more fully described above.
F-37
Table of Contents
TriNet Group, Inc. and Subsidiaries
NOTES TO CONSOLIDATED FINANCIAL STATEMENTS (Continued)
(Information as of September 30, 2013 and for the nine months ended September 30, 2012 and 2013 is unaudited)
A reconciliation of the beginning and ending amount of unrecognized tax benefits (excluding interest and penalties) is as follows (in thousands):
| December 31, | ||||||||||||
| 2010 | 2011 | 2012 | ||||||||||
| Unrecognized tax benefits at January 1 |
$ | 2,727 | $ | 1,914 | $ | 2,516 | ||||||
| Additions for tax positions of prior periods |
— | 2,109 | 110 | |||||||||
| Additions for tax positions of current period |
— | — | 49 | |||||||||
| Additions due to acquisitions |
— | — | 509 | |||||||||
| Reductions for tax positions of prior periods |
(8 | ) | (29 | ) | (144 | ) | ||||||
| Reductions for tax positions of current period: |
||||||||||||
| Settlements with taxing authorities |
(11 | ) | (1,320 | ) | — | |||||||
| Lapse of applicable statute of limitations |
(794 | ) | (158 | ) | (330 | ) | ||||||
|
|
|
|
|
|
|
|||||||
| Unrecognized tax benefits at December 31 |
$ | 1,914 | $ | 2,516 | $ | 2,710 | ||||||
|
|
|
|
|
|
|
|||||||
The Company recognized interest related to its uncertain tax positions as a component of income tax expense in the accompanying consolidated statements of operations of $2.2 million, $0.4 million and $0.2 million for the years ended December 31, 2010, 2011 and 2012 and minimal for the nine months ended September 30, 2012 and 2013, respectively.
The Company has not provided for U.S. federal income and foreign withholding taxes on its Canadian subsidiary’s undistributed earnings of $0.5 million as of December 31, 2012, because the Company intends to reinvest such earnings indefinitely. Upon distribution of those earnings in the form of dividends or otherwise, the Company would be subject to U.S. income taxes (subject to an adjustment for foreign tax credits). It is not practical to determine the income tax liability that might be incurred if these earnings were to be distributed.
NOTE 13. COMMITMENTS AND CONTINGENCIES
Lease Commitments
The Company leases office facilities, including its headquarters and other facilities, and equipment under non-cancelable operating leases. The Company also leases certain software and furniture, fixtures, and equipment under capital leases. The schedule of minimum future rental payments under non-cancelable operating and capital leases having initial terms in excess of one year at September 30, 2013, is as follows (in thousands):
| Capital Leases | Operating Leases | |||||||
| Year ending December 31: |
||||||||
| 2013 |
$ | 179 | $ | 2,341 | ||||
| 2014 |
370 | 8,843 | ||||||
| 2015 |
78 | 7,311 | ||||||
| 2016 |
9 | 2,691 | ||||||
| 2017 |
— | 1,342 | ||||||
| Thereafter |
— | 3,543 | ||||||
|
|
|
|
|
|||||
| Minimum lease payments |
636 | $ | 26,071 | |||||
|
|
|
|||||||
| Less current portion of minimum lease payments |
(414 | ) | ||||||
| Less interest |
(26 | ) | ||||||
|
|
|
|||||||
| Long term portion of capital leases |
$ | 196 | ||||||
|
|
|
|||||||
F-38
Table of Contents
TriNet Group, Inc. and Subsidiaries
NOTES TO CONSOLIDATED FINANCIAL STATEMENTS (Continued)
(Information as of September 30, 2013 and for the nine months ended September 30, 2012 and 2013 is unaudited)
The lease agreements generally provide for rental payments on a graduated basis and for options to renew, which could increase future minimum lease payments if exercised. The Company recognizes rent expense on a straight-line basis over the lease period and accrues for rent expense incurred but not paid. Rent expense for the nine months ended September 30, 2012 and 2013 was $5.2 million and $7.1 million, respectively. Rent expense for the years ended December 31, 2010, 2011 and 2012 was $8.6 million, $7.8 million and $7.3 million, respectively. Sublease income to be received under non-cancelable subleases for the years ending December 31, 2013, 2014 and 2015, is $0.5 million, $0.4 million and $0.3 million, respectively.
Operating Covenants
To meet various states’ licensing requirements and maintain accreditation by Employer Services Assurance Corporation, the Company is subject to various minimum working capital and net worth requirements. As of December 31, 2011 and 2012, the Company believes it has fully complied in all material respects with all applicable state regulations regarding minimum net worth, working capital and all other financial and legal requirements. Further, the Company has maintained positive working capital throughout the period covered by the financial statements.
Contingencies
The Company may from time to time become involved in various litigation arising in the ordinary course of business including suits by our customers. The unfavorable resolution of any such matter could have a material effect on the Company’s consolidated financial position and results of operations.
Due to the nature of the Company’s relationship with its WSEs, the Company could be subject to liability for federal and state law violations even if the Company does not participate in such violations. While the agreements with customers contain indemnification provisions related to the conduct of its customers, the Company historically has not encountered situations requiring enforcement of these indemnification provisions.
The Company has been named as a defendant in various purported class action lawsuits arising from the nature of the Company’s relationship with its WSEs. At this stage of the lawsuits, management believes an unfavorable outcome to the Company is not probable. There are significant uncertainties involved in any purported class action litigation. Management is unable to estimate a possible loss or range of loss for these class action lawsuits.
NOTE 14. RESTRUCTURING COSTS
In 2010 and 2011, the Company conducted reductions in force affecting approximately 12% and 11% of its workforce, respectively. The restructuring costs consist of severance and placement costs, lease termination costs and other exit costs. The activity and balance of the restructuring liability account excluding impairment charges is as follows (in thousands):
| December 31, | September
30, 2013 |
|||||||||||
| 2011 | 2012 | |||||||||||
| Beginning balance |
$ | 4,877 | $ | 3,834 | $ | 2,200 | ||||||
| Provision |
2,260 | — | — | |||||||||
| Change in estimate |
98 | (14 | ) | — | ||||||||
| Payments |
(3,401 | ) | (1,620 | ) | (604 | ) | ||||||
|
|
|
|
|
|
|
|||||||
| Ending balance |
$ | 3,834 | $ | 2,200 | $ | 1,596 | ||||||
|
|
|
|
|
|
|
|||||||
F-39
Table of Contents
TriNet Group, Inc. and Subsidiaries
NOTES TO CONSOLIDATED FINANCIAL STATEMENTS (Continued)
(Information as of September 30, 2013 and for the nine months ended September 30, 2012 and 2013 is unaudited)
The restructuring liability account is included in the following accounts in the accompanying consolidated balance sheets (in thousands):
| December 31, | September
30, 2013 |
|||||||||||
| 2011 | 2012 | |||||||||||
| Other current liabilities |
$ | 1,627 | $ | 802 | $ | 778 | ||||||
| Other liabilities |
2,207 | 1,398 | 818 | |||||||||
|
|
|
|
|
|
|
|||||||
| Total |
$ | 3,834 | $ | 2,200 | $ | 1,596 | ||||||
|
|
|
|
|
|
|
|||||||
NOTE 15. SUBSEQUENT EVENTS
For the consolidated financial statements as of December 31, 2011 and 2012, and for each of the years ended December 31, 2010, 2011 and 2012, we evaluated subsequent events through November 20, 2013, the date the consolidated financial statements were available to be issued.
In June 2013, the Board of Directors and requisite stockholders of the Company approved a forward split of the Company’s common stock into two shares of common stock for each outstanding share of common stock. The stock split became effective July 1, 2013. Refer to Note 10 for details.
In July 2013, the Company acquired 100% of the outstanding equity of Ambrose. Refer to Note 4 for details.
In August 2013, the Company entered into two senior secured credit facilities. Refer to Note 8 for details.
In August 2013, the Board of Directors declared a special dividend. As a result and in accordance with the provisions of the 2009 Plan, the Company adjusted the exercise prices on all outstanding options downward. Refer to Note 10 for details.
NOTE 16. SUBSEQUENT EVENTS (UNAUDITED)
For our consolidated financial statements as of September 30, 2012 and 2013 and for the nine months in the period ended September 30, 2013, we evaluated subsequent events through November 20, 2013, the date our consolidated financial statements were available to be issued. In addition, we evaluated subsequent events through January 6, 2014.
In December 2013, the Board of Directors declared a special dividend of $1.75 per common-equivalent share for holders of record of the Company’s preferred stock as of December 26, 2013, or a total of $33.3 million, and $1.75 per share for holders of record of the Company’s common stock as of December 26, 2013, or a total of $13.4 million. These dividends were fully paid in December 2013.
F-40
Table of Contents
Report of Independent Auditors
To the Board of Directors and Stockholders of SOI Holdings, Inc.
In our opinion, the accompanying consolidated statements of operations, of stockholders’ deficit and of cash flows for the years ended December 31, 2011, 2010 and 2009 present fairly, in all material respects, the results of operations and cash flows of SOI Holdings, Inc. and its subsidiaries for the years ended December 31, 2011, 2010 and 2009 in conformity with accounting principles generally accepted in the United States of America. These financial statements are the responsibility of the Company’s management. Our responsibility is to express an opinion on these financial statements based on our audits. We conducted our audits of these statements in accordance with auditing standards generally accepted in the United States of America. Those standards require that we plan and perform the audit to obtain reasonable assurance about whether the financial statements are free of material misstatement. An audit includes examining, on a test basis, evidence supporting the amounts and disclosures in the financial statements, assessing the accounting principles used and significant estimates made by management, and evaluating the overall financial statement presentation. We believe that our audits provide a reasonable basis for our opinion.
/s/ PricewaterhouseCoopers LLP
Charlotte, North Carolina
April 13, 2012, except for the effects of the restatement described in the last paragraph of Note 2, as to which the date is November 18, 2013
F-41
Table of Contents
SOI Holdings, Inc. and Subsidiaries
CONSOLIDATED STATEMENTS OF OPERATIONS
Years ended December 31, 2009, 2010 and 2011
and nine months ended September 30, 2011 and 2012
(In thousands)
| Year Ended December 31, |
Nine Months Ended September 30, |
|||||||||||||||||||
| 2009 | 2010 | 2011 | 2011 | 2012 | ||||||||||||||||
| (unaudited) | ||||||||||||||||||||
| Revenues |
$ | 240,375 | $ | 296,139 | $ | 373,415 | $ | 273,982 | $ | 322,912 | ||||||||||
| Cost of revenues (excluding depreciation of $435, $636 and $743 in 2009, 2010 and 2011, respectively, $524 and $709 (unaudited), in nine months ended September 30, 2011 and 2012, respectively |
193,847 | 246,791 | 306,209 | 226,907 | 265,387 | |||||||||||||||
|
|
|
|
|
|
|
|
|
|
|
|||||||||||
| Gross profit |
46,528 | 49,348 | 67,206 | 47,075 | 57,525 | |||||||||||||||
| Operating expenses: |
||||||||||||||||||||
| Selling, general and administrative expenses |
33,424 | 37,107 | 44,944 | 32,908 | 37,577 | |||||||||||||||
| Depreciation and amortization |
1,182 | 1,607 | 1,903 | 1,353 | 1,764 | |||||||||||||||
| Other |
470 | 476 | 215 | 137 | 1,647 | |||||||||||||||
|
|
|
|
|
|
|
|
|
|
|
|||||||||||
| Operating profit |
11,452 | 10,158 | 20,144 | 12,677 | 16,537 | |||||||||||||||
|
|
|
|
|
|
|
|
|
|
|
|||||||||||
| Interest income (expense): |
||||||||||||||||||||
| Interest income |
35 | 2 | 2 | 1 | 20 | |||||||||||||||
| Interest expense |
(3,934 | ) | (5,690 | ) | (5,272 | ) | (4,081 | ) | (3,245 | ) | ||||||||||
|
|
|
|
|
|
|
|
|
|
|
|||||||||||
| Interest expense, net |
(3,899 | ) | (5,688 | ) | (5,270 | ) | (4,080 | ) | (3,225 | ) | ||||||||||
|
|
|
|
|
|
|
|
|
|
|
|||||||||||
| Income before income taxes |
7,553 | 4,470 | 14,874 | 8,597 | 13,312 | |||||||||||||||
| Provision for income taxes |
2,922 | 1,745 | 4,977 | 2,759 | 4,843 | |||||||||||||||
|
|
|
|
|
|
|
|
|
|
|
|||||||||||
| Net income |
$ | 4,631 | $ | 2,725 | $ | 9,897 | $ | 5,838 | $ | 8,469 | ||||||||||
|
|
|
|
|
|
|
|
|
|
|
|||||||||||
The accompanying notes are an integral part of these consolidated financial statements.
F-42
Table of Contents
SOI Holdings, Inc. and Subsidiaries
CONSOLIDATED STATEMENTS OF STOCKHOLDERS’ DEFICIT
Years ended December 31, 2009, 2010 and 2011 and
nine months ended September 30, 2012
(In thousands)
| Common Stock | Excess Purchase Price Over Predecessor Basis of Net Assets Acquired |
Additional Paid-in Capital |
Accumulated Deficit |
Total | ||||||||||||||||||||
| Shares | Amount | |||||||||||||||||||||||
| Balance at January 1, 2009 |
327,219 | $ | 3 | $ | (7,206 | ) | $ | 733 | $ | (20,836 | ) | $ | (27,306 | ) | ||||||||||
| Stock-based compensation expense |
— | — | — | 202 | — | 202 | ||||||||||||||||||
| Issuance of common stock warrants |
— | — | — | 761 | — | 761 | ||||||||||||||||||
| Net income |
— | — | — | — | 4,631 | 4,631 | ||||||||||||||||||
|
|
|
|
|
|
|
|
|
|
|
|
|
|||||||||||||
| Balance at December 31, 2009 |
327,219 | $ | 3 | $ | (7,206 | ) | $ | 1,696 | $ | (16,205 | ) | $ | (21,712 | ) | ||||||||||
| Stock-based compensation expense |
— | — | — | 96 | — | 96 | ||||||||||||||||||
| Net income |
— | — | — | — | 2,725 | 2,725 | ||||||||||||||||||
|
|
|
|
|
|
|
|
|
|
|
|
|
|||||||||||||
| Balance at December 31, 2010 |
327,219 | $ | 3 | $ | (7,206 | ) | $ | 1,792 | $ | (13,480 | ) | $ | (18,891 | ) | ||||||||||
| Stock-based compensation expense |
— | — | — | 33 | — | 33 | ||||||||||||||||||
| Net income |
— | — | — | — | 9,897 | 9,897 | ||||||||||||||||||
|
|
|
|
|
|
|
|
|
|
|
|
|
|||||||||||||
| Balance at December 31, 2011 |
327,219 | $ | 3 | $ | (7,206 | ) | $ | 1,825 | $ | (3,583 | ) | $ | (8,961 | ) | ||||||||||
| Stock-based compensation expense |
— | — | — | 173 | — | 173 | ||||||||||||||||||
| Net income |
— | — | — | — | 8,469 | 8,469 | ||||||||||||||||||
|
|
|
|
|
|
|
|
|
|
|
|
|
|||||||||||||
| Balance at September 30, 2012 |
327,219 | $ | 3 | $ | (7,206 | ) | $ | 1,998 | $ | 4,886 | $ | (319 | ) | |||||||||||
|
|
|
|
|
|
|
|
|
|
|
|
|
|||||||||||||
The accompanying notes are an integral part of these consolidated financial statements.
F-43
Table of Contents
SOI Holdings, Inc. and Subsidiaries
CONSOLIDATED STATEMENTS OF CASH FLOWS
Years ended December 31, 2009, 2010 and 2011
and nine months ended September 30, 2011 and 2012
(in thousands)
| Year Ended December 31, |
Nine Months
Ended September 30, |
|||||||||||||||||||
| 2009 | 2010 | 2011 | 2011 | 2012 | ||||||||||||||||
| (unaudited) | ||||||||||||||||||||
| Cash from operating activities |
||||||||||||||||||||
| Net income |
$ | 4,631 | $ | 2,725 | $ | 9,897 | $ | 5,838 | $ | 8,469 | ||||||||||
| Adjustments to reconcile net income to net cash provided by operating activities: |
||||||||||||||||||||
| Depreciation and amortization |
1,182 | 1,607 | 1,903 | 1,353 | 1,764 | |||||||||||||||
| Amortization of debt issuance costs |
1,234 | 2,010 | 1,466 | 1,328 | 405 | |||||||||||||||
| Stock-based compensation |
202 | 96 | 33 | 28 | 173 | |||||||||||||||
| Loss (gain) on derivative instruments |
(621 | ) | — | 54 | — | 9 | ||||||||||||||
| Loss on disposal of assets |
12 | 145 | 11 | — | — | |||||||||||||||
| Deferred income taxes |
12,337 | 1,662 | 4,927 | 2,807 | 4,902 | |||||||||||||||
| Changes in operating assets and liabilities: |
||||||||||||||||||||
| Receivables |
3,152 | (11,255 | ) | (14,932 | ) | (13,819 | ) | (16,573 | ) | |||||||||||
| Prepaid expenses and other assets |
(3,543 | ) | 2,547 | (1,618 | ) | 481 | (3,014 | ) | ||||||||||||
| Book overdraft |
(664 | ) | (171 | ) | (26 | ) | 30 | 11 | ||||||||||||
| Customer deposits |
902 | 2,780 | 1,508 | 1,248 | 342 | |||||||||||||||
| Payroll taxes and other withholdings |
5,325 | (1,750 | ) | 5,530 | 3,378 | 2,220 | ||||||||||||||
| Accrued wages and cost of revenues |
(9,448 | ) | 9,618 | 15,256 | 12,354 | 14,872 | ||||||||||||||
| Accrued and other liabilities |
(5,359 | ) | 2,057 | (5,959 | ) | 3,021 | (1,756 | ) | ||||||||||||
|
|
|
|
|
|
|
|
|
|
|
|||||||||||
| Net cash provided by operating activities |
9,342 | 12,071 | 18,050 | 18,047 | 11,824 | |||||||||||||||
|
|
|
|
|
|
|
|
|
|
|
|||||||||||
| Cash flows from investing activities |
||||||||||||||||||||
| Additions to property, equipment and computer software |
(1,964 | ) | (1,843 | ) | (2,184 | ) | (1,437 | ) | (1,600 | ) | ||||||||||
| Proceeds from the sale of assets |
1 | 39 | 113 | 113 | 1 | |||||||||||||||
| Decrease (Increase) in restricted cash |
(50 | ) | (1,042 | ) | 245 | 219 | 427 | |||||||||||||
|
|
|
|
|
|
|
|
|
|
|
|||||||||||
| Net cash used in investing activities |
(2,013 | ) | (2,846 | ) | (1,826 | ) | (1,105 | ) | (1,172 | ) | ||||||||||
|
|
|
|
|
|
|
|
|
|
|
|||||||||||
| Cash flows from financing activities |
||||||||||||||||||||
| Proceeds from borrowings |
3,000 | — | 35,000 | 35,000 | — | |||||||||||||||
| Repayments of borrowings |
(9,269 | ) | (8,339 | ) | (37,760 | ) | (36,630 | ) | (3,991 | ) | ||||||||||
| Payment of loan costs |
— | (104 | ) | (2,700 | ) | (2,651 | ) | — | ||||||||||||
| Other financing activities |
(838 | ) | — | (65 | ) | (64 | ) | — | ||||||||||||
|
|
|
|
|
|
|
|
|
|
|
|||||||||||
| Net cash used in financing activities |
(7,107 | ) | (8,443 | ) | (5,525 | ) | (4,345 | ) | (3,991 | ) | ||||||||||
|
|
|
|
|
|
|
|
|
|
|
|||||||||||
| Net increase in cash and cash equivalents |
222 | 782 | 10,699 | 12,597 | 6,661 | |||||||||||||||
| Cash and cash equivalents |
||||||||||||||||||||
| Beginning of period |
10,626 | 10,848 | 11,630 | 11,630 | 22,329 | |||||||||||||||
|
|
|
|
|
|
|
|
|
|
|
|||||||||||
| End of period |
$ | 10,848 | $ | 11,630 | $ | 22,329 | $ | 24,227 | $ | 28,990 | ||||||||||
|
|
|
|
|
|
|
|
|
|
|
|||||||||||
| Supplemental disclosures of cash flow information |
||||||||||||||||||||
| Cash paid during the period for: |
||||||||||||||||||||
| Interest |
$ | 2,718 | $ | 2,975 | $ | 2,624 | $ | 2,097 | $ | 1,848 | ||||||||||
| Income taxes (net of refund) |
(3,914 | ) | (2,885 | ) | 74 | 75 | 74 | |||||||||||||
| Noncash investing and financing activities |
||||||||||||||||||||
| Capital lease obligation |
$ | 66 | $ | 1,064 | $ | 628 | $ | 349 | $ | 280 | ||||||||||
| Software licenses financed |
— | 275 | — | — | — | |||||||||||||||
The accompanying notes are an integral part of these consolidated financial statements.
F-44
Table of Contents
SOI Holdings, Inc. and Subsidiaries
NOTES TO CONSOLIDATED FINANCIAL STATEMENTS
(In thousands, except per share data)
| 1. | ORGANIZATION AND NATURE OF BUSINESS |
Nature of Operations
SOI Holdings, Inc. is the parent company of Strategic Outsourcing, Inc. (“SOI”), which constitutes its sole asset (collectively, the “Company”). As of December 31, 2011, the Company owned 100% of the capital stock of 46 active subsidiary companies. SOI is a professional employer organization (“PEO”) that provides a comprehensive human resources solution for its clients including payroll processing, human resources consultation and related resources, risk management related services and health, welfare and other benefits. SOI provides services to a diversified group of small and medium–sized businesses throughout the United States and currently has offices in 20 markets in 11 states. Approximately 71.6%, 69.6% and 72.8% of the Company’s gross billings were concentrated in three states for the years ended December 31, 2009, 2010 and 2011, respectively.
In a PEO arrangement, the PEO provides services to its clients designed to reduce human resources related administrative burdens, provide support for regulatory compliance and to help manage human resource related costs and improve employee satisfaction and retention. The client retains control over operating its business and over matters such as hiring related decisions and day-to-day supervision of its worksite employees. Additionally, the client controls the setting of worksite employee compensation, training and complying with applicable regulations. The PEO charges its clients a service fee which is based upon a percentage of the worksite employee payroll costs including amounts related to employment related taxes and workers compensation insurance and other benefits, if elected to be taken by the client.
Ownership, Acquisition and Basis of Presentation
Since August 2005, majority ownership of the Company has been held by SOI Investors LLC (an unrelated company) and a member of management. SOI Investors LLC is controlled by Clarion Capital Partners, LLC (“Clarion”) and its affiliates. The Company previously was a wholly owned subsidiary of a large financial company.
The acquisition was accounted for as a leveraged buyout whereby a portion of the former owner’s historical basis has been assigned to the assets and liabilities of the Company. The remainder of the investment in the assets and liabilities (i.e., the percentage acquired by Clarion and management) were recorded at fair value. As a result, the assets and liabilities were assigned values, part carryover basis and part fair value, in conformity with accounting principles generally accepted in the United States (“GAAP”), at the time of transaction.
| 2. | PRINCIPLES OF CONSOLIDATION AND SUMMARY OF SIGNIFICANT ACCOUNTING POLICIES |
Principles of Consolidation and Basis of Presentation
The accompanying consolidated financial statements include the accounts of SOI Holdings, Inc. and its subsidiaries after elimination of all significant intercompany accounts and transactions.
In the opinion of management, the accompanying unaudited interim financial statements for the nine months ended September 30, 2011 and 2012 include all adjustments, consisting of normal recurring items, necessary for their fair statement in accordance with generally accepted accounting principles.
Segment Reporting
The Company’s operations are managed and reported in one reportable segment.
F-45
Table of Contents
SOI Holdings, Inc. and Subsidiaries
NOTES TO CONSOLIDATED FINANCIAL STATEMENTS (Continued)
(In thousands, except per share data)
Use of Estimates
The accompanying consolidated financial statements are prepared in conformity with GAAP, which requires the Company to make certain estimates and assumptions that affect the reported amounts of assets and liabilities and disclosure of contingent assets and liabilities at the date of the financial statements and the reported amounts of revenues and expenses during the reporting period. The Company bases estimates on historical experience and on various other assumptions that are believed to be reasonable under the circumstances including actuarially accepted quantitative and analytical methods in determining workers compensation accruals, health benefit claims accruals and expense recognized for retrospectively rated policies. The estimated value of the Company’s stock utilized in recognition of stock-based compensation expense and warrant costs are also a significant estimate. Actual results could differ from those estimates.
Comprehensive Income
Comprehensive income is equal to net income for all periods presented, as the Company has no items required to be recognized in accumulated other comprehensive income.
Cash and Cash Equivalents
Cash and cash equivalents consist of cash and highly liquid investments with original maturities of less than 90 days. Cash and cash equivalents are stated at cost, which approximates fair value. The Company has restricted cash used to fund medical benefits and serve as collateral for licensing bonds. Restricted cash is included in current assets due to the short-term nature of the medical benefits being funded.
Property, Equipment and Computer Software
Property and equipment are stated at cost less accumulated depreciation and amortization. Maintenance, repairs and minor replacements are expensed as incurred; major replacements and improvements are capitalized. Upon retirement or disposal of properties, the cost and accumulated depreciation and amortization are removed from the accounts and any gain or loss is reflected in selling, general and administrative expenses in the consolidated statements of operations. Depreciation and amortization are computed using the straight-line method over the estimated useful lives of the assets or the lease terms, generally three to five years for software and office equipment, five to seven years for furniture and fixtures, and the shorter of the asset life or the remaining lease term for leasehold improvements.
The Company reviews its property and equipment amounts for impairment whenever events or changes in circumstances indicate that the carrying amount of an asset or asset group may not be recoverable. An impairment loss is recognized if the carrying amount of the asset exceeds the estimated undiscounted cash flows expected to be generated from the asset. The amount of the impairment loss recorded is calculated as the excess of the asset’s carrying value over its fair value. Fair value is generally determined using a discounted cash flow analysis. The Company has determined that no impairment of property and equipment existed as of December 31, 2009, 2010 and 2011 and September 30, 2011 and 2012.
The Company capitalizes internally developed software on a project by project basis. Amortization of capitalized software is computed over a period of 5 years, which is the expected useful life of the software. Amortization of capitalized software is included in depreciation and amortization on expense and totaled $759, $1,109 and $1,341 for the years ended December 31, 2009, 2010 and 2011, respectively. Amortization of capitalized software is included in depreciation and amortization expense and totaled $954 and $1,276 (unaudited) for the nine months ended September 30, 2011 and 2012, respectively.
F-46
Table of Contents
SOI Holdings, Inc. and Subsidiaries
NOTES TO CONSOLIDATED FINANCIAL STATEMENTS (Continued)
(In thousands, except per share data)
Goodwill, Intangible and Other Assets
The August 2005 acquisition included certain identifiable intangible assets and goodwill in the purchase price in the amounts of $21,974 and $46,089, respectively. Goodwill represents the excess of the purchase price over the fair value of the net assets at the date of acquisition. Intangible and other assets consist of debt issuance costs and other identifiable intangible assets. Goodwill is not amortized, but is tested for impairment annually and between annual tests if an event occurs or circumstances change that would indicate the carrying amount may be impaired. The Company determined there was no impairment of goodwill as of December 31, 2009, 2010 and 2011, based on its annual test. Other intangible assets, principally software programs, are amortized on a straight-line basis over a 12 year period. Capitalized debt issuance costs are amortized over the term of the debt agreement.
Intangible assets with finite lives are tested for impairment whenever events or circumstances indicate that the carrying amount of the asset may exceed the estimated undiscounted cash flows used in determining the fair value of the asset. The Company has determined that no impairment of the intangible assets existed as of December 31, 2009, 2010 and 2011. Amortization expense for all other intangible assets totaled approximately $54 for each of the years ended 2009, 2010 and 2011. Amortization expense for all other intangible assets totaled approximately $40 (unaudited) for the nine months ended September 30, 2011 and 2012.
Workers Compensation Insurance
The Company maintains a loss sensitive workers compensation program with an insurance company. The insured loss sensitive program provides insurance coverage for claims incurred in each plan year but which will be paid out over future periods. An affiliate of the insurance company acts as a third party administrator to process claims, for which it is paid an administrative fee. In states where private insurance is not permitted, customer employees are covered by state insurance funds.
Workers compensation expense for each year is based upon premiums paid to the carrier for the current year coverage, estimated total cost of claims to be paid by the Company that fall within the policy deductible and the administrative costs of the programs. Additionally, any revisions to the ultimate loss estimates of the prior years’ loss sensitive programs are recognized in the current year.
At least annually, the Company obtains from an independent actuary a calculation of the estimated cost of claims incurred based on its current and historical loss development trends which is used by management to develop the overall loss estimates related to each open program year. The estimated cost of the claims calculated may be subsequently revised by the Company with assistance from the independent actuary based on future developments relating to such claims.
Health Benefits
Claims incurred under health benefit plans are expensed as incurred according to the terms of each contract. For certain contracts, liability accruals are established for the benefit claims reported but not yet paid and claims that have been incurred but not yet reported to the Company.
Employment Practices Liability Insurance
The Company has an Employment Practices Liability Insurance (“EPLI”) policy with an independent insurance company that covers the Company and its clients. The Company and its clients share the cost of claims up to a $75 deductible per claim under this insurance agreement. The process by which the accrual is established is based on information regarding the litigation outstanding and estimates based on experience. These estimates are revised and adjustments, as necessary, are recorded in the period in which additional data is received.
F-47
Table of Contents
SOI Holdings, Inc. and Subsidiaries
NOTES TO CONSOLIDATED FINANCIAL STATEMENTS (Continued)
(In thousands, except per share data)
Income Taxes
The Company accounts for income taxes under the asset and liability method whereby deferred tax assets and liabilities are measured using enacted tax laws and rates expected to apply to taxable income in the years in which the assets and liabilities are expected to be recovered or settled. The effects on deferred tax assets and liabilities of subsequent changes in the tax laws and rates are recognized in income during the year the changes are enacted. A valuation allowance is provided for deferred tax assets when, in the opinion of management, it is more likely than not that the deferred tax assets will not be realized. The Company recognizes income tax positions that meet the more likely than not threshold and accrues interest related to unrecognized income tax positions, which is recorded as a component of the income tax provision.
Revenue Recognition
The Company reports revenue in conformity with GAAP, whereby certain amounts in the consolidated statements of operations are reported on a “gross” basis while other amounts are reported on a “net” basis.
Revenues are derived from gross client billings less aggregate worksite employee payroll. Gross billings are based on (i) the payroll cost, which includes wages, bonuses and related payroll taxes, of the client’s worksite employees; (ii) a service fee computed as a percentage of the payroll cost; and (iii) a charge for health benefits based on the number of participating worksite employees, if elected to be taken. Worksite employee payroll consists solely of the payroll associated with client employees. Among the factors considered in determining “net” versus “gross” reporting, are that the Company is not deemed to be the primary obligor for worksite employee payroll and, accordingly, such amounts are reported “net” in the consolidated statements of operations.
Revenues are recognized in the period that services are rendered to clients pursuant to the contract terms. Revenues also include unbilled amounts for work performed by client worksite employees that is unpaid at the end of each period. Worksite employee payroll costs are accrued as earned by the employee. Subsequent to the end of each period, unpaid worksite employee payroll costs are paid by the Company to the employees and any unbilled amounts are invoiced to the client.
Costs of revenues consist principally of (i) the client’s portion of worksite employee payroll related taxes; (ii) workers compensation costs; (iii) health benefits costs and; (iv) other employee benefits costs (e.g. 401(k) costs). These amounts are reported on a “gross” basis in the consolidated statements of operations as the Company is regarded as the primary obligor.
Revenues as reported in the consolidated statements of operations were as follows:
| Year
Ended December 31, |
Nine Months
Ended September 30, |
|||||||||||||||||||
| 2009 | 2010 | 2011 | 2011 | 2012 | ||||||||||||||||
| (unaudited) | ||||||||||||||||||||
| Gross billings |
$ | 1,443,828 | $ | 1,785,196 | $ | 2,327,521 | $ | 1,655,159 | $ | 2,015,780 | ||||||||||
| Worksite employee payroll |
(1,203,453 | ) | (1,489,057 | ) | (1,954,106 | ) | (1,381,177 | ) | (1,692,868 | ) | ||||||||||
|
|
|
|
|
|
|
|
|
|
|
|||||||||||
| Revenues |
$ | 240,375 | $ | 296,139 | $ | 373,415 | $ | 273,982 | $ | 322,912 | ||||||||||
|
|
|
|
|
|
|
|
|
|
|
|||||||||||
F-48
Table of Contents
SOI Holdings, Inc. and Subsidiaries
NOTES TO CONSOLIDATED FINANCIAL STATEMENTS (Continued)
(In thousands, except per share data)
Recent Accounting Pronouncements
In September 2011, the Financial Accounting Standards Board, or FASB, issued new guidance that will allow entities to first assess qualitative factors to determine whether it is necessary to perform the two-step quantitative goodwill impairment test. Previous guidance required an entity to test goodwill for impairment, on at least an annual basis, by comparing the fair value of a reporting unit with its carrying amount. If the fair value of a reporting unit is less than its carrying amount, then the second step of the test must be performed to measure the amount of the impairment loss, if any. Under the new guidance, the Company would not be required to calculate the fair value of a reporting unit unless it determines, based on the qualitative assessment, that it is more likely than not that its fair value is less than its carrying amount. The new guidance includes a number of events and circumstances for an entity to consider in conducting the qualitative assessment. The new guidance was effective beginning with annual and interim impairment tests performed in 2012. As the new guidance only affects the manner of assessment of goodwill for impairment, it will not have a material impact on the Company’s results of operations, financial condition, or cash flows.
In June 2011, the FASB issued amended accounting guidance related to presentation of comprehensive income. The standards update is intended to help financial statement users better understand the causes of an entity’s change in financial position and results of operations. It is effective for reporting periods beginning after December 15, 2011. The amendments eliminate the option to present components of other comprehensive income as part of the statement of changes in stockholders’ equity. The amendments require that all nonowner changes in stockholders’ equity be presented either in a single continuous statement of comprehensive income or in two separate but consecutive statements. The guidance also requires that reclassification adjustments for items that are reclassified from other comprehensive income to net income be presented on the face of the financial statement where the components of net income and other comprehensive income are presented.
Restatement of Previously Issued Consolidated Financial Statements
The Company previously restated its consolidated financial statements presented herein to correct certain errors primarily related to workers’ compensation and income taxes which have been reflected in these consolidated financial statements.
| 3. | EMPLOYEE BENEFIT PLANS |
The Company provides health and welfare employee benefit coverage to clients and employees in addition to a 401(k) defined contribution plan.
The 401(k) employee savings plan (the “Plan”) is a Multiple Employer Plan (“MEP”) administered by an independent insurance company and provides participants with a variety of investment options. Under the MEP, participating client companies select various eligibility, contribution, and vesting options. The determination of amounts, if any, of contributions by the Company to the Plan is subject to the sole discretion of the Company. Expense associated with these plans totaled $963, $929 and $1,295 in 2009, 2010 and 2011, respectively. Expense associated with these plans totaled $1,015 and $1,088 for the nine months ended September 30, 2011 and 2012, respectively (unaudited).
The Company has a health care trust (the “Trust”) through which it offers various medical benefits plans to clients and employees. The Company fully funds its aggregate liability under the plans into the Trust. The Trust funds all plan premiums, re-insurance premiums, and administrative costs, as well as claims under self-insured plans. The Trust has not sought or received a letter of qualification pursuant to section 501(c)(9) of the Internal Revenue Code (“IRC”) regarding its tax-exempt status. However, the Company’s management believes that the Trust qualifies in its design as well as operation with applicable regulations of the IRC.
F-49
Table of Contents
SOI Holdings, Inc. and Subsidiaries
NOTES TO CONSOLIDATED FINANCIAL STATEMENTS (Continued)
(In thousands, except per share data)
For clients based in states other than Florida, the Company primarily offers medical care benefits under an insurance policy with a major national provider which incorporates various HMO, PPO, and POS plans. The majority of these plans are subject to a contract that limits the Company’s annual liability. The Company also provides coverage under various regional medical benefit plans in certain areas of the country. These regional plans are subject to fixed cost contracts.
The Company’s primary medical care insurer for clients based in Florida is a leading provider of medical care benefits in that state. The Company’s policy with this provider is a minimum premium policy under which the Company is obligated to reimburse the provider for the cost of the claims incurred by participants under the plan, plus the cost of plan administration.
The Company has a minimum premium policy with a specific liability limitation for the Company of $250 per participant per plan year.
The Company offers a PPO dental plan which is also subject to a fixed cost contract. In addition, the Company offers various fixed cost insurance programs through various providers for vision care, life, accidental death and dismemberment, short-term disability and long-term disability coverage.
Health benefit accruals are based primarily on management’s estimates which utilize estimates of claims incurred but not reported and for claims reported but not yet paid. The assumptions used in determining the liability are regularly reviewed and any adjustment resulting from these reviews is reflected in current estimates.
| 4. | INCOME TAXES |
Components of income tax expense for the years ended December 31, 2009, 2010 and 2011 are as follows:
| Year
Ended December 31, |
||||||||||||
| 2009 | 2010 | 2011 | ||||||||||
| Current |
||||||||||||
| Federal |
$ | (8,467 | ) | $ | — | $ | — | |||||
| State |
(948 | ) | 83 | 49 | ||||||||
|
|
|
|
|
|
|
|||||||
| (9,415 | ) | 83 | 49 | |||||||||
|
|
|
|
|
|
|
|||||||
| Deferred |
||||||||||||
| Federal |
11,751 | 1,589 | 5,267 | |||||||||
| State |
586 | 73 | (339 | ) | ||||||||
|
|
|
|
|
|
|
|||||||
| 12,337 | 1,662 | 4,928 | ||||||||||
|
|
|
|
|
|
|
|||||||
| Total provision |
$ | 2,922 | $ | 1,745 | $ | 4,977 | ||||||
|
|
|
|
|
|
|
|||||||
F-50
Table of Contents
SOI Holdings, Inc. and Subsidiaries
NOTES TO CONSOLIDATED FINANCIAL STATEMENTS (Continued)
(In thousands, except per share data)
The reconciliations of taxes based on the U.S. federal statutory rate of 35.0% for the years ended December 31, 2009, 2010 and 2011 are as follows:
| Year
Ended December 31, |
||||||||||||
| 2009 | 2010 | 2011 | ||||||||||
| Income taxes (benefit) at the federal statutory rate |
$ | 2,643 | $ | 1,565 | $ | 5,206 | ||||||
| Change in state valuation allowance |
(230 | ) | (41 | ) | 137 | |||||||
| Federal tax payable reserve adjustment |
(258 | ) | 42 | 66 | ||||||||
| State income taxes, net of federal benefit |
719 | 130 | 422 | |||||||||
| State income tax credit, net of federal benefit |
— | (4 | ) | (909 | ) | |||||||
| Other, net |
48 | 53 | 55 | |||||||||
|
|
|
|
|
|
|
|||||||
| Provisions for income taxes |
$ | 2,922 | $ | 1,745 | $ | 4,977 | ||||||
|
|
|
|
|
|
|
|||||||
| 5. | LEASES |
The Company leases office equipment and space under noncancelable operating and capital lease agreements, some of which contain escalation clauses. Rent expense for the years ended December 31, 2009, 2010 and 2011 totaled approximately $1,410, $1,515 and $1,616, respectively. Rent expense for the nine months ended September 30, 2011 and 2012 totaled approximately $1,195 and $1,437 (unaudited), respectively. As of December 31, 2011, minimum future rental payments under these capital and noncancelable operating leases having original terms in excess of one year are as follows:
| Capital | Operating | |||||||
| 2012 |
$ | 519 | $ | 1,494 | ||||
| 2013 |
551 | 1,299 | ||||||
| 2014 |
266 | 1,104 | ||||||
| 2015 |
— | 857 | ||||||
| 2016 |
— | 486 | ||||||
|
|
|
|
|
|||||
| Total minimum lease payments |
1,336 | $ | 5,240 | |||||
|
|
|
|||||||
| Less: Amount representing interest |
(71 | ) | ||||||
|
|
|
|||||||
| Present value of minimum lease payments |
1,265 | |||||||
| Less: Current portion |
(479 | ) | ||||||
|
|
|
|||||||
| Long-term obligations under capital lease |
$ | 786 | ||||||
|
|
|
|||||||
| 6. | COMMITMENTS AND CONTINGENCIES |
State Regulation
The Company is subject to licensing regulations in certain states, which require among other things that the Company meet certain minimum net worth, working capital and other financial and legal requirements. The Company believes it has fully complied in all material respects with all applicable state regulations regarding minimum net worth, working capital and all other financial and legal requirements.
F-51
Table of Contents
SOI Holdings, Inc. and Subsidiaries
NOTES TO CONSOLIDATED FINANCIAL STATEMENTS (Continued)
(In thousands, except per share data)
Litigation
The Company has certain contingent liabilities resulting from litigation and claims incidents in the ordinary course of business, all of which are being defended vigorously. Management believes that the probable resolution of such contingencies will not materially affect the Company’s financial position or results of operations. However, the defense and settlement of these claims may impact the future availability of, and retention amounts and cost to the Company, for applicable insurance coverage.
| 7. | STOCK OPTIONS |
The Company’s 2005 Stock Option Plan, as amended, provides for issuance of options to purchase up to 45,000 shares of common stock. Awards may be granted to nonemployee directors on an annual basis and to employees as determined by the Company’s Board of Directors. Granted options carry a term of 10 years with vesting ratably over three years. The Company utilizes the Black-Scholes valuation model which relies on certain assumptions to estimate an option’s fair value.
Determining the fair value of the Company’s stock requires making complex and subjective judgments. There is inherent uncertainty in the use of estimates and judgments and there can be no certainty that the estimated fair values can be realized due to there being no readily available market for the shares of the Company.
The Company used the following key assumptions, among others, in determining the estimated fair value of the Company’s common stock of $190.60 for options granted in 2009: (i) estimated cash flows from operating and investing activities growth rate of 3.7%, (ii) discount rate on estimated projected cash flows of 9.5%, and (iii) terminal cash flow multiple changing of 5.0. For 2009, the Company calculated the value of its common stock based on discounted cash flows less current debt. The Company used an independent valuation to estimate the fair value of the Company’s stock for options granted in 2010 of $175.72.
Stock Option Awards
A summary of the activity of the Company’s common stock option awards during the years ended December 31, 2009, 2010 and 2011 is as follows:
| 2009 | 2010 | 2011 | ||||||||||||||||||||||
| Number | Weighted Average Exercise Price |
Number | Weighted Average Exercise Price |
Number | Weighted Average Exercise Price |
|||||||||||||||||||
| Outstanding at beginning of year |
3,150 | $ | 191.60 | 3,550 | $ | 201.55 | 4,475 | $ | 197.25 | |||||||||||||||
| Granted |
400 | 190.06 | 975 | 175.72 | — | — | ||||||||||||||||||
| Exercised |
— | — | — | — | — | — | ||||||||||||||||||
| Forfeited |
— | — | (50 | ) | 148.15 | — | — | |||||||||||||||||
|
|
|
|
|
|
|
|||||||||||||||||||
| Outstanding at end of year |
3,550 | $ | 201.55 | 4,475 | $ | 197.25 | 4,475 | $ | 196.19 | |||||||||||||||
|
|
|
|
|
|
|
|||||||||||||||||||
F-52
Table of Contents
SOI Holdings, Inc. and Subsidiaries
NOTES TO CONSOLIDATED FINANCIAL STATEMENTS (Continued)
(In thousands, except per share data)
The following table provides the remaining contractual term of stock options outstanding at December 31, 2011:
| Outstanding Options | ||||||||
| Number | Weighted Average Remaining Contractual Life (Years) |
Weighted Average Exercise Price |
Aggregate Intrinsic Value | |||||
| Outstanding |
4,475 |
6.4 | $196.19 | $225 | ||||
| Exercisable |
3,692 | 6.0 | $199.99 | $225 | ||||
The weighted-average grant-date fair value of stock options vested in the years ended December 31, 2009, 2010 and 2011 was $263.90, $243.08 and $205.72, respectively.
Employee Stock-Based Compensation
Compensation cost for employee stock-based awards is based on the estimated grant-date fair value and is recognized over the vesting period of the applicable award on a straight-line basis. For the years ended December 31, 2009 and 2010, the Company issued employee stock-based awards in the form of stock options with a weighted average grant-date fair value of $81.73 and $71.58 per option, respectively.
The Company uses the Black-Scholes pricing model to determine the fair value of stock options. The determination of the fair value of stock-based payment awards on the date of grant is affected by the estimated stock price as well as assumptions regarding a number of complex and subjective variables. These variables include expected stock price volatility over the term of the awards, actual and projected employee stock option exercise behaviors, risk-free interest rates and expected dividends. The estimated grant-date fair values of the employee stock options were calculated using the Black-Scholes valuation model, based on the following assumptions.
Expected Life
The expected life of six years for the 2009 and 2010 option was estimated using the Securities and Exchange Commission’s Staff Accounting Bulletin (SAB) 110 “simplified” method.
Volatility
The Company is a private entity with no historical data regarding the volatility of its common stock. Accordingly, the expected volatility of 41% used for 2009 and 37% used for 2010 is based on volatility of similar entities, referred to as “guideline” companies. In evaluating similarity, the Company considered factors such as industry, stage of life cycle and size.
Risk-Free Interest Rate
The risk-free rate used of 2.38% for 2009 and 2.25% for 2010 is based on U.S. Treasury zero-coupon issues with remaining terms similar to the expected term on the options.
Dividend Yield
Although the Company paid a special cash dividend in December 2007 it does not expect to pay regular cash dividends in the foreseeable future, and, accordingly, used an expected dividend yield of zero in the valuation model.
F-53
Table of Contents
SOI Holdings, Inc. and Subsidiaries
NOTES TO CONSOLIDATED FINANCIAL STATEMENTS (Continued)
(In thousands, except per share data)
Forfeitures
The Company estimates forfeitures at the grant date, and revise such estimates in subsequent periods if actual forfeitures differ from those estimates. The Company uses historical data to estimate pre-vesting option forfeitures and record stock-based compensation expense only for those awards that are expected to vest. All stock-based payment awards are amortized on a straight-line basis over the requisite service periods of the awards, which are generally the vesting periods. If the Company’s actual forfeiture rate is materially different from its estimate, the stock-based compensation expense could be significantly different from what the Company has recorded in the current period.
As of December 31, 2009, 2010 and 2011, there was $86, $46 and $13, respectively, of total unrecognized compensation cost related to unvested common stock options. This cost will be recognized over the remaining weighted-average vesting period of approximately 0.6 years.
During the years ended December 31, 2009, 2010 and 2011, the Company recognized stock-based compensation expense of $202, $96 and $33, respectively. During the nine months ended September 30, 2011 and 2010, the Company recognized stock-based compensation expense of $27 and $173, respectively.
| 8. | RELATED PARTY TRANSACTIONS |
The Company has an annually renewable contract for consulting and advisory services with an affiliate of Clarion not to exceed $400 in any one calendar year plus out of pocket expenses. Costs (including out of pocket expenses) for these services are included in other operating expenses and totaled approximately $431, $426 and $422 during the years ended December 31, 2009, 2010 and 2011, respectively. Costs totaled approximately $317 and $313 (unaudited) during the nine months ended September 30, 2011 and 2012, respectively. These expenses are paid quarterly.
| 9. | SUBSEQUENT EVENTS |
Original issuance
The Company evaluated subsequent events through April 13, 2012, the date these financial statements were originally issued or available to be issued.
Subsequent issuance (unaudited)
The Company has also evaluated subsequent events through November 18, 2013, the date of reissuance of these financial statements. On October 24, 2012, TriNet Group, Inc. acquired 100% of the outstanding equity of SOI Holdings, Inc., the parent company of Strategic Outsourcing, Inc. The estimated acquisition date fair value of consideration transferred totaled $195.8 million.
F-54
Table of Contents
To the Members
Ambrose Employer Group, LLC
We have audited the accompanying consolidated financial statements of Ambrose Employer Group, LLC and Subsidiary, which comprise the consolidated balance sheets as of December 31, 2011 and 2012, and the related consolidated statements of income, changes in members’ equity and cash flows for each of the three years in the period ended December 31, 2012, and the related notes to the consolidated financial statements.
Management’s Responsibility for the Financial Statements
Management is responsible for the preparation and fair presentation of these consolidated financial statements in accordance with accounting principles generally accepted in the United States of America; this includes the design, implementation, and maintenance of internal control relevant to the preparation and fair presentation of consolidated financial statements that are free from material misstatement, whether due to fraud or error.
Auditor’s Responsibility
Our responsibility is to express an opinion on these consolidated financial statements based on our audits. We conducted our audits in accordance with auditing standards generally accepted in the United States of America. Those standards require that we plan and perform the audit to obtain reasonable assurance about whether the consolidated financial statements are free from material misstatement.
An audit involves performing procedures to obtain audit evidence about the amounts and disclosures in the consolidated financial statements. The procedures selected depend on the auditor’s judgment, including the assessment of the risks of material misstatement of the consolidated financial statements, whether due to fraud or error. In making those risk assessments, the auditor considers internal control relevant to the entity’s preparation and fair presentation of the consolidated financial statements in order to design audit procedures that are appropriate in the circumstances, but not for the purpose of expressing an opinion on the effectiveness of the entity’s internal control. Accordingly, we express no such opinion. An audit also includes evaluating the appropriateness of accounting policies used and the reasonableness of significant accounting estimates made by management, as well as evaluating the overall presentation of the consolidated financial statements.
We believe that the audit evidence we have obtained is sufficient and appropriate to provide a basis for our audit opinion.
Opinion
In our opinion, the consolidated financial statements referred to above present fairly, in all material respects, the financial position of Ambrose Employer Group, LLC and Subsidiary as of December 31, 2011 and 2012, and the results of their operations and their cash flows for each of the three years in the period ended December 31, 2012 in accordance with accounting principles generally accepted in the United States of America.
/s/ CohnReznick LLP
New York, New York
May 2, 2013
F-55
Table of Contents
Ambrose Employer Group, LLC and Subsidiary
CONSOLIDATED BALANCE SHEETS
(In thousands)
| December 31, | June
30, 2013 |
|||||||||||
| 2011 | 2012 | |||||||||||
| (unaudited) | ||||||||||||
| Assets |
||||||||||||
| Current assets: |
||||||||||||
| Cash and cash equivalents |
$ | 353,921 | $ | 444,474 | $ | 62,193 | ||||||
| Accounts receivable |
1,087 | 742 | 1,446 | |||||||||
| Prepaid expenses and other current assets |
1,792 | 1,183 | 893 | |||||||||
|
|
|
|
|
|
|
|||||||
| Total current assets |
356,800 | 446,399 | 64,532 | |||||||||
| Restricted cash |
442 | 442 | 442 | |||||||||
| Equipment and leasehold improvements, net |
446 | 627 | 891 | |||||||||
| Software costs, net of accumulated amortization of $1,657, $1,688, and $1,884 |
836 | 634 | 467 | |||||||||
| Intangible asset |
50 | 50 | 50 | |||||||||
| Other assets |
310 | 344 | 209 | |||||||||
|
|
|
|
|
|
|
|||||||
| Totals |
$ | 358,884 | $ | 448,496 | $ | 66,591 | ||||||
|
|
|
|
|
|
|
|||||||
| Liabilities and Members’ Equity |
||||||||||||
| Current liabilities: |
||||||||||||
| Payroll tax liabilities |
$ | 324,738 | $ | 395,814 | $ | 33,731 | ||||||
| Accrued serviced employee benefits |
8,883 | 11,081 | 5,974 |
|||||||||
| Client deposits payable |
10,228 | 20,084 | 13,410 | |||||||||
| Accounts payable and accrued liabilities |
1,215 | 3,473 | 5,646 | |||||||||
|
|
|
|
|
|
|
|||||||
| Total current liabilities |
345,064 | 430,452 | 58,761 | |||||||||
| Deferred rent |
124 | 145 | 126 | |||||||||
| Other long term liabilities |
— | — | 350 | |||||||||
|
|
|
|
|
|
|
|||||||
| Total liabilities |
345,188 | 430,597 | 59,237 | |||||||||
| Commitments and contingencies |
||||||||||||
| Members’ equity |
13,696 | 17,899 | 7,354 | |||||||||
|
|
|
|
|
|
|
|||||||
| Totals |
$ | 358,884 | $ | 448,496 | $ | 66,591 | ||||||
|
|
|
|
|
|
|
|||||||
See accompanying notes to consolidated financial statements.
F-56
Table of Contents
Ambrose Employer Group, LLC and Subsidiary
CONSOLIDATED STATEMENTS OF INCOME
(In thousands)
| Years
Ended December 31, |
Six Months Ended June 30, |
|||||||||||||||||||
| 2010 | 2011 | 2012 | 2012 | 2013 | ||||||||||||||||
| (unaudited) | ||||||||||||||||||||
| Gross revenues (includes gross billings in billions of $2.44, $2.69, $3.29, $1.47, and $1.82 less serviced employee wages of $2.24, $2.47, $2.97, $1.30 and $1.60) |
$ | 198,500 | $ | 245,049 | $ | 316,403 | $ | 160,169 | $ | 199,878 | ||||||||||
|
|
|
|
|
|
|
|
|
|
|
|||||||||||
| Direct costs |
||||||||||||||||||||
| Serviced employee benefits |
89,967 | 120,215 | 157,301 | 75,429 | 98,753 | |||||||||||||||
| Employment taxes |
83,001 | 95,393 | 120,203 | 66,818 | 79,715 | |||||||||||||||
| Other direct costs |
816 | 740 | 1,046 | 479 | (95 | ) | ||||||||||||||
|
|
|
|
|
|
|
|
|
|
|
|||||||||||
| 173,784 | 216,348 | 278,550 | 142,726 | 178,373 | ||||||||||||||||
|
|
|
|
|
|
|
|
|
|
|
|||||||||||
| Net revenues |
24,716 | 28,701 | 37,853 | 17,443 | 21,505 | |||||||||||||||
|
|
|
|
|
|
|
|
|
|
|
|||||||||||
| Operating expenses: |
||||||||||||||||||||
| Salaries, payroll taxes and employee benefits |
9,083 | 10,915 | 14,026 | 6,519 | 11,772 | |||||||||||||||
| General and administrative |
3,354 | 4,258 | 5,069 | 2,967 | 4,179 | |||||||||||||||
| Depreciation and amortization |
264 | 318 | 274 | 131 | 177 | |||||||||||||||
| Amortization of software costs |
426 | 547 | 499 | 303 | 196 | |||||||||||||||
|
|
|
|
|
|
|
|
|
|
|
|||||||||||
| 13,127 | 16,038 | 19,868 | 9,920 | 16,324 | ||||||||||||||||
|
|
|
|
|
|
|
|
|
|
|
|||||||||||
| Income from operations |
11,589 | 12,663 | 17,985 | 7,523 | 5,181 | |||||||||||||||
|
|
|
|
|
|
|
|
|
|
|
|||||||||||
| Other income: |
||||||||||||||||||||
| Miscellaneous income |
1 | 15 | 20 | 11 | 20 | |||||||||||||||
| Interest income |
16 | 10 | 3 | 1 | 2 | |||||||||||||||
|
|
|
|
|
|
|
|
|
|
|
|||||||||||
| 17 | 25 | 23 | 12 | 22 | ||||||||||||||||
|
|
|
|
|
|
|
|
|
|
|
|||||||||||
| Income before income taxes |
11,606 | 12,688 | 18,008 | 7,535 | 5,203 | |||||||||||||||
| Provision for state and local income taxes |
446 | 595 | 904 | 211 | 193 | |||||||||||||||
|
|
|
|
|
|
|
|
|
|
|
|||||||||||
| Net income |
$ | 11,160 | $ | 12,093 | $ | 17,104 | $ | 7,324 | $ | 5,010 | ||||||||||
|
|
|
|
|
|
|
|
|
|
|
|||||||||||
See accompanying notes to consolidated financial statements.
F-57
Table of Contents
Ambrose Employer Group, LLC and Subsidiary
CONSOLIDATED STATEMENTS OF CHANGES IN MEMBERS’ EQUITY
(In thousands)
| Years
Ended December 31, |
Six Months
Ended June 30, 2013 |
|||||||||||||||
| 2010 | 2011 | 2012 | ||||||||||||||
| (unaudited) | ||||||||||||||||
| Members’ equity, January 1 |
$ | 10,243 | $ | 12,603 | $ | 13,696 | $ | 17,899 | ||||||||
| Members’ distributions |
(8,800 | ) | (11,000 | ) | (12,901 | ) | (15,555 | ) | ||||||||
| Net income |
11,160 | 12,093 | 17,104 | 5,010 | ||||||||||||
|
|
|
|
|
|
|
|
|
|||||||||
| Members’ equity, December 31 |
$ | 12,603 | $ | 13,696 | $ | 17,899 | $ | 7,354 | ||||||||
|
|
|
|
|
|
|
|
|
|||||||||
| Membership units |
20,211 | 20,211 | 20,211 | 20,211 | ||||||||||||
See accompanying notes to consolidated financial statements.
F-58
Table of Contents
Ambrose Employer Group, LLC and Subsidiary
CONSOLIDATED STATEMENTS OF CASH FLOWS
(In thousands)
| Years
Ended December 31, |
Six Months
Ended June 30, |
|||||||||||||||||||
| 2010 | 2011 | 2012 | 2012 | 2013 | ||||||||||||||||
| (unaudited) | ||||||||||||||||||||
| Operating activities: |
||||||||||||||||||||
| Net income |
$ | 11,160 | $ | 12,093 | $ | 17,104 | $ | 7,324 | $ | 5,010 | ||||||||||
| Adjustments to reconcile net income to net cash provided by (used in) operating activities: |
||||||||||||||||||||
| Depreciation and amortization |
264 | 318 | 274 | 131 | 177 | |||||||||||||||
| Amortization of software costs |
426 | 547 | 499 | 303 | 196 | |||||||||||||||
| Deferred rent |
(13 | ) | (22 | ) | 21 | 21 | 19 | |||||||||||||
| Bad debt expense (recovery) |
— | — | 128 | (8 | ) | 103 | ||||||||||||||
| Changes in operating assets and liabilities: |
||||||||||||||||||||
| Accounts receivable |
45 | (568 | ) | 217 | 1,102 | (704 | ) | |||||||||||||
| Prepaid expenses and other current assets |
(817 | ) | (418 | ) | 609 | 1,672 | 290 | |||||||||||||
| Other assets |
(22 | ) | (161 | ) | (35 | ) | (42 | ) | 135 | |||||||||||
| Accounts payable and accrued liabilities |
515 | 551 | 2,259 | (327 | ) | 2,523 | ||||||||||||||
| Accrued serviced employee benefits |
(1,242 | ) | 828 | 2,198 | 8,948 | (5,107 | ) | |||||||||||||
| Payroll tax liabilities |
(80,233 | ) | 21,754 | 71,076 | (294,712 | ) | (362,083 | ) | ||||||||||||
| Client deposits payable |
(366 | ) | 5,449 | 9,855 | (469 | ) | (6,674 | ) | ||||||||||||
|
|
|
|
|
|
|
|
|
|
|
|||||||||||
| Net cash provided by (used in) operating activities |
(70,283 | ) | 40,371 | 104,205 | (276,057 | ) | (366,115 | ) | ||||||||||||
|
|
|
|
|
|
|
|
|
|
|
|||||||||||
| Investing activities: |
||||||||||||||||||||
| Purchases of equipment and leasehold improvements |
(358 | ) | (153 | ) | (455 | ) | (242 | ) | (444 | ) | ||||||||||
| Intangible asset acquisition |
(50 | ) | — | — | — | — | ||||||||||||||
| Software acquisition |
(168 | ) | (748 | ) | (297 | ) | (183 | ) | (167 | ) | ||||||||||
|
|
|
|
|
|
|
|
|
|
|
|||||||||||
| Net cash used in investing activities |
(576 | ) | (901 | ) | (752 | ) | (425 | ) | (611 | ) | ||||||||||
|
|
|
|
|
|
|
|
|
|
|
|||||||||||
| Financing activities: |
||||||||||||||||||||
| Members’ distributions |
(8,800 | ) | (11,000 | ) | (12,900 | ) | (8,600 | ) | (15,555 | ) | ||||||||||
|
|
|
|
|
|
|
|
|
|
|
|||||||||||
| Net cash used in financing activities |
(8,800 | ) | (11,000 | ) | (12,900 | ) | (8,600 | ) | (15,555 | ) | ||||||||||
|
|
|
|
|
|
|
|
|
|
|
|||||||||||
| Net increase (decrease) in cash and cash equivalents |
(79,659 | ) | 28,470 | 90,553 | (285,082 | ) | (382,281 | ) | ||||||||||||
| Cash and cash equivalents, beginning of period |
405,110 | 325,451 | 353,921 | 353,921 | 444,474 | |||||||||||||||
|
|
|
|
|
|
|
|
|
|
|
|||||||||||
| Cash and cash equivalents, end of period |
$ | 325,451 | $ | 353,921 | $ | 444,474 | $ | 68,839 | $ | 62,193 | ||||||||||
|
|
|
|
|
|
|
|
|
|
|
|||||||||||
| Supplemental disclosure of cash flow data: |
||||||||||||||||||||
| Income taxes paid |
$ | 483 | $ | 597 | $ | 805 | $ | 428 | $ | 611 | ||||||||||
|
|
|
|
|
|
|
|
|
|
|
|||||||||||
See accompanying notes to consolidated financial statements.
F-59
Table of Contents
Ambrose Employer Group, LLC and Subsidiary
NOTES TO CONSOLIDATED FINANCIAL STATEMENTS
(In thousands, except per unit amounts)
NOTE 1—NATURE OF BUSINESS:
Ambrose Employer Group, LLC and its wholly-owned subsidiary, Ambrose Employer Group (USA) LLC (collectively the “Company”), are limited liability companies headquartered in New York. The Company is a Professional Employer Organization and provides small and medium sized businesses with an outsourcing solution to the complexities and costs related to employment and human resources. This solution includes a broad range of services including human resource administration, employment regulatory compliance management, workers compensation insurance administration, defined contribution plan, employee benefits, payroll tax administration and other employment-related services. The Company utilizes a comprehensive web-based human resources information system to support its internal staff, its clients’ managers and serviced employees.
The Company provides such services by establishing a co-employer relationship with its clients and contractually assumes substantial employer responsibilities with respect to serviced employees (“Client Service Agreement”). While the Company becomes the legal employer for many purposes, and consequently, assumes a level of liability for the employment practices of its clients, each client remains in operational control of its respective business.
The Company’s serviced employees for client companies are located throughout the United States.
NOTE 2—SIGNIFICANT ACCOUNTING POLICIES:
Principles of consolidation:
The accompanying consolidated financial statements include the accounts of Ambrose Employer Group, LLC and Ambrose Employer Group (USA) LLC. All significant intercompany accounts and transactions have been eliminated in consolidation.
Concentration of credit risk:
Financial instruments, which potentially subject the Company to concentrations of credit risk, consist primarily of cash and cash equivalents, restricted cash, and accounts receivable. The Company considers all highly liquid debt instruments with an original maturity of three months or less when purchased to be cash equivalents. The Company maintains its cash and cash equivalents and restricted cash with high-credit quality financial institutions. At times, such amounts may exceed Federally insured limits. At December 31, 2012, the Company had uninsured cash and cash equivalents and restricted cash balances of $22,116.
Accounts receivable result from the underfunding of payroll from certain of the Company’s clients. However, concentrations of credit risk with respect to accounts receivable is limited as client customers generally are required to maintain the appropriate amounts of funds to cover all payroll and payroll tax liabilities for the pay period. The Company does not need to provide for an allowance for doubtful accounts since receivables generated from a shortage is generally recouped in the following payroll cycle.
Equipment and improvements:
Equipment and improvements are stated at cost, net of accumulated depreciation and amortization. Depreciation is computed on the straight-line method over the estimated useful lives of the related assets, generally ranging from three to nine years. Leasehold improvements are amortized over the shorter of the estimated useful life of the asset or lease term.
F-60
Table of Contents
Ambrose Employer Group, LLC and Subsidiary
NOTES TO CONSOLIDATED FINANCIAL STATEMENTS (Continued)
(In thousands, except per unit amounts)
Software costs:
Software costs are stated at cost and amortization is computed on a straight-line basis over the estimated life of three years starting from the date of implementation.
Intangible asset:
Intangible asset consists of a trade name with an indefinite life. The Company assesses the recoverability of the indefinite lived intangible asset on an annual basis, or more frequently if events and circumstances indicate that the asset might be impaired. If indicators of impairment are present and the undiscounted cash flows estimated to be generated by that asset are less than the asset’s carrying amount an impairment charge would be recorded. If the asset is considered to be impaired, the impairment to be recognized is measured by the amount by which the carrying amount of the asset exceeds the fair value of the asset. The Company completed its annual impairment analysis during the years ended December 31, 2011 and 2012 and determined that no impairment charges were required.
Income taxes:
The Company is a limited liability company and is not subject to Federal or state income taxes. The Company is subject to New York City and various other states’ equivalent of the unincorporated business tax. Such taxes are included in the provision for state and local income tax. Income taxes payable by the individual members, based on their respective shares of the Company’s income, have not been reflected in the accompanying consolidated financial statements.
The Company has no unrecognized tax benefits at December 31, 2011 and 2012. The Company’s Federal, state and city income tax returns prior to fiscal year 2009 are closed and management continually evaluates expiring statutes of limitations, audits, proposed settlements, changes in tax law and new authoritative rulings.
If applicable, the Company recognizes interest and penalties associated with tax matters as part of the income tax provision and include accrued interest and penalties with the related tax liability in the consolidated balance sheets.
Revenue and direct cost recognition:
The Company recognizes service fees when the related services are performed. The Company recognizes as revenues its service fees. Additionally, the Company includes employment taxes and employee benefits in its gross revenues due to the assumption of significant contractual rights and obligations associated with being the co-employer of its serviced employees.
The Company’s direct payroll costs associated with its revenue generating activities are comprised of all costs related to the serviced employees, including the employer portion of payroll-related taxes and serviced employees’ benefits such as health insurance plan premiums and workers’ compensation insurance premiums at the end of each pay period. Consistent with its revenue recognition policy, the Company’s direct costs do not include the salaries and wages of its serviced employees. The Company generally requires its clients to prepay all amounts due under its client service agreement or to provide the Company with an alternative security agreement.
Estimates:
The preparation of the consolidated financial statements in conformity with accounting principles generally accepted in the United States of America requires management to make estimates and assumptions that affect certain reported amounts and disclosures. Accordingly, actual results could differ from those estimates.
F-61
Table of Contents
Ambrose Employer Group, LLC and Subsidiary
NOTES TO CONSOLIDATED FINANCIAL STATEMENTS (Continued)
(In thousands, except per unit amounts)
Fair value of financial instruments:
The Company’s material financial instruments at December 31, 2011 and 2012 for which disclosure of estimated fair value is required by accounting standards, consist of cash and cash equivalents, restricted cash, accounts receivable, payroll tax liabilities, accrued serviced employee benefits, client deposits payable and accounts payable.
The fair value of cash and cash equivalents and restricted cash approximates fair value due to the short-term maturity of these instruments. The fair value of accounts receivable, payroll tax liabilities, accrued serviced employee benefits, client deposits payable and accounts payable are estimated to be equal to their respective carrying values due to the short-term nature of such instruments. The fair value of client deposits is the amount payable on demand at the reporting date.
Deferred rent:
The Company’s lease agreements provide for scheduled rent increases during the lease term or for rental payments commencing at a date other than initial occupancy. Provision has been made for the excess of operating lease rental expense, computed on a straight-line basis over the lease term, over cash rentals paid.
Subsequent events:
The Company has evaluated events and transactions for potential recognition or disclosure through May 2, 2013, which is the date the financial statements were available to be issued.
NOTE 3—RESTRICTED CASH:
Restricted cash consists of the following:
| December 31, | June
30, 2013 |
|||||||||||
| 2011 | 2012 | |||||||||||
| (unaudited) | ||||||||||||
| Certificate of deposit securing a lease |
$ | 192 | $ | 192 | $ | 192 | ||||||
| Certificate of deposit securing standby letter of credit with insurance carrier |
250 | 250 | 250 | |||||||||
|
|
|
|
|
|
|
|||||||
| Totals |
$ | 442 | $ | 442 | $ | 442 | ||||||
|
|
|
|
|
|
|
|||||||
NOTE 4—EQUIPMENT AND LEASEHOLD IMPROVEMENTS:
| December 31, | June
30, 2013 |
|||||||||||
| 2011 | 2012 | |||||||||||
| (unaudited) | ||||||||||||
| Machinery and equipment |
$ | 1,596 | $ | 1,960 | $ | 1,521 | ||||||
| Furniture and fixtures |
285 | 376 | 269 | |||||||||
| Leasehold improvements |
181 | 181 | 168 | |||||||||
|
|
|
|
|
|
|
|||||||
| 2,062 | 2,517 | 1,958 | ||||||||||
| Less accumulated depreciation and amortization |
1,616 | 1,890 | 1,067 | |||||||||
|
|
|
|
|
|
|
|||||||
| Totals |
$ | 446 | $ | 627 | $ | 891 | ||||||
|
|
|
|
|
|
|
|||||||
F-62
Table of Contents
Ambrose Employer Group, LLC and Subsidiary
NOTES TO CONSOLIDATED FINANCIAL STATEMENTS (Continued)
(In thousands, except per unit amounts)
Depreciation and amortization expense for the years ended December 31, 2010, 2011 and 2012 amounted to approximately $264, $318 and $274, respectively. Depreciation and amortization expense for the six months ended June 30, 2012 and 2013 amounted to approximately $131 and $177 (unaudited), respectively.
NOTE 5—WORKERS COMPENSATION:
The Company maintains deposits with its insurance carriers to cover certain costs of its workers compensation plans. Pursuant to these plans, the Company is responsible for each claim up to the deductible amount of $350 and $4,250 (unaudited) in the aggregate for the policy year expiring June 30, 2014. The required deposits secure potential future claims within the plans’ deductibles and other potential costs associated with administrating the plans. At December 31, 2011 and 2012 the Company had two plans and deposits with the insurance carriers totaling $372. These deposits are included in other assets in the financial statements.
In addition, the Company has a standby letter of credit, secured by a certificate of deposit (see Note 3) of the same amount, to the benefit of the current insurance carrier. The Company maintains a reserve for estimated future workers compensation claims in accounts payable and accrued liabilities. Approximately $524, $106, and $481 (unaudited) was included as of December 31, 2011 and 2012 and June 30, 2013, respectively.
NOTE 6—CLIENT DEPOSITS PAYABLE:
These are deposits pursuant to the Client Service Agreement between the Company and its clients. The deposits are generally equal to ten percent of the clients’ average invoice amounts and can be used by the Company to satisfy any amounts due under the Client Service Agreement.
NOTE 7—LEASE COMMITMENTS:
The Company’s New York City office space is leased under the terms of an operating lease that expires December 2014. The Company is amortizing rent escalations by the straight-line method over the lease term. In addition to rent, the Company is responsible for its proportionate amount of base operating expenses and real estate taxes as defined in the lease. In 2011, the Company signed a lease agreement in Connecticut with a lease term of two years starting on February 1, 2011 and terminated January 31, 2013. On January 31, 2013, the Company signed a new lease agreement in Connecticut with a lease term of 38 months commencing on February 1, 2013. The Company also signed a new lease agreement in New Jersey with a lease term of ten-and-a-half years starting on February 1, 2012. Rent expense amounted to $507, $560 and $774 for the years ended December 31, 2010, 2011 and 2012 respectively. Rent expense amounted to $363 and $496 (unaudited) for the six months ended June 30, 2012 and 2013, respectively.
The future minimum annual rental payments under these leases are as follows:
| Years ending December 31, |
2013 | $ | 680 | |||
| 2014 | 686 | |||||
| 2015 | 278 | |||||
| 2016 | |
162 |
| |||
| 2017 | 129 | |||||
| Thereafter |
625 | |||||
|
|
|
|||||
| Total |
$ | 2,560 | ||||
|
|
|
|||||
NOTE 8—EMPLOYEE BENEFIT PLAN:
The Company maintains a multiple employer defined contribution plan, which covers serviced employees for client companies electing to participate in the plan and for its internal staff employees. The Company
F-63
Table of Contents
Ambrose Employer Group, LLC and Subsidiary
NOTES TO CONSOLIDATED FINANCIAL STATEMENTS (Continued)
(In thousands, except per unit amounts)
contributes, on behalf of each participating client, varying amounts based on the clients’ policies and serviced employee elections. The Company contributed approximately $8,993, $14,038 and $16,033 for the years ended December 31, 2010, 2011 and 2012, respectively, for serviced employees. The Company contributed approximately $12,025 and $15,418 (unaudited) for the six months ended June 30, 2012 and 2013, respectively, for serviced employees. These amounts were invoiced to client companies and costs are included in direct costs. The Company contributed approximately $101, $120 and $135 for the years ended December 31, 2010, 2011 and 2012, respectively, for its internal staff employees and these costs are included in operating expenses. The Company contributed approximately $99 and $132 (unaudited) for the six months ended June 30, 2012 and 2013, respectively, for its internal staff employees.
NOTE 9—APPRECIATION UNITS OPTION PLAN:
Pursuant to the Company’s option plan, upon exercise, the option holder receives Appreciation Units equal to the number of options exercised. The Appreciation Units are entitled to an allocation of gain in the event the Company is sold and are convertible to voting common shares if the Company converts to a corporation.
The Company has made 1,000,000 units available for purposes of this plan. The Company will record compensation expense as the contingent events become probable.
On June 1, 2012, a grant for 100,000 options was awarded. The exercise price of the options is $5.93 per unit with 20% of options vesting on June 1, 2013 and the remaining 80% vesting 20% per year until June 1, 2017. The option award has a ten-year term which expires on June 1, 2021.
On April 1, 2009, a grant for 150,000 options was awarded. The exercise price of the options is $5.00 per unit with 20% of options vesting on March 31, 2010 and the remaining 80% vesting 20% per year until March 31, 2014. The option award has a ten-year term which expires on March 31, 2019.
On August 1, 2008, a grant for 150,000 options was awarded. The exercise price of the options is $5.00 per unit with 50% of options vesting on January 1, 2011 and the remaining 50% vesting on January 1, 2013. The option award has a nine-year term which expires on July 31, 2017. During 2010, these options were cancelled following the termination of the employee.
Two different grants were awarded on January 1, 2007. One grant was for 100,000 options and has an exercise price of $1.25 per unit and vested immediately upon issuance. Due to the termination of an employee in 2011, 50,000 of these options have been terminated leaving 50,000 outstanding. The exercise price was equal to the Company’s fair value of its membership units at the date of the grant. The other award was for 300,000 options and has an exercise price of $2.00 per unit and vests on a graded vesting schedule of 20% per year starting January 1, 2008 and ending on January 1, 2012. As mentioned above, due to the termination of an employee, 150,000 of these options have been terminated. Both option awards have a ten-year term which expires on December 31, 2016.
F-64
Table of Contents
Ambrose Employer Group, LLC and Subsidiary
NOTES TO CONSOLIDATED FINANCIAL STATEMENTS (Continued)
(In thousands, except per unit amounts)
The Appreciation Units option transactions are summarized as follows for the years ended December 31, 2010, 2011 and 2012 and the six months ended June 30, 2013:
| Option Plan | Weighted Average Exercise Price |
Weighted Average Contractual Life Remaining (years) |
||||||||||
| Options outstanding at January 1, 2010 |
700,000 | $ | 3.18 | |||||||||
| Cancelled in 2010 |
(150,000 | ) | $ | (5.00 | ) | |||||||
|
|
|
|||||||||||
| Options outstanding at December 31, 2010 |
550,000 | $ | 2.68 | 6.61 | ||||||||
| Cancelled in 2011 |
(200,000 | ) | $ | (1.81 | ) | |||||||
|
|
|
|||||||||||
| Options outstanding at December 31, 2011 |
350,000 | $ | 3.18 | 5.96 | ||||||||
| Granted in 2012 |
100,000 | $ | 5.93 | |||||||||
|
|
|
|||||||||||
| Options outstanding at December 31, 2012 |
450,000 | $ | 3.79 | 5.75 | ||||||||
| Granted in 2013 (unaudited) |
— | — | ||||||||||
|
|
|
|||||||||||
| Options outstanding at June 30, 2013 (unaudited) |
450,000 | $ | 3.79 | 5.75 | ||||||||
|
|
|
|||||||||||
| Vested options outstanding: |
||||||||||||
| At December 31, 2010 |
310,000 | $ | 2.05 | 6.29 | ||||||||
| At December 31, 2011 |
230,000 | $ | 2.62 | 5.76 | ||||||||
| At December 31, 2012 |
290,000 | $ | 2.80 | 4.93 | ||||||||
| At June 30, 2013 (unaudited) |
315,000 | $ | 3.01 | 4.16 | ||||||||
The Appreciation Units were paid and settled in June 2013 for $4,394 (unaudited).
F-65
Table of Contents
UNAUDITED PRO FORMA COMBINED FINANCIAL INFORMATION
On October 24, 2012, TriNet Group, Inc. (the “Company”) acquired 100% of the outstanding equity of SOI Holdings, Inc. (“SOI”), the parent company of Strategic Outsourcing, Inc. The acquisition date fair value of the consideration transferred was $195.8 million. On July 1, 2013, we acquired 100% of the outstanding equity of Ambrose Employer Group, LLC (“Ambrose”). The acquisition date fair value of the consideration transferred was approximately $193.7 million. Each of these acquisitions were funded with borrowings as described below.
In October 2012, the Company completed an amendment and restatement of its March 2012 credit facility to provide for two new tranches of term loans totaling $300.0 million and a five-year revolving credit facility of $50.0 million, of which $197.6 million was used to fund the acquisition of SOI. In April 2013 in connection with the acquisition of Ambrose, the Company amended the amended and restated credit facility to provide for an additional $150.0 million of term loans. The Company capitalized loan fees of $10.8 million associated with the October 2012 amended and restated credit facility and $2.6 million associated with the April 2013 amendment of the amended and restated credit facility.
The unaudited pro forma combined financial information set forth below gives effect to (a) the completion of the SOI acquisition and the amendment and restatement to the initial credit facility, actually completed on October 24, 2012, in each case as if they occurred on January 1, 2012 for income statement purposes, and (b) the completion of the Ambrose acquisition actually completed on July 1, 2013 and amendment of the amended and restated credit facility actually completed in April 2013, as if they occurred on January 1, 2012 for income statement purposes. The unaudited pro forma information below should be read in conjunction with the financial statements of TriNet, Ambrose and SOI and Management’s Discussion and Analysis of Financial Condition and Results of Operations, all of which are included in this prospectus.
F-66
Table of Contents
UNAUDITED PRO FORMA COMBINED STATEMENTS OF OPERATIONS
(In thousands, except share and per share data)
| Year Ended December 31, 2012 | ||||||||||||||||||||||||||||
| TriNet Group, Inc. (a) |
SOI (January 1, 2012 to September 30, 2012) (a) |
SOI (October 1, 2012 to October 23, 2012) (a) |
Pro Forma Adjustments |
Ambrose | Pro Forma Adjustments |
Pro Forma Consolidated |
||||||||||||||||||||||
| Revenues |
$ | — | $ | 322,912 | $ | 27,650 | $ | (350,562 | )(b) | $ | 316,403 | $ | (316,403 | )(b) | $ | — | ||||||||||||
| Professional service revenues |
148,233 | — | — | 57,600 | (b) | — | 22,261 | (b) | 228,094 | |||||||||||||||||||
| Insurance service revenues |
870,828 | — | — | 137,028 | (b) | — | 188,926 | (b) | 1,196,782 | |||||||||||||||||||
|
|
|
|
|
|
|
|
|
|
|
|
|
|
|
|||||||||||||||
| Total revenues |
1,019,061 | 322,912 | 27,650 | (155,934 | ) | 316,403 | (105,216 | ) | 1,424,876 | |||||||||||||||||||
|
|
|
|
|
|
|
|
|
|
|
|
|
|
|
|||||||||||||||
| Costs and operating expenses: |
||||||||||||||||||||||||||||
| Cost of services |
— | 265,387 | 19,827 | (285,214 | )(b) | 278,550 | (278,550 | )b) | — | |||||||||||||||||||
| Insurance costs |
750,025 | — | — | 127,930 | (b) | — | 173,334 | (b) | 1,051,289 | |||||||||||||||||||
| Cost of providing services (exclusive of depreciation and amortization of intangible assets) |
63,563 | — | — | 16,233 | (b) | — | 3,397 | (b) | 83,193 | |||||||||||||||||||
| Selling, general and administrative expense |
— | 37,577 | 2,975 | (40,552 | )(b) | — | — | — | ||||||||||||||||||||
| Salaries, payroll taxes and employee benefits |
— | — | — | — | 14,026 | (14,026 | )(b) | — | ||||||||||||||||||||
| Sales and marketing |
59,931 | — | — | 18,852 | (b) | — | 3,987 | (b) | 82,770 | |||||||||||||||||||
| General and administrative |
37,879 | — | — | 7,022 | (b) | 5,069 | 4,061 | (b) | 51,099 | |||||||||||||||||||
| (2,182 | )(d) | |||||||||||||||||||||||||||
| (750 | )(e) | |||||||||||||||||||||||||||
| Systems development and programming costs |
16,718 | — | — | 1,689 | (b) | — | 2,581 | (b) | 20,988 | |||||||||||||||||||
| Amortization of intangible assets |
17,441 | — | — | 27,803 | (f) | — | 21,508 | (f) | 66,752 | |||||||||||||||||||
| Depreciation |
11,676 | 1,764 | 143 | — | 773 | 14,356 | ||||||||||||||||||||||
| Other |
— | 1,647 | 246 | (1,893 | )(b) | — | — | — | ||||||||||||||||||||
|
|
|
|
|
|
|
|
|
|
|
|
|
|
|
|||||||||||||||
| Total costs and operating expenses |
957,233 | 306,375 | 23,191 | (131,062 | ) | 298,418 | (83,708 | ) | 1,370,447 | |||||||||||||||||||
|
|
|
|
|
|
|
|
|
|
|
|
|
|
|
|||||||||||||||
| Operating income |
61,828 | 16,537 | 4,459 | (24,872 | ) | 17,985 | (21,508 | ) | 54,429 | |||||||||||||||||||
| Other income (expense): |
||||||||||||||||||||||||||||
| Interest expense |
(9,709 | ) | (3,225 | ) | (272 | ) | (5,781 | )(c) | — | (8,684 | )(h) | (27,671 | ) | |||||||||||||||
| Other, net |
57 | — | — | — | 23 | — | 80 | |||||||||||||||||||||
|
|
|
|
|
|
|
|
|
|
|
|
|
|
|
|||||||||||||||
| Income before provision for (benefit from) income taxes |
52,176 | 13,312 | 4,187 | (30,653 | ) | 18,008 | (30,192 | ) | 26,838 | |||||||||||||||||||
| Provision for (benefit from) income taxes |
20,344 | 4,843 | 1,991 | (11,963 | )(g) | 904 | (5,655 | )(g) | 10,464 | |||||||||||||||||||
|
|
|
|
|
|
|
|
|
|
|
|
|
|
|
|||||||||||||||
| Net income |
$ | 31,832 | $ | 8,469 | $ | 2,196 | $ | (18,690 | ) | $ | 17,104 | $ | (24,537 | ) | $ | 16,374 | ||||||||||||
|
|
|
|
|
|
|
|
|
|
|
|
|
|
|
|||||||||||||||
| Net income per share attributable to common stockholders: |
||||||||||||||||||||||||||||
| Basic |
$ | 1.33 | $ | 0.68 | ||||||||||||||||||||||||
|
|
|
|
|
|||||||||||||||||||||||||
| Diluted |
$ | 1.26 | $ | 0.65 | ||||||||||||||||||||||||
|
|
|
|
|
|||||||||||||||||||||||||
| Weighted average shares used to compute net income per share attributable to common stockholders: |
||||||||||||||||||||||||||||
| Basic |
4,902,692 | 23,935,546 | ||||||||||||||||||||||||||
|
|
|
|
|
|||||||||||||||||||||||||
| Diluted |
6,238,046 | 25,270,900 | ||||||||||||||||||||||||||
|
|
|
|
|
|||||||||||||||||||||||||
F-67
Table of Contents
UNAUDITED PRO FORMA COMBINED STATEMENTS OF OPERATIONS
(In thousands, except share and per share data)
| Nine Months Ended September 30, 2013 | ||||||||||||||||
| TriNet Group, Inc. |
Ambrose | Pro Forma Adjustments |
Pro Forma Consolidated |
|||||||||||||
| Service revenues |
$ | — | $ | 199,878 | $ | (199,878 | )(b) | $ | — | |||||||
| Professional service revenues |
195,642 | — | 13,022 | (b) | 208,664 | |||||||||||
| Insurance service revenues |
959,246 | — | 91,818 | (b) | 1,051,064 | |||||||||||
|
|
|
|
|
|
|
|
|
|||||||||
| Total revenues |
1,154,888 | 199,878 | (95,038 | ) | 1,259,728 | |||||||||||
| Costs and operating expenses: |
||||||||||||||||
| Cost of services |
— | 178,373 | (178,373 | ) | — | |||||||||||
| Insurance costs |
858,862 | 83,335 | 942,197 | |||||||||||||
| Cost of providing services (exclusive of depreciation and amortization of intangible assets) |
74,042 | — | 2,383 | (b) | 76,425 | |||||||||||
| Salaries, payroll taxes and employee benefits |
— | 11,772 | (11,772 | )(b) | — | |||||||||||
| Sales and marketing |
79,387 | — | 2,095 | (b) | 81,482 | |||||||||||
| General and administrative |
39,821 | 4,179 | 5,124 | (b) | 49,124 | |||||||||||
| Systems development and programming costs |
15,140 | — | 2,170 | (b) | 17,310 | |||||||||||
| Amortization of intangible assets |
35,926 | — | 10,754 | (f) | 46,680 | |||||||||||
| Depreciation |
8,908 | 373 | — | 9,281 | ||||||||||||
|
|
|
|
|
|
|
|
|
|||||||||
| Total costs and operating expenses |
1,112,086 | 194,697 | (84,284 | ) | 1,222,499 | |||||||||||
|
|
|
|
|
|
|
|
|
|||||||||
| Operating income |
42,802 | 5,181 | (10,754 | ) | 37,229 | |||||||||||
| Other income (expense): |
||||||||||||||||
| Interest expense |
(32,091 | ) | — | (2,738 | )(h) | (34,829 | ) | |||||||||
| Other, net |
309 | 22 | — | 331 | ||||||||||||
|
|
|
|
|
|
|
|
|
|||||||||
| Income before provision for income taxes |
11,020 | 5,203 | (13,492 | ) | 2,731 | |||||||||||
| Provision for income taxes |
3,880 | 193 | (3,111 | )(g) | 962 | |||||||||||
|
|
|
|
|
|
|
|
|
|||||||||
| Net income |
$ | 7,140 | $ | 5,010 | $ | (10,381 | ) | $ | 1,769 | |||||||
|
|
|
|
|
|
|
|
|
|||||||||
| Net income per share attributable to common stockholders: |
||||||||||||||||
| Basic |
$ | 0.29 | $ | (0.07 | ) | |||||||||||
|
|
|
|
|
|||||||||||||
| Diluted |
$ | 0.27 | $ | (0.07 | ) | |||||||||||
|
|
|
|
|
|||||||||||||
| Weighted average shares used to compute net income per share attributable to common stockholders: |
||||||||||||||||
| Basic |
5,750,789 | 24,783,643 | ||||||||||||||
|
|
|
|
|
|||||||||||||
| Diluted |
7,598,197 | 26,631,051 | ||||||||||||||
|
|
|
|
|
|||||||||||||
F-68
Table of Contents
NOTES TO UNAUDITED PRO FORMA COMBINED FINANCIAL INFORMATION
NOTE 1. BASIS OF PRESENTATION
The unaudited pro forma combined financial information gives effect to (a) the completion of the Ambrose acquisition, actually completed on July 1, 2013, and amendment of the amended and restated credit facility, actually completed in April 2013, as if they occurred on January 1, 2012 for income statement purposes, and (b) the completion of the SOI acquisition and the amendment and restatement of our initial credit facility, actually completed on October 24, 2012, in each case as if they occurred on January 1, 2012 for income statement purposes.
NOTE 2. PURCHASE PRICE ALLOCATIONS
The transactions have been accounted for as business combinations with the Company as the acquirer. The purchase price for each acquisition was allocated to tangible and identifiable intangible assets acquired and liabilities assumed based on the fair value at the date of purchase. Purchase price in excess of the identifiable assets and liabilities is recorded as goodwill. All acquisition related costs were expensed as incurred and recorded in operating expenses. The Company includes operations associated with acquisitions from the date of acquisition.
The following table summarizes the estimated fair value of the assets acquired and liabilities assumed from Ambrose at the acquisition date (in thousands):
| Restricted cash |
$ | 442 | ||
| WSE-related assets |
57,366 | |||
| Prepaid expenses and other current assets |
893 | |||
| Goodwill |
97,647 | |||
| Identifiable intangible assets |
94,380 | |||
| Property and equipment |
1,358 | |||
| Other noncurrent assets |
878 | |||
| WSE-related liabilities |
(53,115 | ) | ||
| Accrued corporate wages |
(5,646 | ) | ||
| Other current liabilities |
(126 | ) | ||
| Other noncurrent liabilities |
(350 | ) | ||
|
|
|
|||
| Consideration transferred |
$ | 193,727 | ||
|
|
|
NOTE 3. PRO FORMA ADJUSTMENTS
| (a) | The Company completed the acquisition of SOI on October 24, 2012. Operating results of SOI for the period from October 24, 2012 to December 31, 2012 are included in the consolidated statement of operations of the Company for the year ended December 31, 2012. Amounts stated for SOI represent the results of operations for the unaudited interim period from January 1, 2012 to September 30, 2012 and the subsequent stub period from October 1, 2012 to October 23, 2012 prior to the date of acquisition by the Company. |
| (b) | To reclassify certain line items to conform to the Company’s statements of operations for revenues, costs and operating expenses presentation. |
| (c) | In connection with acquisition of SOI, the Company secured a $300 million loan in October 2012, of which $197.6 million was used to finance the acquisition. Assuming the acquisition and the loan were consummated on January 1, 2012, based on a 5.74% blended effective interest rate, incremental interest expense of $5.8 million would have been recognized for the year ended December 31, 2012. |
| (d) | To eliminate legal and other professional services fees incurred by the Company and SOI directly associated with the acquisition transaction, as these are considered directly related to the transaction and are non-recurring. |
F-69
Table of Contents
NOTES TO UNAUDITED PRO FORMA COMBINED FINANCIAL INFORMATION—(Continued)
| (e) | To eliminate retention bonuses paid to SOI’s management prior to the acquisition, which were directly related to a change in management and are non-recurring. |
| (f) | To recognize additional intangible amortization expense for the SOI customer list and trademarks acquired and the Ambrose customer list, trademarks, and compete agreements acquired as if SOI and Ambrose had been acquired on January 1, 2012. |
| (g) | To record the income tax effect of the pro forma adjustments at the Company’s estimated effective tax rate of 38.99% for the year ended December 31, 2012 and 35.20% for the nine months ended September 30, 2013. |
| (h) | In connection with acquisition of Ambrose, the Company secured an additional $150.0 million loan in April 2013. Assuming the acquisition and the loan were consummated on January 1, 2012, based on a 5.74% blended effective interest rate, additional interest expense $8.7 million and $2.7 million have been recognized for the year ended December 31, 2012 and nine months period ended September 30, 2013, respectively. |
F-70
Table of Contents
Shares
Common Stock

| J.P. Morgan | Morgan Stanley | Deutsche Bank Securities | ||
| Jefferies | Stifel | William Blair | ||
Table of Contents
PART II
INFORMATION NOT REQUIRED IN PROSPECTUS
Item 13. Other Expenses of Issuance and Distribution
The following table sets forth the costs and expenses, other than the underwriting discounts and commissions, payable in connection with the sale and distribution of the securities being registered. All amounts are estimated except the SEC registration fee, the FINRA filing fee and the listing fee. Except as otherwise noted, all the expenses below will be paid by us.
| SEC registration fee |
$ | 32,200 | ||
| FINRA filing fee |
38,000 | |||
| initial listing fee |
* | |||
| Legal fees and expenses |
* | |||
| Accounting fees and expenses |
* | |||
| Printing and engraving expenses |
* | |||
| Transfer agent and registrar fees and expenses |
* | |||
| Blue sky fees and expenses |
* | |||
| Miscellaneous fees and expenses |
* | |||
|
|
|
|||
| Total |
$ | * | ||
|
|
|
| * | To be filed by amendment. |
Item 14. Indemnification of Directors and Officers
Section 145 of the Delaware General Corporation Law authorizes a court to award, or a corporation’s board of directors to grant, indemnity to directors and officers in terms sufficiently broad to permit such indemnification under certain circumstances for liabilities, including reimbursement for expenses incurred, arising under the Securities Act of 1933, as amended, or the Securities Act. Our amended and restated certificate of incorporation to be in effect upon the completion of this offering provides for indemnification of our directors, officers, employees and other agents to the maximum extent permitted by the Delaware General Corporation Law, and our amended and restated bylaws to be in effect upon the completion of this offering provide for indemnification of our directors, officers, employees and other agents to the maximum extent permitted by the Delaware General Corporation Law.
We have entered into indemnification agreements with our directors and officers, whereby we have agreed to indemnify our directors and officers to the fullest extent permitted by law, including indemnification against expenses and liabilities incurred in legal proceedings to which the director or officer was, or is threatened to be made, a party by reason of the fact that such director or officer is or was our director, officer, employee or agent, provided that such director or officer acted in good faith and in a manner that the director or officer reasonably believed to be in, or not opposed to, the our best interest. At present, there is no pending litigation or proceeding involving any of our directors or officers regarding which indemnification is sought, nor are we aware of any threatened litigation that may result in claims for indemnification.
We maintain insurance policies that indemnify our directors and officers against various liabilities arising under the Securities Act and the Securities Exchange Act of 1934, as amended, that might be incurred by any director or officer in his or her capacity as such.
The underwriters are obligated, under certain circumstances, pursuant to the underwriting agreement to be filed as Exhibit 1.1 hereto, to indemnify us, our officers, our directors and the selling stockholders against liabilities under the Securities Act.
II-1
Table of Contents
Item 15. Recent Sales of Unregistered Securities.
The following sets forth information regarding all unregistered securities issued and sold since January 1, 2011:
| (a) | From January 1, 2011 to January 3, 2014, we granted stock options to purchase an aggregate of 3,765,480 shares of common stock to employees, consultants and directors pursuant to our 2009 Equity Incentive Plan, having exercise prices ranging from $6.37 to $26.42 per share as of the date of grant. Of these options, 713,285 shares have been issued upon exercise thereof for cash consideration in the aggregate amount of $2.8 million, options to purchase 287,272 shares have been cancelled without being exercised and options to purchase 2,764,923 shares remain outstanding as of January 3, 2014. |
The offers, sales and issuances of the securities described in Item 15(a) were deemed to be exempt from registration under the Securities Act under either (1) Rule 701 promulgated under the Securities Act as offers and sale of securities pursuant to certain compensatory benefit plans and contracts relating to compensation in compliance with Rule 701 or (2) Section 4(2) of the Securities Act as transactions by an issuer not involving any public offering. The recipients of securities in each of these transactions represented their intention to acquire the securities for investment only and not with view to or for sale in connection with any distribution thereof and appropriate legends were affixed to the stock certificates and instruments issued in such transactions. All recipients had adequate access, through their relationships with us, to information about us.
Item 16. Exhibits and Financial Statement Schedules.
| (a) | Exhibits. |
| Exhibit No. | Description of Exhibit | |
| 1.1* | Form of Underwriting Agreement. | |
| 2.1** | Equity Purchase Agreement by and among TriNet Group, Inc., Ambrose Employer Group, LLC and Gregory Slamowitz, John Iorillo and Marc Dwek, dated July 1, 2013. | |
| 2.2** | Agreement and Plan of Merger by and among TriNet Group, Inc., Champ Acquisition Corporation, SOI Holdings, Inc. and SOI Stockholder Representative, LLC, dated August 24, 2012. | |
| 2.3*** | Agreement and Plan of Merger by and among TriNet Group, Inc., Gin Acquisition, Inc. and Gevity HR, Inc., dated March 4, 2009. | |
| 3.1** | Amended and Restated Certificate of Incorporation of TriNet Group, Inc., as amended and as currently in effect. | |
| 3.2* | Form of Amended and Restated Certificate of Incorporation of TriNet Group, Inc., to be in effect upon the completion of this offering. | |
| 3.3 | Amended and Restated Bylaws of TriNet Group, Inc., as currently in effect. | |
| 3.4* | Form of Amended and Restated Bylaws of TriNet Group, Inc., to be in effect upon the completion of this offering. | |
| 4.1* | Form of common stock certificate. | |
| 4.2** | Amended and Restated Registration Rights Agreement, by and among TriNet Group, Inc., GA TriNet LLC and HR Acquisitions, LLC, dated June 1, 2009. | |
| 5.1* | Form of Opinion of Cooley LLP. | |
| 10.1** | Amended and Restated 2000 Equity Incentive Plan. | |
| 10.2** | Forms of Option Agreement and Option Grant Notice under the Amended and Restated 2000 Equity Incentive Plan. | |
| 10.3* | Amended and Restated 2009 Equity Incentive Plan. | |
II-2
Table of Contents
| Exhibit No. | Description of Exhibit | |
| 10.4* | Form of Option Agreement and Option Grant Notice under the Amended and Restated 2009 Equity Incentive Plan. | |
| 10.5* | Form of Restricted Stock Agreement and Restricted Stock Award Notice under the Amended and Restated 2009 Equity Incentive Plan. | |
| 10.6* | Form of Restricted Stock Unit Agreement and Restricted Stock Unit Award Notice under the Amended and Restated 2009 Equity Incentive Plan. | |
| 10.7* | 2014 Employee Stock Purchase Plan, to be in effect upon completion of this offering. | |
| 10.8* | Form of Indemnification Agreement made by and between TriNet Group, Inc. and each of its directors and executive officers. | |
| 10.9* | Employment Agreement, dated November 9, 2009, between Burton M. Goldfield and TriNet Group, Inc. | |
| 10.10* | Employment Agreement, dated November 9, 2009, between Gregory Hammond and TriNet Group, Inc. | |
| 10.11* | Employment Agreement, dated August 23, 2010, between William Porter and TriNet Group, Inc. | |
| 10.12* | Employment Agreement, dated March 5, 2012, between John Turner and TriNet Group, Inc. | |
| 10.13** | First Lien Credit Agreement, dated August 20, 2013, among TriNet HR Corporation, as borrower, TriNet Group, Inc., the lenders from time to time party thereto and JPMorgan Chase Bank, N.A., as administrative agent. | |
| 10.14** | Second Lien Credit Agreement, dated August 20, 2013, among TriNet HR Corporation, as borrower, TriNet Group, Inc., the lenders from time to time party thereto and Wilmington Trust, National Association, as administrative agent. | |
| 10.15** | Creekside Plaza Office Lease between Creekside Associates, LLC and TriNet Group, Inc., dated April 24, 2001. | |
| 10.16** | First Amendment to Creekside Plaza Office Lease between Creekside Associates, LLC and TriNet Group, Inc., dated June 21, 2012. | |
| 21.1** | List of subsidiaries. | |
| 23.1* | Consent of Cooley LLP (included in Exhibit 5.1). | |
| 23.2 | Consent of Ernst & Young LLP, independent registered public accounting firm. | |
| 23.3 | Consent of PricewaterhouseCoopers LLP, independent accountants. | |
| 23.4 | Consent of CohnReznick LLP, independent auditors. | |
| 24.1 | Power of Attorney (see page II-5 to this registration statement). | |
| * | To be filed by amendment. |
| ** | Previously filed. |
| *** | Filed as Exhibit 2.1 to the current report on Form 8-K of Gevity HR, Inc. filed with the Securities and Exchange Commission on March 6, 2009 (file no. 000-22701) and incorporated herein by reference. |
II-3
Table of Contents
| (b) | Financial statement schedules. |
SCHEDULE II—VALUATION AND QUALIFYING ACCOUNTS
| (in thousands) | Balance at Beginning of Period |
Credited/ Charged to Net Income |
Balance Acquired |
Charges Utilized/ Write-Offs |
Balance at End of Period |
|||||||||||||||
| Allowances for Doubtful Accounts and Authorized Credits |
||||||||||||||||||||
| Year ended December 31, 2010 |
830 | 1,356 | — | (1,294 | ) | 892 | ||||||||||||||
| Year ended December 31, 2011 |
892 | 521 | — | (1,192 | ) | 221 | ||||||||||||||
| Year ended December 31, 2012 |
221 | 805 | 335 | (542 | ) | 819 | ||||||||||||||
| Nine months ended September 30, 2013 (unaudited) |
819 | (99 | ) | — | (584 | ) | 136 | |||||||||||||
| Tax Valuation Allowance |
||||||||||||||||||||
| Year ended December 31, 2010 |
1,400 | (114 | ) | — | (886 | ) | 400 | |||||||||||||
| Year ended December 31, 2011 |
400 | 31 | — | — | 431 | |||||||||||||||
| Year ended December 31, 2012 |
431 | (18 | ) | 1,399 | (265 | ) | 1,547 | |||||||||||||
| Nine months ended September 30, 2013 (unaudited) |
1,547 | — | 2,484 | — | 4,031 | |||||||||||||||
Item 17. Undertakings
The undersigned Registrant hereby undertakes to provide to the underwriters at the closing specified in the Underwriting Agreement, certificates in such denominations and registered in such names as required by the underwriters to permit prompt delivery to each purchaser.
Insofar as indemnification for liabilities arising under the Securities Act may be permitted to directors, officers and controlling persons of the Registrant pursuant to the foregoing provisions, or otherwise, the Registrant has been advised that in the opinion of the Securities and Exchange Commission such indemnification is against public policy as expressed in the Securities Act and is, therefore, unenforceable. In the event that a claim for indemnification against such liabilities (other than the payment by the Registrant of expenses incurred or paid by a director, officer or controlling person of the Registrant in the successful defense of any action, suit or proceeding) is asserted by such director, officer or controlling person in connection with the securities being registered, the Registrant will, unless in the opinion of its counsel the matter has been settled by controlling precedent, submit to a court of appropriate jurisdiction the question whether such indemnification by it is against public policy as expressed in the Securities Act and will be governed by the final adjudication of such issue.
The undersigned Registrant hereby undertakes that:
| (1) | For purposes of determining any liability under the Securities Act, the information omitted from the form of prospectus filed as part of this Registration Statement in reliance upon Rule 430A and contained in a form of prospectus filed by the Registrant pursuant to Rule 424(b)(1) or (4) or 497(h) under the Securities Act shall be deemed to be part of this Registration Statement as of the time it was declared effective. |
| (2) | For the purpose of determining any liability under the Securities Act, each post-effective amendment that contains a form of prospectus shall be deemed to be a new registration statement relating to the securities offered therein, and the offering of such securities at that time shall be deemed to be the initial bona fide offering thereof. |
II-4
Table of Contents
SIGNATURES
Pursuant to the requirements of the Securities Act of 1933, the Registrant has duly caused this Registration Statement on Form S-1 to be signed on its behalf by the undersigned, thereunto duly authorized, in the City of San Leandro, State of California, on the 6th day of January, 2014.
| TRINET GROUP, INC. | ||
| By: | /S/ BURTON M. GOLDFIELD | |
| Burton M. Goldfield | ||
| Chief Executive Officer | ||
POWER OF ATTORNEY
KNOW ALL PERSONS BY THESE PRESENTS, that each person whose signature appears below constitutes and appoints Burton M. Goldfield, William Porter and Gregory L. Hammond, and each of them, as his true and lawful attorneys-in-fact and agents, each with the full power of substitution, for him and in his name, place or stead, in any and all capacities, to sign any and all amendments to this Registration Statement (including post-effective amendments), and to sign any registration statement for the same offering covered by this Registration Statement that is to be effective upon filing pursuant to Rule 462(b) promulgated under the Securities Act, and all post-effective amendments thereto, and to file the same, with exhibits thereto and other documents in connection therewith, with the Securities and Exchange Commission, granting unto said attorneys-in-fact and agents, and each of them, full power and authority to do and perform each and every act and thing requisite and necessary to be done in and about the premises, as fully to all intents and purposes as he might or could do in person, hereby ratifying and confirming all that said attorneys-in-fact and agents, or their, his substitute or substitutes, may lawfully do or cause to be done by virtue hereof.
Pursuant to the requirements of the Securities Act of 1933, as amended, this Registration Statement has been signed by the following persons in the capacities and on the dates indicated.
| Signature | Title | Date | ||
| /S/ BURTON M. GOLDFIELD Burton M. Goldfield |
Chief Executive Officer (principal executive officer) | January 6, 2014 | ||
| /S/ WILLIAM PORTER William Porter |
Chief Financial Officer (principal financial and accounting officer) | January 6, 2014 | ||
| * H. Raymond Bingham |
Director |
January 6, 2014 | ||
| * Martin Babinec |
Director |
January 6, 2014 | ||
| * Kenneth Goldman |
Director |
January 6, 2014 | ||
| * David C. Hodgson |
Director |
January 6, 2014 | ||
| * Wayne B. Lowell |
Director |
January 6, 2014 | ||
II-5
Table of Contents
| Signature | Title | Date | ||
| /S/ KATHERINE AUGUST-DEWILDE Katherine August-deWilde |
Director |
January 6, 2014 | ||
| * Pursuant to Power of Attorney | ||
| By: | /S/ BURTON M. GOLDFIELD | |
| Burton M. Goldfield | ||
| Attorney-in-Fact | ||
II-6
Table of Contents
EXHIBIT INDEX
| Exhibit No. | Description of Exhibit | |
| 1.1* | Form of Underwriting Agreement. | |
| 2.1** | Equity Purchase Agreement by and among TriNet Group, Inc., Ambrose Employer Group, LLC and Gregory Slamowitz, John Iorillo and Marc Dwek, dated July 1, 2013. | |
| 2.2** | Agreement and Plan of Merger by and among TriNet Group, Inc., Champ Acquisition Corporation, SOI Holdings, Inc. and SOI Stockholder Representative, LLC, dated August 24, 2012. | |
| 2.3*** | Agreement and Plan of Merger by and among TriNet Group, Inc., Gin Acquisition, Inc. and Gevity HR, Inc., dated March 4, 2009. | |
| 3.1** | Amended and Restated Certificate of Incorporation of TriNet Group, Inc., as amended and as currently in effect. | |
| 3.2* | Form of Amended and Restated Certificate of Incorporation of TriNet Group, Inc., to be in effect upon the completion of this offering. | |
| 3.3 | Amended and Restated Bylaws of TriNet Group, Inc., as currently in effect. | |
| 3.4* | Form of Amended and Restated Bylaws of TriNet Group, Inc., to be in effect upon the completion of this offering. | |
| 4.1* | Form of common stock certificate. | |
| 4.2** | Amended and Restated Registration Rights Agreement, by and among TriNet Group, Inc., GA TriNet LLC and HR Acquisitions, LLC, dated June 1, 2009. | |
| 5.1* | Form of Opinion of Cooley LLP. | |
| 10.1** | Amended and Restated 2000 Equity Incentive Plan. | |
| 10.2** | Forms of Option Agreement and Option Grant Notice under the Amended and Restated 2000 Equity Incentive Plan. | |
| 10.3* | Amended and Restated 2009 Equity Incentive Plan. | |
| 10.4* | Form of Option Agreement and Option Grant Notice under the Amended and Restated 2009 Equity Incentive Plan. | |
| 10.5* | Form of Restricted Stock Agreement and Restricted Stock Award Notice under the Amended and Restated 2009 Equity Incentive Plan. | |
| 10.6* | Form of Restricted Stock Unit Agreement and Restricted Stock Unit Award Notice under the Amended and Restated 2009 Equity Incentive Plan. | |
| 10.7* | 2014 Employee Stock Purchase Plan, to be in effect upon completion of this offering. | |
| 10.8* | Form of Indemnification Agreement made by and between TriNet Group, Inc. and each of its directors and executive officers. | |
| 10.9* | Employment Agreement, dated November 9, 2009, between Burton M. Goldfield and TriNet Group, Inc. | |
| 10.10* | Employment Agreement, dated November 9, 2009, between Gregory Hammond and TriNet Group, Inc. | |
| 10.11* | Employment Agreement, dated August 23, 2010, between William Porter and TriNet Group, Inc. | |
| 10.12* | Employment Agreement, dated March 5, 2012, between John Turner and TriNet Group, Inc. | |
| 10.13** | First Lien Credit Agreement, dated August 20, 2013, among TriNet HR Corporation, as borrower, TriNet Group, Inc., the lenders from time to time party thereto and JPMorgan Chase Bank, N.A., as administrative agent. | |
Table of Contents
| Exhibit No. | Description of Exhibit | |
| 10.14** | Second Lien Credit Agreement, dated August 20, 2013, among TriNet HR Corporation, as borrower, TriNet Group, Inc., the lenders from time to time party thereto and Wilmington Trust, National Association, as administrative agent. | |
| 10.15** | Creekside Plaza Office Lease between Creekside Associates, LLC and TriNet Group, Inc., dated April 24, 2001. | |
| 10.16** | First Amendment to Creekside Plaza Office Lease between Creekside Associates, LLC and TriNet Group, Inc., dated June 21, 2012. | |
| 21.1** | List of subsidiaries. | |
| 23.1* | Consent of Cooley LLP (included in Exhibit 5.1). | |
| 23.2 | Consent of Ernst & Young LLP, independent registered public accounting firm. | |
| 23.3 | Consent of PricewaterhouseCoopers LLP, independent accountants. | |
| 23.4 | Consent of CohnReznick LLP, independent auditors. | |
| 24.1 | Power of Attorney (see page II-5 to this registration statement). | |
| * | To be filed by amendment. |
| ** | Previously filed. |
| *** | Filed as Exhibit 2.1 to the current report on Form 8-K of Gevity HR, Inc. filed with the Securities and Exchange Commission on March 6, 2009 (file no. 000-22701) and incorporated herein by reference. |