Attached files
| file | filename |
|---|---|
| 8-K - 8-K - BRE PROPERTIES INC /MD/ | v363432_8k.htm |
| EX-99.2 - EXHIBIT 99.2 - BRE PROPERTIES INC /MD/ | v363432_ex99-2.htm |

Combination Creates Leading West Coast Multifamily REIT
FORWARD - LOOKING STATEMENTS SAFE HARBOR STATEMENT UNDER THE PRIVATE LITIGATION REFORM ACT OF 1995 : This presentation may include “forward - looking statements” within the meaning of Section 27A of the Securities Act of 1933, as amended, and Section 21E of the Securities Exchange Act of 1934, as amended. These forward - looking statements which are based on current expectations, estimates and projections about the industry and markets in which Essex and BRE operate and beliefs of and assumptions made by Essex management and BRE management, involve uncertainties that could significantly affect the financial results of Essex or BRE or the combined company. Words such as “expects,” “anticipates,” “intends,” “plans,” “believes,” “seeks,” “estimates,” variations of such words and similar expressions are intended to identi fy such forward - looking statements, which generally are not historical in nature. Such forward - looking statements include, but are not limited to, statements about the anticipated benefits of the business combination transaction involving Essex and BRE , including future financial and operating results (such as FFO), and the combined company’s plans, objectives, expectations an d intentions. All statements that address operating performance, events or developments that we expect or anticipate will occur in the future — including statements relating to expected synergies, improved liquidity and balance sheet strength — are forward - looking statements. These statements are not guarantees of future performance and involve certain risks, uncertainties and assumptions that are difficult to predict. Although we believe the expectations reflected in any forward - looking statements are based on reasonable assumptions, we can give no assurance that our expectations will be attained and therefore, actual outcomes and results may differ materially from what is expressed or forecasted in such forward - looking statements. Some of the factors that may affect outcomes and results include, but are not limited to: (i) national, regional and local economic climates, (ii) changes in financial markets and interest rates, or to the business or financial condition of e ith er company or business (iii) changes in market demand for rental apartment homes and competitive pricing, (iv) risks associated with acquisitions, including the integration of the combined companies’ businesses, (v) maintenance of real estate investment trust (“REIT”) status, (vi) availability of financing and capital, (vii) risks associated with achieving expected revenue syn erg ies or cost savings, (viii) risks associated with the companies’ ability to consummate the merger on the terms described or at all a nd the timing of the closing of the merger, and (ix) those additional risks and factors discussed in reports filed with the Secu rit ies and Exchange Commission (“SEC”) by Essex and BRE from time to time, including those discussed under the heading “Risk Factors” in their respective most recently filed reports on Forms 10 - K and 10 - Q. Neither Essex nor BRE undertakes any duty to update any forward - looking statements appearing in this presentation. 2

▪ Q1 2014 ▪ Subject to customary closing conditions including ESS and BRE shareholder approval ▪ Each BRE share to be converted into 0.2971 shares of ESS stock plus $12.33 in cash ▪ ESS has obtained committed financing of $1 billion which is available if needed to fund the cash portion of the purchase price ▪ ESS is exploring several alternatives to fund the cash needs in the transaction including asset sales, joint ventures or new financing ▪ Pro forma ownership 63% ESS / 37% BRE TRANSACTION OVERVIEW Overview & Financing Expected Close Management Team & Board ▪ Michael Schall will be President and Chief Executive Officer of the combined company ▪ Three directors from the BRE Board will be added to ESS’s Board of Directors, bringing the total to 13 members ▪ ESS will maintain its quarterly dividend at an annual run rate of $4.84 per share Dividend Synergies ▪ Expected annual synergies to offset Prop 13 taxes ▪ The synergies relate to G&A savings and property level operations Financial Impact ▪ Expected to be NAV Neutral/Core FFO Accretive by approximately $0.05 - $0.08 per share 3

▪ Creates the leading publicly traded multifamily REIT in highly attractive West Coast markets ▪ Platform poised to achieve greater level of acquisitions and value enhancing developments ▪ Combination of best - in - class management teams and best practice sharing TRANSACTION BENEFITS 4 Leading West Coast Multifamily Platform Cost of Capital Improvement ▪ Larger scale enhances capital market opportunities ▪ Improved liquidity in both equity and debt markets ▪ Lower cost of capital over long term Enhanced Operations and Synergistic Opportunities ▪ Highly complementary footprints and strategies provide opportunity for meaningful synergies ▪ Builds upon scale of local and regional management operations ▪ Savings from reduced public company costs and overhead Essex and BRE Properties – Creates the Leading West Coast Multifamily REIT

OVERVIEW STATISTICS 5 ESS BRE COMBINED Company Inception 1971 1970 Q1 2014 Equity Market Cap 1 $6.0 billion $4.4 billion $10.4 billion Total Market Cap 1 $9.1 billion $6.3 billion $15.4 billion Debt / Total Market Cap 1 32.0% 29.3% 30.9% Units 2 34,416 21,648 56,064 Properties 2 163 76 239 Financial Occupancy 3 95.7% 94.4% 95.1% Average Rent / Unit 4 $1,616 $1,734 $1,668 Source: Public filings 1) As of 12/18/2013; Reflects simple addition of ESS and BRE excluding transaction adjustments 2 ) Unit and property counts as of 9/30/2013; Include units held in joint ventures 3) Average same - property financial occupancy for the quarter ended 9/30/2013; combined represents weighted average by total same - property revenue 4) Average same - property rent per unit for the quarter ended 9/30/2013; combined represents weighted average by total same - prope rty units

BENEFITS OF SCALE 6 The combined company would be the 3rd largest multifamily REIT by total market cap and the 13th largest REIT by equity market cap in the RMZ Source: Public filings and SNL 1) As of 12/18/2013 $ Billions $30.7 $21.6 $15.4 $9.7 $9.2 $9.1 $8.4 $7.8 $6.3 $6.1 $3.6 $1.8 $0 $5 $10 $15 $20 $25 $30 $35 EQR AVB ESS + BRE UDR AIV ESS MAA CPT BRE HME PPS AEC Multifamily REITs Total Market Capitalization 1

HIGHLY COMPLEMENTARY FOOTPRINT 7 NOI Contribution by Region BRE ESS COMBINED Northern California 37% Seattle 18% Southern California 45% Northern California 28% Seattle 14% Other 1 2% Southern California 55% Northern California 33% Seattle 16% Other 1 1% Southern California 50% 1) Includes two properties located in Phoenix, AZ (902 units) Source: Public filings as of 9/30/13

Multifamily REITs’ West Coast Exposure (# of Units) PREMIER LEADER IN WEST COAST MARKETS 8 55,162 43,058 34,416 32,444 20,746 16,121 9,975 4,146 0 10,000 20,000 30,000 40,000 50,000 60,000 ESS + BRE EQR ESS AVB BRE UDR AIV CPT % of Total Same - Property NOI 99% 38% 100% 42% 98% 41% 24% 11% # of Units Source: Public filings

Favorable Demographics • Higher Incomes • Higher Percentage of Educated 25 – 34 year olds Diverse Demand Drivers • Highest GDP in the U.S. • Job Growth Outpaces the U.S. • Centers of Innovation, Driver of Job Creation Low Supply • Long Term at Below 1% of Total Supply • High Cost of Home Ownership CONTINUED STRATEGY FOCUSING ON WEST COAST MARKETS 9 Source: National Association of Realtors , U.S. Census, Economy.com, chart data estimated High Median Home Prices Restricts Homeownership Higher Household Incomes Supply Constrained Markets 1 1) Total Supply as a % of total stock from 2003 - 2012 $0 $100,000 $200,000 $300,000 $400,000 $500,000 ESS/BRE Markets Combined U.S. 0.0% 0.4% 0.8% 1.2% ESS/BRE Markets Combined U.S. $0 $20,000 $40,000 $60,000 $80,000 ESS/BRE Markets Combined U.S.

WEST COAST STRENGTH 10 -5% 0% 5% 10% 15% 20% 25% 30% 35% 4Q02 2Q03 4Q03 2Q04 4Q04 2Q05 4Q05 2Q06 4Q06 2Q07 4Q07 2Q08 4Q08 2Q09 4Q09 2Q10 4Q10 2Q11 4Q11 2Q12 4Q12 2Q13 Cumulative Effective Rent Growth by Region West - Pacific Midwest Northeast South West Coast Markets have historically had above average rent growth vs. other regions Source: Axiometrics

WEST COAST STRENGTH 11 Source: Axiometrics Derived Rents (Actual 3Q 2008 - 2Q 2013; Forecast 3Q 2013 - 4Q 2016) 1) Top 20 MSAs excludes ESS/BRE markets but includes the other major metros in the U.S. Rent Growth in ESS/BRE Combined Markets is Expected to Exceed the U.S. and Top 20 MSAs 1 through 2016 -10% -5% 0% 5% 10% 15% 20% 25% 30% 2008 2009 2010 2011 2012 2013 2014 2015 2016 ESS/BRE Combined Portfolio Top 20 Markets (ex: West Coast) U.S.

Pro Forma Capital Structure of ESS and BRE Combined 1 PRO FORMA COMBINED CAPITAL STRUCTURE PROFILE 1 12 81% 90% 85% 19% 10% 15% ESS BRE Combined Fixed Floating Secured vs. Unsecured Debt Fixed Rate vs. Floating Rate Debt Source: Public filings 1) As of 12/18/2013; Assumes ESS forms a $1 billion joint venture to replace the bridge loan with leverage of 50 - 60%. ESS is assumed to have a 50% ownership in the venture. 2) Includes noncontrolling interest 51% 39% 45% 49% 61% 55% ESS BRE Combined Secured Unsecured Equity, 65 % 2 Preferred Stock , 1% Credit Facility, 1% Unsecured Debt, 18 % Secured Debt , 15%
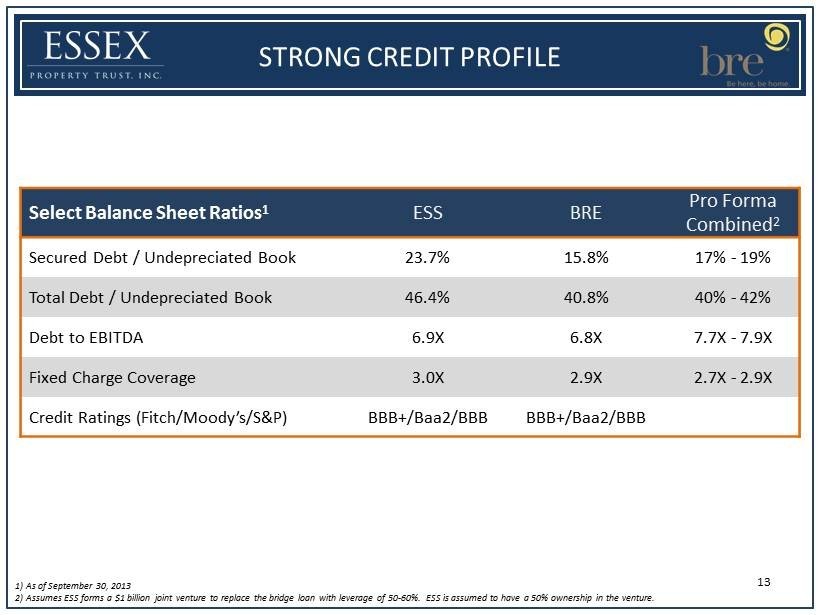
STRONG CREDIT PROFILE 13 Select Balance Sheet Ratios 1 ESS BRE Pro Forma Combined 2 Secured Debt / Undepreciated Book 23.7% 15.8% 17% - 19% Total Debt / Undepreciated Book 46.4% 40.8% 40% - 42% Debt to EBITDA 6.9X 6.8X 7.7X - 7.9X Fixed Charge Coverage 3.0X 2.9X 2.7X - 2.9X Credit Ratings (Fitch/Moody’s/S&P) BBB+/Baa2/BBB BBB+/Baa2/BBB 1) As of September 30, 2013 2) Assumes ESS forms a $1 billion joint venture to replace the bridge loan with leverage of 50 - 60%. ESS is assumed to have a 50% ownership in the venture.

Combined Maturity Schedule As of September 30, 2013 - 200 400 600 800 1,000 2013 2014 2015 2016 2017 2018 2019 2020 2021 2022 2023 Thereafter ESS BRE % of Debt Maturing 0.4% 2.0% 1.4% 8.7% 14.3% 7.4% 13.7% 17.2% 12.7% 6.2% 12.1% 3.9% WELL LADDERED DEBT MATURITY PROFILE 14 $ Millions Source: Public filings

COMBINATION WITH BRE CREATES… 15 x Leading West Coast Multifamily REIT x Increased Scale and Liquidity x Significant O pportunities to Realize Synergies x Cost of Capital Benefits x Core FFO Accretion 1 x Management Team with a Track R ecord of Delivering Superior Total Shareholder Returns 1) Core FFO excludes acquisition costs and non - routine items.

ADDITIONAL INFORMATION ABOUT THIS TRANSACTION 16 In connection with the proposed transaction, Essex Property Trust, Inc. (“Essex”) expects to file with the SEC a registration statement on Form S - 4 that will include a joint proxy statement of Essex and BRE Properties (“BRE”) that also constitutes a prospectus of Essex. Essex and BRE also plan to file other relevant documents with the SEC regarding the proposed transaction . INVESTORS ARE URGED TO READ THE JOINT PROXY STATEMENT/PROSPECTUS AND OTHER RELEVANT DOCUMENTS FILED WITH THE SEC IF AND WHEN THEY BECOME AVAILABLE, BECAUSE THEY WILL CONTAIN IMPORTANT INFORMATION. You may obtain a free copy of the joint proxy statement/prospectus (if and when it becomes available) and other relevant documents filed by Essex and BRE with the SEC at the SEC’s website at www.sec.gov. Copies of the documents filed by Essex with the SEC will be available free of charge on Essex’s website at www.essexpropertytrust.com or by contacting Essex Investor Relations at 650 - 494 - 3700 . Copies of the documents filed by BRE with the SEC will be available free of charge on BRE’s website at www.breproperties.com or by contacting BRE Investor Relations at 415 - 445 - 3745 . Essex and BRE and their respective directors and executive officers and other members of management and employees may be deemed to be participants in the solicitation of proxies in respect of the proposed transaction. You can find information about Essex’s executive officers and directors in Essex’s definitive proxy statement filed with the SEC on April 1, 2013 . You can find information about BRE’s executive officers and directors in BRE’s definitive proxy statement filed with the SEC on March 11, 2013. Additional information regarding the interests of such potential participants will be included in the joint proxy statement/prospectus and other relevant documents filed with the SEC if and when they become available. You may obtain free copies of these documents from Essex or BRE using the sources indicated above. This document shall not constitute an offer to sell or the solicitation of an offer to buy any securities, nor shall there be any sale of securities in any jurisdiction in which such offer, solicitation or sale would be unlawful prior to registration or qualification under the securities laws of any such jurisdiction. No offering of securities shall be made except by means of a prospectus meeting the requirements of Section 10 of the U.S. Securities Act of 1933, as amended.