Attached files
| file | filename |
|---|---|
| 8-K - FORM 8-K - TELEFLEX INC | d645298d8k.htm |
| EX-99.1 - EX-99.1 - TELEFLEX INC | d645298dex991.htm |
 Teleflex Incorporated
2013 Analyst Day
Jake Elguicze –
Treasurer and Vice President of Investor Relations
Exhibit 99.2 |
 Agenda
Strategic Overview
Benson Smith –
Chairman, President & Chief Executive Officer
Gross Margin Opportunities
Liam Kelly –
Executive Vice President and President, International
Tony Kennedy –
Senior Vice President, Global Operations
Product Mix & Innovation
Jay White –
Surgical Division
Jan Verstreken –
President, Asia Pacific
Justin McMurray –
Vice President and General Manager, Vidacare
Question & Answer
Break
2 |
 Agenda
– Continued
Financial Overview
Thomas Powell –
Executive Vice President & Chief Financial Officer
Closing Comments
Benson Smith –
Chairman, President & Chief Executive Officer
Question & Answer
Product Demonstrations
Lunch Reception
3 |
 4
Forward Looking Statements
This presentation and our discussion contain forward-looking information and statements
including, but not limited to, our forecasted 2013 constant currency revenue growth, adjusted
gross and operating margins and adjusted earnings per share; our longer-term financial goals of
achieving constant currency revenue growth of 5%, adjusted gross margin of 55%, investment
in research and development of 5% and adjusted operating margin of 25%; our expectations with
respect to new product introductions; our ability to reduce our facility footprint and relocate
manufacturing to low-cost locations, reduce direct material spending and make improvements
to packaging and invest in automation and become less reliant on manual labor; our ability to
improve gross margin by 250bps to 350bps over a multi-year period; strategic priorities and
objectives for our Surgical division and our LMA business; our expectation that the Vidacare
business will contribute between $68 million and $72 million to our 2014 revenue and between
$0.10 and $0.15 to our 2014 adjusted earnings per share; our preliminary 2014 forecast with
respect to constant currency revenue growth, gross margin, adjusted operating margin and
adjusted earnings per share and the assumptions underlying those forecasted items; and other
matters which inherently involve risks and uncertainties which could cause actual results to
differ from those projected or implied in the forward–looking statements. These risks and
uncertainties are addressed in the Company’s SEC filings, including its most recent Form
10-K.
This presentation includes certain non-GAAP financial measures, which include constant
currency revenue growth; adjusted gross and operating margins; adjusted earnings per share.
Reconciliation of these non-GAAP measures to the most comparable GAAP measures is
contained within this presentation.
The following slides reflect continuing operations. |
 Teleflex Incorporated
2013 Analyst Day
Benson Smith –
Chairman, President and Chief Executive Officer |
 6
Key Themes
Teleflex Today Versus 2010
Preliminary 2013 Year In Review
Preliminary 2014 Revenue Outlook
Longer-Term Strategy and Opportunities |
 7
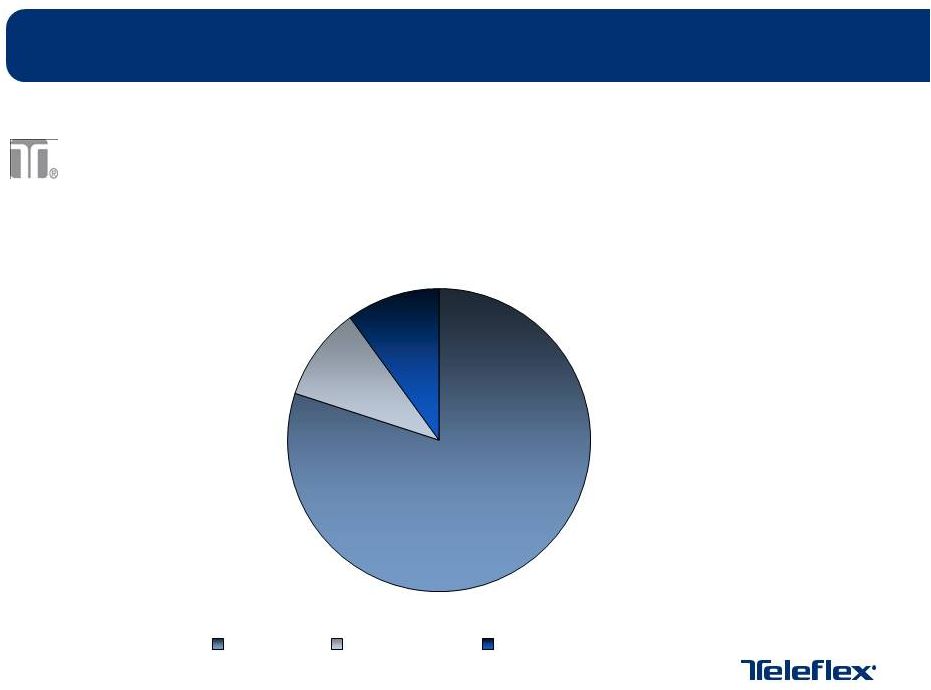
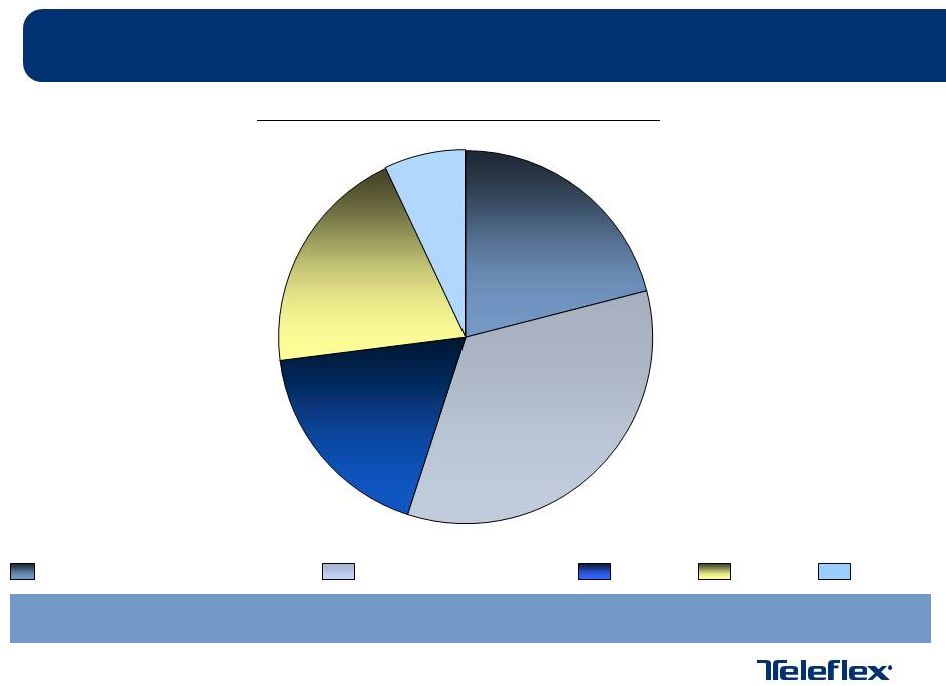
Teleflex in 2010
Multi-industry company with businesses serving Medical,
Aerospace and Commercial markets
Note: amounts per 2010 Form 10K.
2010 Revenue by Business Segment
10%
10%
80%
Medical
Aerospace
Commercial |
 8
Medical Division in 2010
Division aligned solely by geographic region
Year-over-year constant currency revenue growth of 1%
compared to 2009
Minimal revenue associated with new product introductions
History of declining ASPs
Significant backorders and poor on-time delivery record
Market capitalization of ~2.2 billion as of December 31, 2010
|
 9
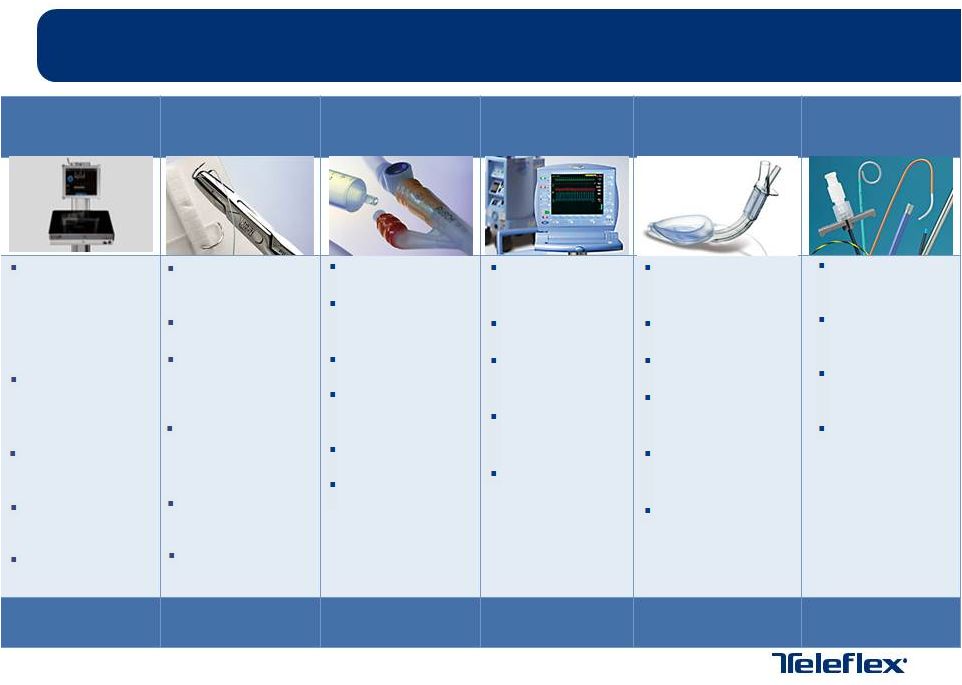
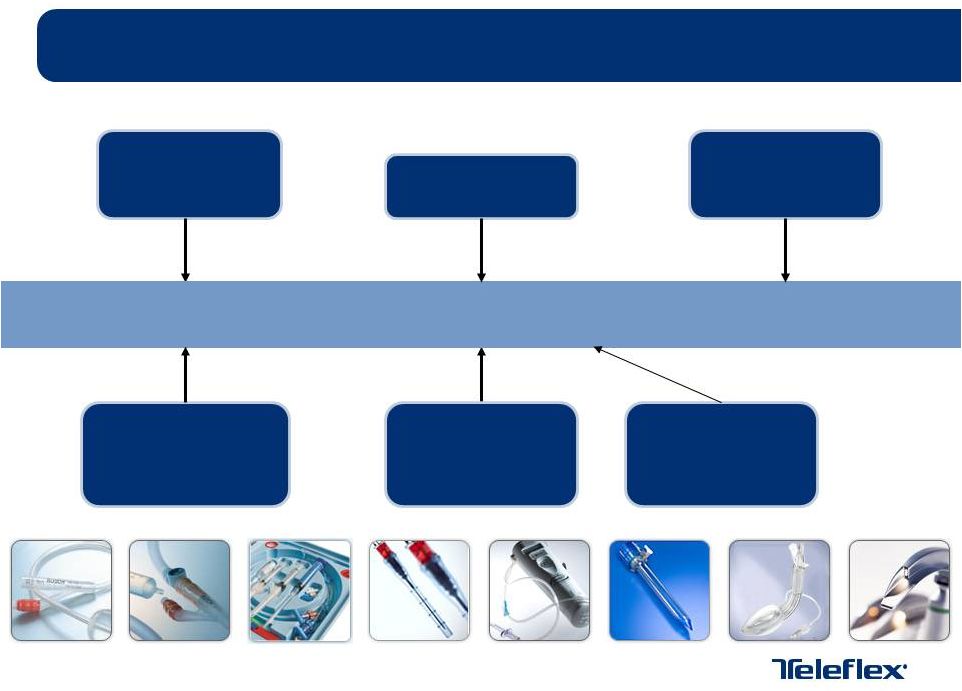
Teleflex Today
Vascular
Access
Surgical
Specialty
Cardiac Care
Anesthesia /
Respiratory
OEM
Central,
Peripheral and
Arterial Vascular
Access
Catheters
Catheter Tip
Positioning
Systems
Intraosseous
access devices
Sheath
Introducers
Vascular Access
Accessories
Ligation
Systems
Closure Devices
Laparoscopic
Access
Ports/Trocars
General &
Specialty
Instruments
Chest Drainage
Systems
CV Sutures
Foley Catheters
Intermittent
Catheters
Atomization
Dialysis
Catheters
PTA Balloons
Interventional
Access
Intra Aortic
Balloon Pumps
IAB Catheters
TransRadial
Access
Right Heart
Products
Percutaneous
Sheath
Introducers
Supraglottic
Airways
Atomization
Epidurals
Peripheral Nerve
Blocks
Airway
Management
Respiratory
Therapy
Specialty
Sutures
Catheter
Fabrication
Performance
Fibers
Custom
Engineered
Precision
Extrusion |
 10
Teleflex Today
Diverse product portfolio capable of above-market growth rates
Demonstrated the ability to increase ASPs over multi-year period
in cost-sensitive hospital environment
Enhanced product pipeline through a combination of internally
developed and externally acquired technologies
Substantial improvements made in backorders and on-time
delivery metrics lead to GPO industry recognition
Market capitalization of ~4.0 billion as of December 13, 2013
|
 11
Preliminary 2013 Year In Review
Domestic utilization declines and European austerity measures
pressure mature healthcare markets and Teleflex constant
currency revenue growth rates as compared to initial
expectations
Despite macro uncertainty, Teleflex able to grow revenues above
market growth rates through acquisition of LMA, new product
introductions and contribution from price increases
Positioned for sustainable revenue growth through continued
expansion of GPO and IDN relationships
20 new agreements awarded and 7 agreements renewed through September 2013
|
 12
Preliminary 2013 Year In Review
Profitability improvement and facility rationalization initiatives
continue
Completed the North American Distribution Center consolidation program and
integration of legacy Arrow ERP system to Teleflex SAP platform
Integration of LMA acquisition is ahead of schedule
Completed additional technology / strategic acquisitions to
augment existing strategic business unit franchises
Vidacare Corporation (Vascular and Interventional Access)
Eon Surgical (Surgical)
Ultimate Medical (Anesthesia) |
 13
Updated 2013 Outlook
Constant currency revenue growth expected to be between 8.0%
and 8.7%
Adjusted gross margins expected to be between 49.5% and 50%
Adjusted operating margin expected to be between 16% and 17%
Adjusted earnings per share expected to be between $4.85 to
$5.00 |
 14
Preliminary 2014 Revenue Outlook
Preliminary 2014 constant currency revenue growth excluding
impact of Vidacare acquisition of between 3% and 5%
Vidacare expected to contribute between $68 to $72 million in
revenue, or an additional 4.0% to 4.5% of constant currency
revenue growth in 2014
Preliminary 2014 constant currency revenue growth including
impact of Vidacare acquisition of between 7% and 9% |
 15
Preliminary 2014 constant currency revenue growth expectations
assume modest growth in mature markets
Investments in emerging markets (i.e. China and Latin America)
continue to pay benefits and are anticipated to lead to higher
overall revenue growth
Vidacare, LMA, distributor to direct conversions, and mix of
higher-margin new product introductions expected to impact
margins favorably
Preliminary 2014 Revenue Outlook |
 16
Longer-Term Strategy and Opportunities
Near-term uncertainty brought to healthcare marketplace due to
implementation of Affordable Care Act
Teleflex portfolio is well-positioned to take advantage of shifting
healthcare environment
Product lines designed to gain from aging demographics phenomena
Not overly susceptible to elective procedure fluctuations or seasonality
Products represent small portion of overall procedure cost
Capital equipment represents minimal portion of product portfolio
Products designed to aide healthcare providers in reducing overall
procedure cost |
 17
Longer-Term Strategy and Opportunities
To be successful in the future, Teleflex strategy is not dependent
upon continued generation of above-market revenue growth
Focused areas of additional investment
Select distributor to direct conversions in Asia
Investments in sales and marketing in China and Latin America
R&D increases targeted to higher-margin product areas
Evaluating opportunities to improve operating leverage |
 18
Longer-Term Strategy and Opportunities
Opportunistic approach to future M&A
Continue to focus on combination of small to mid-sized
technology and strategic acquisitions within our existing product
verticals
Continue to evaluate existing product portfolio and SKU
rationalization opportunities
Prudent and conservative approach to future capital deployment
|
 19
Longer-Term Strategy and Opportunities
Remain committed to achievement of longer-term financial goals
Constant currency revenue growth of 5%
Adjusted gross margin of 55%
Investment in research and development of 5%
Adjusted operating margin of 25% |
 Thank you for your attention |
 Teleflex Incorporated
2013 Analyst Day
Liam Kelly –
Executive Vice President & President, International
|
 Key
Themes Teleflex International Today Versus 2010
International Strategy
International Product Pipeline
22 |
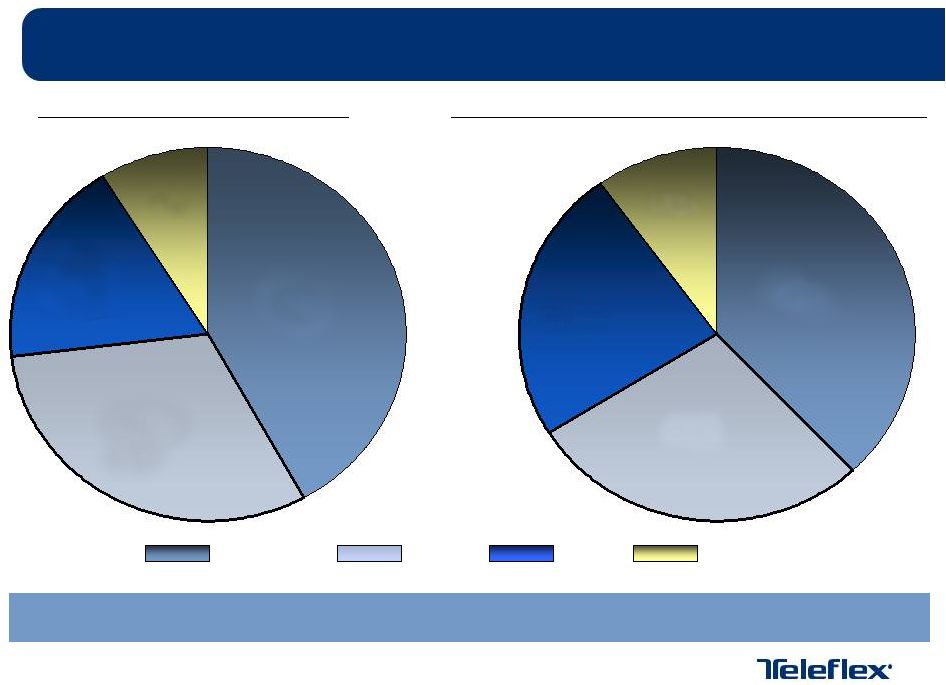
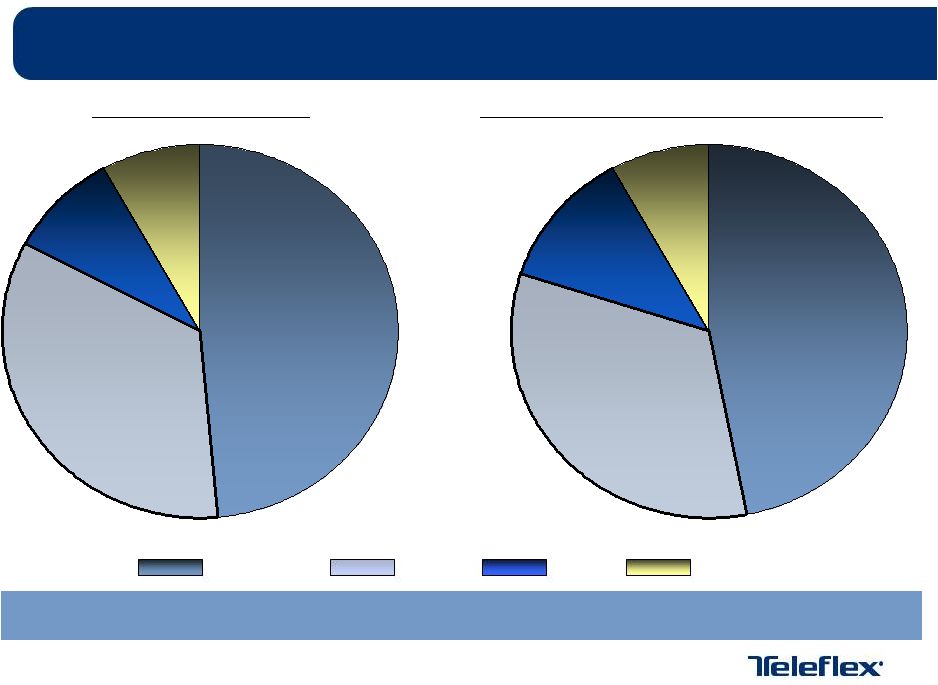 Teleflex International Today versus 2010
9%
34%
48%
8%
12%
33%
47%
8%
2010 Net Revenues
September 2013 YTD Net Revenues
Americas
EMEA
Asia
OEM
Note: amounts per 2012 Form 10K and September 2013 Form 10Q.
TFX
Constant
Currency
Revenue
Growth
Highest
in
International
Markets
in
2013
23 |
 Teleflex International Today
September 2013 YTD Net Revenues
Vascular & Interventional Access
Anesthesia & Respiratory
Urology
Surgical
Note: sourced from Company data.
International Markets Not Dependent Upon any One Product or Procedure
Cardiac
24
20%
18%
34%
21%
7% |
 Teleflex International Today versus 2010
2010 Segment Operating Profit
September 2013 YTD Segment Operating Profit
Americas
EMEA
Asia
OEM
Note: amounts per 2012 Form 10K and September 2013 Form 10Q.
TFX Segment Operating Margins Highest in International Markets in 2013
25
18%
31%
42%
9%
24%
28%
38%
10% |
 26
International Strategy (SMART)
Sales Growth
Continue investment in China and Southeast Asia
Make channel investments to control the customer relationship
Focus on product registrations and clinical education
Improve pricing through distributor to direct conversions / increased prices to
distributors Margin Expansion
Rationalize sales of third-party products in EMEA
Continue product mix shift towards sale of higher-margin products
Acquisitions
Target acquisitions that leverage sales channel and integrate efficiently
R&D Investments
Invest 5% of revenue in R&D
Generate 3% revenue growth per year from new product introductions
Talent Development
Invest in our People
Develop the leaders of tomorrow |
 27
International Product Pipeline
2014
Pre-Activated
Intermittent
Catheters
Surgical Clip
Products in
China
LMA Protector
Microlap Surgical
Approach
2015
2016
Next Generation
Intra-Aortic
Balloon Pump
LMA with Cuff Pilot
EZ Blocker in Asia
Note: New product introductions subject to obtaining required governmental approvals
and authorizations. |
 28
International Summary
Well defined strategy
Significant top-line growth rates
Segment Operating Margins Above Company Average
New product pipeline, combined with distributor to direct conversions,
positions International for further growth and margin expansion
|
 Teleflex Incorporated
2013 Analyst Day
Tony Kennedy –
Senior Vice President, Global Operations |
 30
My Background
Joined Teleflex in June of 2007
Previously responsible for all aspects of Teleflex’s International
supply chain and operations efforts
Promoted to the position of Senior Vice President of Global
Operations role in 2013
Previously held similar operationally focused positions with Philips,
Marconi, Biomedical Research and Saint Gobain |
 31
Global Operations
In mid-2010, Teleflex announced longer-term goals and objectives,
including a goal of obtaining 55% gross margin
While operating in a difficult macro-environment, the Company has
made progress toward the achievement of this goal through:
Prices increases
Introduction of higher-margin products
Acquisition of companies like LMA and Vidacare
Facility eliminations
SKU Rationalization efforts
Product cost reductions |
 32
Global Operations
Global Operations team created earlier this year to focus on
establishing a world-class, value-adding and efficient supply chain
organization to meet our customer’s needs
We are evaluating opportunities to improve operating leverage
over a multi-year period, though no plans approved to date
|
 Global Operations
While we are still in the process of evaluating all of our options, we
think there is an opportunity to:
•
Reduce facility footprint and relocate manufacturing capacity to
low-cost
locations
•
Reduce direct material spending and make improvements to packaging
•
Invest in automation and become less reliant on manual labor
Through these and other initiatives, we believe there is an
opportunity to improve gross margin by 250bps to 350bps over
a multi-year period
33 |
 |
 Teleflex Incorporated
2013 Analyst Day
Jay White –
Surgical Division |
 36
Key Themes
Surgical Strategic Priorities
Closure Objectives and New Product Launches
Access Objectives and New Product Launches
Microlaparoscopy Objectives and New Product Launches
Summary |
 37
Surgical Strategic Priorities
Strategic Summary
To become a leading, global surgical device business focused on customer
solutions Closure Objectives
Drive penetration and expand market opportunity for existing polymer ligation
platform Successful development and execution of automatic ligation
platform Optimize pull thru with robotic procedures
Access Objectives
Development of next generation port closure platform
Continued partnership with robotics companies
Microlaparoscopy Objectives
Execute on platform development for our focused procedural rollout
Elevate surgical brand identity
Attract strategic partners for complementary advanced technologies
Successful commercialization of Weck EFx – Endo Facial Closure System
Successful commercialization of Weck Vista – Bladeless Laparoscopic Access Ports |
 38
Global Closure Market
$442
$465
$488
$506
$537
$569
$162
$173
$184
$196
$208
$220
$477
$483
$490
$500
$530
$561
$0
$200
$400
$600
$800
$1,000
$1,200
$1,400
$1,600
2012
2013
2014
2015
2016
2017
Appliers
Clips
Suture
Market data based on management estimates. Actual amounts could differ.
|
 39
Closure Objectives
Core Existing Products
Drive penetration and expand market opportunity for existing polymer
ligation platform
Successful development and execution of automatic ligation platform
Optimize pull thru with robotic procedures
New Product Offerings
Disposable automatic enhancements and extension
Reposable
automatic
platform
–
multiple
sizes
and
materials |
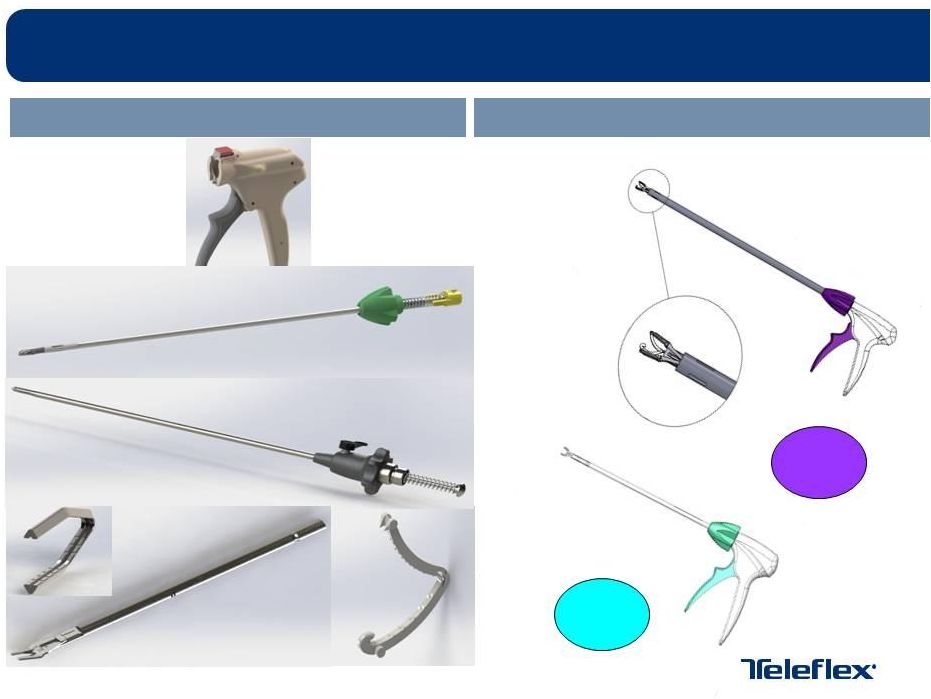 40
Reposable Platform
Disposable Platform
Closure New Product Offerings
L
10mm
ML
5mm
Note: New product introductions subject to obtaining required governmental approvals
and authorizations. |
 41
Global Access Market
Market data based on management estimates. Actual amounts could differ.
$747
$755
$763
$772
$778
$783
$720
$730
$740
$750
$760
$770
$780
$790
2012
2013
2014
2015
2016
2017 |
 42
Access Objectives
Core Existing Products
Continued partnership with robotics companies
Successful
commercialization
of
Weck
EFx
–
Endo
Facial
Closure
System
Successful
commercialization
of
Weck
Vista
–
Bladeless
Laparoscopic
Access Ports
New Product Offerings
Next generation port closure platform
Next generation access port seal system |
 43
Next Generation Port Closure
Addresses concern over sharps into
the cavity
Potential for closure without direct
visualization
Next Generation Access Port
Seal System
Universal capabilities
Mitigates cost and dependence on
magnet components
Access New Product Offerings
Note: New product introductions subject to obtaining required governmental approvals
and authorizations. |
 44
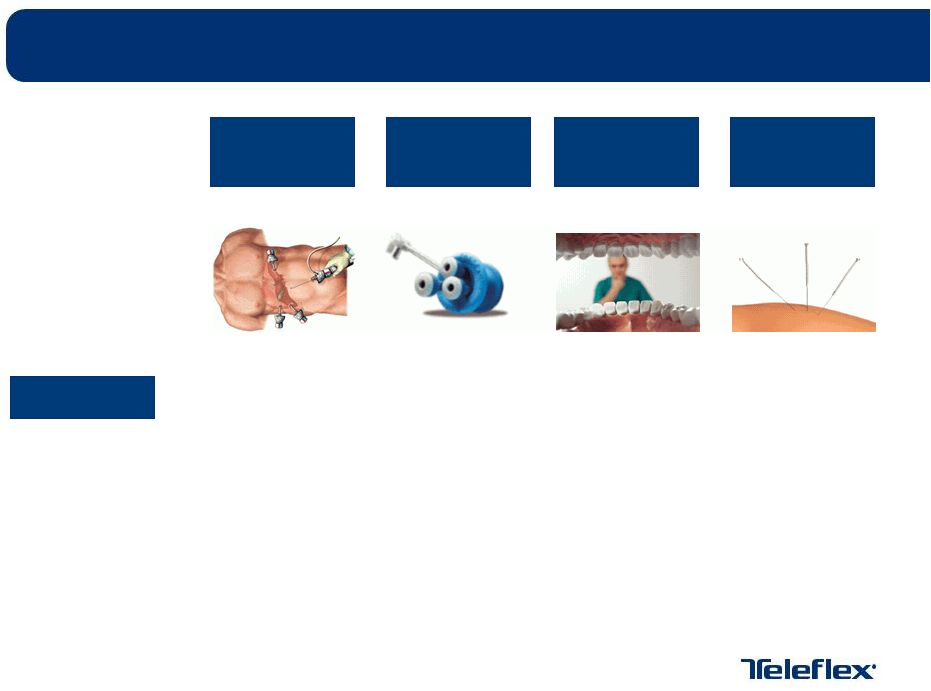
Evolution of Minimally Invasive Surgery
Standard
Laparoscopy
Single Port
NOTES
Micro
Laparoscopy
What is it?
Three or
more 5-12
mm devices
in abdomen
All devices
used through
single
umbilical port
Devices
inserted
through
natural
orifice and
internal
incisions
Standard
umbilical
port +
multiple ~2.5
mm devices |
 45
Evolution of Minimally Invasive Surgery
Standard
Laparoscopy
Single Port
NOTES
Micro
Laparoscopy
Current
Standard of
Care
Almost invisible
umbilical scar
Reduced post-
operative pain
Less blood loss
Faster recovery
Pros
No external
scarring
Fewer
infections
Less hernia
formation
Reduced
scarring
Preserves
triangulation
No re-training |
 46
Evolution of Minimally Invasive Surgery
Standard
Laparoscopy
Single Port
NOTES
Micro
Laparoscopy
Lack of
triangulation
Risk of seroma
or hernia
Requires re-
training
Increased
operation time
Cost
Cons
Poor
availability of
optimized
equipment
Not
reimbursed
Requires re-
training
Ergonomics
of tools
Full line of
surgical tools
not available
Size of the
working end
Strength of
device |
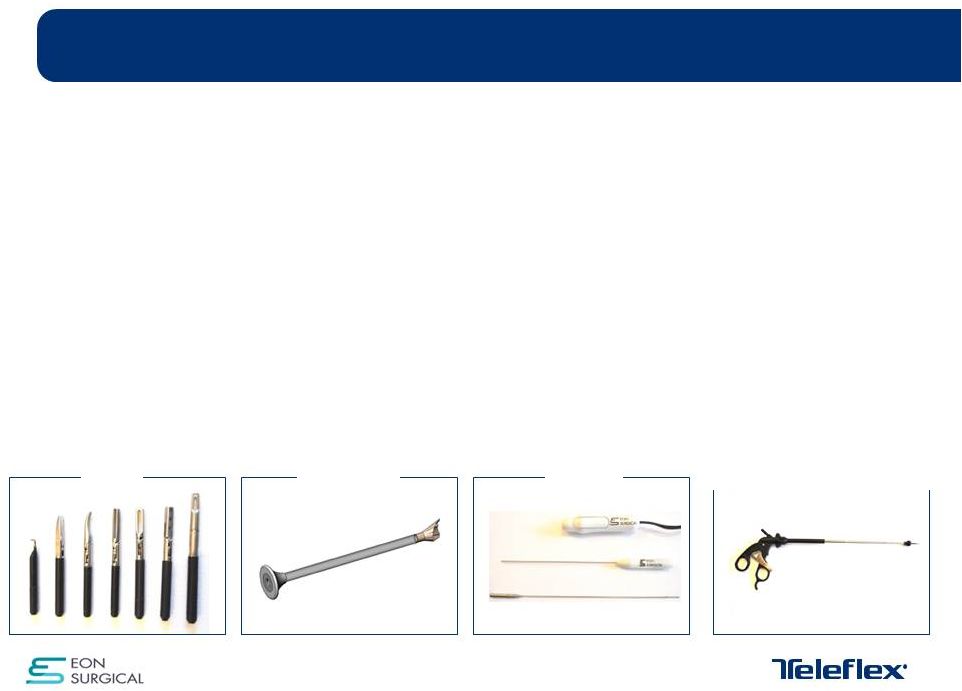 47
Eon Surgical –
Overview
Tools
Intersleeve
Camera
Telescoping Needle with Handle
Acquired in June of 2013, Eon Surgical is a late stage development
company that has advanced a minimally invasive micro-laparoscopy
surgical
platform
technology
designed
to
enhance
surgeons’
ability
to
perform scarless surgery while producing better patient outcomes
Developed the InterTip™
platform, a complete solution for performing
scarless laparoscopic surgery, that unlike single-port laparoscopy
allows the surgeon to maintain the triangulation of standard
laparoscopic surgery |
 Patented Approach to Percutaneous Surgery
Step 1:
Percutaneous entry of 3mm
instrument and insertion of standard 10mm
port in umbilicus
Step 2:
Insertion of patented intersleeve
through trocar. Distal end of instrument shaft
exits through intersleeve
Step 3:
Attachment / detachment of
exchangeable 5mm or larger end-effectors
48 |
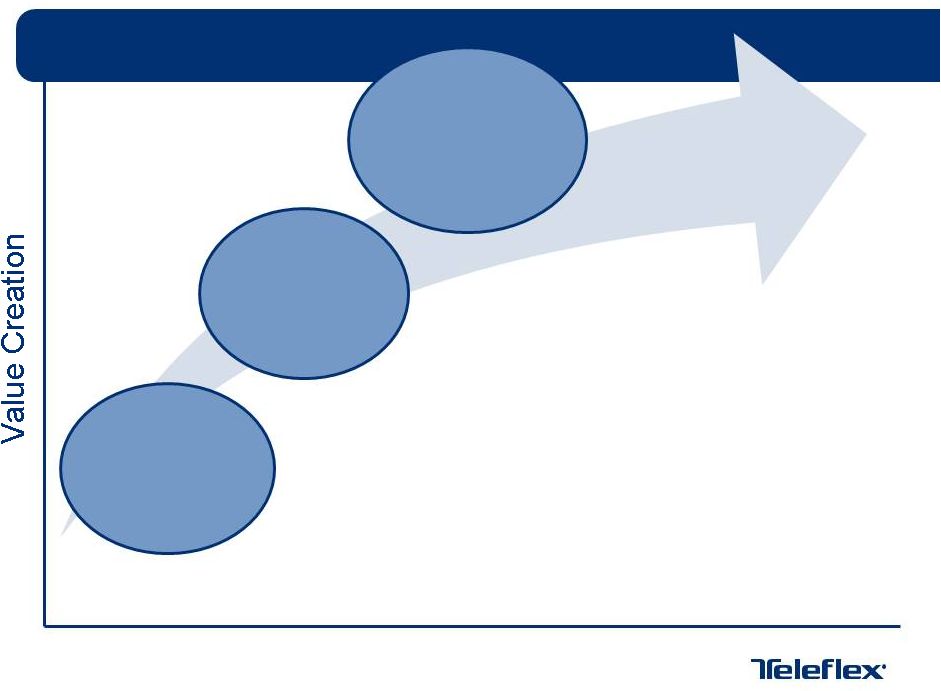 •
Aligned focus and resources
•
Selective market investment
•
Revenue growth from higher-margin products
•
Technology advancements
•
New technology adoption
•
Compress development cycle
•
Market development/professional education
•
Customer advocacy
•
Robust R&D pipeline
•
Transformational technologies
•
Customer advocacy
•
Brand strength
Innovative
Time
Surgical Strategy
Faster
Focused
49 |
 Thank you for your attention |
 Teleflex Incorporated
2013 Analyst Day
Jan Verstreken –
President, Asia Pacific |
 52
Key Themes
Laryngeal Mask Industry Trends
LMA Integration Update
LMA Strategic Priorities
LMA New Product Launches |
 53
Increased market adoption of second generation LMA device
Clinicians desire ability to monitor cuff-pressure
Interest in use of laryngeal masks in longer procedures
Growing desire in adding visualization to airway management
Laryngeal Mask Industry Trends |
 54
On-pace to achieve 2013 revenue expectations and exceed 2013
adjusted earnings per share expectations
Multi-year integration of LMA acquisition ahead of schedule
Continued market adoption of second generation device in all
regions
2013 acquisition of Ultimate Medical, and associated cuff-pilot
technology, provides opportunity to enhance revenue growth
LMA Integration Update |
 55
LMA Strategic Priorities
Strategic Summary
Maintain global leadership position in supra-glottic airway management.
Make Teleflex supra-glottic airway devices the number one choice of
clinicians when selecting a ventilation option
Increase indications for use of second generation product and continue global
upgrade from use of first generation to second generation devices Make cuff pressure
indication a standard feature for supra-glottic airway devices and integrate Ultimate Medical
cuff-pilot technology into LMA product
Invest in emerging markets and build adoption of laryngeal masks versus
endotracheal tubes
Nasal drug delivery is in its infancy; atomization is positioned to take advantage and
exploit vaccination market
|
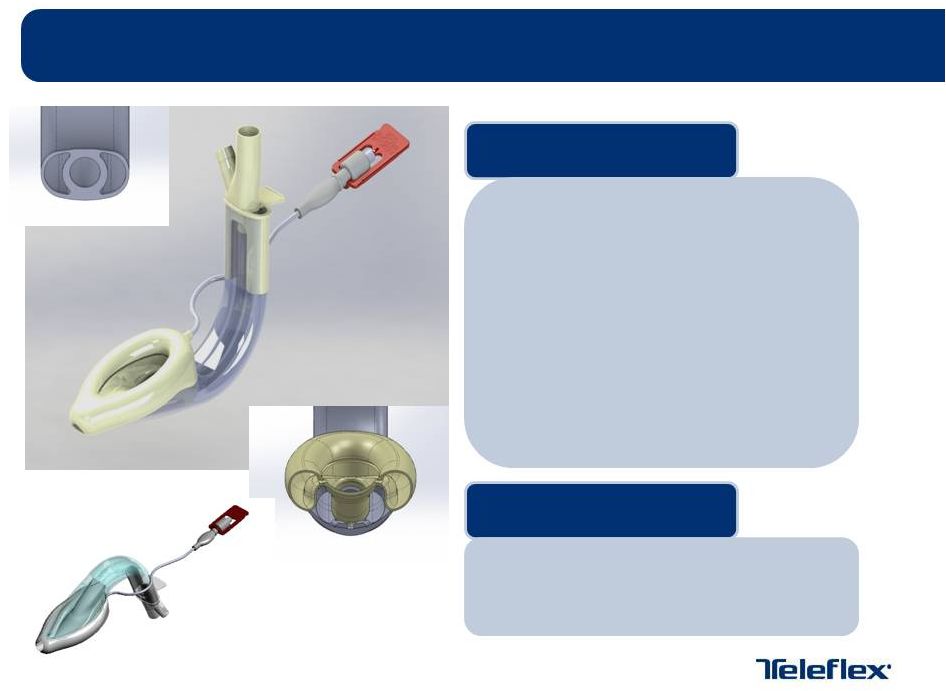 56
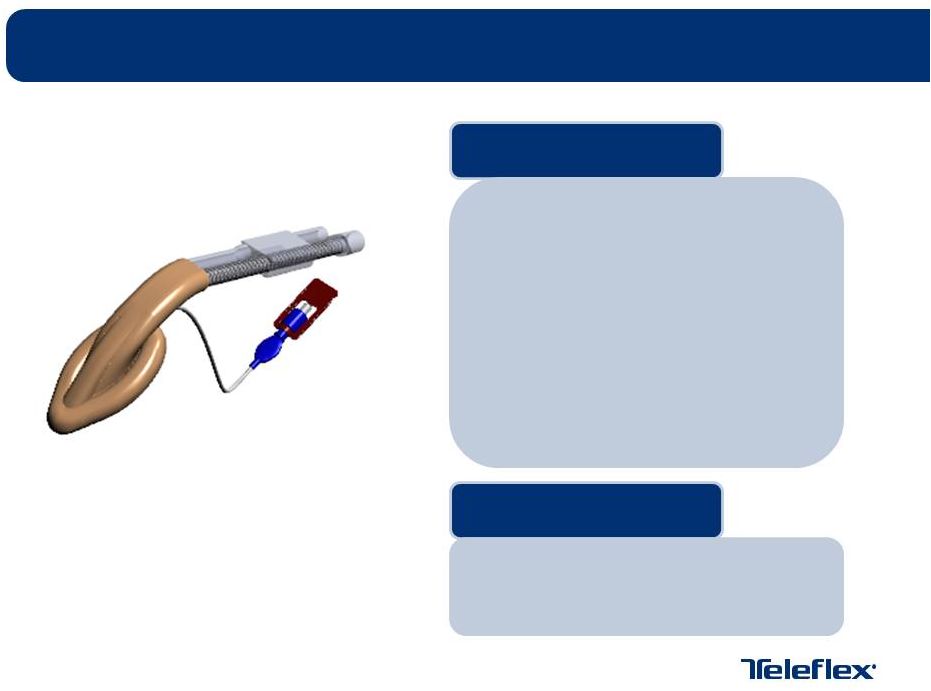
PRODUCT DESCRIPTION
3rd Generation Laryngeal Mask Airway
All silicone, single use product
Flexible fixed-curve tube allows ease of
insertion ‘non-digital’
and anatomical
conformity
Dual gastric drainage channel and
pharyngeal chamber to improve laryngeal
seal during high volume regurgitation
Integrated suction port
LAUNCH DATE
Expected launch Q3 2014
New Product Launches –
LMA Protector™
Note: New product introductions subject to obtaining required governmental approvals and
authorizations. |
 PRODUCT DESCRIPTION
Laryngeal Mask Airway
for upper endoscopic
procedures, to provide an airway while not
impeding use of the endoscope
All Silicone, single use product
Large diameter endoscope channel
Atraumatic endoscope insertion
Protection of endoscope with integrated bite
block
Easy fixation with attached strap
LAUNCH DATE
Expected launch Q3 2014
New Product Launches –
LMA Endoscopy
Note: New product introductions subject to obtaining required governmental approvals
and authorizations. 57 |
 PRODUCT DESCRIPTION
2nd Generation Laryngeal Mask Airway for
shared airway procedures offering improved
protection against regurgitation and
aspiration
All silicone, single use product
Low profile back plate for easy access to
operating field
Dual function bite block: “non-digital
insertion”, clips on drain tube and allows
tubes to be separated
LAUNCH DATE
Expected launch Q4 2014
New Product Launches –
LMA Flexible™
Gastric Access
58
Note: New product introductions subject to obtaining required governmental approvals and
authorizations. |
 59
Thank you for your attention |
 Teleflex Incorporated
2013 Analyst Day
Justin McMurray –
Vice President & GM of Vidacare |
 61
Vidacare Corporation –
Overview
Established in 2001, Vidacare Corporation is the developer of a broad
technology platform that is defining the field of intraosseous (inside the
bone) medicine.
Focus on enhancing clinical efficacy, patient safety and comfort, and
reducing complications and their associated costs.
87 Issued and 8 pending patent applications. |
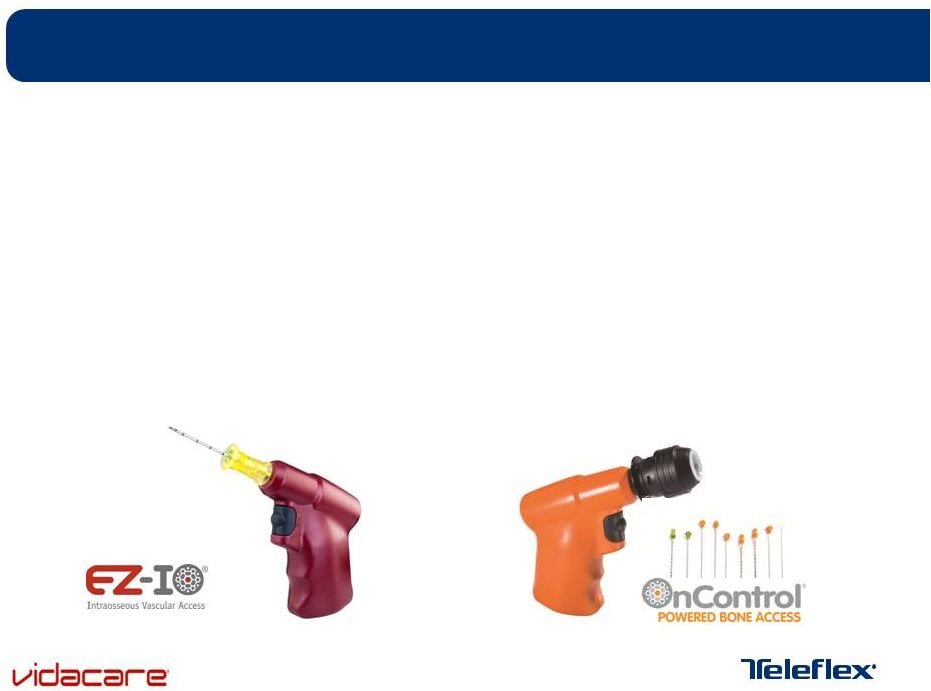
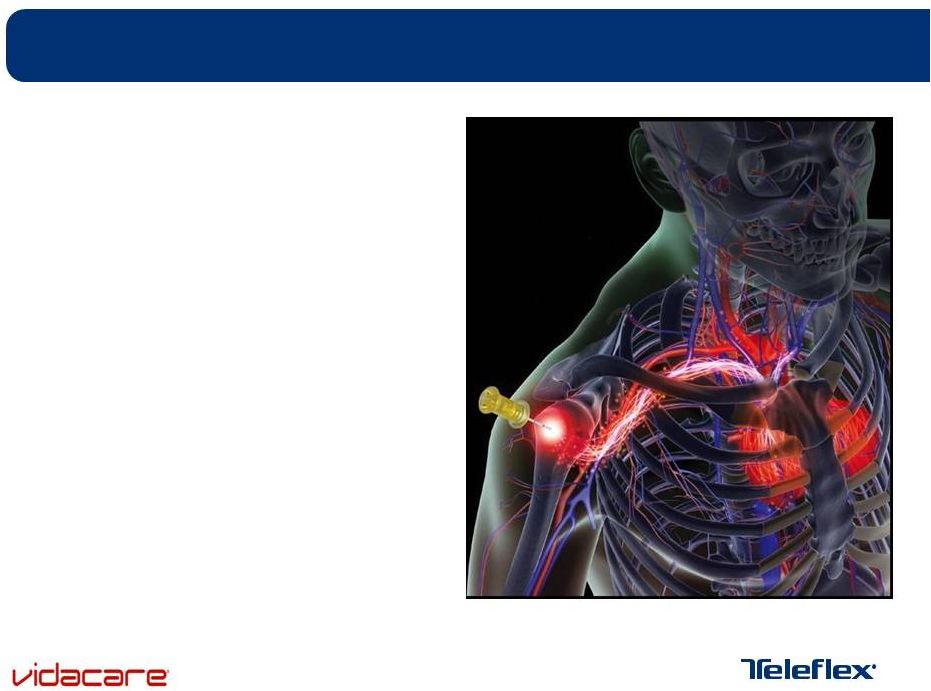 62
EZ-IO®
Intraosseous Vascular Access
EZ-IO
®
provides an elegant
solution for Difficult Vascular
Access.
•Safe: <1% serious complication rate
•Fast: Vascular access with anesthesia
and good flow in 90 seconds
•Efficient: 97% first-attempt access
success rate
•Versatile: Can be placed by any
qualified healthcare provider
•Convenient: Requires no additional
equipment or resources
V |
 63
OnControl™
Bone Marrow Biopsies
OnControl
™
Bone Marrow Biopsies:
The first significant advance to bone marrow
biopsies in more than 50 years.
•98% core capture rate on the first attempt
•Higher quality sample
•Easier and faster
•Less patient pain |
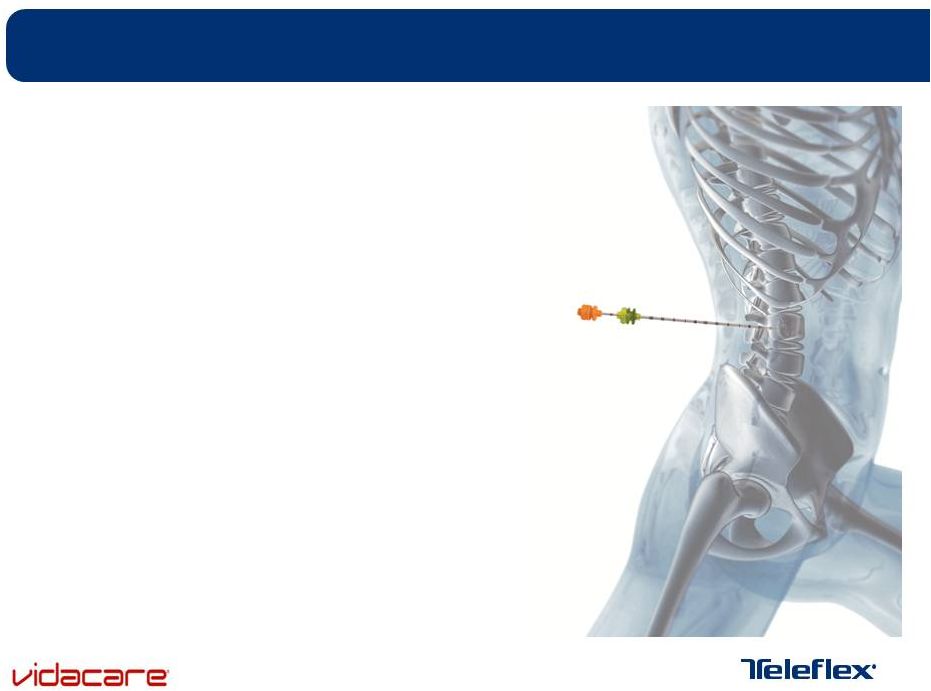 64
OnControl™
Bone Access System
Hard Bone Lesions Made Easy
•
Rapid
Access
to
difficult
bone
lesions
•
Quality
Exceptional
core
biopsy
samples,
quickly and consistently
•
Precise
Control
with
clear
visibility
through
imaging |
 65
The EZ-IO Intraosseous Infusion System Training
https://www.dropbox.com/home/2013%20Analyst%20Day |
 66
OnControl Single Needle Approach
https://www.dropbox.com/home/2013%20Analyst%20Day |
 67
Vidacare Corporation –
Summary
Expands vascular access product portfolio with a defining
technology and moves TFX into the IO segment
Strengthens EMS channel & Nursing call points
High gross and operating margin profile consistent with longer-term
corporate objectives
Accretive transaction which is expected to contribute between $68
and $72 million of Revenue and $0.10 to $0.15 of Adjusted Earnings
per Share in 2014 |
 Thank you for your attention |
 Question and Answer Session |
 Intermission |
 Teleflex Incorporated
2013 Analyst Day
Thomas Powell –
Executive Vice President and Chief Financial Officer |
 72
Key Themes
Updated 2013 Financial Outlook
Preliminary 2014 Financial Outlook and Assumptions
Summary |
 73
Updated 2013 Financial Outlook
Constant currency revenue growth expected to be between 8.0%
and 8.7%
•
Previously provided constant currency revenue growth range of 8.5% to 10%
Adjusted gross margins expected to be between 49.5% and 50%
Adjusted operating margin expected to be between 16% and 17%
•
Medical device tax to negatively impact year-over-year results by ~1%
Adjusted earnings per share expected to be between $4.85 to $5.00
|
 74
Preliminary 2014 Financial Outlook and Assumptions
Constant currency revenue growth expected to be
between 7% and 9%
•
Full year impact of Vidacare and distributor-to-direct conversions
•
Growth from new product pipeline comparable to 2012-2013 levels
•
Assumption of modest base volume growth
•
Distributor-to-direct strategy yields majority of pricing gains; product
pricing opportunities will be selective |
 75
Gross margin anticipated to improve by approximately 200bps to
300bps and reach 52.0% to 52.5%
•
Vidacare acquisition at 85% gross margin
•
Pricing and margin gains from distributor to direct strategy
•
Manufacturing cost improvement programs
Adjusted operating margin expected to be between 17% and 18%
•
Gross margin gains tempered by investment in distributor-to-direct
strategy and Vidacare’s higher relative SG&A
Tax strategies expected to drive sustainable reduction in GAAP and
Non-GAAP tax rate
Preliminary 2014 Financial Outlook and Assumptions |
 76
Adjusted earnings per share anticipated to be between $5.35 and
$5.55 per share
•
Represents growth of between 7% and 14% as compared to forecasted
2013 EPS range
Adjusted weighted average shares expected to be ~44 million
Preliminary 2014 Financial Outlook and Assumptions |
 Euro
to U.S. Dollar exchange rate assumed to be ~1.30 1 fewer selling day in
Q2’14 vs. Q2’13; 1 additional selling day in Q4’14 vs.
Q4’13 Preliminary 2014 Financial Outlook and Assumptions
77 |
 Preliminary 2014 Revenue Outlook
Revenue Growth Expectations Favorable to Industry / Market
Volume - Core Business
0.75%
1.00%
New Product Introductions
1.25%
1.75%
Pricing - Core Business
0.00%
0.25%
Constant Currency Revenue Growth Excluding M&A and
Distributor-to-Direct 2.00%
3.00%
Vidacare
4.00%
4.50%
Pricing - Distributor-to-Direct
0.75%
1.00%
Volume - Distributor-to-Direct
0.25%
0.50%
2014 Preliminary Constant Currency Revenue Growth Range
7.00%
9.00%
Foreign Exchange
-1.00%
-1.00%
2014 Preliminary As-Reported Revenue Growth Range
6.00%
8.00%
78 |
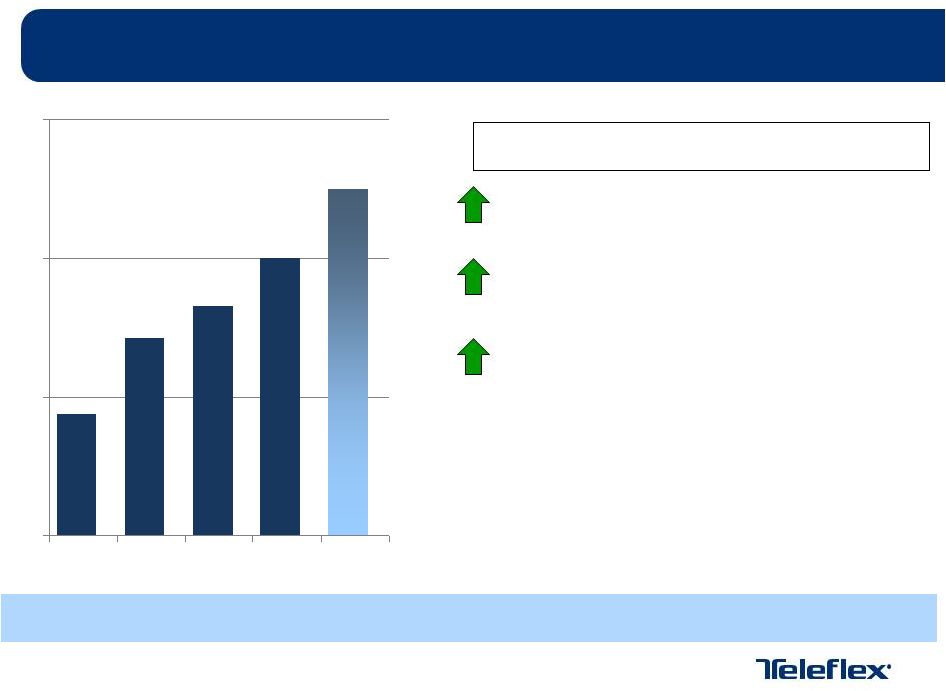 52.0%
to
52.5%
48.3%
47.1%
44.4%
49.5%
to
50.0%
40%
45%
50%
55%
2010A
2011A
2012A
2013E
2014E
2014 Adjusted Gross Margin Drivers
Vidacare
Distributor-to-Direct Pricing
Cost Programs
Preliminary 2014 Adjusted Gross Margin Outlook
Gross Margin Gains Driven by Vidacare, Distributor-to-Direct and Cost
Programs Note: figures represent adjusted gross margin. See Appendix for
reconciliation of GAAP to adjusted results. 79 |
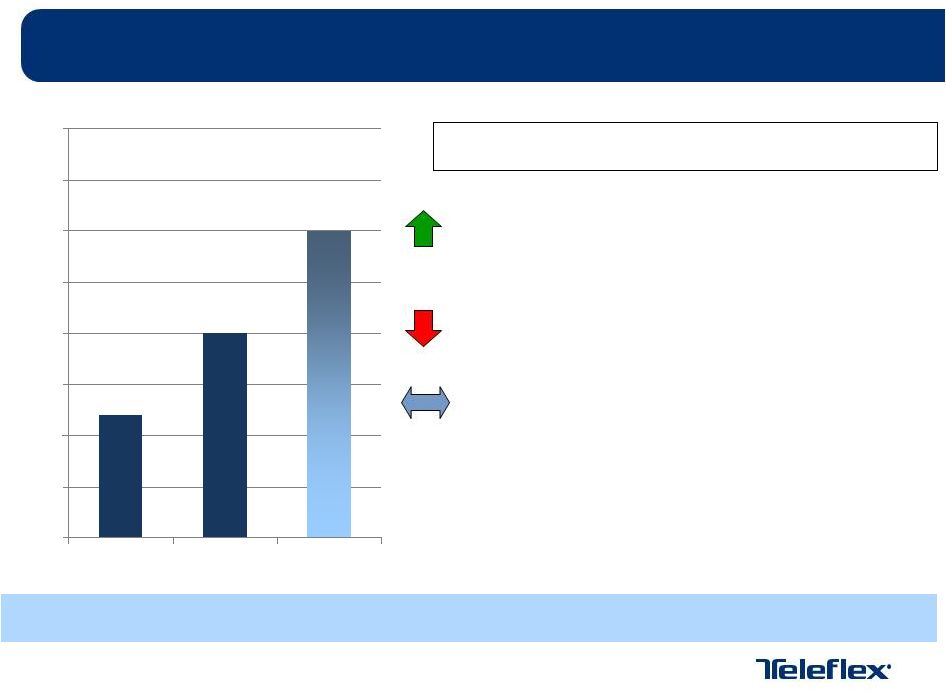 17%
to
18%
16%
to
17%
16.2%
15.0%
15.5%
16.0%
16.5%
17.0%
17.5%
18.0%
18.5%
19.0%
2012A
2013E
2014E
2014 Adjusted Operating Margin Drivers
Gross Margin Expansion
Vidacare & Distributor-to-Direct Opex
Reallocate investment from low-growth
to high-growth markets
Preliminary 2014 Adjusted Operating Margin Outlook
Gross Margin Gains Offset by Targeted Investments
Note: includes amortization expense impact of 285 bps in 2012; approx. 300 bps in
2013; approx. 325 bps in 2014 80 |
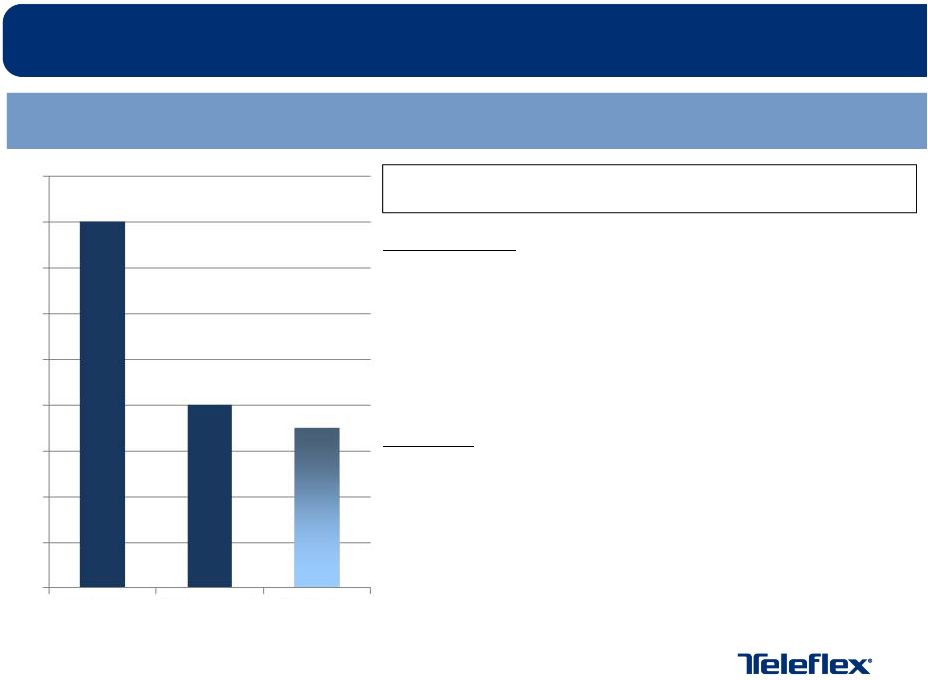 Preliminary 2014 Tax Planning Strategy
Tax
Planning
Strategies
Expected
to
Reduce
the
Sustainable
Non-GAAP
Tax
Rate
to
22.5%
to
23.5%
Rate Drivers
2013 Forecast
-
Discrete or non-sustainable benefits and planning
opportunities
-
Global Supply Chain Optimization (partial year
benefit)
2014 Plan
-
Global Supply Chain Optimization (full year benefit)
-
Full integration of recent acquisitions
Note:
non-GAAP
tax
adjustments
include
tax
benefit/expense
associated
with
restructuring,
impairment
charges,
and
special
items;
intangible
amortization
expense;
amortization
of
debt
discount
on
convertible
notes.
81
29.0%
28.0%
27.0%
26.0%
25.0%
24.0%
23.0%
22.0%
21.0%
20.0%
2013 Plan
2013 Forecast
2014 Plan
22.5%
to
23.5%
24%
28% |
    Preliminary 2014 Adjusted Earnings per Share Outlook
Growth of between 7% and 14% versus 2013 expectations
2013 Adjusted Earnings per Share Outlook
$4.85
$5.00
Base business
$0.55
$0.60
Vidacare
$0.10
$0.15
Distributor-to-direct
$0.10
$0.12
Foreign currency translation
($0.02)
($0.04)
Subtotal
$5.58
$5.83
Weighted average shares
($0.23)
($0.28)
2014 Adjusted Earnings per Share Outlook
$5.35
$5.55
82 |
 Preliminary 2014 Financial Outlook Summary
Continue to expect strong constant currency revenue growth fueled
by a combination of modest volume growth and new product
introductions combined with distributor-to-direct conversions and
Vidacare
Cost improvements, distributor-to-direct and Vidacare acquisition
accelerate pace of gross margin expansion
Operating Margin tempered by investments in high growth potential
markets and infrastructure requirements of distributor-to-direct and
Vidacare
Adjusted earnings per share growth of between 7% and 14%
83 |
 Teleflex Incorporated
2013 Analyst Day
Benson Smith –
Chairman, President and Chief Executive Officer |
 Closing Comments
Well-positioned portfolio of products able to take advantage of
shifting healthcare environment
Success in the future not dependent upon continued generation
of above-market revenue growth
Opportunity to improve operating leverage over multi-year
period
Opportunistic and conservative approach to future M&A
Committed to the achievement of longer-term financial goals
85 |
 Question and Answer Session |
 Thank you for your attention |
 Appendices |
 Gross
Profit and Margin Reconciliation Dollars in Millions
Note: GAAP results represent amounts per Form 10K during year filed.
2010
2011
2012
Gross profit
$794.1
$718.8
$748.2
Losses and other charges
5.9
2.0
0.5
Adjusted gross profit
$800.0
$720.8
$748.7
Percentage of revenue
44.4%
47.1%
48.3%
Revenue
$1,801.7
$1,528.9
$1,551.0
In 2010, losses and other charges include factory shutdown costs associated with
the custom IV tubing product. In 2011, losses and other charges include costs
attributed to Stock Keeping Unit ("SKU") rationalization. In 2012,
losses and other charges include acquisition costs. 89
|
 Operating Profit and Margin Reconciliation
Dollars in Millions
Note: GAAP results represent amounts per Form 10K during year filed.
2012
Income (loss) from continuing operations before interest, loss on extinguishments of debt and
taxes ($97.4)
Goodwill impairment
332.1
Restructuring and other impairment charges
3.0
(Gain) / loss on sales of businesses and assets
(0.3)
Losses and other charges
14.3
Adjusted income from continuing operations before interest, loss on extinguishments of debt and
taxes $251.8
Percentage of revenue
16.2%
Revenue
$1,551.0
90 |
 2013
Forecasted Constant Currency Revenue Growth Reconciliation Low
High
Full Year 2013 Forecasted GAAP Revenue Growth
8.3%
9.0%
Foreign Exchange
(0.3%)
(0.3%)
Full Year 2013 Forecasted Constant Currency Revenue Growth
8.0%
8.7%
91 |
 2014
Forecasted Constant Currency Revenue Growth Reconciliation 92
Low
High
Full Year 2014 Forecasted GAAP Revenue Growth
6.0%
8.0%
Foreign Exchange
1.0%
1.0%
Full Year 2014 Forecasted Constant Currency Revenue Growth
7.0%
9.0% |
 2013
and 2014 Forecasted Gross Margin Reconciliation 2013
2014
Forecasted GAAP Gross Margin
49.4%
49.9%
52.0%
52.5%
Losses and other charges
0.1%
0.1%
-
-
Forecasted Adjusted Gross Margin
49.5%
50.0%
52.0%
52.5%
In 2013, losses and other charges include acquisition and severance costs, and a
reserve reversal associated with a previously announced stock keeping unit
("SKU") rationalization charge.
93 |
 2013
and 2014 Forecasted Operating Margin Reconciliation 94
2013
2014
Forecasted GAAP Operating Margin
16.0%
17.0%
16.6%
17.5%
Losses and other charges
-
-
0.4%
0.5%
Forecasted Adjusted Operating Margin
16.0%
17.0%
17.0%
18.0%
In 2013, losses and other charges include the reversal of contingent consideration
liabilities, acquisition and severance costs, a reserve reversal associated with a
previously announced stock keeping unit ("SKU") rationalization charge, and a
litigation verdict against the Company with respect to a non-operating joint venture.
These adjustments are expected to net against each other and, as a result, are not currently
expected to result in an adjustment to GAAP results.
In 2014, losses and other charges include acquisition costs, and acceleration of
depreciation expense and labeling costs associated with the relocation of a facility.
|
 2013
Forecasted Earnings Per Share Reconciliation Low
High
Diluted earnings per share attributable to common shareholders
$3.45
$3.60
Restructuring, impairment charges, and special items, net of tax
$0.50
$0.50
Intangible amortization expense, net of tax
$0.75
$0.75
Amortization of debt discount on convertible notes, net of tax
$0.15
$0.15
Adjusted diluted earnings per share
$4.85
$5.00
95 |
 2014
Forecasted Earnings Per Share Reconciliation Low
High
Diluted earnings per share attributable to common shareholders
$3.68
$3.83
Restructuring, impairment charges, and special items, net of tax
$0.65
$0.70
Intangible amortization expense, net of tax
$0.85
$0.85
Amortization of debt discount on convertible notes, net of tax
$0.17
$0.17
Adjusted diluted earnings per share
$5.35
$5.55
96 |