Attached files
| file | filename |
|---|---|
| 8-K - 8-K - NORTHSTAR REALTY FINANCE CORP. | a13-25948_38k.htm |
| EX-99.1 - EX-99.1 - NORTHSTAR REALTY FINANCE CORP. | a13-25948_3ex99d1.htm |
Exhibit 99.2
|
|
Investor Presentation December 2013 399 Park Avenue, 18th Floor, New York, NY 10022 | 212.547.2600 | NRFC.com |
|
|
1 Safe Harbor This presentation contains forward-looking statements, within the meaning of the Private Securities Litigation Reform Act of 1995, including statements about future results, projected yields, rates of return and performance, projected cash available for distribution, projected cash from any single source of investment or fee stream, projected expenses, expected and weighted average return on equity, market and industry trends, investment opportunities, business conditions and other matters, including, among other things: our ability to complete the spin-off of our asset management business, which we announced we are exploring on December 10, 2013: the risk relating to the spin-off of our asset management business and operating our existing company and our asset management business as separate companies; our ability to realize the benefits of the spin-off, including the taxation of the asset management business as a stand-alone company; the growth prospects of our business, including our asset management business; our future cash available for distribution; the scalability of our investment platform; the size and timing of offerings or capital raises and actual management fee income derived from, the non-traded REITs we sponsor and advise; the ability to opportunistically participate in commercial real estate refinancings; the ability to realize upon attractive investment opportunities; the projected returns on, and cash earned from, investments, including investments funded by drawings from our credit facilities and securities offerings; equity and debt capital; and whether the Company’s transaction to acquire interests in private equity funds closes in full on the terms anticipated. Forward-looking statements concern future circumstances and results and other statements that are not historical facts and are sometimes identified by the words “may,” “will,” “should,” “potential,” “intend,” “expect,” “seek,” “anticipate,” “estimate,” “believe,” “could,” “project,” “predict,” “continue” or other similar words or expressions. The forward-looking statements involve a number of significant risks and uncertainties. A number of factors, including those factors set forth under the section entitled “Risk Factors” in the Annual Report on Form 10-K for the year ended December 31, 2012 of NorthStar Realty Finance Corp. (the “Company”), could cause the Company’s actual results, performance, achievements or industry results to be materially different from any future results, performance and achievements expressed or implied by these forward-looking statements. Additional information concerning factors that could cause actual results to materially differ from those in the forward-looking statements is contained in the Securities and Exchange Commission filings of the Company. The Company does not guarantee that the assumptions underlying such forward-looking statements are free from errors. The Company undertakes no obligation to publicly update any information whether as a result of new information, future events, or otherwise. Unless otherwise stated, historical financial information and per share & other data is as of September 30, 2013. This presentation is for informational purposes only and does not constitute an offer to sell or a solicitation of an offer to buy any securities of the Company. The footnotes herein contain important information that is material to an understanding of this presentation and you should read this presentation only with and in context of the footnotes. |
|
|
Overview of NorthStar Realty Finance Premier diversified commercial real estate investment and asset management company with $10 billion of commercial real estate assets under management(1) Broad, scalable and sophisticated commercial real estate platform (over 150 direct employees) Common dividend yield of 8.4%(2); increased common dividend nine consecutive quarters, representing an aggregate 110% increase over this period Committed to $3.6 billion of 2013 commercial real estate ("CRE") investments Diversification across a broad spectrum of commercial real estate investments Asset Management Business: 3 non-traded REITs with $3.85 billion(3) of total targeted equity ($1.3 billion raised to date)(4) and captive broker dealer Real Estate Portfolio: manufactured housing, healthcare, office and retail net lease and multi-family Opportunistic CRE Investments: real estate private equity interests and CDO bond repurchases Loan Originations: senior and mezzanine with match-funded financing 2 Includes assets of deconsolidated CDOs Based on NRF stock closing price of $10.00 on December 6, 2013, reflecting an annualized dividend of $0.84 Based on total offering size for three non-traded REITs that NRF has registered with the U.S. Securities and Exchange Commission As of December 6, 2013 1. 2. 3. 4. |
|
|
Consistent Outperformance Strong Dividend Growth Total Return Outperformance Current Payout Ratio:(2) NRF: 75% / CRE Mortgage REITs: 90% - 100%+ NRF has outperformed commercial mortgage REITs in both total returns and dividend growth 3 Current Dividend Yield:(3) NRF: 8.4% / CRE Mortgage REIT avg.:(4) 7.6% 317.9 132.0 163.8 NRF CAGR: 39.1% CRE Mortgage REITs CAGR: 8.6% Includes average of ABR, ARI, CLNY, NCT, RAS, SFI and STWD Current payout ratio based on annualized most recent quarter dividend and most recently reported comparable earnings metric Current dividend yield based on annualized most recent quarter dividend and stock closing price as of December 6, 2013 Includes average of ABR, ARI, CLNY, NCT, RAS and STWD Source: FactSet (1) (1) 0.10 0.125 0.135 0.15 0.16 0.17 0.18 0.19 0.20 0.21 0.00 0.05 0.10 0.15 0.20 0.25 Q2 2011 Q3 2011 Q4 2011 Q1 2012 Q2 2012 Q3 2012 Q4 2012 Q1 2013 Q2 2013 Q3 2013 Dividend/Share 50 100 150 200 250 300 350 Jun-11 Dec-11 Jun-12 Dec-12 May-13 Nov-13 NRF Commerical Mortgage REITs S&P 500 1. 2. 3. 4. |
|
|
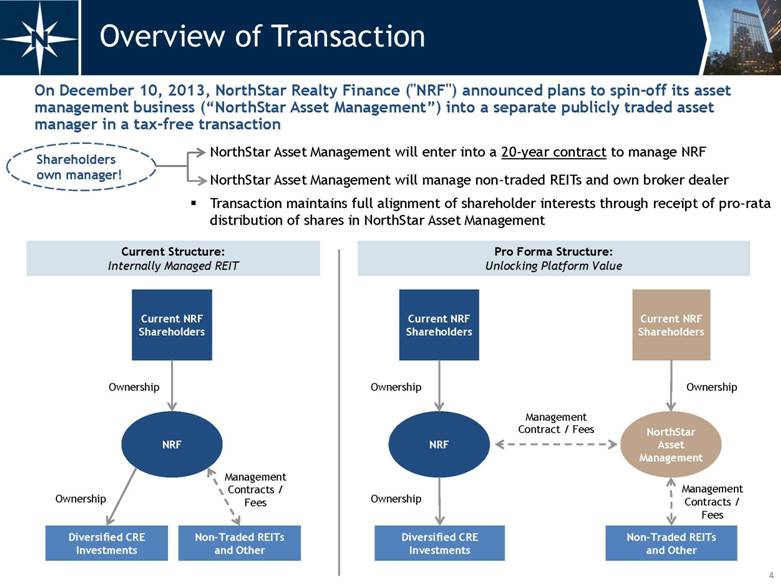
On December 10, 2013, NorthStar Realty Finance ("NRF") announced plans to spin-off its asset management business (“NorthStar Asset Management”) into a separate publicly traded asset manager in a tax-free transaction NorthStar Asset Management will enter into a 20-year contract to manage NRF NorthStar Asset Management will manage non-traded REITs and own broker dealer Transaction maintains full alignment of shareholder interests through receipt of pro-rata distribution of shares in NorthStar Asset Management 4 Overview of Transaction Pro Forma Structure: Unlocking Platform Value Contract / Fees Diversified CRE Investments Non-Traded REITs and Other NRF NorthStar Asset Management Current NRF Shareholders Current NRF Shareholders Management Ownership Ownership Ownership Current Structure: Internally Managed REIT Diversified CRE Investments NRF Current NRF Shareholders Non-Traded REITs and Other Ownership Management Contracts / Fees Ownership Management Contracts / Fees Shareholders own manager! |
|
|
5 Overview of Transaction Asset Management Business Diversified CRE Investments Spinoff Leading investor in diversified commercial real estate assets Proven ability to grow existing business through a diligent investment strategy driving attractive returns to shareholders Strong asset growth with dependable cash flows and liquidity Attractive current income through dividend yield with upside from embedded real estate asset value Proven track record of investing across a variety of real estate sectors and capital structures Significant insider ownership NorthStar Asset Management expected to establish itself as a leading asset manager with a long term management contract with NRF and a rapidly growing non-traded REIT platform Attractive and high-growth alternative asset class Scalable operating platform with limited capital needs Proven track record in managing and growing NRF platform Growth prospects and expansion opportunities High margin business and multiple, long-term recurring revenue streams Separation of NRF into a publicly traded asset manager and an externally advised REIT represents a fully aligned, long-term opportunity to unlock value for NRF shareholders |
|
|
6 Transaction Rationale Opportunity to unlock value in NRF's management platform and asset management business by creating an asset light model with significant growth potential as well as stability of earnings through long-term contracts (i.e., 20-year contract with NRF) Transaction is structured to continue to maintain the alignment of shareholder interests while unlocking embedded platform value NorthStar Asset Management will continue to grow its asset management business through organic fee stream creation NorthStar Asset Management could also grow its business through the acquisition of third party asset management businesses and could use NorthStar Asset Management stock as currency Increased transparency and clarity around each company's particular assets and growth profile Separation of real estate investments from the asset management business will allow investors to better evaluate fee growth potential of NorthStar Asset Management and the value of NRF Traditional valuation metrics for mortgage REITs (Price/Book, Dividend Yield) only partially capture value of NRF's real estate investments and asset management business |
|
|
Management contract with NRF with 20-year initial term Management contract anticipated to be terminable only for “cause” Annual base management fee of $90 million plus an annual base management fee equal to 1.5% on any incremental "equity" raised at NRF after December 10, 2013 In addition, NorthStar Asset Management will earn an incentive fee over return hurdles based on cash available for distribution ("CAD") per share at NRF, as follows: 15% incentive fee payable when CAD exceeds $0.78 per share (equivalent to a 12% yield on September 30, 2013 adjusted book value of $6.46 per share) 25% incentive fee payable when CAD exceeds $0.90 per share (equivalent to a 14% yield on September 30, 2013 adjusted book value of $6.46 per share) 7 Transaction Detail Transaction creates two superior business platforms: NRF: REIT headquartered in NYC, incorporated in Maryland NorthStar Asset Management: headquartered in NYC, expected to be incorporated in Delaware The Spin-off Board of Directors Executive Leadership Tax Impact Both companies will have majority independent boards Spin-off is expected to be tax-free to NRF and its shareholders Current NRF management team Management Contract NorthStar Asset Management & NRF Structure NorthStar Asset Management will initially be a C-Corp. Intends to pursue a variety of alternative structures to optimize tax rates following the spin-off, including public traded partnership and/or offshore domicile structures |
|
|
Equity REITs Mortgage REITs NorthStar Asset Management NorthStar Realty Finance Hypothetical Separation Assuming $1.20 of CAD/Share in 2014(1)(2) 8 Separation Analysis NRF CAD/Share of $0.80(2) Hypothetical 2014 CAD following payment of fees and expected allocated expenses $155mm of Gross Fees CAD/Share of $0.30(2)(3) Every $1 billion of NRF "equity" raised following December 10, 2013 Approximate 2014 gross fees and hypothetical CAD with NO "equity" raised at NRF following December 10, 2013 ASSET MANAGEMENT Assumes no additional NRF capital raising after December 10, 2013 and $800 million of non-traded REIT capital raised during 2014 Based on 249 million common shares and LTIP units outstanding as of December 6, 2013 Assumes approximately $75 million of 2014 G&A expenses, allocated 80% to NorthStar Asset Management and 20% to NRF, and assumes 2014 CAD based on an effective tax rate of approximately 20% $15 million of added annual base fees and potential incentive fees % of 2014 CAD Valuation Comparison 52% from real estate and real estate private equity investments 10% from CDO equity distributions |
|
|
9 Implied Valuation Sensitivity(1) NorthStar Asset Management P/E Multiple 12x 16x 20x NRF Dividend Yield 7.0% 21.7% 33.7% 45.7% 7.5% 16.0% 28.0% 40.0% 8.0% 11.0% 23.0% 35.0% 8.5% 6.6% 18.6% 30.6% 9.0% 2.7% 14.7% 26.7% NRF hypothetical 2014 CAD per share of $0.80 and NorthStar Asset Management hypothetical 2014 CAD per share of $0.30 would result in: Implied Combined Valuation Premium to Current Price per Share(2) NorthStar Asset Management P/E Multiple 12x 16x 20x NRF Dividend Yield 7.0% $12.17 $13.37 $14.57 7.5% $11.60 $12.80 $14.00 8.0% $11.10 $12.30 $13.50 8.5% $10.66 $11.86 $13.06 9.0% $10.27 $11.47 $12.67 Implied Combined Price per Share NorthStar Asset Management P/E Multiple 12x 16x 20x NRF Dividend Yield 7.0% 38.9% 50.9% 62.9% 7.5% 32.0% 44.0% 56.0% 8.0% 26.0% 38.0% 50.0% 8.5% 20.7% 32.7% 44.7% 9.0% 16.0% 28.0% 40.0% NorthStar Asset Management P/E Multiple 12x 16x 20x NRF Dividend Yield 7.0% $13.89 $15.09 $16.29 7.5% $13.20 $14.40 $15.60 8.0% $12.60 $13.80 $15.00 8.5% $12.07 $13.27 $14.47 9.0% $11.60 $12.80 $14.00 Implied Combined Price per Share 75% payout ratio 90% payout ratio All per share amounts based on 249 million common shares and LTIP units outstanding as of December 6, 2013 Based on NRF stock closing price as of December 6, 2013 Implied Combined Valuation Premium to Current Price per Share(2) |
|
|
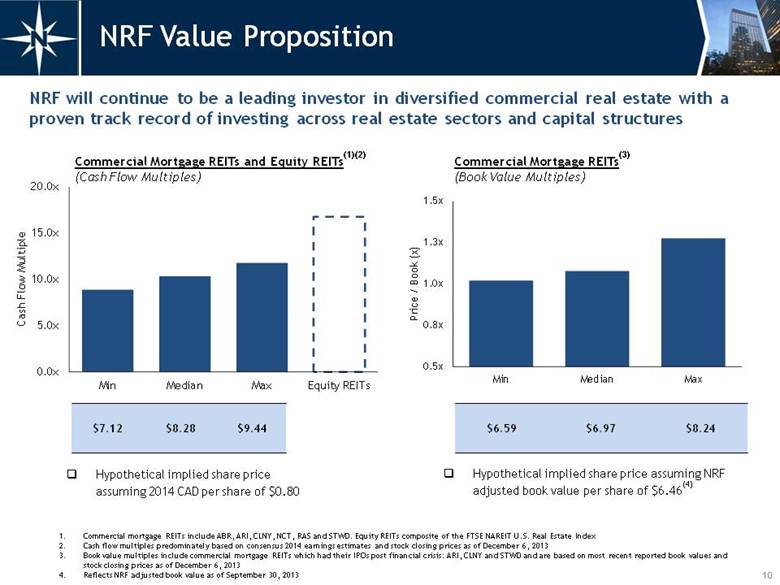
$7.12 $8.28 $9.44 10 NRF Value Proposition Commercial Mortgage REITs(3) (Book Value Multiples) Commercial Mortgage REITs and Equity REITs(1)(2) (Cash Flow Multiples) Hypothetical implied share price assuming 2014 CAD per share of $0.80 Hypothetical implied share price assuming NRF adjusted book value per share of $6.46(4) Commercial mortgage REITs include ABR, ARI, CLNY, NCT, RAS and STWD. Equity REITs composite of the FTSE NAREIT U.S. Real Estate Index Cash flow multiples predominately based on consensus 2014 earnings estimates and stock closing prices as of December 6, 2013 Book value multiples include commercial mortgage REITs which had their IPOs post financial crisis: ARI, CLNY and STWD and are based on most recent reported book values and stock closing prices as of December 6, 2013 Reflects NRF adjusted book value as of September 30, 2013 $6.59 $6.97 $8.24 NRF will continue to be a leading investor in diversified commercial real estate with a proven track record of investing across real estate sectors and capital structures 0.0x 5.0x 10.0x 15.0x 20.0x Min Median Max Equity REITs Cash Flow Multiple |
|
|
11 NRF Growth Drivers Ability to acquire diverse set of property types Approximately $3 billion of owned real estate Best in class loan origination platform, including senior and mezzanine loans Completed 11 securitizations totaling $5 billion(2) Limited buyer base in real estate private equity secondary market Demonstration of NRF’s ability to find market dislocations and unique opportunities Real Estate Ownership Percentage: Loan Maturities Over Next Four Years ($1.4 Trillion)(1): Real Estate PE Investments by Underlying Asset Type: Source: Barclays Capital U.S. Securitization Research: CMBS - Scaling the maturity wall 8/16/13. Complied using data from US Federal Reserve, FDIC, and Barclays Capital Includes two securitizations entered into with our non-traded REIT, NorthStar Real Estate Income Trust, Inc. Manufactured housing 46% Healthcare net lease 25% Office and retail net lease 15% Multifamily 14% Office 20% Multifamily 17% Lodging 12% Retail 10% Residential Condo 8% Other 8% Cash 7% Land 6% Debt 5% Industrial 4% Financial Services 3% $0 $100 $200 $300 $400 2014 2015 2016 2017 ($ in billions) Commercial Banks, Savings Institutions Insurance Companies GSE's & Fed Related Mortgage Pools CMBS |
|
|
12 NorthStar Asset Management Growth NRF $3.6 billion of committed 2013 NRF investments 1.5% base fee plus potential incentive fee on all “equity” capital raised at NRF after December 10, 2013 NorthStar Asset Management growth will be driven by growth at NRF and the non-traded REIT platform Existing Non-Traded REIT – Capital Raise ($mm) Shareholders aligned and benefit from growth Acquisitions or investments of third party asset managers Additional product offerings (i.e., non-traded REITs & other funds) 0 500 1,000 2012 2013 YTD (through Dec. 6, 2013) 2014 (projected) |
|
|
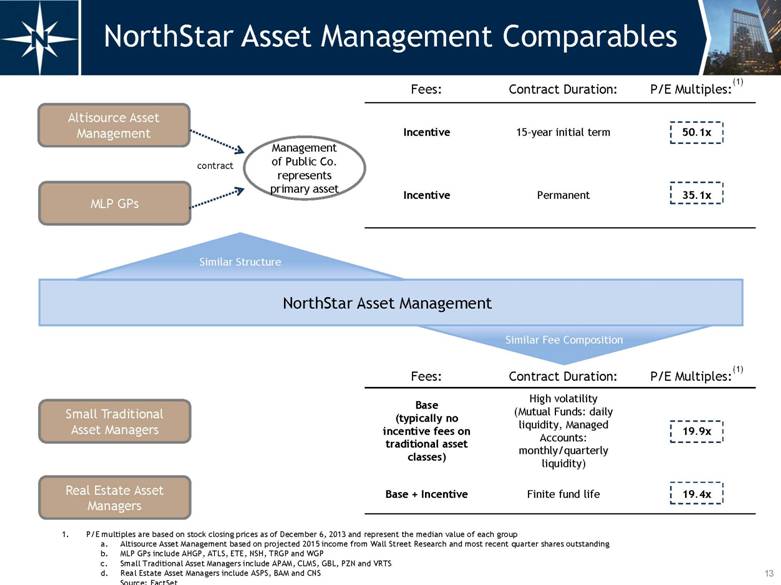
Real Estate Asset Managers Fees: Contract Duration: P/E Multiples:(1) Incentive 15-year initial term 50.1x Incentive Permanent 35.1x Fees: Contract Duration: P/E Multiples:(1) Base (typically no incentive fees on traditional asset classes) High volatility (Mutual Funds: daily liquidity, Managed Accounts: monthly/quarterly liquidity) 19.9x Base + Incentive Finite fund life 19.4x Small Traditional Asset Managers NorthStar Asset Management NorthStar Asset Management Comparables 13 Altisource Asset Management Management of Public Co. represents primary asset contract MLP GPs Similar Structure P/E multiples are based on stock closing prices as of December 6, 2013 and represent the median value of each group Altisource Asset Management based on projected 2015 income from Wall Street Research and most recent quarter shares outstanding MLP GPs include AHGP, ATLS, ETE, NSH, TRGP and WGP Small Traditional Asset Managers include APAM, CLMS, GBL, PZN and VRTS Real Estate Asset Managers include ASPS, BAM and CNS Source: FactSet 1. a. b. c. d. |
|
|
... providing opportunity to unlock embedded value 14 Valuation Comparison NRF currently trades at a significant discount to MLP GPs, small traditional asset management firms and real estate asset managers Projected 2014 P/E Multiples(1) P/E multiples are based on stock closing prices as of December 6, 2013 and represent the median value of each group NRF based on a hypothetical 2014 CAD per share of $1.20 Real Estate Asset Managers include ASPS, BAM and CNS Small Traditional Asset Managers include APAM, CLMS, GBL, PZN and VRTS MLP GPs include AHGP, ATLS, ETE, NSH, TRGP and WGP Altisource Asset Management based on projected 2015 income from Wall Street Research and most recent quarter shares outstanding Source: FactSet 8.3 19.4 19.9 35.1 50.1 0.0x 10.0x 20.0x 30.0x 40.0x 50.0x NRF Real Estate Asset Managers Small Traditional Asset Managers MLP GPs Altisource Asset Management 1. a. b. c. d. e. |
|
|
15 Seasoned Executive Team Name Position Yrs of Exp Relevant Background David T. Hamamoto Chairman and Chief Executive Officer 29 NorthStar Capital - Co-Founder Goldman, Sachs & Co. - Co-Founder and Partner of Real Estate Principal Investment (Whitehall Funds) Albert Tylis President 15 Bryan Cave / Robinson Silverman - Senior Attorney ASA Institute - Director of Corporate Finance and General Counsel Daniel R. Gilbert Chief Investment and Operating Officer; CEO – Non-Traded REIT Business 19 NorthStar Capital – Head of Mezzanine Lending Business Merrill Lynch - Group Head in Global Principal Investment and Commercial Real Estate Debra A. Hess Chief Financial Officer 27 Newcastle Investment Corp. – Chief Financial Officer Fortress Investment Group – Managing Director Goldman, Sachs & Co. – Vice President, Manager of Financial Reporting Ronald J. Lieberman Executive Vice President and General Counsel 18 Hunton & Williams – Partner, Real Estate Capital Markets Skadden, Arps, Slate, Meagher and Flom – Associate, Corporate and Securities Daniel D. Raffe Executive Vice President and Head of Portfolio Management 24 GE Business Property – Head of East and Midwest real estate acquisitions Cushman & Wakefield – Managing Director, Real Estate Capital Markets Steven B. Kauff Executive Vice President Structuring and Tax 26 NorthStar Capital – Structuring and Tax Arthur Anderson – Real Estate & Hospitality, Tax Consulting Price Waterhouse – Real Estate Industry, Tax Consulting Robert S. Riggs Managing Director 25 Olympus Real Estate Partners - Partner GE Capital Realty Group – COO and EVP of Equity Investing |
|
|
16 399 Park Avenue, 18th Floor, New York, NY 10022 | 212.547.2600 | NRFC.com |