Attached files
| file | filename |
|---|---|
| 8-K - 8-K - MARKWEST ENERGY PARTNERS L P | a13-25985_18k.htm |
Exhibit 99.1
|
|
WELLS FARGO 2013 ENERGY SYMPOSIUM DECEMBER 2013 |
|
|
Forward-Looking Statements This presentation contains forward-looking statements and information. These forward-looking statements, which in many instances can be identified by words like “could,” “may,” “will,” “should,” “expects,” “plans,” “project,” “anticipates,” “believes,” “planned,” “proposed,” “potential,” and other comparable words, regarding future or contemplated results, performance, transactions, or events, are based on MarkWest Energy Partners, L.P. (“MarkWest” and the “Partnership”) current information, expectations and beliefs, concerning future developments and their potential effects on MarkWest. Although MarkWest believes that the expectations reflected in the forward-looking statements are reasonable, it can give no assurance that such expectations will prove to be correct, and actual results, performance, distributions, events or transactions could vary significantly from those expressed or implied in such statements and are subject to a number of uncertainties and risks. Among the factors that could cause results to differ materially are those risks discussed in the periodic reports filed with the SEC, including MarkWest’s Annual Report on Form 10-K for the year ended December 31, 2012 and its Quarterly Report on Form 10-Q for the quarter ended September 30, 2013. You are urged to carefully review and consider the cautionary statements and other disclosures, including those under the heading “Risk Factors,” made in those documents. If any of the uncertainties or risks develop into actual events or occurrences, or if underlying assumptions prove incorrect, it could cause actual results to vary significantly from those expressed in the presentation, and MarkWest’s business, financial condition, or results of operations could be materially adversely affected. Key uncertainties and risks that may directly affect MarkWest’s performance, future growth, results of operations, and financial condition, include, but are not limited to: Fluctuations and volatility of natural gas, NGL products, and oil prices; A reduction in natural gas or refinery off-gas production which MarkWest gathers, transports, processes, and/or fractionates; A reduction in the demand for the products MarkWest produces and sells; Financial credit risks / failure of customers to satisfy payment or other obligations under MarkWest’s contracts; Effects of MarkWest’s debt and other financial obligations, access to capital, or its future financial or operational flexibility or liquidity; Construction, procurement, and regulatory risks in our development projects; Hurricanes, fires, and other natural and accidental events impacting MarkWest’s operations, and adequate insurance coverage; Terrorist attacks directed at MarkWest facilities or related facilities; Changes in and impacts of laws and regulations affecting MarkWest operations and risk management strategy; and Failure to integrate recent or future acquisitions. 2 |
|
|
Non-GAAP Measures Distributable Cash Flow, Adjusted EBITDA, and Net Operating Margin are not measures of performance calculated in accordance with GAAP, and should not be considered separately from or as a substitute for net income, income from operations, or cash flow as reflected in our financial statements. The GAAP measure most directly comparable to Distributable Cash Flow and Adjusted EBITDA is net income (loss). The GAAP measure most directly comparable to Net Operating Margin is income (loss) from operations. In general, we define DCF as net income (loss) adjusted for (i) depreciation, amortization, impairment, and other non-cash expense; (ii) amortization of deferred financing costs and discount; (iii) loss on redemption of debt net of current tax benefit; (iv) non-cash (earnings) loss from unconsolidated affiliates; (v) distributions from (contributions to) unconsolidated affiliates (net of affiliate growth capital expenditures); (vi) non-cash compensation expense; (vii) non-cash derivative activity; (viii) losses (gains) on the disposal of property, plant, and equipment (PP&E) and unconsolidated affiliates; (ix) provision for deferred income taxes; (x) cash adjustments for non-controlling interest in consolidated subsidiaries; (xi) revenue deferral adjustment; (xii) losses (gains) relating to other miscellaneous non-cash amounts affecting net income for the period; and (xiii) maintenance capital expenditures, net of joint venture partner contributions. We define Adjusted EBITDA as net income (loss) adjusted for (i) depreciation, amortization, impairment, and other non-cash expense; (ii) interest expense; (iii) amortization of deferred financing costs; (iv) loss on redemption of debt; (v) losses (gains) on the disposal of PP&E and unconsolidated affiliates; (vi) non-cash derivative activity; (vii) non-cash compensation expense; (viii) provision for income taxes; (ix) adjustments for cash flow from unconsolidated affiliates; (x) adjustment related to non-guarantor, consolidated subsidiaries; and (xi) losses (gains) relating to other miscellaneous non-cash amounts affecting net income for the period. We generally define Operating Income before Items Not Allocated to Segments as (i) revenue, excluding derivative gains and losses and adjusted for certain revenue deferral adjustments less; (ii) purchased product costs, excluding derivative gains and losses less; (iii) facility expenses, adjusted for certain non-cash items not allocated to segments and certain interest payments allocable to the segments less; ( iv) the portion allocable to non-controlling interests. Distributable Cash Flow is a financial performance measure used by management as a key component in the determination of cash distributions paid to unitholders. We believe distributable cash flow is an important financial measure for unitholders as an indicator of cash return on investment and to evaluate whether the Partnership is generating sufficient cash flow to support quarterly distributions. In addition, distributable cash flow is commonly used by the investment community because the market value of publicly traded partnerships is based, in part, on distributable cash flow and cash distributions paid to unitholders. Adjusted EBITDA is a financial performance measure used by management, industry analysts, investors, lenders, and rating agencies to assess the financial performance and operating results of the Partnership’s ongoing business operations. Additionally, we believe Adjusted EBITDA provides useful information to investors for trending, analyzing, and benchmarking our operating results from period to period as compared to other companies that may have different financing and capital structures. Net Operating Margin is a financial performance measure used by management and investors to evaluate the underlying baseline operating performance of our contractual arrangements. Management also uses Net Operating Margin to evaluate the Partnership’s financial performance for purposes of planning and forecasting. Please see the Appendix for reconciliations of Distributable Cash Flow, Adjusted EBITDA, and Net Operating Margin to the most directly comparable GAAP measure. 3 |
|
|
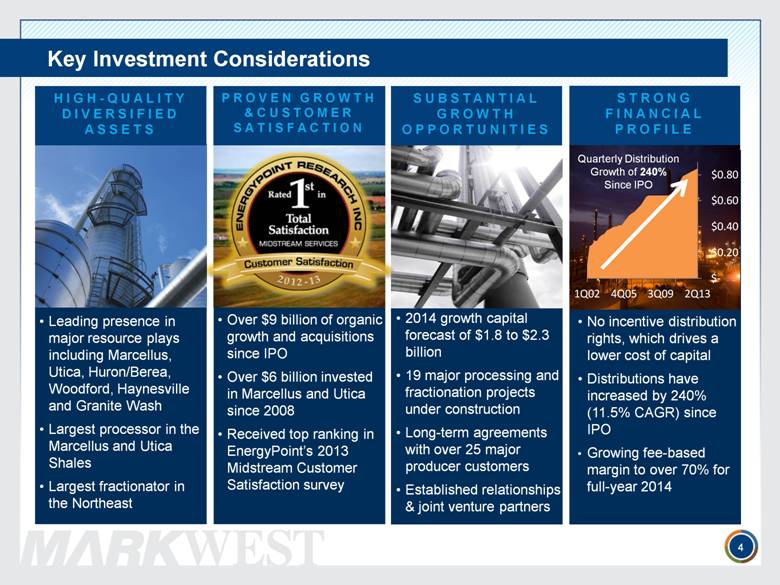
Key Investment Considerations Quarterly Distribution Growth of 240% Since IPO Leading presence in major resource plays including Marcellus, Utica, Huron/Berea, Woodford, Haynesville and Granite Wash Largest processor in the Marcellus and Utica Shales Largest fractionator in the Northeast HIGH-QUALITY DIVERSIFIED ASSETS PROVEN GROWTH &CUSTOMER SATISFACTION SUBSTANTIAL GROWTH OPPORTUNITIES STRONG FINANCIAL PROFILE Over $9 billion of organic growth and acquisitions since IPO Over $6 billion invested in Marcellus and Utica since 2008 Received top ranking in EnergyPoint’s 2013 Midstream Customer Satisfaction survey 2014 growth capital forecast of $1.8 to $2.3 billion 19 major processing and fractionation projects under construction Long-term agreements with over 25 major producer customers Established relationships & joint venture partners No incentive distribution rights, which drives a lower cost of capital Distributions have increased by 240% (11.5% CAGR) since IPO Growing fee-based margin to over 70% for full-year 2014 4 |
|
|
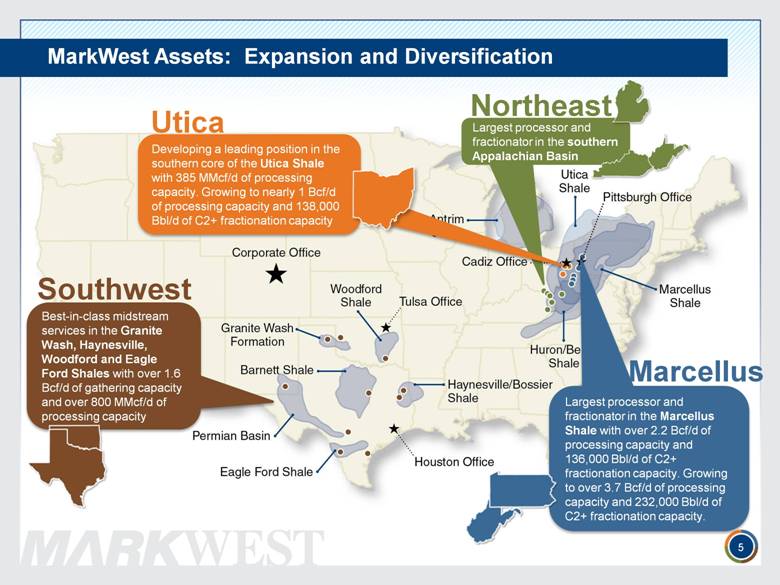
Southwest Best-in-class midstream services in the Granite Wash, Haynesville, Woodford and Eagle Ford Shales with over 1.6 Bcf/d of gathering capacity and over 800 MMcf/d of processing capacity Largest processor and fractionator in the Marcellus Shale with over 2.2 Bcf/d of processing capacity and 136,000 Bbl/d of C2+ fractionation capacity. Growing to over 3.7 Bcf/d of processing capacity and 232,000 Bbl/d of C2+ fractionation capacity. Marcellus Largest processor and fractionator in the southern Appalachian Basin Northeast MarkWest Assets: Expansion and Diversification Developing a leading position in the southern core of the Utica Shale with 385 MMcf/d of processing capacity. Growing to nearly 1 Bcf/d of processing capacity and 138,000 Bbl/d of C2+ fractionation capacity Utica 5 |
|
|
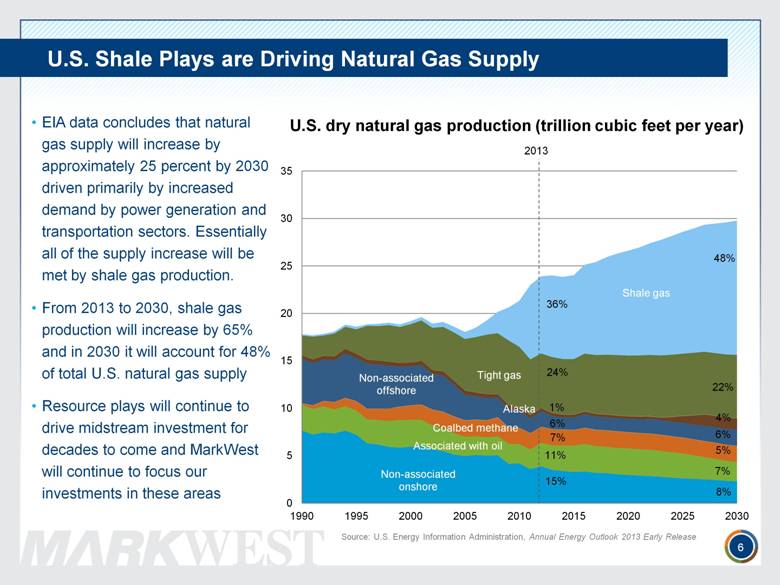
U.S. Shale Plays are Driving Natural Gas Supply 6 EIA data concludes that natural gas supply will increase by approximately 25 percent by 2030 driven primarily by increased demand by power generation and transportation sectors. Essentially all of the supply increase will be met by shale gas production. From 2013 to 2030, shale gas production will increase by 65% and in 2030 it will account for 48% of total U.S. natural gas supply Resource plays will continue to drive midstream investment for decades to come and MarkWest will continue to focus our investments in these areas Source: U.S. Energy Information Administration, Annual Energy Outlook 2013 Early Release 2013 36% 24% 1% 6% 7% 11% 15% 22% 4% 6% 5% 7% 8% 48% |
|
|
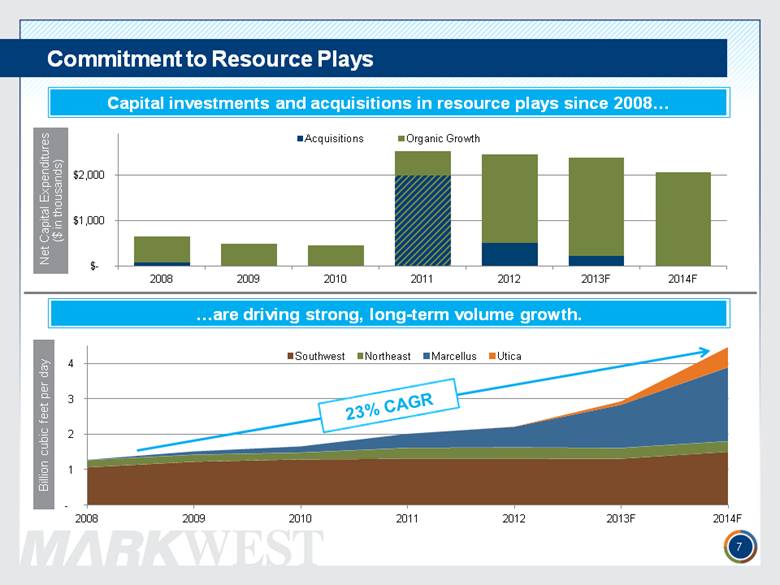
Commitment to Resource Plays 7 Capital investments and acquisitions in resource plays since 2008... ...are driving strong, long-term volume growth. |
|
|
MarkWest has received the top rating in three of the last four EnergyPoint Research surveys Growth Driven By Customer Satisfaction 8 |
|
|
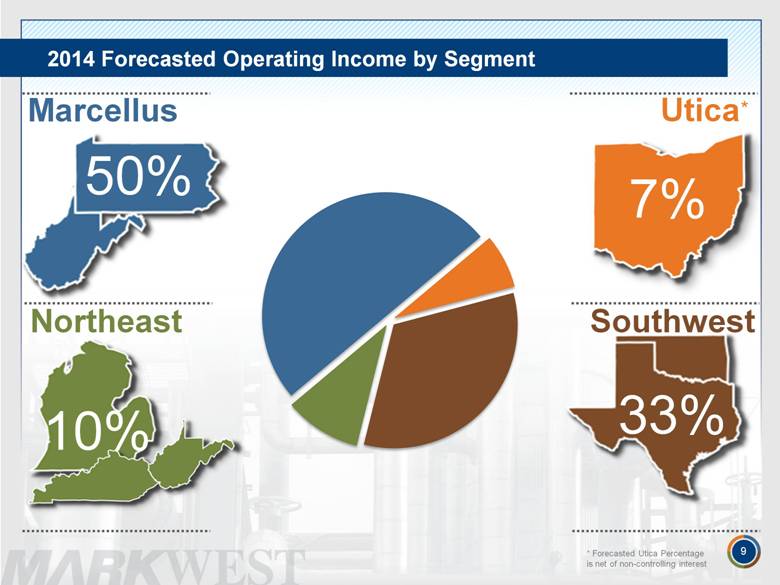
Marcellus 50% Northeast 10% Southwest 33% 2014 Forecasted Operating Income by Segment 9 Utica 7% * * Forecasted Utica Percentage is net of non-controlling interest |
|
|
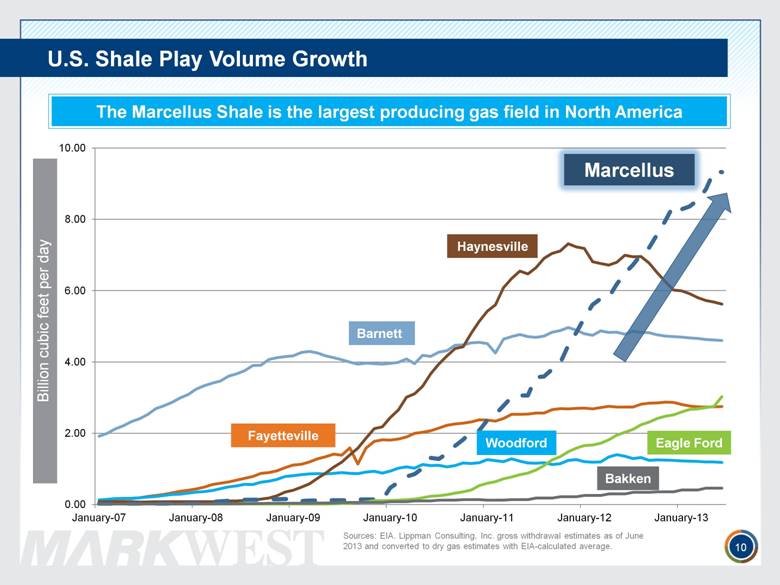
U.S. Shale Play Volume Growth 10 The Marcellus Shale is the largest producing gas field in North America Sources: EIA. Lippman Consulting, Inc. gross withdrawal estimates as of June 2013 and converted to dry gas estimates with EIA-calculated average. Haynesville Marcellus Barnett Fayetteville Woodford Eagle Ford Bakken |
|
|
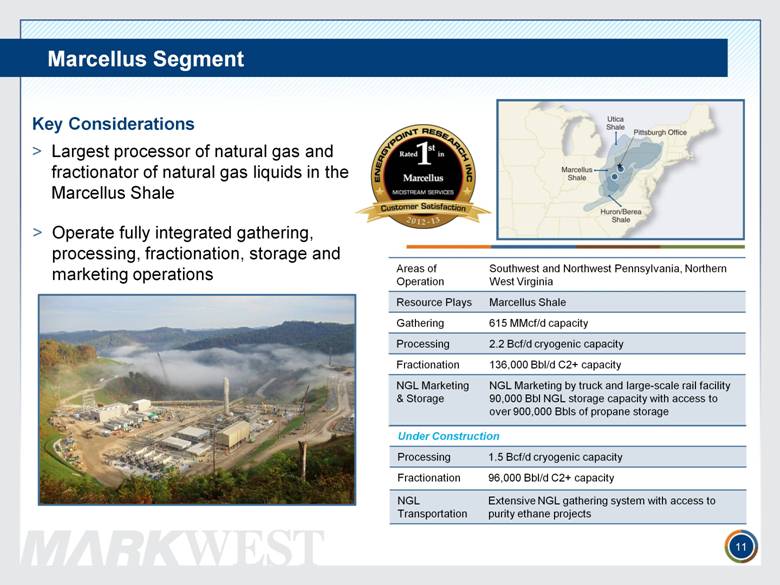
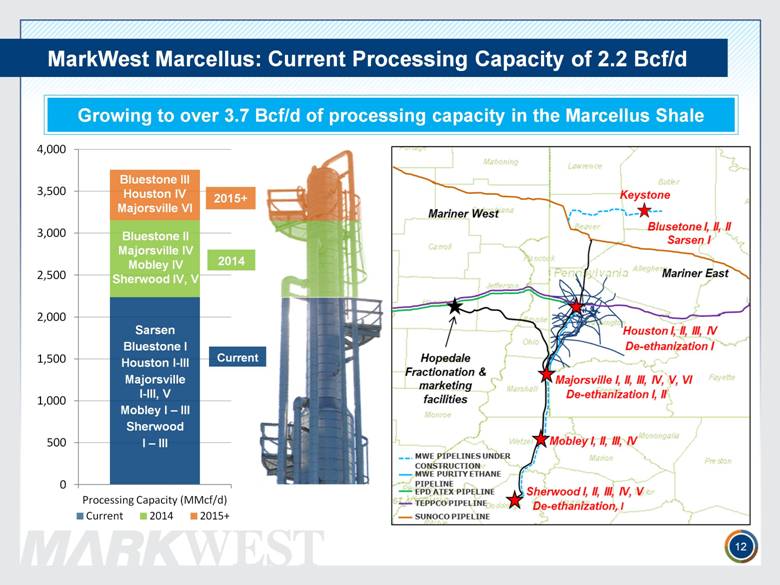
Marcellus Segment Key Considerations Largest processor of natural gas and fractionator of natural gas liquids in the Marcellus Shale Areas of Operation Southwest and Northwest Pennsylvania, Northern West Virginia Resource Plays Marcellus Shale Gathering 615 MMcf/d capacity Processing 2.2 Bcf/d cryogenic capacity Fractionation 136,000 Bbl/d C2+ capacity NGL Marketing & Storage NGL Marketing by truck and large-scale rail facility 90,000 Bbl NGL storage capacity with access to over 900,000 Bbls of propane storage Under Construction Processing 1.5 Bcf/d cryogenic capacity Fractionation 96,000 Bbl/d C2+ capacity NGL Transportation Extensive NGL gathering system with access to purity ethane projects Operate fully integrated gathering, processing, fractionation, storage and marketing operations 11 |
|
|
MarkWest Marcellus: Current Processing Capacity of 2.2 Bcf/d 12 Growing to over 3.7 Bcf/d of processing capacity in the Marcellus Shale 2014 Current Bluestone II Majorsville IV Mobley IV Sherwood IV, V Sarsen Bluestone I Houston I-III Majorsville I-III, V Mobley I – III Sherwood I – III Bluestone III Houston IV Majorsville VI 2015+ |
|
|
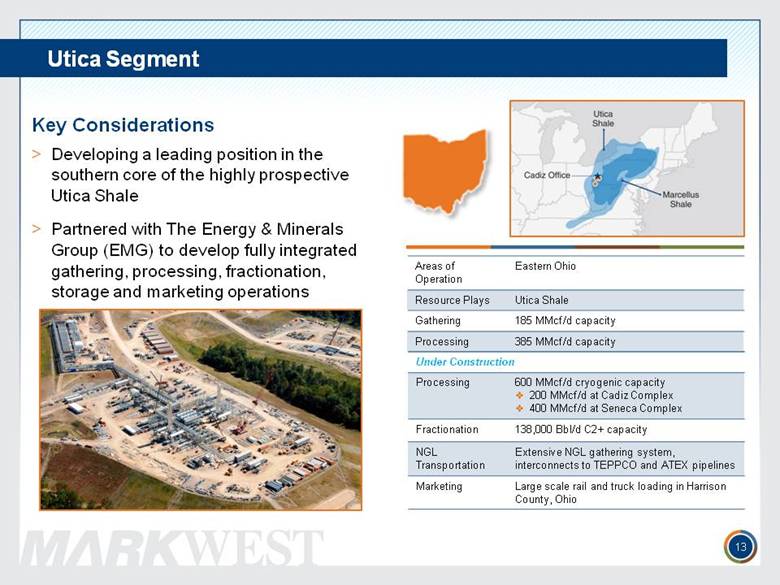
Areas of Operation Eastern Ohio Resource Plays Utica Shale Gathering 185 MMcf/d capacity Processing 385 MMcf/d capacity Utica Segment 13 Key Considerations Developing a leading position in the southern core of the highly prospective Utica Shale Partnered with The Energy & Minerals Group (EMG) to develop fully integrated gathering, processing, fractionation, storage and marketing operations Under Construction Processing 600 MMcf/d cryogenic capacity 200 MMcf/d at Cadiz Complex 400 MMcf/d at Seneca Complex Fractionation 138,000 Bbl/d C2+ capacity NGL Transportation Extensive NGL gathering system, interconnects to TEPPCO and ATEX pipelines Marketing Large scale rail and truck loading in Harrison County, Ohio |
|
|
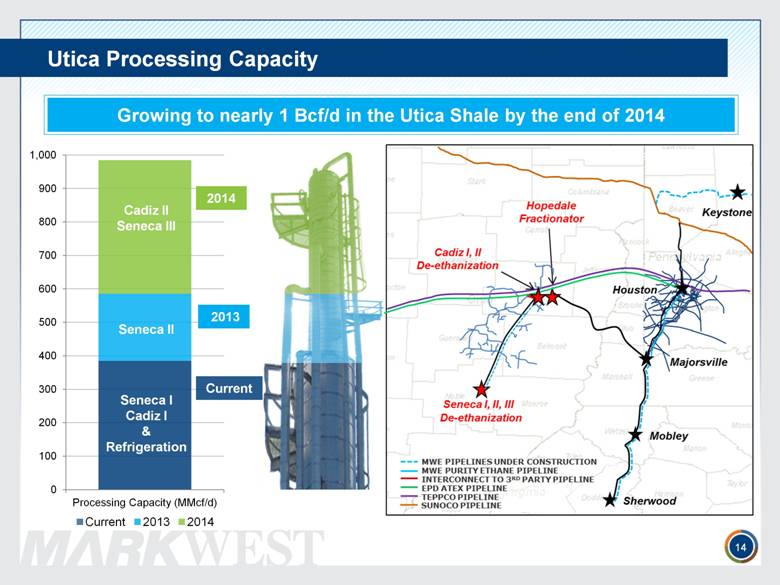
Utica Processing Capacity 14 Seneca I Cadiz I & Refrigeration Seneca II Cadiz II Seneca III 2014 2013 Current Growing to nearly 1 Bcf/d in the Utica Shale by the end of 2014 |
|
|
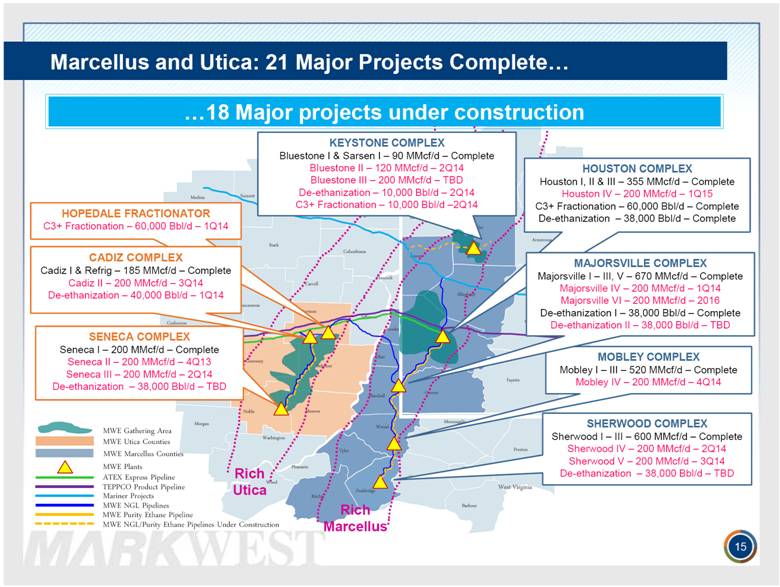
MWE NGL Pipelines Barbour Brooke Doddridge Hancock Harrison Marion Marshall Monongalia Ohio Pleasants Preston Ritchie Taylor Tyler Wetzel Wood Belmont Carroll Columbiana Coshocton Guernsey Harrison Holmes Mahoning Medina Monroe Morgan Muskingum Noble Portage Stark Summit Trumbull Tuscarawas Washington Wayne Allegheny Armstrong Beaver Butler Clarion Crawford Fayette Greene Lawrence Mercer Venango Washington Westmoreland West Virginia Ohio MWE Utica Counties MWE Marcellus Counties MWE Plants ATEX Express Pipeline TEPPCO Product Pipeline Jefferson Marcellus and Utica: 21 Major Projects Complete... Mariner Projects Rich Utica Rich Marcellus MWE Gathering Area 15 MWE Purity Ethane Pipeline ...18 Major projects under construction MOBLEY COMPLEX Mobley I – III – 520 MMcf/d – Complete Mobley IV – 200 MMcf/d – 4Q14 HOUSTON COMPLEX Houston I, II & III – 355 MMcf/d – Complete Houston IV – 200 MMcf/d – 1Q15 C3+ Fractionation – 60,000 Bbl/d – Complete De-ethanization – 38,000 Bbl/d – Complete SHERWOOD COMPLEX Sherwood I – III – 600 MMcf/d – Complete Sherwood IV – 200 MMcf/d – 2Q14 Sherwood V – 200 MMcf/d – 3Q14 De-ethanization – 38,000 Bbl/d – TBD HOPEDALE FRACTIONATOR C3+ Fractionation – 60,000 Bbl/d – 1Q14 SENECA COMPLEX Seneca I – 200 MMcf/d – Complete Seneca II – 200 MMcf/d – 4Q13 Seneca III – 200 MMcf/d – 2Q14 De-ethanization – 38,000 Bbl/d – TBD MAJORSVILLE COMPLEX Majorsville I – III, V – 670 MMcf/d – Complete Majorsville IV – 200 MMcf/d – 1Q14 Majorsville VI – 200 MMcf/d – 2016 De-ethanization I – 38,000 Bbl/d – Complete De-ethanization II – 38,000 Bbl/d – TBD KEYSTONE COMPLEX Bluestone I & Sarsen I – 90 MMcf/d – Complete Bluestone II – 120 MMcf/d – 2Q14 Bluestone III – 200 MMcf/d – TBD De-ethanization – 10,000 Bbl/d – 2Q14 C3+ Fractionation – 10,000 Bbl/d –2Q14 CADIZ COMPLEX Cadiz I & Refrig – 185 MMcf/d – Complete Cadiz II – 200 MMcf/d – 3Q14 De-ethanization – 40,000 Bbl/d – 1Q14 MWE NGL/Purity Ethane Pipelines Under Construction |
|
|
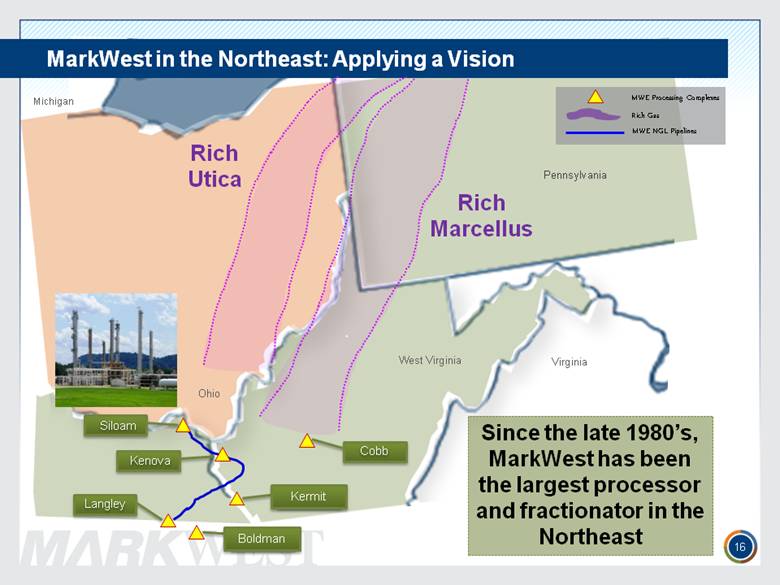
MWE Processing Complexes Virginia Michigan West Virginia Pennsylvania Rich Utica Rich Marcellus MWE NGL Pipelines Rich Gas Kenova Langley Kermit Boldman 16 Since the late 1980’s, MarkWest has been the largest processor and fractionator in the Northeast Ohio MarkWest in the Northeast: Applying a Vision Cobb Siloam |
|
|
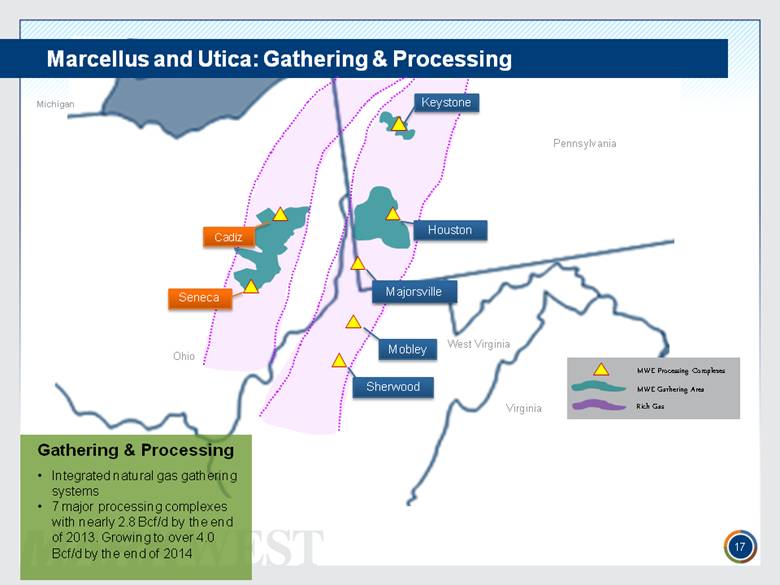
Virginia Michigan West Virginia Pennsylvania Marcellus and Utica: Gathering & Processing MWE Processing Complexes MWE Gathering Area Rich Gas Gathering & Processing Integrated natural gas gathering systems 7 major processing complexes with nearly 2.8 Bcf/d by the end of 2013. Growing to over 4.0 Bcf/d by the end of 2014 17 Ohio Mobley Sherwood Cadiz Keystone Houston Seneca |
|
|
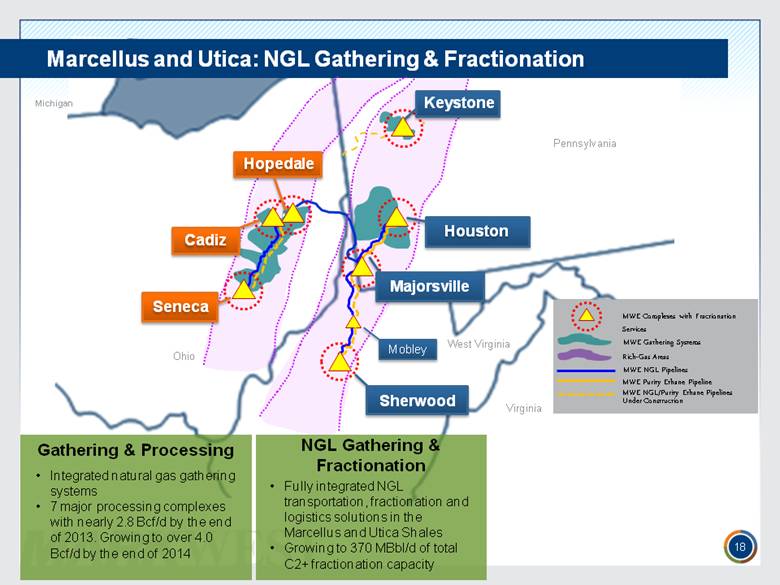
MWE Complexes with Fractionation Services MWE Gathering Systems Virginia Michigan West Virginia Pennsylvania Marcellus and Utica: NGL Gathering & Fractionation NGL Gathering & Fractionation MWE Purity Ethane Pipeline MWE NGL Pipelines MWE NGL/Purity Ethane Pipelines Under Construction Rich-Gas Areas Integrated natural gas gathering systems 7 major processing complexes with nearly 2.8 Bcf/d by the end of 2013. Growing to over 4.0 Bcf/d by the end of 2014 Fully integrated NGL transportation, fractionation and logistics solutions in the Marcellus and Utica Shales Growing to 370 MBbl/d of total C2+ fractionation capacity 18 Ohio Mobley |
|
|
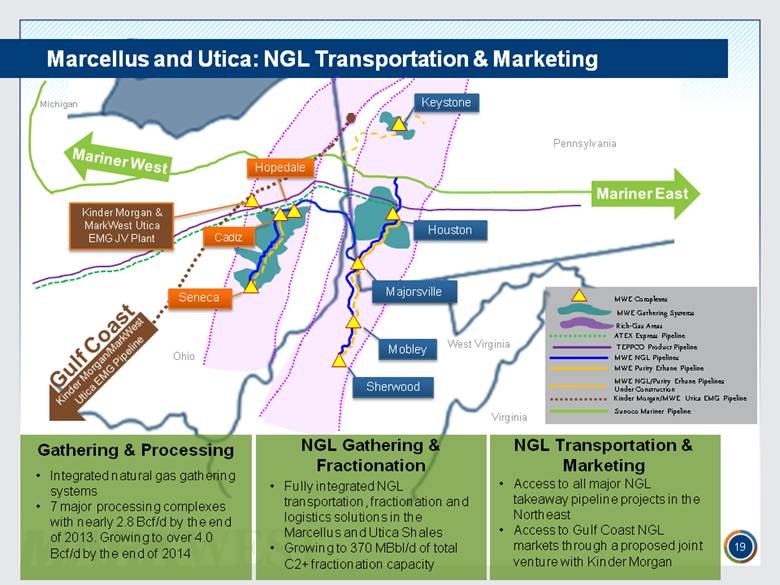
MWE Complexes ATEX Express Virginia Michigan West Virginia Ohio Pennsylvania Mariner East Marcellus and Utica: NGL Transportation & Marketing Gulf Coast Kinder Morgan/MarkWest Utica EMG Pipeline Gathering & Processing NGL Transportation & Marketing Mariner West MWE Gathering Systems NGL Gathering & Fractionation Rich-Gas Areas Fully integrated NGL transportation, fractionation and logistics solutions in the Marcellus and Utica Shales Growing to 370 MBbl/d of total C2+ fractionation capacity Integrated natural gas gathering systems 7 major processing complexes with nearly 2.8 Bcf/d by the end of 2013. Growing to over 4.0 Bcf/d by the end of 2014 Access to all major NGL takeaway pipeline projects in the Northeast Access to Gulf Coast NGL markets through a proposed joint venture with Kinder Morgan 19 Kinder Morgan & MarkWest Utica EMG JV Plant Cadiz Seneca Mobley Sherwood Keystone Houston |
|
|
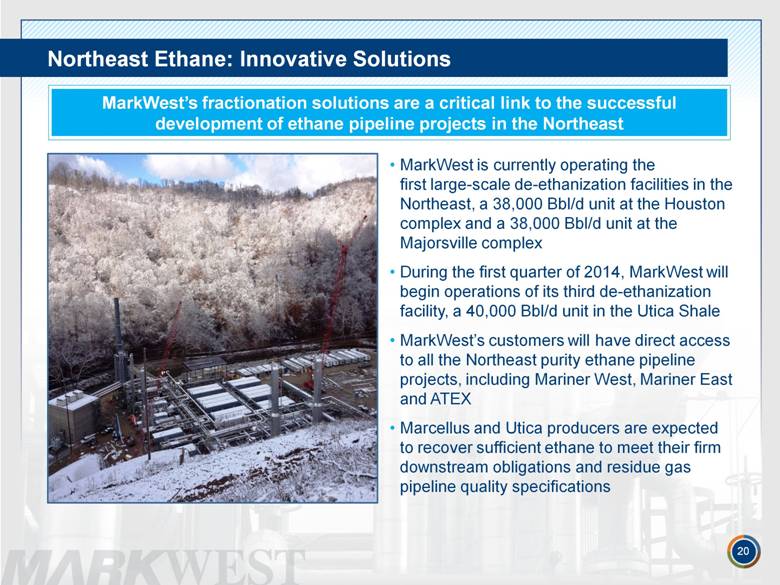
Northeast Ethane: Innovative Solutions MarkWest is currently operating the first large-scale de-ethanization facilities in the Northeast, a 38,000 Bbl/d unit at the Houston complex and a 38,000 Bbl/d unit at the Majorsville complex During the first quarter of 2014, MarkWest will begin operations of its third de-ethanization facility, a 40,000 Bbl/d unit in the Utica Shale MarkWest’s customers will have direct access to all the Northeast purity ethane pipeline projects, including Mariner West, Mariner East and ATEX Marcellus and Utica producers are expected to recover sufficient ethane to meet their firm downstream obligations and residue gas pipeline quality specifications 20 MarkWest’s fractionation solutions are a critical link to the successful development of ethane pipeline projects in the Northeast |
|
|
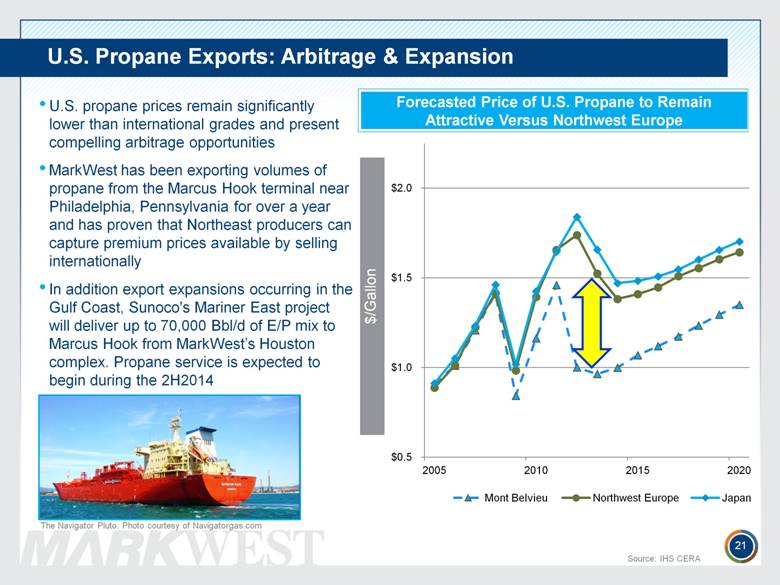
U.S. propane prices remain significantly lower than international grades and present compelling arbitrage opportunities MarkWest has been exporting volumes of propane from the Marcus Hook terminal near Philadelphia, Pennsylvania for over a year and has proven that Northeast producers can capture premium prices available by selling internationally In addition export expansions occurring in the Gulf Coast, Sunoco's Mariner East project will deliver up to 70,000 Bbl/d of E/P mix to Marcus Hook from MarkWest’s Houston complex. Propane service is expected to begin during the 2H2014 U.S. Propane Exports: Arbitrage & Expansion The Navigator Pluto. Photo courtesy of Navigatorgas.com 21 Forecasted Price of U.S. Propane to Remain Attractive Versus Northwest Europe Source: IHS CERA |
|
|
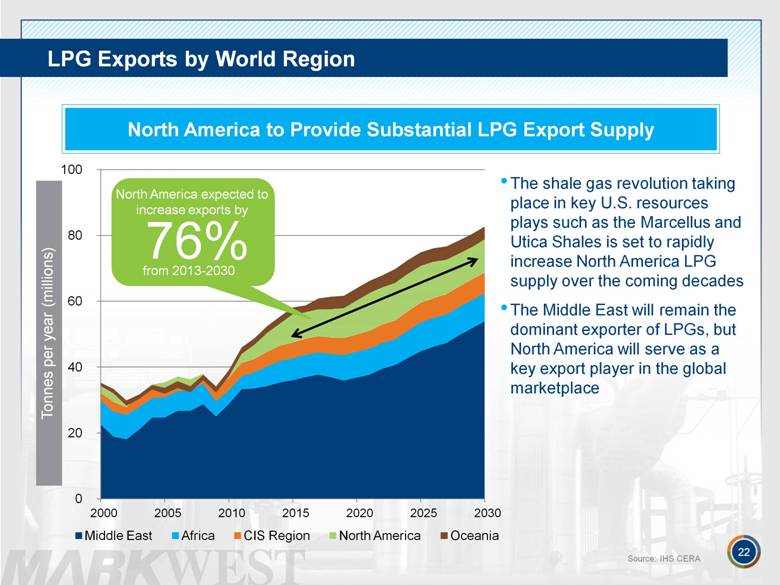
LPG Exports by World Region 22 North America expected to increase exports by from 2013-2030 76% The shale gas revolution taking place in key U.S. resources plays such as the Marcellus and Utica Shales is set to rapidly increase North America LPG supply over the coming decades The Middle East will remain the dominant exporter of LPGs, but North America will serve as a key export player in the global marketplace North America to Provide Substantial LPG Export Supply Source: IHS CERA |
|
|
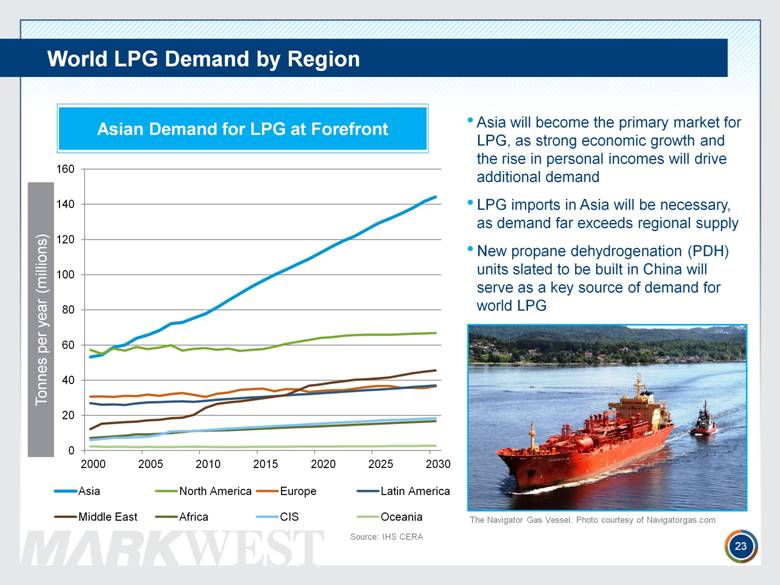
World LPG Demand by Region Tonnes per year (millions) Asia will become the primary market for LPG, as strong economic growth and the rise in personal incomes will drive additional demand LPG imports in Asia will be necessary, as demand far exceeds regional supply New propane dehydrogenation (PDH) units slated to be built in China will serve as a key source of demand for world LPG Asian Demand for LPG at Forefront The Navigator Gas Vessel. Photo courtesy of Navigatorgas.com Source: IHS CERA 23 |
|
|
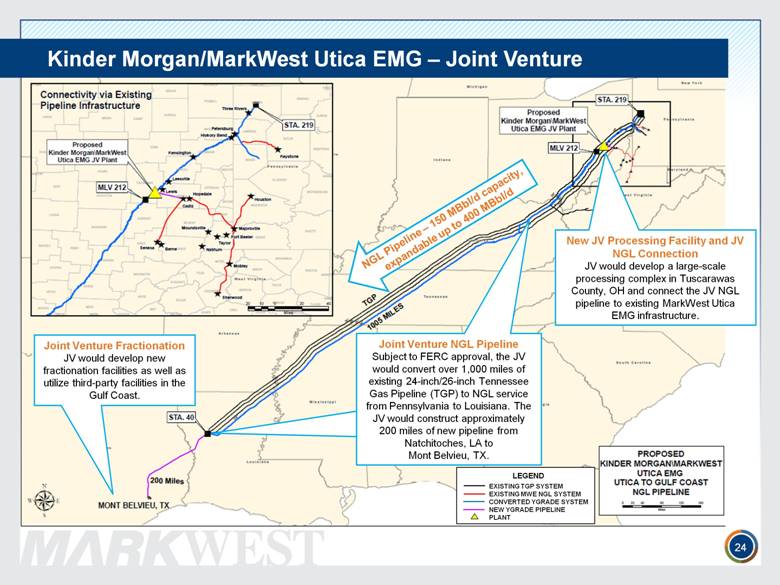
24 Kinder Morgan/MarkWest Utica EMG – Joint Venture Joint Venture NGL Pipeline Subject to FERC approval, the JV would convert over 1,000 miles of existing 24-inch/26-inch Tennessee Gas Pipeline (TGP) to NGL service from Pennsylvania to Louisiana. The JV would construct approximately 200 miles of new pipeline from Natchitoches, LA to Mont Belvieu, TX. New JV Processing Facility and JV NGL Connection JV would develop a large-scale processing complex in Tuscarawas County, OH and connect the JV NGL pipeline to existing MarkWest Utica EMG infrastructure. Joint Venture Fractionation JV would develop new fractionation facilities as well as utilize third-party facilities in the Gulf Coast. EXISTING TGP SYSTEM EXISTING MWE NGL SYSTEM CONVERTED YGRADE SYSTEM NEW YGRADE PIPELINE PLANT LEGEND |
|
|
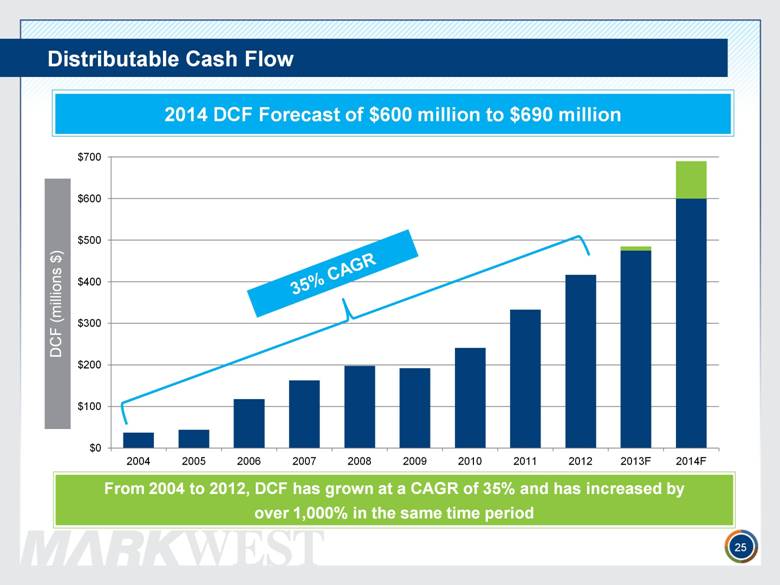
Distributable Cash Flow 25 35% CAGR From 2004 to 2012, DCF has grown at a CAGR of 35% and has increased by over 1,000% in the same time period 2014 DCF Forecast of $600 million to $690 million |
|
|
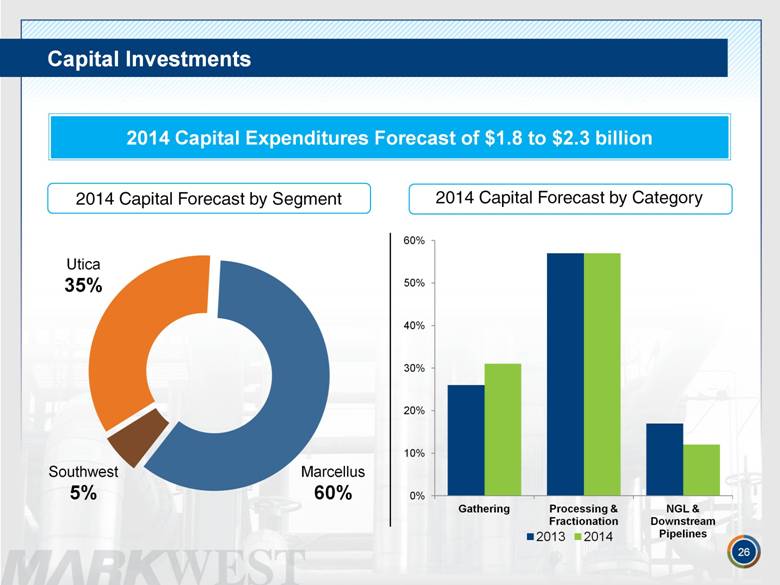
Capital Investments 2014 Capital Forecast by Segment 26 2014 Capital Forecast by Category 2014 Capital Expenditures Forecast of $1.8 to $2.3 billion Utica 35% Southwest 5% Marcellus 60% |
|
|
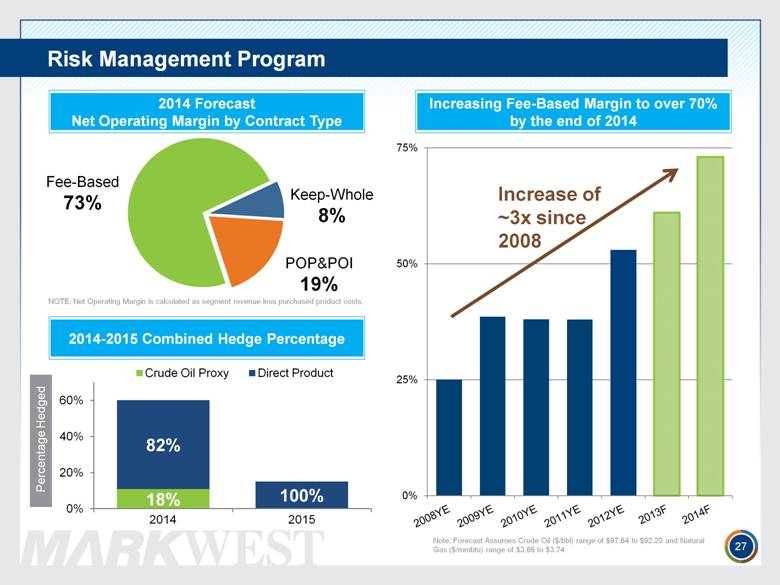
Risk Management Program 27 2014 Forecast Net Operating Margin by Contract Type Note: Forecast Assumes Crude Oil ($/bbl) range of $97.64 to $92.20 and Natural Gas ($/mmbtu) range of $3.66 to $3.74 NOTE: Net Operating Margin is calculated as segment revenue less purchased product costs. Fee-Based 73% Keep-Whole 8% POP&POI 19% Increasing Fee-Based Margin to over 70% by the end of 2014 2014-2015 Combined Hedge Percentage Increase of ~3x since 2008 |
|
|
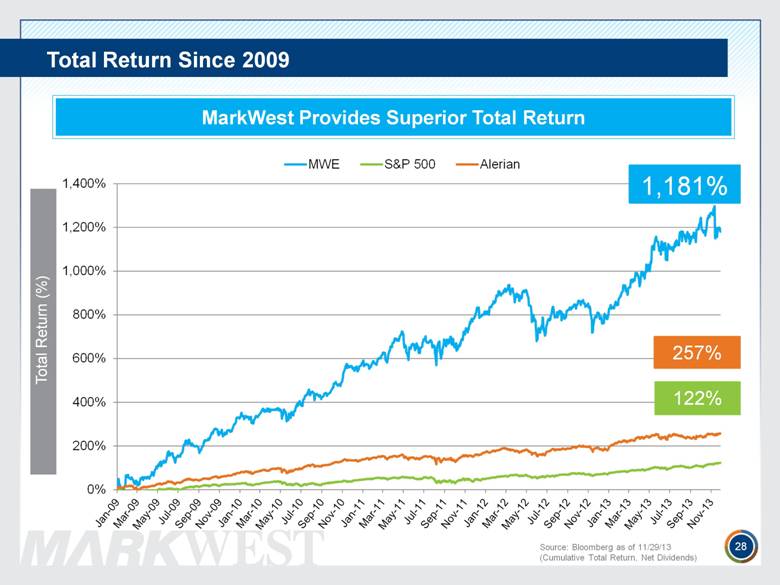
Total Return Since 2009 MarkWest Provides Superior Total Return 28 Source: Bloomberg as of 11/29/13 (Cumulative Total Return, Net Dividends) 0% 200% 400% 600% 800% 1,000% 1,200% 1,400% MWE S&P 500 Alerian 1,181% 257% 122% |
|
|
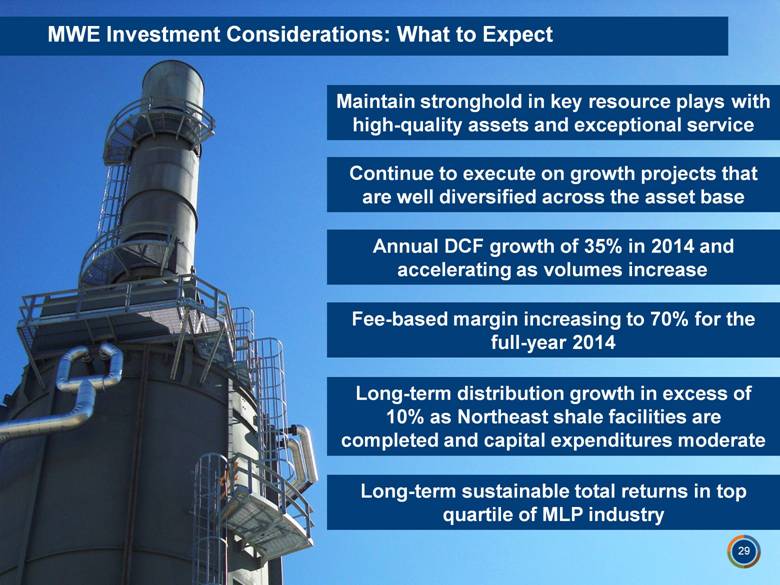
MWE Investment Considerations: What to Expect Maintain stronghold in key resource plays with high-quality assets and exceptional service Continue to execute on growth projects that are well diversified across the asset base Annual DCF growth of 35% in 2014 and accelerating as volumes increase Fee-based margin increasing to 70% for the full-year 2014 Long-term distribution growth in excess of 10% as Northeast shale facilities are completed and capital expenditures moderate 29 Long-term sustainable total returns in top quartile of MLP industry |
|
|
APPENDIX |
|
|
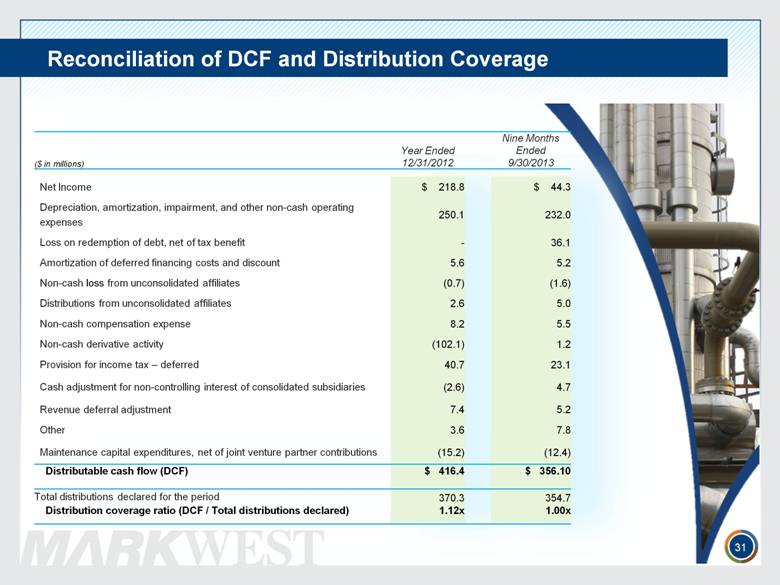
Reconciliation of DCF and Distribution Coverage 31 |
|
|
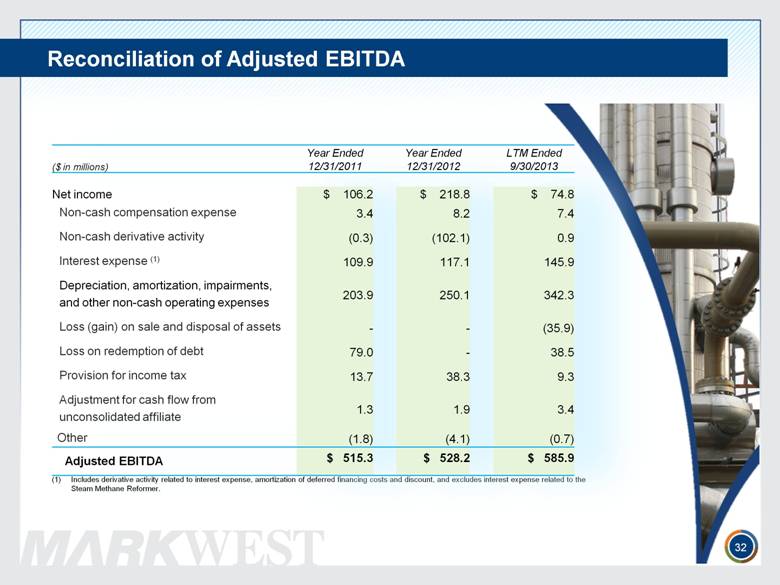
Reconciliation of Adjusted EBITDA 32 Includes derivative activity related to interest expense, amortization of deferred financing costs and discount, and excludes interest expense related to the Steam Methane Reformer. |
|
|
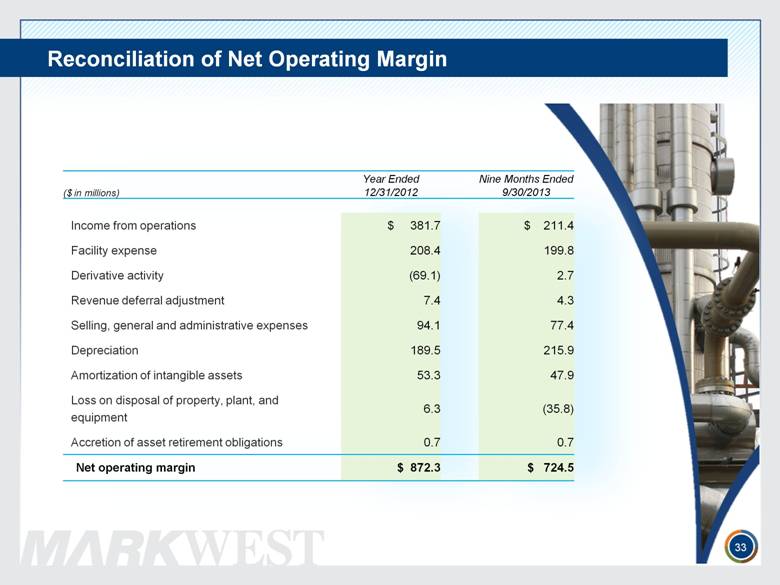
Reconciliation of Net Operating Margin 33 |
|
|
1515 Arapahoe Street Tower 1, Suite 1600 Denver, Colorado 80202 Phone: 303-925-9200 Investor Relations: 866-858-0482 Email: investorrelations@markwest.com Website: www.markwest.com |