Attached files
| file | filename |
|---|---|
| 8-K - 8-K BODY - BANC OF CALIFORNIA, INC. | banc8k.htm |
| EX-99.1 - PRESS RELEASE - BANC OF CALIFORNIA, INC. | pressrelease.htm |
| EX-10.1 - SECURITIES PURCHASE AGREEMENT - BANC OF CALIFORNIA, INC. | securitiespurchaseagreement.htm |
EXHIBIT 99.2

O'Neill Forum Presentation December 4, 2013

* Forward-looking Statements When used in this presentation and in documents filed with or furnished to the Securities and Exchange Commission (the “SEC”), in press releases or other public shareholder communications, or in oral statements made with the approval of an authorized executive officer, the words or phrases “believe,” “will,” “should,” “will likely result,” “are expected to,” “will continue,” “is anticipated,” “estimate,” “project,” “plans,” or similar expressions are intended to identify “forward-looking statements” within the meaning of the Private Securities Litigation Reform Act of 1995. These statements may relate to Banc of California, Inc.’s (“BOC,” “Banc of California,” the “Company,” “we,” “us” or “our”) future financial performance, strategic plans or objectives, revenue, expense or earnings projections, or other items. By their nature, these statements are subject to numerous uncertainties that could cause actual results to differ materially from those anticipated in the statements. Factors that could cause actual results to differ from the results anticipated or projected include, but are not limited to, the following: (i) risks that the intended benefits may not be realized from the recently completed merger and consolidation of The Private Bank of California with and into Pacific Trust Bank and the conversion of the resulting institution to a national bank charter, or the sale of branches to AmericanWest Bank, or the recently completed acquisition of CS Financial, Inc., or the acquisitions of The Private Bank of California, Beach Business Bank and Gateway Bancorp, or that those transactions may disrupt current plans and operations, the potential difficulties in customer and employee retention as a result of the transactions and the amount of the costs, fees, expenses and charges related to the transactions; (ii) turmoil in the financial markets (iii) the credit risks of lending activities, which may be affected by deterioration in real estate markets and the financial condition of borrowers, may lead to increased loan and lease delinquencies, losses and nonperforming assets in our loan portfolio, and may result in our allowance for loan and lease losses not being adequate to cover actual losses and require us to materially increase our loan and lease loss reserves; (iv) the quality and composition of our securities portfolio; (v) changes in general economic conditions, either nationally or in our market areas; (vi) continuation of the historically low short-term interest rate environment, changes in the levels of general interest rates, and the relative differences between short- and long-term interest rates, deposit interest rates, our net interest margin and funding sources; (vii) fluctuations in the demand for loans and leases, the number of unsold homes and other properties and fluctuations in commercial and residential real estate values in our market area; (viii) results of examinations of us by regulatory authorities and the possibility that any such regulatory authority may, among other things, require us to increase our allowance for loan and lease losses, write-down asset values, increase our capital levels, or affect our ability to borrow funds or maintain or increase deposits, which could adversely affect our liquidity and earnings; (ix) legislative or regulatory changes that adversely affect our business, including changes in regulatory capital or other rules; (x) our ability to control operating costs and expenses; (xi) staffing fluctuations in response to product demand or the implementation of corporate strategies that affect our work force and potential associated charges; (xii) errors in our estimates in determining fair value of certain of our assets, which may result in significant declines in valuation; (xiii) the network and computer systems on which we depend could fail or experience a security breach; (xiv) our ability to attract and retain key members of our senior management team; (xv) costs and effects of litigation, including settlements and judgments; (xvi) increased competitive pressures among financial services companies; (xvii) changes in consumer spending, borrowing and saving habits; (xviii) adverse changes in the securities markets; (xix) earthquake, fire or other natural disasters affecting the condition of real estate collateral; (xx) the availability of resources to address changes in laws, rules or regulations or to respond to regulatory actions; (xxi) inability of key third-party providers to perform their obligations to us; (xxii) changes in accounting policies and practices, as may be adopted by the financial institution regulatory agencies or the Financial Accounting Standards Board or their application to our business or final audit adjustments, including additional guidance and interpretation on accounting issues and details of the implementation of new accounting methods; (xxiii) war or terrorist activities; and (xxiv) other economic, competitive, governmental, regulatory, and technological factors affecting our operations, pricing, products and services and the other risks described in the reports and other documents that we file with or furnish to the SEC, including, without limitation, the risks described under “Item 1A Risk Factors” in our Annual Report on Form 10-K for the year ended December 31, 2012. You should not place undue reliance on forward-looking statements, which only speak as of the date made, and we undertake no obligation to update any such statements to reflect circumstances or events that occur after the date on which the forward-looking statement is made.
* Company Update Organization / Market Footprint Key Metrics Key 4Q Initiatives Consolidate Charters Rationalize Branch Footprint CS Financial Acquisition The Palisades Group Acquisition Platform Initiative Overview

* Company Overview Market Overview * Market Overview data from bloomberg.com as of 12/3/2013 Company Name: Banc of California, Inc. Exchange: NASDAQ Equity Ticker: BANC Debt Ticker: BANCL Preferred Ticker: BANCP Index: Russell 2000 Auditor: KPMG Market Cap: $224.5 million Div. and Yield: 0.48 (3.85%) Price: $12.46 (as of 12/3/13) 52wk Range: $10.26 - $15.54 Avg. Vol. (3m): 69,297 Analyst Coverage: D.A. Davidson & Company FIG Partners Keefe Bruyette & Woods Raymond James Sandler O’Neill Sterne Agee & Leach Wunderlich Securities Banc of California, Inc. PTB Property Holdings Banc of California, NA The Palisades Group CS Financial Shared Infrastructure Platform Initiative (i.e., Technology, MIS, Legal, Marketing, Finance) to cost up to $5 million, target completion in 1H14

* Strategic Growth Source: SNL Financial * Pro Forma for AWB branch sale completed on October 4, 2013 Banc of California has been successful in growing its asset base both organically as well as through opportunistic acquisitions since its recap in November 2010 Closed acquisitions of Gateway Bancorp and Beach Business Bank in 2012 Closed acquisition of The Private Bank of California in 2013 Acquisitions of The Palisades Group and CS Financial closed in Q3 & Q4 2013, respectively Total growth since 2010 makes Banc of California one of the fastest growing U.S. bank holding companies in the U.S. 2010 2011 2012 2013
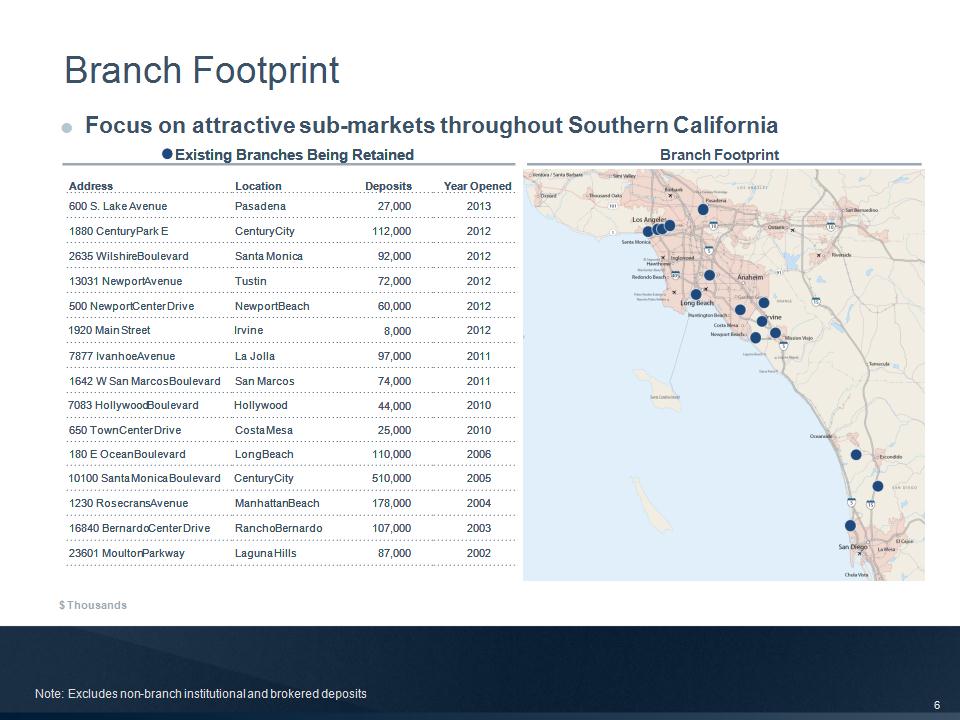
* Existing Branches Being Retained Existing Branches Being Retained Existing Branches Being Retained Existing Branches Being Retained Address Location Deposits Year Opened 600 S. Lake Avenue Pasadena 27,000 2013 1880 Century Park E Century City 112,000 2012 2635 Wilshire Boulevard Santa Monica 92,000 2012 13031 Newport Avenue Tustin 72,000 2012 500 Newport Center Drive Newport Beach 60,000 2012 1920 Main Street Irvine 8,000 2012 7877 Ivanhoe Avenue La Jolla 97,000 2011 1642 W San Marcos Boulevard San Marcos 74,000 2011 7083 Hollywood Boulevard Hollywood 44,000 2010 650 Town Center Drive Costa Mesa 25,000 2010 180 E Ocean Boulevard Long Beach 110,000 2006 10100 Santa Monica Boulevard Century City 510,000 2005 1230 Rosecrans Avenue Manhattan Beach 178,000 2004 16840 Bernardo Center Drive Rancho Bernardo 107,000 2003 23601 Moulton Parkway Laguna Hills 87,000 2002 Branch Footprint Branch Footprint Focus on attractive sub-markets throughout Southern California Note: Excludes non-branch institutional and brokered deposits $ Thousands

* Balance Rate Mix MMDA $328,187 0.44% 10% Savings 238,945 0.31% 7% Checking 589,752 0.02% 18% One Accounts 1,248,337 1.20% 38% CD - Retail/Business 283,166 0.79% 9% CD - Institutional 147,749 0.80% 5% CD - Internet 173,430 0.65% 5% CD - Public - - - ACH Sweeps Brokered 249,808 0.29% 8% Total Deposits $3,259,374 0.69% 100% Strong Deposit Growth September 30, 2013 Balance Rate Mix MMDA $160,484 0.45% 12% Savings 298,389 0.36% 23% Checking 204,368 0.04% 16% One Accounts - - 0% CD - Retail/Business 357,214 0.87% 27% CD - Institutional 176,440 0.76% 14% CD - Internet 49,447 0.65% 4% CD - Public 60,000 0.19% 4% ACH Sweeps Brokered - - 0% Total Deposits $1,306,342 0.52% 100% December 31, 2012 $ Thousands

* September 30, 2013 2010 Total Deposits: $3,259 million Total Deposits: $683 million Total Deposits (millions) $683 $3,259 Cost of Deposits 0.89% 0.69% Average Account Size $19,048 $69,962 % Transaction 46% 81% Deposit Franchise Improved deposit mix and cost of funds

* Lending Franchise Asset Origination Capabilities Loan Portfolio Transition September 30, 2013 Total Loans & Leases: $2,963 Banc of California Residential and commercial real estate lending platforms Banc Home Loans (Mortgage Banking) Private banking Small / middle market and entertainment-based lending C&I and SBA lending The Doctor’s Bank 2010 Total Loans & Leases: $688 Strengthened and diversified lending platform $ Millions

* Credit Metrics Ratios as of 9/30/13 Banc of California, Inc. (BANC) Total Classified Loans / Total Loans 2% Total Non-Accrual plus OREO / Total Loans plus OREO 1% Total Classified Loans / Capital plus Reserves 15% Texas Ratio 10%

* Key Banking Metrics (1) Q3 combines PTB & PBOC and Q2 combines PTB & BBB; the Banks were merged and converted to a national bank at the beginning of Q4 2013 $ Thousands Banc of California, N.A (1) Banc of California, N.A (1) Banc of California, N.A (1) Banc of California, N.A (1) Q3 2013 Q3 2013 Q2 2013 Q2 2013 NIM Amount Yield Amount Yield Loans $32,061 5.0% $26,163 5.7% Securities 1,292 2.3% 369 1.4% Other Interest-Earning Assets 485 0.4% 209 0.3% Total Interest Income 33,838 4.1% 26,741 4.9% Interest-bearing Deposits $5,084 0.8% $3,303 0.7% FHLB Advances 56 0.6% 58 0.5% Capital Lease Obligation 27 5.2% 20 3.3% Total Interest Expense 5,167 0.8% 3,381 0.7% Net Interest Income $28,671 $23,360 Average Earning Assets $3,286,692 $2,205,584 NIM 3.46% 4.25%
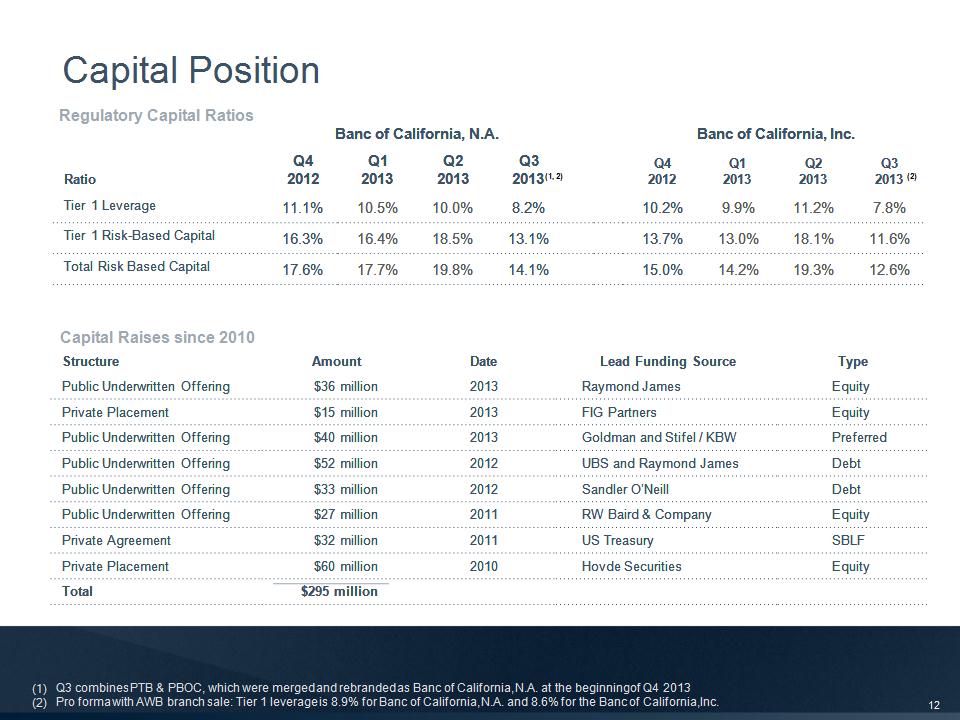
* Capital Position Banc of California, N.A. Banc of California, N.A. Banc of California, N.A. Banc of California, N.A. Banc of California, Inc. Banc of California, Inc. Banc of California, Inc. Banc of California, Inc. Ratio Q4 2012 Q1 2013 Q2 2013 Q3 2013 Q4 2012 Q1 2013 Q2 2013 Q3 2013 Tier 1 Leverage 11.1% 10.5% 10.0% 8.2% 10.2% 9.9% 11.2% 7.8% Tier 1 Risk-Based Capital 16.3% 16.4% 18.5% 13.1% 13.7% 13.0% 18.1% 11.6% Total Risk Based Capital 17.6% 17.7% 19.8% 14.1% 15.0% 14.2% 19.3% 12.6% Structure Amount Date Lead Funding Source Type Public Underwritten Offering $36 million 2013 Raymond James Equity Private Placement $15 million 2013 FIG Partners Equity Public Underwritten Offering $40 million 2013 Goldman and Stifel / KBW Preferred Public Underwritten Offering $52 million 2012 UBS and Raymond James Debt Public Underwritten Offering $33 million 2012 Sandler O’Neill Debt Public Underwritten Offering $27 million 2011 RW Baird & Company Equity Private Agreement $32 million 2011 US Treasury SBLF Private Placement $60 million 2010 Hovde Securities Equity Total $295 million Capital Raises since 2010 Regulatory Capital Ratios Q3 combines PTB & PBOC, which were merged and rebranded as Banc of California, N.A. at the beginning of Q4 2013 Pro forma with AWB branch sale: Tier 1 leverage is 8.9% for Banc of California, N.A. and 8.6% for the Banc of California, Inc. (1, 2) (2)

* Pro Forma Capital Growth A B C D E F 3Q13 Equity Branch Sale FMV in excess of BV (1) DTA VA (2) Accretable Yield (1) Potential Equity Equity as of September 30, 2013 After tax capital gain from branch sale to AmericanWest Bank Embedded gains in balance sheet if loans and securities marked to fair value DTA valuation allowance reversal as Banc of California achieves necessary levels of profitability Accretable yield from marked to model loans presents meaningful potential benefit to capital over the 3.3 years average duration of subject loans As reported Q3 2013 10Q, tax effected at 40% As reported Q3 2013 10Q $ Millions

* Company Update Organization / Market Footprint Key Metrics Key 4Q Initiatives Consolidate Charters Rationalize Branch Footprint CS Financial Acquisition The Palisades Group Acquisition Platform Initiative Overview
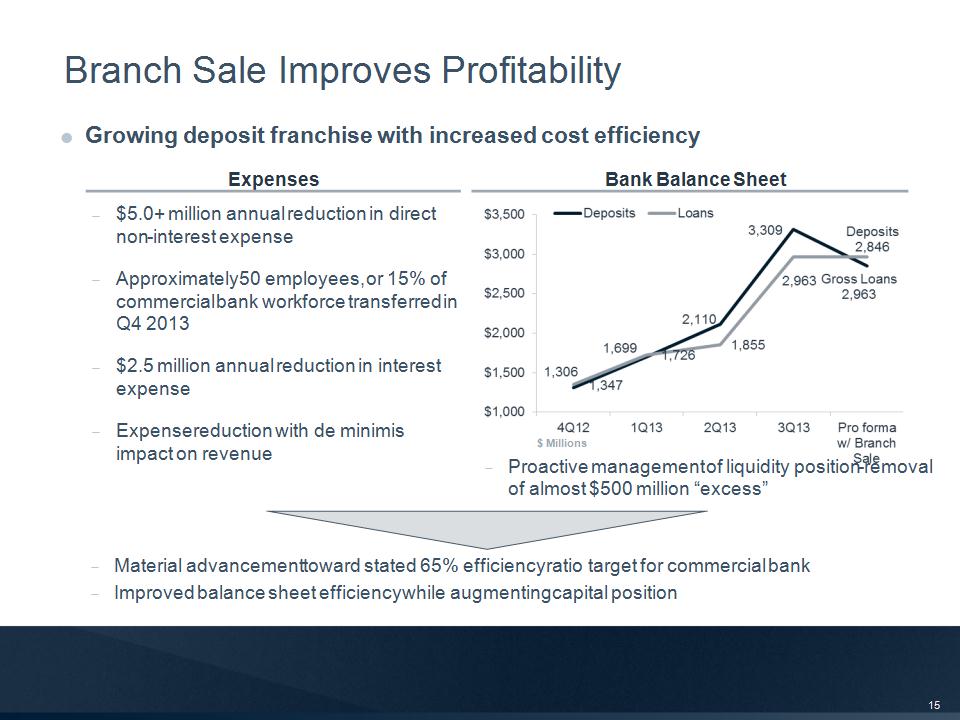
* Bank Balance Sheet Expenses Material advancement toward stated 65% efficiency ratio target for commercial bank Improved balance sheet efficiency while augmenting capital position Proactive management of liquidity position–removal of almost $500 million “excess” $5.0+ million annual reduction in direct non-interest expense Approximately 50 employees, or 15% of commercial bank workforce transferred in Q4 2013 $2.5 million annual reduction in interest expense Expense reduction with de minimis impact on revenue Growing deposit franchise with increased cost efficiency Branch Sale Improves Profitability $ Millions
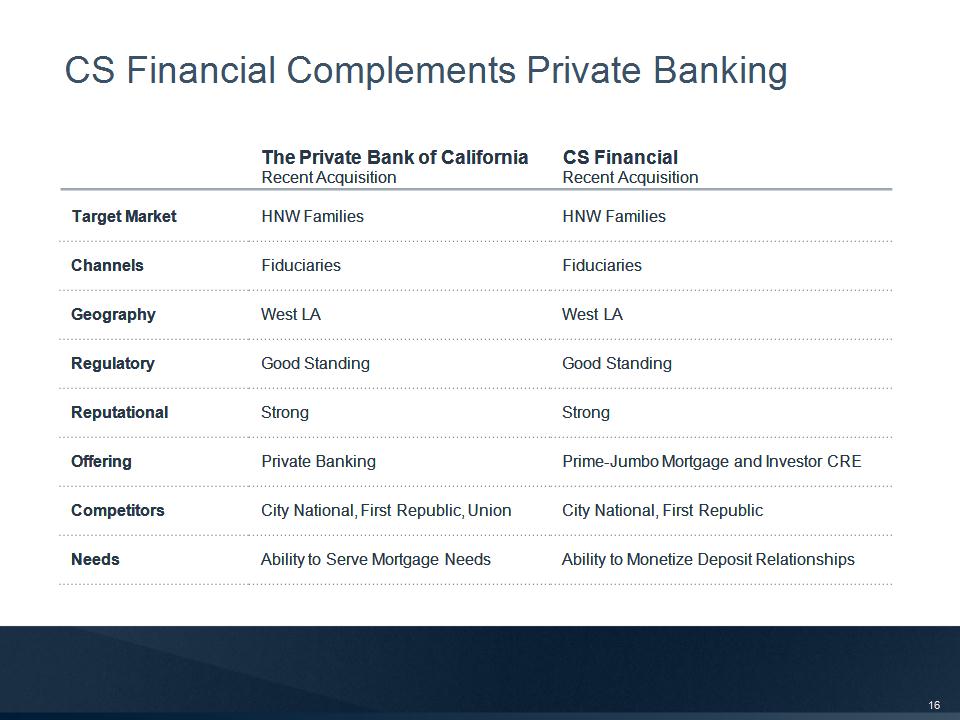
* The Private Bank of California Recent Acquisition CS Financial Recent Acquisition Target Market HNW Families HNW Families Channels Fiduciaries Fiduciaries Geography West LA West LA Regulatory Good Standing Good Standing Reputational Strong Strong Offering Private Banking Prime-Jumbo Mortgage and Investor CRE Competitors City National, First Republic, Union City National, First Republic Needs Ability to Serve Mortgage Needs Ability to Monetize Deposit Relationships CS Financial Complements Private Banking

* The Palisades Group, LLC (“TPG”) is a Registered Investment Adviser specializing in the acquisition, disposition and management of residential mortgages TPG management team has extensive experience in all aspects of the residential sector including loan underwriting and origination, due diligence, valuation, loan servicing, default management, loss mitigation, and strategic loan resolution The operational knowledge in the bank’s Residential Lending Division provides complementary experience in evaluating and managing structured fixed income transactions along with whole loan and securities trading, portfolio and risk management expertise Managed Assets Over $2.3 billion in total Unpaid Principal Balance (mortgage and asset-based banking) Approximately 10,000 individual loan assets under management Assets managed pursuant to separate accounts advisory and sub-advisory arrangements Business Philosophy 360o portfolio management feedback process (pricing, diligence, servicing, asset management) Loan level due diligence (compliance, title, servicing note review, property value reconciliation) Compliance focused platform Servicer oversight for default management, loss mitigation and asset resolution Borrower specific programs tailored to situational profile The Palisades Group Overview