Attached files
| file | filename |
|---|---|
| 8-K - 8-K - ROWAN COMPANIES PLC | v361775_8k.htm |

Strong Heritage Strong Future Investor Presentation December, 2013
Forward - Looking Statements 3 This report contains forward - looking statements within the meaning of the Private Securities Litigation Reform Act of 1995, including, without limitation, statements about the proposed change in corporate structure as well as statements as to the expectations, beliefs and future expected financial performance of the Company that are based on current expectations and are subject to certain risks, trends and uncertainties that could cause actual results to differ materially from those projected by the Company. Among the factors that could cause actual results to differ materially include oil and natural gas prices, the level of offshore expenditures by energy companies, energy demand, the general economy, including inflation, weather conditions in the Company’s principal operating areas and environmental and other laws and regulations, including changes in tax laws and whether the Company achieves the benefits it expects from the change in Rowan's corporate structure. Other relevant factors have been and will be disclosed in the Company’s filings with the SEC.

Great Equipment Great People A Reputation For Operational Excellence, Built Around… 4 Great Equipment Industry leading position in high - spec jack - ups Building four advanced UDW drillships One of the youngest fleets in the industry Industry leading day rates and utilization 90 years of operational excellence Strong jack - up drilling skills transferable to deepwater Deepwater management team in place Culture of integrity and safe operations Shared Values and Purpose Provide highest customer satisfaction Committed to safe and reliable drilling services Committed to continuous improvement Focused on financial discipline and shareholder returns Great Equipment

Rowan’s Strategic Transitions And Achievements June 2011 Sold manufacturing business for $1.1 billion in cash June 2011 Initiated four rig, $3 Bn UDW drillship expansion September 2011 Sold Land business for $510 million in cash December 2011 Completed jack - up newbuild program – $3 Bn over 5 years in 11 high - spec rigs December 2011 Purchased 3.9 million shares May 2012 5

Rowan’s Fleet Is Geographically Diversified 6 6 / North Sea 10 / Middle East 4 / SE Asia 19 High - spec Jack - ups 8 Premium Jack - ups 3 Commodity Jack - ups with Skid - base Capability 7 / US GOM Drillship #1 4 Ultra - Deepwater Drillships Under Construction 1 / Med 2 / Trinidad Drillship #2 Jack - up Rigs UDW Drillships Drillship #3 NB: Drillship #4 location TBD.

7 Strong Backlog Growth And Diversified Customer Base $1.2 Bn $1.5 Bn 2010 2011 2012 Current $2.2 Bn $4.4 Bn 25% 12% 46% 8% 2% 2% 3% 2% Norway Middle East Deepwater UK SEA Egypt GOM Trinidad Growing Backlog Distributed By Geography Rowan’s Diverse Customer Base

Rowan Is The Leader In High - spec Jack - ups Number of High - spec Jack - ups 0 2 4 6 8 10 12 14 16 18 20 Current By YE 2016 19 Rowan High - spec Jack - ups Includes data supplied by ODS - Petrodata, Inc; Copyright 2013 (as of 10/09/13) 8
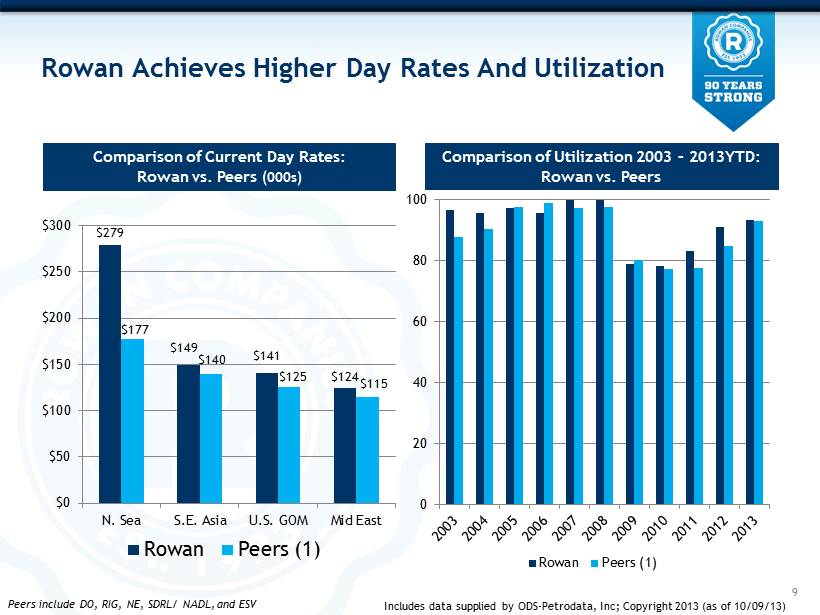
Rowan Achieves Higher Day Rates And Utilization Comparison of Current Day Rates: Rowan vs. Peers (000s) Comparison of Utilization 2003 – 2013YTD: Rowan vs. Peers 0 20 40 60 80 100 Rowan Peers (1) Peers include DO, RIG, NE, SDRL/ NADL, and ESV $279 $149 $141 $124 $177 $140 $125 $115 $0 $50 $100 $150 $200 $250 $300 N. Sea S.E. Asia U.S. GOM Mid East Rowan Peers (1) 9 Includes data supplied by ODS - Petrodata, Inc; Copyright 2013 (as of 10/09/13)

Global Jack - up Fleet Totals 505 Rigs Total Utilization Is 88%, Marketed 95% 10 US GOM Indian Ocean North Sea Mediterranean Middle East Southeast Asia Mexico C&S America West Africa Australia 59% 59 Rigs 96% 46 Rigs 87% 15 Rigs 93% 27 Rigs 100% 33 Rigs 100% 2 Rigs 91% 77 Rigs 89% 141 Rigs 85% 20 Rigs 98% 42 Rigs Includes data supplied by ODS - Petrodata, Inc; Copyright 2013 (as of 10/09/13)

Competitive Jack - up Utilization At 95% 0 100 200 300 400 500 600 Total Supply CS / OOS China / Iran Competitive Supply 505 Total Jack - ups 41 Cold Stacked / OOS 56 Non - competitive countries 408 Competitive Jack - ups 60% older than 25 years 95% Utilization 88% Utilization 11 Includes data supplied by ODS - Petrodata, Inc; Copyright 2013 (as of 10/09/13)

Jack - up Market Continues To Bifurcate 20 40 60 80 100 IS, MS, MC <300'IC 300'IC 350'+ IC(including High Spec) High Spec* Worldwide Utilization By Rig Class % * Excludes Chinese Rig, Master Driller Includes data supplied by ODS - Petrodata, Inc; Copyright 2013 (as of 10/09/13) 12

What’s Driving Bifurcation In The J/U Markets? • Operators need greater rig capabilities to drill challenging wellbore designs » Deep shelf gas » Long reach horizontals » HPHT » Large pipe programs/heavy string weights • IOCs and NOCs are focused on achieving lower wellbore costs rather than the lowest day rate • Operators are requiring higher standards post - Macondo 13

Newbuild Jack - ups Should Replace Aging Rigs 14 6 5 2 4 16 22 46 13 0 10 20 30 40 50 60 2013 2014 2015 2016+ Contracted Not Contracted 300’IC+ Newbuilds Under Construction: 114 Total 48 22 27 • 15% Contracted • Only 32 of the 114 units under construction are high - spec • 57 jack - ups have been ordered in 2013 Includes data supplied by ODS - Petrodata, Inc; Copyright 2013 (as of 10/09/13) 17
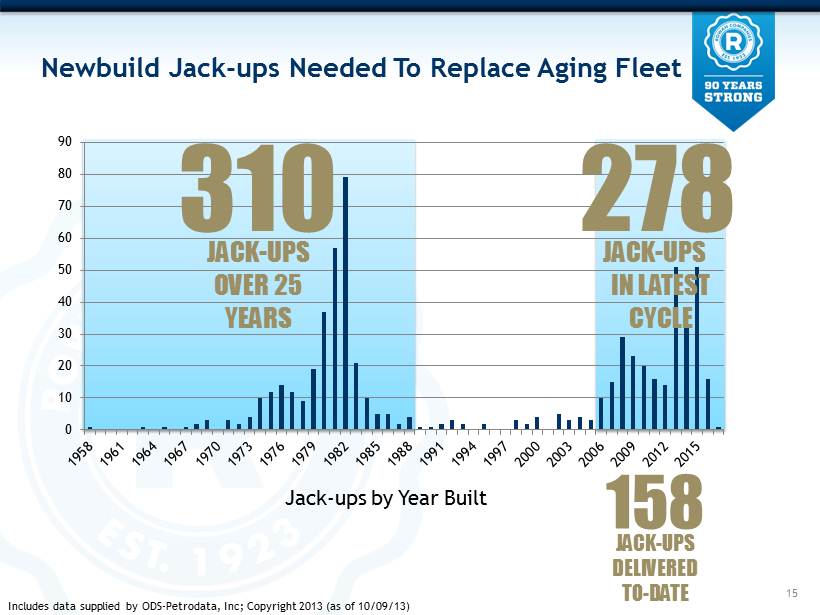
Newbuild Jack - ups Needed To Replace Aging Fleet 15 Jack - ups by Year Built Includes data supplied by ODS - Petrodata, Inc; Copyright 2013 (as of 10/09/13) JACK - UPS DELIVERED TO - DATE 158 0 10 20 30 40 50 60 70 80 90 310 JACK - UPS OVER 25 YEARS 278 JACK - UPS IN LATEST CYCLE

$0 $50,000 $100,000 $150,000 $200,000 $250,000 Premium* High Spec 0 100 200 300 400 2000 2001 2002 2003 2004 2005 2006 2007 2008 2009 2010 2011 2012 2013 High - Spec Dayrates Climb Through Newbuild Cycle Average Earned Day Rate Includes data supplied by ODS - Petrodata, Inc; Copyright 2013 (as of 10/09/13) Cumulative Jack - ups Delivered * Premium rigs defined as 350’IC+ (inclusive of high - spec jack - ups) 175 16

0 50 100 150 200 250 300 A Wave Of Jack - up Retirements Could Be Coming 17 World jack - up rig population over 40 years old is growing… Includes data supplied by ODS - Petrodata, Inc; Copyright 2013 (as of 10/09/13) # of jack - ups 40+ years JACK - UPS OVER 40+ YEARS IN 10 YEARS 288 18 JACK - UPS OVER 40+ YEARS TODAY

Rowan Is Entering UDW Market – With Advantages • Long standing brand reputation for operational excellence and customer satisfaction • Very high specification drillship design with built - in redundancies • Core team of highly experienced and respected deepwater professionals already in place • Contracting success demonstrates customer enthusiasm 18

Recent Rowan UDW Drillship Milestones 19 Rowan Renaissance Rowan Resolute Rowan Reliance 2. Rowan Resolute September 2 7 – Launched from Dry Dock 1. Rowan Renaissance November 17 – Successfully completed sea trials October 2 – Held Naming Ceremony 3. Rowan Reliance September 30 – Completed keel laying 4. Rowan Relentless October 21 – Official steel cutting Held Naming Ceremony Completed Sea Trials Launched from Dry Dock Completed Keel Laying

3 of 4 UDW Drillships Contracted 20 Delivery December 2013 2013 2014 2015 3 Year Contract Commences March 2014 Rowan Renaissance 1 Delivery June 2014 2 Rowan Resolute Delivery October 2014 3 Rowan Reliance Delivery March 2015 4 Rowan Relentless 3 Year Contract Commences September 2014 3 Year Contract Commences January 2015

UDW Man Power Ramp Up On Schedule 21 Rowan Renaissance • Experienced, UDW technical managers in place • Transferring rig personnel from jack - up crews to man portion of UDW rigs • Renaissance 99% complete – 44% of crew will be local Angolan Nationals • Expect staffing for first UDW rig to be completed by December 2013 Actual Planned P ersons Planned Actual 0 25 50 75 100 125 150 175 200 Jan-12 Jun-12 Nov-12 Apr-13 Sep-13 Feb-14 Planned Actual

Deepwater Demand Fundamentally Strong 2008 – 2013 YTD, Water Depth 4,000’ and Greater 2008 2009 2010 2011 2012 1H 2013 Announced Discoveries by Year 31 36 40 29 53 2 6 2 2 2 4 4 3 10 11 6 1 1 3 5 1 1 5 52 13 8 1 7 1 Includes data supplied by ODS - Petrodata , Inc; Copyright 2013 (as of 08/01/13) 23 22

Floater Market Bifurcating At A Fast Pace 50 60 70 80 90 100 <5,000' 5,000'-7,499' 7,500'-9,999' 10,000'+ % Worldwide Utilization by Water Depth Includes data supplied by ODS - Petrodata, Inc; Copyright 2013 (as of 10/09/13) 23

85% 114% 95% 70% 10% 32% 42% 176% 170% 97% 103% 50% 48% 56% 0% 50% 100% 150% 200% 250% RDC NE ATW SDRL DO ESV RIG Estimated Earnings Growth Δ 2012( a) - 2014(e) Δ 2012( a) - 2015(e) FactSet e stimates as of 11/25/2013 Drillships Will Drive Sector Leading EPS Growth 24 Expect further EPS growth in 2016+ when recognize full year operating results for all four drillships Expect margins to increase to match peers with floater fleets

Rowan Multiples Now More In Line With Peers As of April 12, 2012 Aggregate Value Price to Share Price to Earnings to EBITDA Book Price 2012 2013 2014 2012 2013 2014 Value ($) (x) (x) (x) (x) (x) (x) Seadrill 50.27 16.7x 10.5x 8.9x 7.4x 6.1x 5.7x 1.1x Transocean 37.27 11.9x 11.0x 9.8x 10.5x 9.6x 8.4x 2.8x ENSCO 66.02 15.6x 12.9x 10.7x 8.1x 7.0x 6.2x 2.1x Noble 36.53 12.3x 8.7x 6.9x 7.5x 5.9x 5.4x 1.1x Diamond Offshore 53.53 9.7x 8.0x 7.2x 7.7x 6.6x 6.3x 1.1x Rowan 33.99 12.8x 8.8x 7.0x 8.0x 6.0x 5.0x 1.0x Atwood Oceanics 44.03 10.6x 8.5x 7.1x 8.3x 6.4x 5.0x 1.7x Mean 12.8x 9.8x 8.2x 8.2x 6.8x 6.0x 1.6x Median 12.3x 8.8x 7.2x 8.0x 6.4x 5.7x 1.1x As of October 16, 2013 Aggregate Value Price to Share Price to Earnings to EBITDA Book Price 2013 2014 2015 2013 2014 2015 Value ($) (x) (x) (x) (x) (x) (x) $45.98 15.9x 12.6x 10.5x 12.1x 9.6x 8.2x 2.8x $45.22 11.4x 8.6x 7.8x 6.8x 5.7x 5.3x 1.0x $54.81 8.6x 7.4x 6.6x 6.9x 6.1x 5.5x 1.0x $37.58 13.1x 8.4x 6.8x 7.9x 5.9x 5.1x 1.1x $63.14 13.2x 10.0x 8.1x 7.0x 5.2x 4.3x 1.9x $36.33 16.8x 10.2x 6.9x 8.7x 6.3x 4.6x 1.0x $54.13 9.8x 8.0x NA 8.1x 6.4x NA 1.7x 12.7x 9.3x 7.8x 8.2x 6.5x 5.5x 1.5x 13.1x 8.6x 7.3x 7.9x 6.1x 5.2x 1.1x 25
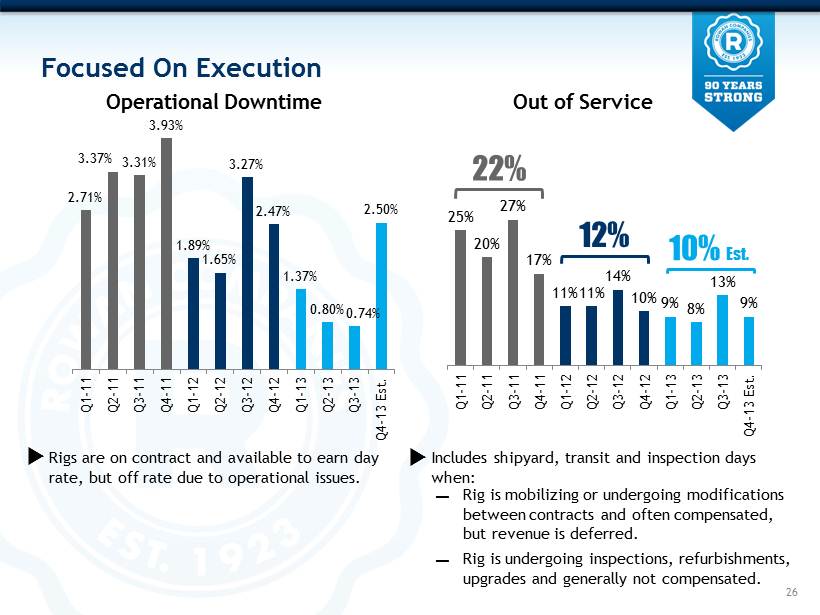
2.71% 3.37% 3.31% 3.93% 1.89% 1.65% 3.27% 2.47% 1.37% 0.80% 0.74% 2.50% Q1-11 Q2-11 Q3-11 Q4-11 Q1-12 Q2-12 Q3-12 Q4-12 Q1-13 Q2-13 Q3-13 Q4-13 Est. Focused On Execution 25% 20% 27% 17% 11% 11% 14% 10% 9% 8% 13% 9% Q1-11 Q2-11 Q3-11 Q4-11 Q1-12 Q2-12 Q3-12 Q4-12 Q1-13 Q2-13 Q3-13 Q4-13 Est. Out of Service Operational Downtime Includes shipyard, transit and inspection days when: Rigs are on contract and available to earn day rate, but off rate due to operational issues. Rig is mobilizing or undergoing modifications between contracts and often compensated, but revenue is deferred. Rig is undergoing inspections, refurbishments, upgrades and generally not compensated. — — 10% Est. 12% 22% 26

(in millions) Actual 09/30/2013 Projected 12/31/2013 Cash and available credit $1,759 ~$1,200 Total Debt $2,009 $2,009 Total Debt - to - Cap 30% 29% Net Debt - to - Cap 17% 24% 27 Investment Grade Balance Sheet (Baa3/BBB - ) Rowan Newbuild Capex With Four Drillships $ 517 MM $ 452 MM 2013 2014 2015 $1,064 MM

Rowan Focused On Optimum Allocation Of Capital • Return on investment analysis drives all capital decisions » Sensitivity analysis – Capital cost, Operating Cost, Day Rate, Tax Rate • Regular consideration of all options for available capital » Newbuilding , purchasing, investments in existing fleet, return on capital • Committed to maintaining investment grade balance sheet 28


Appendix 30

Rowan Drillships Built With The Operator In Mind • Two seven - ram BOPs • Equipped with 12,000 ft of riser • DP - 3 compliant with retractable thrusters • Five mud pumps with dual mud systems • Four million pound riser tensioning system • Third load path • Accommodations for 210 people on board 31 Expanded Capabilities And Built - in Redundancies Rowan’s first UDW drillship, Rowan Renaissance , successfully complete sea trials on November 17, 2013. The rig is currently under construction by HHI in South Korea.
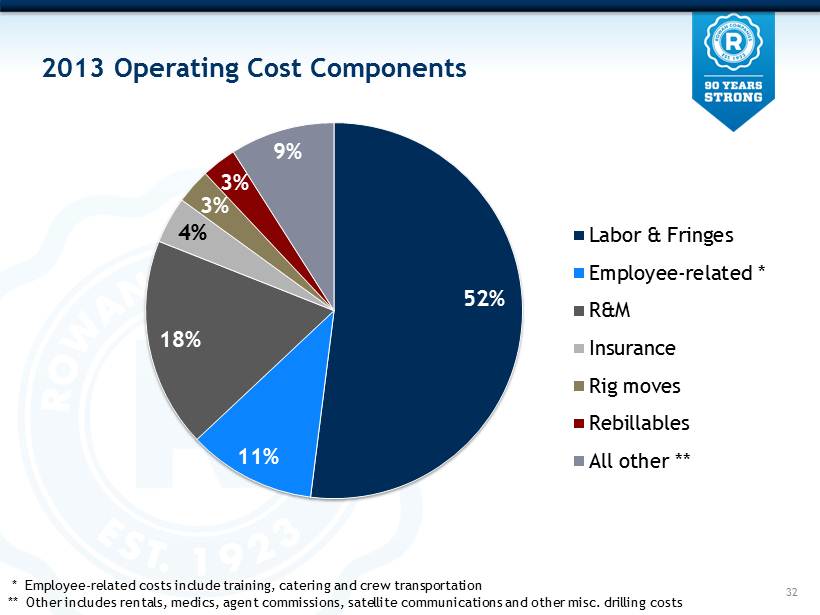
2013 Operating Cost Components 52% 11% 18% 4% 3% 3% 9% Labor & Fringes Employee-related * R&M Insurance Rig moves Rebillables All other ** 32 * Employee - related costs include training, catering and crew transportation ** Other includes rentals, medics, agent commissions, satellite communications and other misc. drilling costs
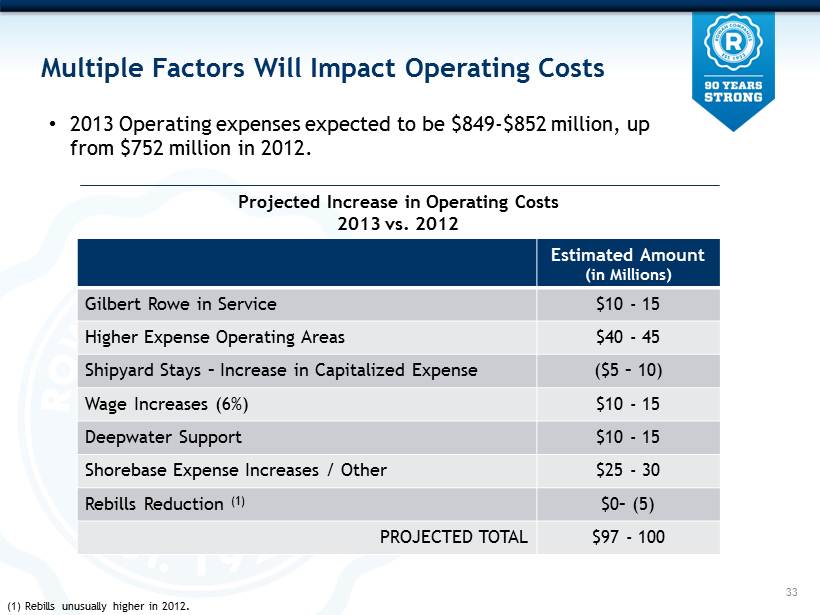
Multiple Factors Will Impact Operating Costs Estimated Amount (in Millions) Gilbert Rowe in Service $10 - 15 Higher Expense Operating Areas $40 - 45 Shipyard Stays – Increase in Capitalized Expense ($5 – 10) Wage Increases (6% ) $10 - 15 Deepwater Support $10 - 15 Shorebase Expense Increases / Other $25 - 30 Rebills Reduction (1) $0 – (5) PROJECTED TOTAL $97 - 100 33 • 2013 Operating expenses expected to be $849 - $852 million, up from $752 million in 2012. Projected Increase in Operating Costs 2013 vs. 2012 (1) Rebills unusually higher in 2012.
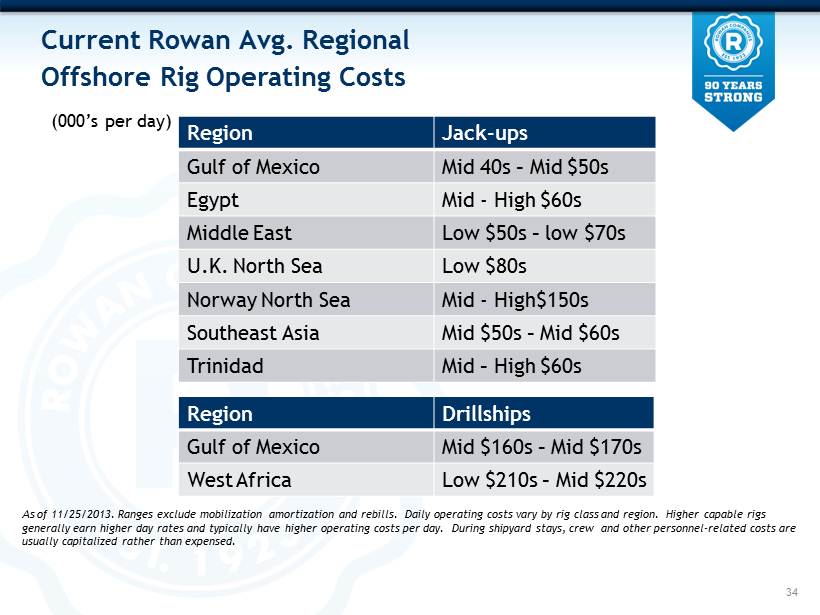
Current Rowan Avg. Regional Offshore Rig Operating Costs Region Jack - ups Gulf of Mexico Mid 40s – Mid $50s Egypt Mid - High $60s Middle East Low $50s – low $70s U.K. North Sea Low $80s Norway North Sea Mid - High$150s Southeast Asia Mid $50s – Mid $60s Trinidad Mid – High $60s 34 (000’s per day) As of 11/25/2013. Ranges exclude mobilization amortization and rebills . Daily operating costs vary by rig class and region. Higher capable rigs generally earn higher day rates and typically have higher operating costs per day. During shipyard stays, crew and other pe rso nnel - related costs are usually capitalized rather than expensed. Region Drillships Gulf of Mexico Mid $160s – Mid $170s West Africa Low $210s – Mid $220s
Glossary of Terms Blowout Preventer (BOP): An emergency shut - off device comprised of a series, or “stack”, of valves that shut the wellbore in the event that hydrocarbons enter the wellbore and pressure containment is compromised. The BOP is intended to serve as a pressure control system of last resort. Cold - stacked Rig: An offshore rig that is not actively marketed and is completely down - manned. Cold stacked rigs generally require significant time and capital expenditures to reactivate. Day rate Contract : A contractual agreement where a drilling contractor is paid a daily rate. Customer carries majority of the operating risk so long as the drilling contractor meets the basic standards of equipment and personnel specified by the contract. Estimated Planned Off Rate Time : Defined by Rowan as those days where a rig will not be available to earn any revenue due to shipyard, transit, inspection periods, or suspension of operations. High - specification Rig : Defined by Rowan as rigs with a two million pound or greater hook - load capacity. Hook - load: A commonly used metric to define the lifting capacity of a rigs drawworks and derrick system. Operational Downtime : When a rig is under contract and unable to conduct planned operations due to equipment breakdowns or procedural failures. Operational downtime will result in a related revenue reduction. The company expects operational downtime to account for approximately 2.5% of in - service days. Out of Service Days: I nclude days for which no revenues are recognized other than operational downtime and stacked days (cold - stacked days or off rate between contracts). The company may be compensated for certain out - of service days, such as for shipyard stays or for transit periods preceding a contract ; however recognition of any such compensation received is deferred and recognized over the period of drilling operations. Utilization : A rate that specifies the percentage of time that a rig (or fleet of rigs) earned day rate in a specified period. 35

Investor Contact: Suzanne M. Spera Director, Investor Relations sspera@rowancompanies.com Rowan Companies 2800 Post Oak Blvd. Suite 5450 Houston, TX 77056 713.621.7800 www.rowancompanies.com