Attached files
| file | filename |
|---|---|
| 8-K - FORM 8-K - ALLEGHANY CORP /DE | d633227d8k.htm |
 Investor Day
November 22, 2013
Alleghany
Exhibit 99.1 |
 Jack
Sennott Welcome and Introductions
22 November 2013
Alleghany
2 |
 Alleghany
3
Investor Day Agenda
Topic
Presenters
10:00 AM
Registration and
Refreshments
10:30 AM
Welcome and Introductions
Jack Sennott
Senior Vice President and Chief Financial Officer, Alleghany Corporation
10:35 AM
Alleghany Overview
Weston Hicks
President and Chief Executive Officer, Alleghany Corporation
11:05 AM
Alleghany Insurance
Operations
Joe Brandon
Executive Vice President, Alleghany Corporation
11:35 PM
TransRe
Michael Sapnar
President and CEO, Transatlantic Holdings
12:05 PM
Lunch
1:00 PM
RSUI Group, Inc.
Dave Leonard
Chairman and CEO, RSUI Group
1:30 PM
Capitol Companies
Stephen Sills
Chairman and CEO, Capitol Companies
2:00 PM
Investments Panel
Roger Gorham
Senior Vice President, Head of Fixed Income and Treasurer, Alleghany
Corporation Jack Liebau
President and CEO, Alleghany Capital Partners LLC
David Van Geyzel
President and CEO, Alleghany Capital Corporation
Udi Toledano
Chairman, Alleghany Capital Corporation
2:30 PM
Financial Review
Jack Sennott
Senior Vice President and CFO, Alleghany Corporation
3:00 PM
Closing Remarks
4:00 PM
Alleghany Corporation Rings the Closing Bell |
 Alleghany
4
Forward-Looking Statements
This
presentation
contains
“forward-looking
statements”
within
the
meaning
of the Private Securities Litigation Reform Act of 1995. These forward-
looking statements are not historical facts but instead represent only
Alleghany’s belief regarding future events, many of which, by their nature,
are inherently uncertain and outside Alleghany’s control. Except for
Alleghany’s ongoing obligation to disclose material information as required
by federal securities laws, Alleghany is not under any obligation (and
expressly disclaims any obligation) to update or alter any projections, goals,
assumptions, or other statements, whether written or oral, that may be made
from time to time, whether as a result of new information, future events or
otherwise. Factors that could cause Alleghany’s actual results and
experience to differ, possibly materially, from those expressed in the
forward-looking statements include the factors set forth in Alleghany’s most
recent Annual Report on Form 10-K and Quarterly Reports on Form 10-Q
filed with the United States Securities and Exchange Commission.
|
 Weston Hicks
Alleghany Overview
22 November 2013
Alleghany |
 Alleghany
6
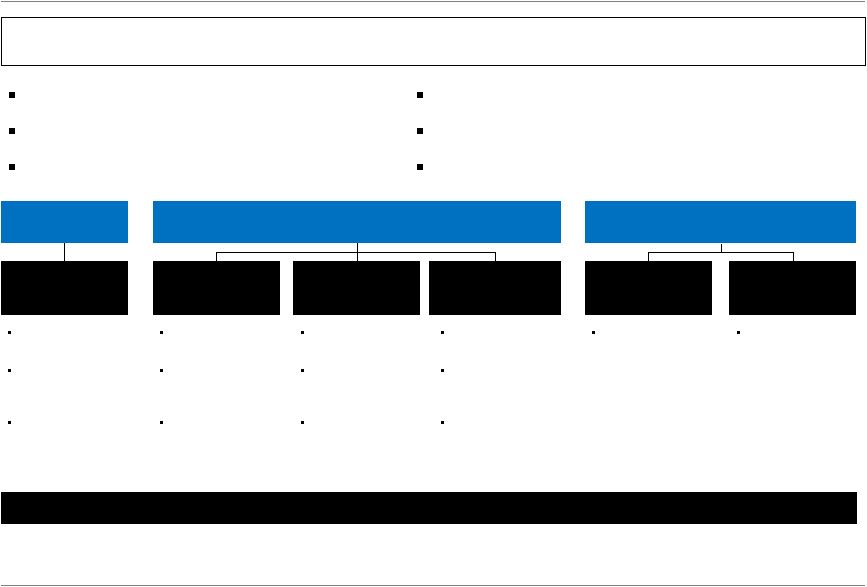
Alleghany Today
Alleghany Overview
Insurance
Reinsurance
Capitol
Companies
(“Capitol”)
Pacific
Compensation
(“PacificComp”)
RSUI
TransRe
Statutory Surplus
of $4.4 billion
(2)
2012 Gross
Premiums Written
of $3.6 billion
(3)
Top 10 global
reinsurer
(4)
Statutory Surplus of
$1.5 billion
(2)
2012 Gross
Premiums Written
of $1.1 billion
11 largest
U.S.
excess and surplus
lines insurer
(5)
Statutory Surplus
of $217 million
(2)
2012 Gross
Premiums Written
of $158 million
Focus on small
niche specialty
commercial lines
Statutory Surplus
of $99 million
(2)
2012 Gross
Premiums Written
of $19.4 million
Specializes in
California
workers’
compensation
insurance
Investments
Alleghany
Capital
Corporation
Alleghany
Capital
Partners
$2.0 billion equity
portfolio
(2)
Investments in:
~85 years as a public company (NYSE: Y)
$6.7 billion in book value
$6.6 billion equity market capitalization
$19.2 billion in total cash & investments
Baa2 senior debt rating from Moody’s
BBB senior debt rating from Standard & Poor’s
bbb+ senior debt rating from A.M. Best
(1)
Notes: Financial data as of September 30, 2013 unless otherwise specified; Market
data as of November 21, 2013 (1) Moody’s = Long Term Rating; Standard
& Poor’s = LT Local issuer Credit; and A.M. Best = Long Term Issuer Credit
(2) As of September 30, 2013
(3) Pro forma from January 1, 2012
Fixed Income
(4) Standard & Poor’s RatingsDirect, 2013
(5)
A.M.
Best’s U.S.
Surplus
Lines –
Segment
Review,
September
2013
th
–
Kentucky Trailer
–
Bourn & Koch
–
Stranded Oil
–
ORX Exploration |
 Alleghany
7
A History of Successful Strategic Investing
1929
1949
1954
1968
1974
1984
1999
2007
2013…
Nickel Plate, Chesapeake & Ohio,
Erie and Pere Marquette Railroads
(merged into Penn Central in 1968)
New York Central
Railroad (merged
into Penn Central
in 1968)
Investors Diversified Services (“IDS”) (sold to
American Express in 1984)
MSL Industries
Jones Motor
Company
Alleghany Asset
Management (sold to ABN
Amro in 2001)
Chicago Title (spun off
in 1998/1999)
Shelby
Insurance
(sold in
1991)
Underwriters
Reinsurance
Company (sold
to Swiss Re in
2000)
Capitol
RSUI
World Minerals (sold in 2005)
Darwin (IPO
in 2006 and
sold in
2008)
PacificComp
TransRe
Alleghany Overview
Legacy Alleghany Investment
Current Alleghany Investment |
 Alleghany
8
A Consistent Approach to Book Value Growth
“We shun investment fads and fashions in favor of investing in basic financial
and industrial enterprises that offer long-term value to the
investor.” —
John
Burns,
CEO
1992
-
2004
“Our objective is to create stockholder value through the ownership and
management of a small group of operating subsidiaries and
investments.” —
Weston
Hicks,
CEO
2004
-
Present
“Alleghany’s operating units conduct their business on a
quasi-autonomous basis while the parent company sets goals, provides
incentives, and monitors performance through a small but select parent
company staff.” —
F.
M.
Kirby,
CEO
1967
-
1992
Alleghany Overview |
 Alleghany
9
Experienced Management Team
Name
Title
Years
Industry
Experience
Years
Alleghany
Experience
Holding Company
Weston Hicks
President & Chief Executive Officer
29
11
Joseph Brandon
Executive Vice President
27
2
Jack Sennott
SVP –
Chief Financial Officer
27
6
Christopher Dalrymple
SVP –
General Counsel
17
11
Roger Gorham
SVP –
Head of Fixed Income and Treasurer
29
9
Jerry Borrelli
VP –
Principal Accounting Officer
26
7
Investment Subsidiaries
David Van Geyzel
President & Chief Executive Officer, Alleghany Capital Corporation
14
6
Udi Toledano
Chairman, Alleghany Capital Corporation
38
4
Jack Liebau
President & Chief Executive Officer, Alleghany Capital Partners
29
1
Operating Companies
Michael Sapnar
President & Chief Executive Officer, TransRe
25
2
Dave Leonard
Chairman & Chief Executive Officer, RSUI
34
10
Stephen Sills
Chairman & Chief Executive Officer, Capitol Companies
35
6
Janet Frank
Chairman / President & Chief Executive Officer, PacificComp
36
2
Mark See
Chief Executive Officer, Stranded Oil Resources Corporation
26
2
Tim Helle
President, Bourn & Koch
30
2
Gary Smith
Chief Executive Officer, Kentucky Trailer
17
1
Alleghany Overview
Note: Includes experience prior to acquisition by Alleghany
|
 Alleghany
10
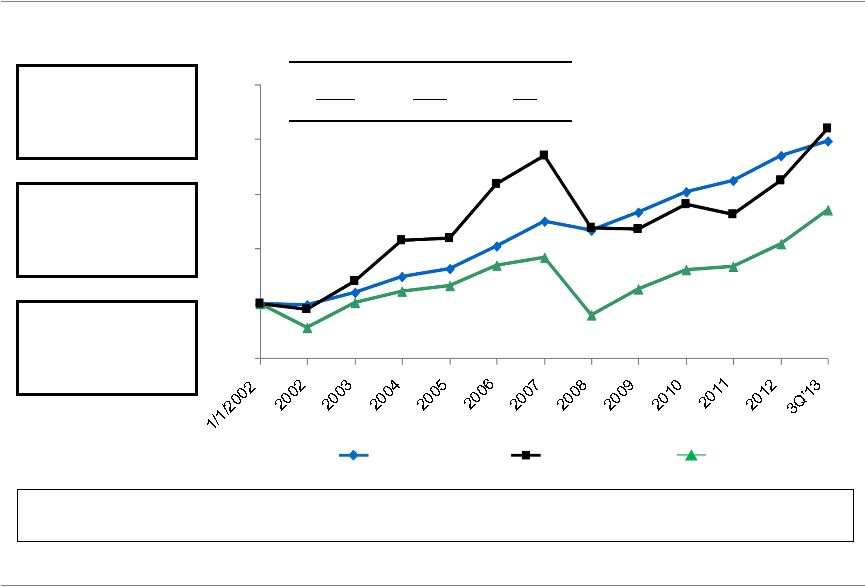
Attractive Long-Term Returns
(%)
Alleghany BVPS
Alleghany Price
S&P 500
2002
–
3Q’13
CAGR
(%)
(1)
Alleghany
BVPS
8.0%
Alleghany
Price
8.4%
S&P
500
5.4%
+148%
+159%
+85%
Focus on Book
Value per Share
Growth
Long-term
Conservative
Orientation
Quasi-autonomous
Subsidiary
Operating Model
Source: SNL Financial, Company filings, CapIQ
(1)
Alleghany price and S&P500 CAGR calculated on a total return basis
Alleghany has a demonstrated track record of creating long-term stockholder
value Alleghany Overview
50
100
150
200
250
300 |
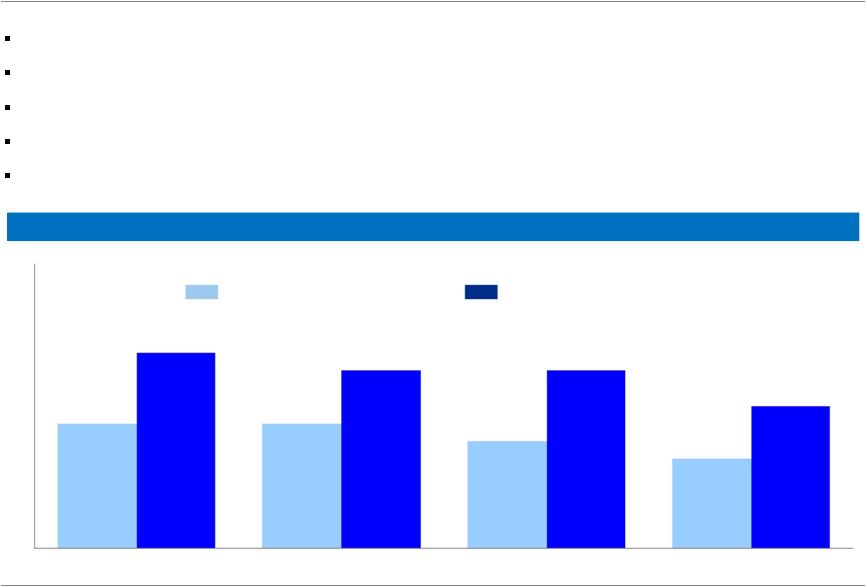
 Strong
Culture of Underwriting Discipline Experienced
underwriters
with
deep
understanding
of
products
and
pricing
of
specialty
business
Focus on underwriting profits, not premium production
-
Compensation structured to reward underwriting profits
Alleghany has outperformed its specialty insurance peer group
Underwriting profitability and resulting book value growth are key performance
metrics Alleghany GAAP Combined Ratio vs. Peer Average
Alleghany Overview
Alleghany
Average
(1)
Peer
Group
Average
(2),(3)
Alleghany
Peer Group Average
(%)
(1)
Includes
all
current
(re)insurance
operations
(2003
–
YTD
2013)
(2)
Peer
Group
Average
includes
ACGL,
AWH,
AXS,
MKL
and
WRB
(2003
–
2011)
(3) Represents Peer Group Average for 2012 and YTD 2013; includes ACGL, AWH, AXS,
MKL, WRB, PRE, PTP and RE 120.0
110.0
100.0
90.0
80.0
70.0
60.0
2003
2004
2005
2006
2007
2008
2009
2010
2011
2012
Q3 '13
87.0
83.5
88.8
90.2
114.3
96.8
83.0
71.3
72.5
82.8
92.4
90.3
86.2
84.7
89.0
83.0
93.4
103.3
94.1
89.9
93.6
87.0
Alleghany
11
87.9%
90.2% |
 Alleghany
12
Leading Specialty Franchises
Reinsurance
Insurance
TransRe –
top 10 global
reinsurer
(1)
Best-in-class D&O, E&O and
medical malpractice reinsurer
Significant property catastrophe
reinsurer
Premier excess & surplus lines
insurer
RSUI
–
11
th
largest
U.S.
excess
and
surplus
lines
insurer
(2)
Capitol–
small niche specialty
commercial insurer
Assets:
$16.6
billion
(3)
2012 Gross Premiums Written:
$3.6 billion
(4)
Financial Strength Rating of “A+”
by S&P and “A”
by A.M. Best
Assets:
$6.0
billion
(3)
2012 Gross Premiums Written:
$1.3 billion
Financial Strength Rating of “A”
by
A.M.
Best
(5)
Leader in specialty reinsurance
Global footprint
Strong underwriting culture
Leader in specialty insurance
Strong underwriting culture
Business
Size and Ratings
Complementary
Strengths
(1) Standard & Poor’s RatingsDirect, 2013
(2)
A.M.
Best’s
U.S.
Surplus
Lines
–
Segment
Review,
September
2013
(3) At 9/30/2013
(4) Pro forma from 1/1/12
(5) For RSUI and Capitol
Alleghany Overview |
 Alleghany
13
How We Think about Investment Risk
Alleghany Overview
Investments are a significant part of our earnings power
Total Cash & Investments
Total Equity
=
$19.2 billion
$6.7 billion
=
2.87x investment leverage
Central banks are trying to keep the
economy
“in
the
fairway”
but
there
is
no
guarantee this will be successful
We have structured our portfolio to withstand
any
of
these
macroeconomic
tailwinds
(1)
(1)
Pro forma assuming Ares and deflation-protected strips allocation are
fully-deployed The economy remains vulnerable to
deflationary shocks or recessionary trends
due to:
Falling money demand
Demographics
Weak employment data
Potential trade wars |
 Alleghany
14
Key Alleghany Takeaways
Alleghany Overview
TransRe and RSUI are “true franchises”
Proprietary investment capability
Non-financial businesses likely to be a larger contributor in the future
Holding
company
maintains
significant
optionality
through
excess
liquidity
and
avoidance of excessive leverage
Goal is to compound book value per share at 7-10% per year with below
average risk |
 Alleghany
15
Questions?
Alleghany Overview |
 Joe
Brandon Insurance Operations
22 November 2013
Alleghany
16 |
 Alleghany
17
Alleghany’s (Re)insurance Operations –
Consolidated View
Insurance Operations
Gross Premiums Written:
–
2012
$4.9 billion
–
2013 YTD
(1)
$3.8 billion
Investments and Cash
$18.3 billion
Net Loss and LAE Reserves
$10.7 billion
Stockholders’
Equity
$6.4 billion
(1)
YTD as of September 30, 2013 |
 Alleghany
18
Alleghany’s (Re)insurance Operations –
By Company
Insurance Operations
Gross Premiums Written:
2012
(1)
$3.6 billion
2013 YTD
(2)
$2.6 billion
Cash & Investments
(2)
$14.4 billion
GAAP Equity
(2)
$4.4 billion
Michael Sapnar
Dave Leonard
Stephen Sills
Jan Frank
(1)
Full year 2012
(2)
As of September 30, 2013
Gross Premiums Written:
2012
$1.1 billion
2013 YTD
(2)
$962 million
Cash & Investments
(2)
$3.1 billion
GAAP Equity
(2)
$1.6 billion
Gross Premiums Written:
2012
$19 million
2013 YTD
(2)
$30 million
Cash & Investments
(2)
$229 million
GAAP Equity
(2)
$109 million
Gross Premiums Written:
2012
$158 million
2013 YTD
(2)
$135 million
Cash & Investments
(2)
$507 million
GAAP Equity
(2)
$305 million |
 Alleghany
19
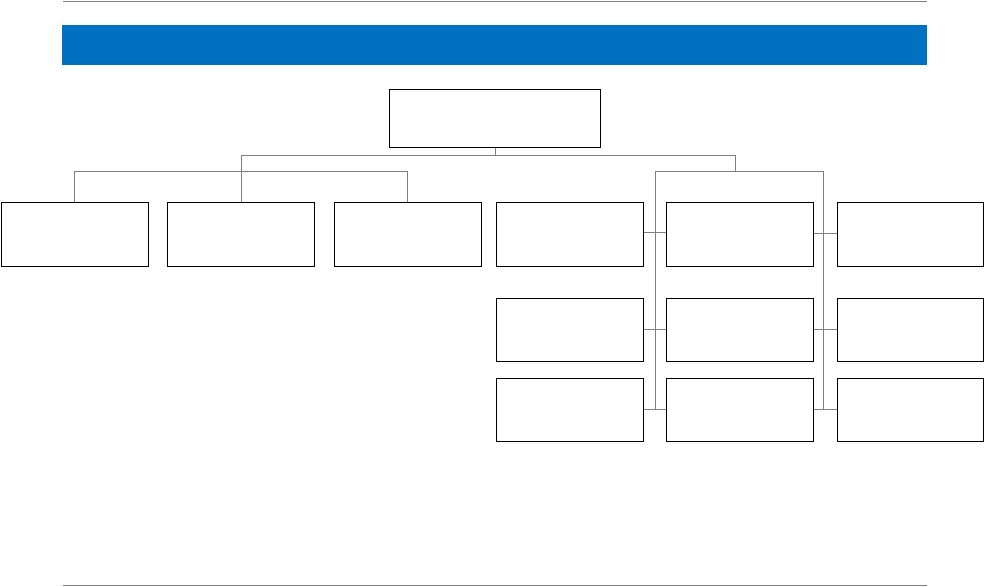
What Does Quasi-Autonomous Mean?
Insurance Operations
Alleghany
Corporate Governance
&
Risk Management
Investment
Management
Management
Compensation
Strategy /
Capital Allocation |
 Alleghany
20
Investment Management
Insurance Operations
Macroeconomic views and long-term expected performance relative to risk
drive our investment allocations
Investments managed at the holding company level through a combination of
in-house and third-party resources
Risk asset allocations and liquidity requirements by subsidiary are determined
in conjunction with each operating company |
 Alleghany
21
Management Compensation
Insurance Operations
Substantial part of senior management compensation is tied to their
respective operation’s underwriting profits and growth in book value
No incentive to grow premium by underpricing risk
Incented to think and act like long-term owners of their companies
Annual incentive compensation based on underwriting results
Long-term awards tied to growth in book value
–
Management shares in both profits and losses
–
Serves as retention vehicle
Incentive Compensation Directly Tied to Profitability
|
 Alleghany
22
Corporate Governance and Risk Management
Insurance Operations
Alleghany senior management team sits on operating company boards
Risk assessment and management coordinated at holding company
Catastrophe exposures across entities modeled on a consolidated basis
Quarterly subsidiary board meetings include operational reviews by line of
business Price monitoring performed at operating company level and reviewed
corporately Regular actuarial loss reserve reviews (both internal and
external) Reinsurance
security
committee
reviews
reinsurer
credit
risk
and
sets
tolerances
on
a
consolidated basis
Internal audit function in place at each major subsidiary and holding company
|
 Alleghany
23
Strong Catastrophe Risk Management
Insurance Operations
Catastrophe risk principally managed at TransRe and RSUI levels
Fixed caps established as a percentage of TransRe's and RSUI's respective
surplus Combined catastrophe risk modeled and monitored at parent level
Modeled combined catastrophe losses are managed to as a percentage of
consolidated equity Regularly reviewed with Alleghany board
1-in-250 Year PML / Equity
1-in-100 Year PML / Equity
PML/Equity
16
12
8
4
0
7
7
11
10
6
10
5
8
Florida -
Wind
California -
Earthquake
Northeast U.S. -
Wind
Gulf Coast -
Wind |
 Alleghany
24
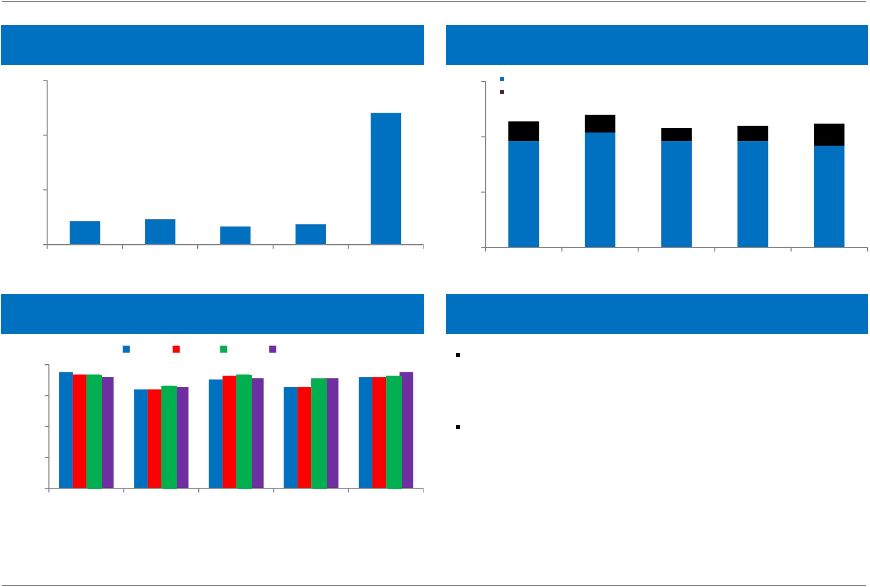
Historical Underwriting Results
Insurance Operations
Year
Amount
(1)
2002
(20)
2003
67
2004
74
2005
(115)
2006
259
2007
297
2008
143
2009
129
2010
131
2011
50
2012
220
2013 YTD
(2)
322
Total
$1,557
(1)
Includes Darwin Professional Underwriters, Inc.’s underwriting results from
2003 through 2008 (2)
YTD through September 30, 2013
($ in millions)
Annual average underwriting
profit of $137 million
Significant negative “cost of
float”
over time |
 Alleghany
25
Key Takeaways
Insurance Operations
+ Operating company management is empowered
•
Set operating strategy
•
Run its business
+ Alleghany management provides assistance when needed but focuses on
capital allocation and investment management
+ Risk management is everyone’s job
•
Operating companies focus on their enterprises
•
Alleghany focuses on aggregations across the entities
+ Compensation aligns management and owners
= Builds franchise value and creates outperformance over long-term
|
 Alleghany
26
Questions?
Insurance Operations |
 Michael Sapnar
TransRe
22 November 2013
Alleghany
27 |
 Alleghany
28
A Leading Reinsurance Franchise
CULTURE
Stable
Focused
Resilient
Profitable
DIVERSITY
Products
Territories
Distribution
Clients
People
LEADERSHIP
Treaties
Industry Issues
Longevity
Information
FLEXIBILITY
Balance Sheet
Infrastructure
Business Model
Capital Management
INITIATIVES
Fairco/Calpe/Capitol
Managed Capital
TReIMCo
Public to Private
TransRe |
 Alleghany
29
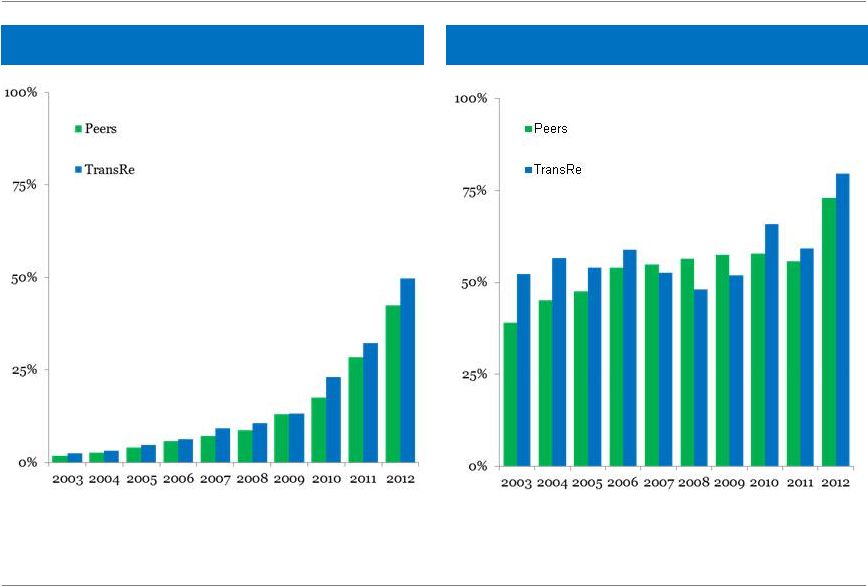
Leadership Provides a Tangible Advantage
Years
(1)
2012 Assumed Premiums, excluding AIG
(2)
Estimated current underwriting year treaty premium
57%
60%
54%
55%
56%
163 underwriters worldwide
–
107 at officer level
–
Average tenure of 11.4 years
Experience drives advantages
–
Calibrates in-house economic capital & pricing models
–
Reduces reliance on generic industry data
–
Increases
ability
to
construct
bespoke
deals
–
10%
of
premium from private placement
Led
Co-led
TransRe
% Signed vs. Authorized by Class
Leadership Profile
11%
12%
8%
9%
60%
0%
25%
50%
75%
<5
6
-
10
11 -
15
16 -
20
>20
48%
52%
48%
48%
46%
9%
8%
6%
7%
10%
0%
25%
50%
75%
2008
2009
2010
2011
2012
0%
25%
50%
75%
100%
Guaranty
Marine &
Aviation
Catastrophe
Specialty
Casualty
Traditional
Casualty
2010
2011
2012
2013
(1)
%
of
Premium
by
Length
of
Relationship
%
of
Premium
Led
and
Co-Led
(2)
|
 Alleghany
30
Leadership from a Stable and Experienced Senior Team
Management Team
Michael Sapnar
President & CEO
18 YEARS OF SERVICE
TransRe
Ken Brandt
North America
7 YEARS OF SERVICE
Javier Vijil
Latin America &
Caribbean
20 YEARS OF SERVICE
Paul Bonny
Europe & Asia Pacific
31 YEARS OF SERVICE
Beth Levene
Claims
15 YEARS OF SERVICE
Ken Apfel
Actuarial
9 YEARS OF SERVICE
Julian Spence
Risk
12 YEARS OF SERVICE
Steve Skalicky
Finance
18 YEARS OF SERVICE
Gary Schwartz
Legal
23 YEARS OF SERVICE
Donna Byron
HR
10 YEARS OF SERVICE
George DiMartino
IT
18 YEARS OF SERVICE
Bob Baldrey
Global Property Cat
32 YEARS OF SERVICE
Tom Cholnoky
Strategy &
Communications
4 YEARS OF SERVICE |
 Alleghany
31
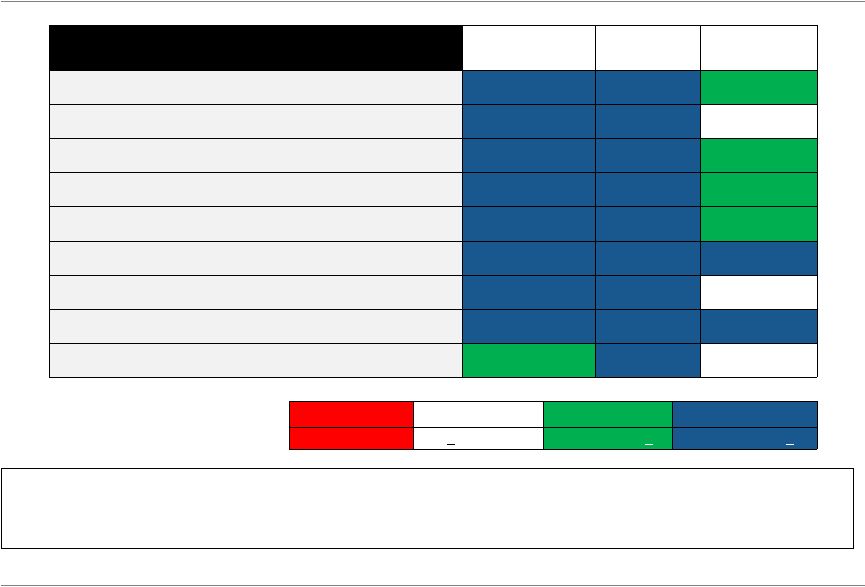
Leadership Builds Strong Customer Relationships
Factor
North
America
Latin
America
Europe
Strong Underwriting Capabilities
7.89
7.82
6.96
Financial Value
7.78
7.93
6.85
Financial Security
8.05
8.04
7.02
Strong Client Orientation
7.79
7.52
6.70
Valuable Expertise & Market Knowledge
7.75
8.07
6.92
Timely Service
7.87
7.68
7.08
Helps Your Company Improve Profitability
7.27
7.14
Not Rated
Strong Claims Handling Ability
7.74
7.81
7.00
Reasonable Approach to Contracts
7.48
7.64
Not Rated
Note: Reproduced with the permission of Flaspöhler Research Group, Inc.
Problematic
Average
Good
Excellent
< 6
>6
and
<
7
Top
Quartile
or
>7
Top
Quartile
and
>
7
TransRe
Our ability to execute on our strategic objectives relies upon the strength of our customer
relationships. The independent Flaspöhler Research Group, Inc.’s annual satisfaction
surveys in North America, Latin America and Europe measures how reinsurers are perceived
|
 Alleghany
32
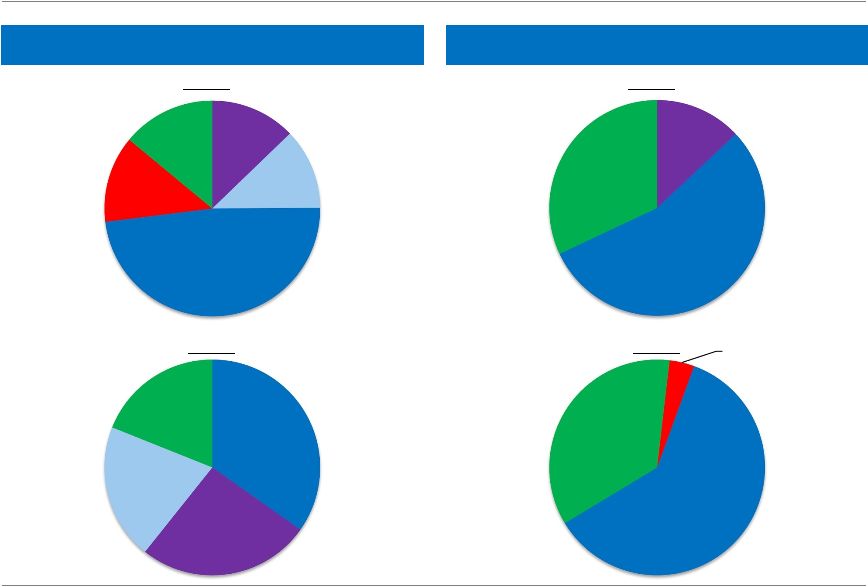
Diversity of Reach, Capability and Perspective
Note: Based on YTD September 2013 Net Written Premiums of $2.5 billion
Product Mix
Geographic Mix
TransRe
E&O / D&O
19%
All Other
Property
18%
Property
Catastrophe
12%
General
Liability
11%
Auto / Motor
8%
A&H
7%
Guaranty
6%
Marine &
Energy
6%
Medical
Malpractice
5%
Engineering
3%
Other
Casualty
3%
Aviation
2%
United
States
53%
London
20%
Zurich
8%
Latin 3%
American
Division
6%
Munich
Hong
Kong
3%
Toronto
2%
Tokyo
2%
Paris
2%
Sydney
1% |
 Alleghany
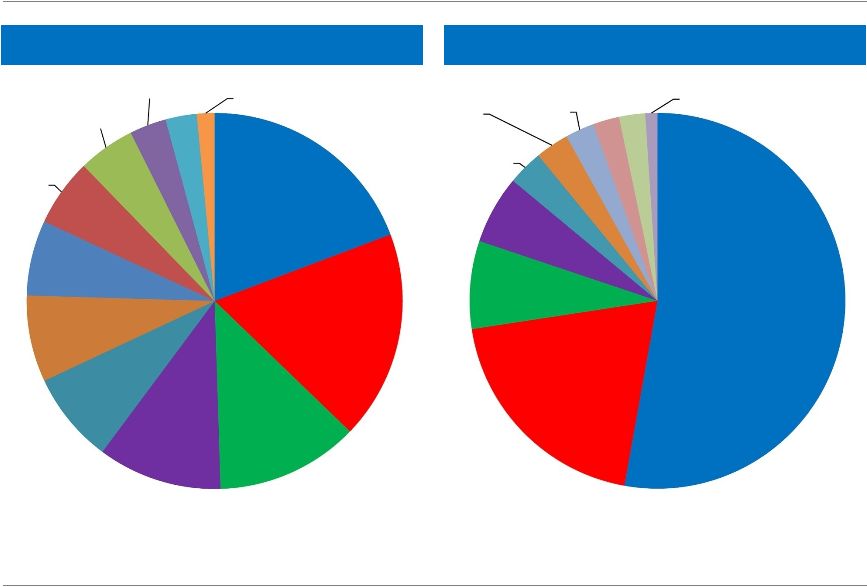
33
Diversity of Source
2002
2012
Distribution
Customer Mix
2002
2012
TransRe
Other Direct
14%
AON
13%
AIG
13%
Other
Broker
48%
Guy Carp
12%
Guy Carp
20%
Other Direct
19%
Other
Broker
35%
AON
26%
All Others
32%
AIG
13%
Next 49
55%
All Others
35%
Next 49
61%
Largest
Client
4% |
 Alleghany
34
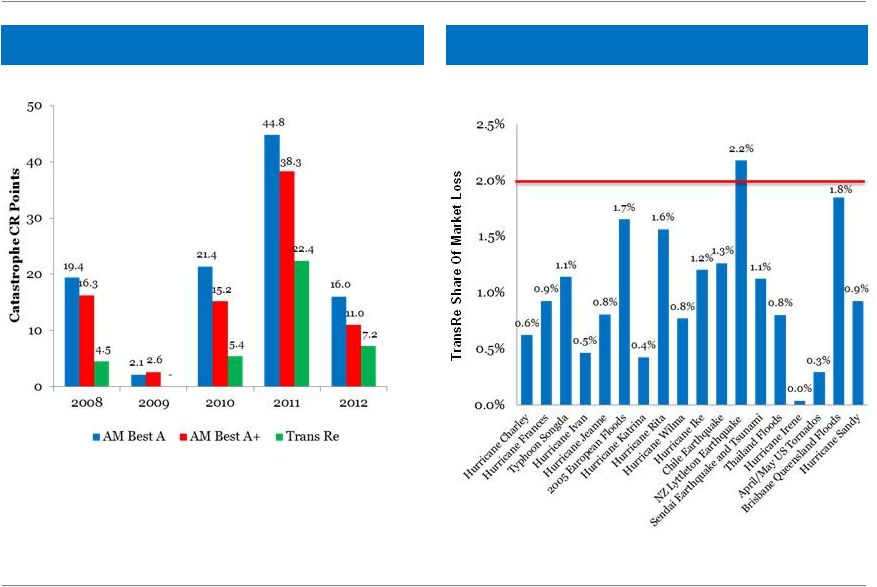
Diversity of Portfolio Minimizes Underwriting Volatility
Historical Market Share
Peer Group Cat Loss Points
Market Share > Loss Share
TransRe |
 Alleghany
35
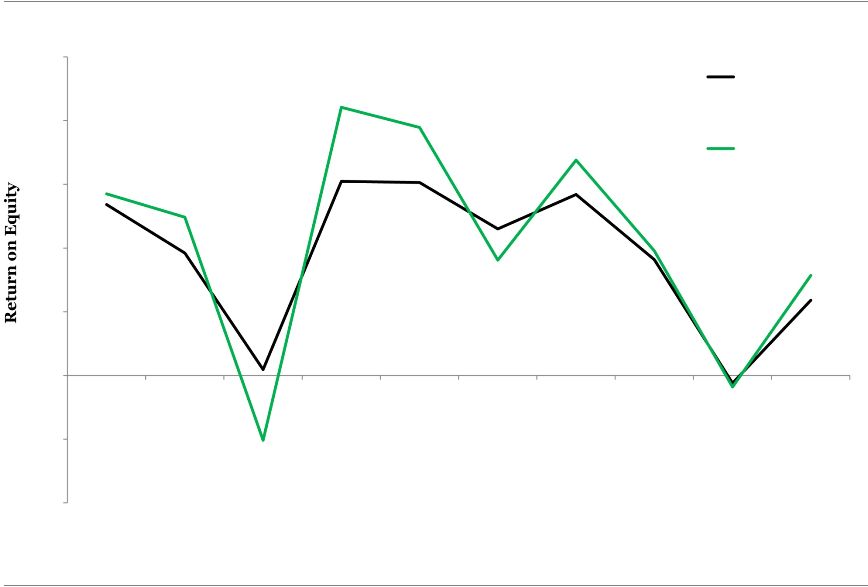
Diversity Delivers Quality Earnings
(1)
TransRe
Adjusted
ROE
to
exclude
merger
related
expenses
and
break-up
fee
in
2011
and
2012
(2)
Peer
Group
–
ACE,
ACGL
AXS,
RE,
PRE,
AWH,
Alterra,
AHL,
ENH,
PTP
and
XL
TransRe
-10%
-5%
0%
5%
10%
15%
20%
25%
2003
2004
2005
2006
2007
2008
2009
2010
2011
2012
TransRe
Peer Group |
 Alleghany
36
Flexibility from Financial Strength
Profitable book
Improved combined ratio
New Opportunities –
products/lines/territories/business relationships
Prudent casualty reserving philosophies
Efficient business model
$4.7 billion of new and renewed business since
3/6/12
$757 million business cancelled (AIG, auto,
Medex)
$685 million new business (mortgage guaranty,
property cat, property pro rata)
Note: All 2012 figures are for full 12 months
(1) YTD through September 30, 2013
($ in millions)
FY2012
YTD 2013
(1)
Gross premiums written
$3,617
$2,643
Net premiums written
$3,491
$2,499
Net premiums earned
$3,585
$2,481
Net losses and loss expenses
(2,561)
(1,473)
Acquisition costs
(599)
(614)
General & administrative expenses
(201)
(146)
Underwriting income
$223
$248
Consolidated GAAP Ratios
Loss and loss expense ratio
71.5%
59.4%
Acquisition cost ratio
16.7%
24.7%
General & administrative expense ratio
5.6%
5.9%
Combined ratio
93.8%
90.0%
Cash & Invested Assets
$14.5 billion
$14.4 billion
GAAP Equity
$4.3 billion
$4.4 billion
TransRe
Highlights
Summary Financials |
 Alleghany
37
Flexibility from Strength of Reserve Profile
Source: Annual Statements, Schedule P
Note: Medmal (claims made) other liabilities (losses occurring and claims made) and
Reinsurance B; Peers includes ACGL, AXS, ENH, PRE, XL, AWH, ENH and Odyssey Re Holdings;
Excludes 2008 AY for RE
TransRe
IBNR as % of Earned Premium
IBNR as % of AY Incurred Losses |
 Flexibility from Strength of Reserve Profile (cont.)
As % Of Original Reserves Favorable/(Unfavorable)
(In millions)
By Accident Year –
As of 12/31/2012
TransRe
As of 9/30/2013
Total: $9.34 billion
Alleghany
38
2003-2011 AY Development
(1)
Reserve Development (AY)
Reserve Breakdown
Source: Company 10-K disclosure
(1) Peer Group: ACE, AWH, Alterra, ACGL, AHL, AXS, ENH, RE, PRE, PTP, and XL |
 Alleghany
39
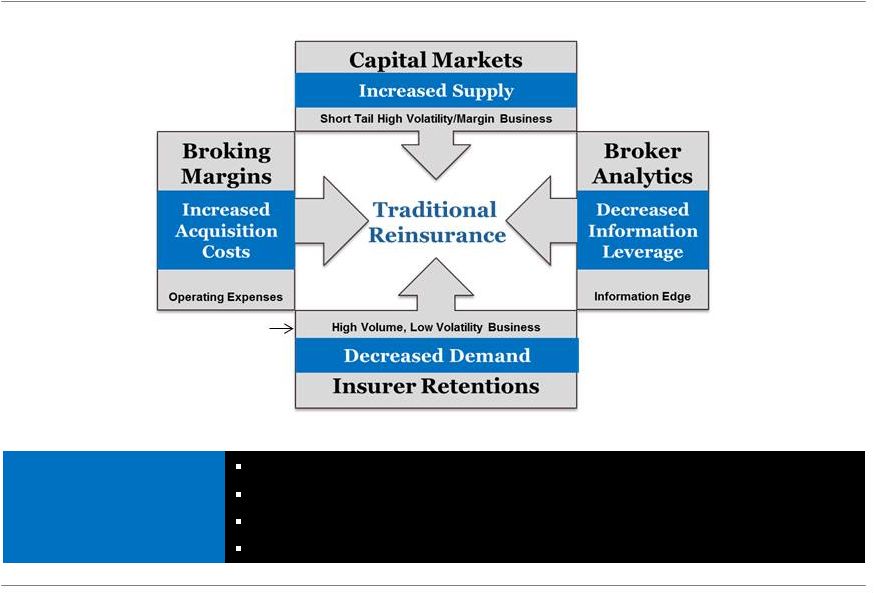
A Dynamic Competitive Environment
Hedge Fund Reinsurers
Implications
Growth will continue to be challenging
See it all, sign what you want
New initiatives are paramount
Patience and preparedness will be rewarded
TransRe |
 Alleghany
40
Engage
Focus on
Efficiency
Focus on
Insights
Penetrate/
Alternate
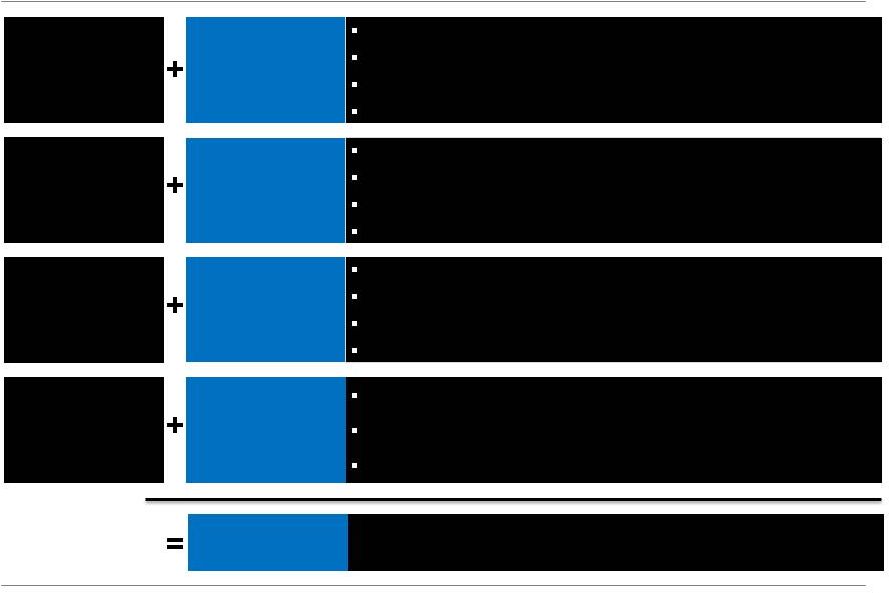
Initiatives to Address the Challenges
Increased
Supply
Increased
Acquisition
Costs
Decreased
Information
Leverage
Decreased
Demand
Data analytics
Additional
value
propositions
(Underwriting
&
Claims
Audits
–
benchmarking)
Local network
Global Customer Program (larger lines, non-concurrent, private, direct)
Global Product Teams (property, aviation, marine)
Select insurance opportunities (Calpe/Fairco/TreIMCo)
Mortgage indemnity, terrorism
Pillar
Pangaea
Retro
TransRe Capital Partners
Profitable
Growth
Without changing the culture of the company
TransRe
Hub & Spoke branch network (Europe & Asia)
Infrastructure supports contraction or expansion
Leverage of labor, invested assets to equity and balance sheet
Intra-Y synergies (Capitol re-organization, modeling expenses)
|
 Alleghany
41
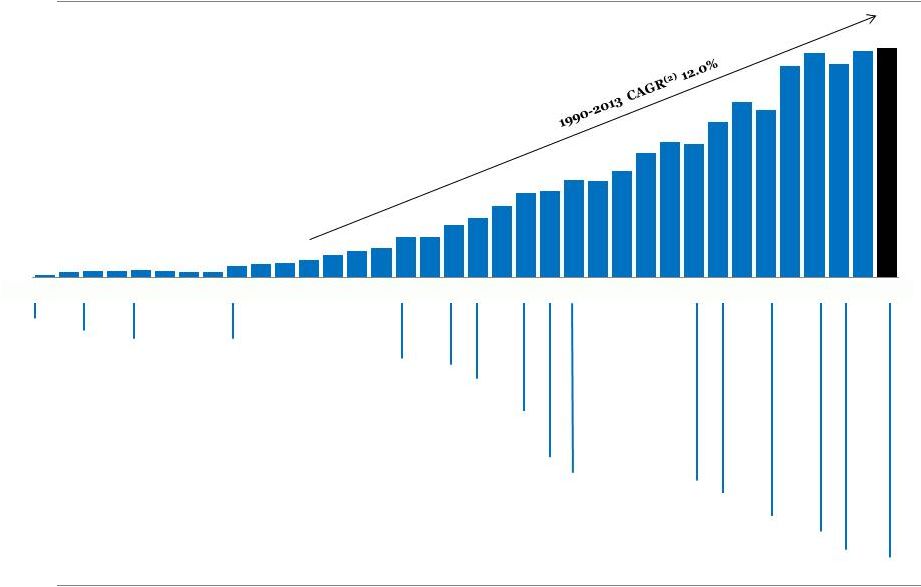
Culture of Profitable Growth
$4B
3
2
1
0
New
York
Toronto
London
Tokyo
Hong Kong
Miami
Paris
Zurich
Buenos Aires
Shanghai
Rio de Janeiro
Johannesburg
Warsaw
Sydney
Panama
Stockholm
Munich
Hamilton
Gibraltar
San Francisco
Singapore
Equity/Surplus
(1)
Global City Network
(1) Statutory
surplus
from
1978-1989,
stockholders’
equity
from
1990
onwards
(2) CAGR includes cumulative dividends and share repurchases from March 31,
1990 to September 30, 2013 TransRe
Alleghany
41
78
79
80
81
82
83
84
85
86
87
88
89
90
91
92
93
94
95
96
97
98
99
00
01
02
03
04
05
06
07
08
09
10
11
12
9M13 |
 Alleghany
42
Culture of Experience
January 1 Themes
Capacity is abundant
Retentions are up
Peak price pressure in peak cat zones
Clients are increasingly attentive to who they trade with
Underlying casualty prices continue to improve
‘Unexpectedly’
large losses continue to occur (German hail, Costa
Concordia, SK Hynix, Quebec train, Alberta floods)
TransRe |
 Alleghany
43
Truly a Franchise
CULTURE
DIVERSITY
LEADERSHIP
FLEXIBILITY
INITIATIVES
TransRe |
 Alleghany
44
Questions?
TransRe |
 Dave
Leonard RSUI
22 November 2013
Alleghany
45 |
 Alleghany
46
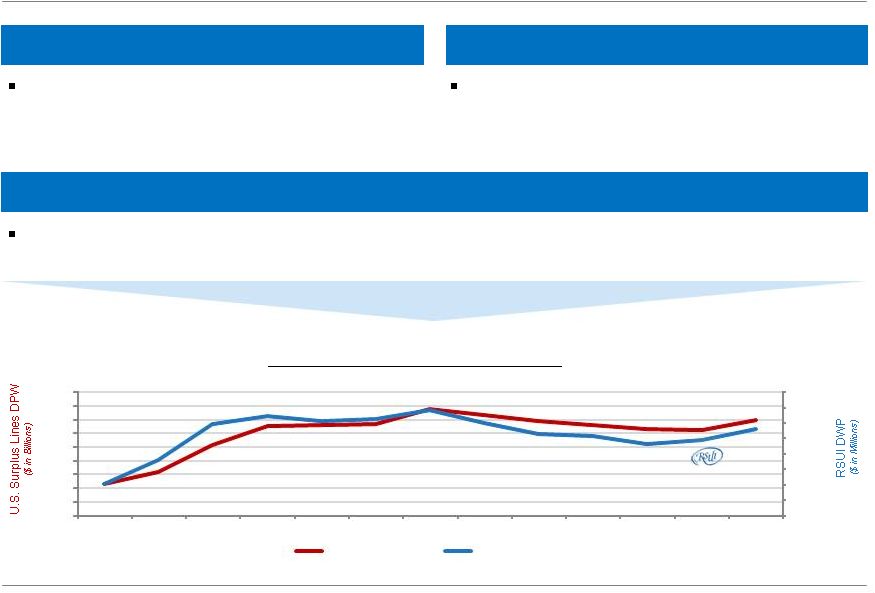
A Leading Specialty Insurer
Specialty Insurance
Focus on specialty lines of business where
underwriting expertise and experience are the
primary differentiators
Disciplined Underwriting
RSUI has demonstrated the ability to grow aggressively when market conditions are
favorable and the willingness to write less business when conditions are not
supportive of underwriting profit Marketing through a focused distribution
channel is efficient and cost effective
Comparison of Direct Written Premium
RSUI
Wholesale Only
Source:
AM
Best
Special
Report,
U.S.
Surplus
Lines
–
Segment
Review,
Thriving
Through
Turmoil,
September
2013
$-
$200
$400
$600
$800
$1,000
$1,200
$1,400
$1,600
$-
$5
$10
$15
$20
$25
$30
$35
$40
$45
2000
2001
2002
2003
2004
2005
2006
2007
2008
2009
2010
2011
2012
Total Surplus Lines
RSUI Group, Inc. |
 Alleghany
47
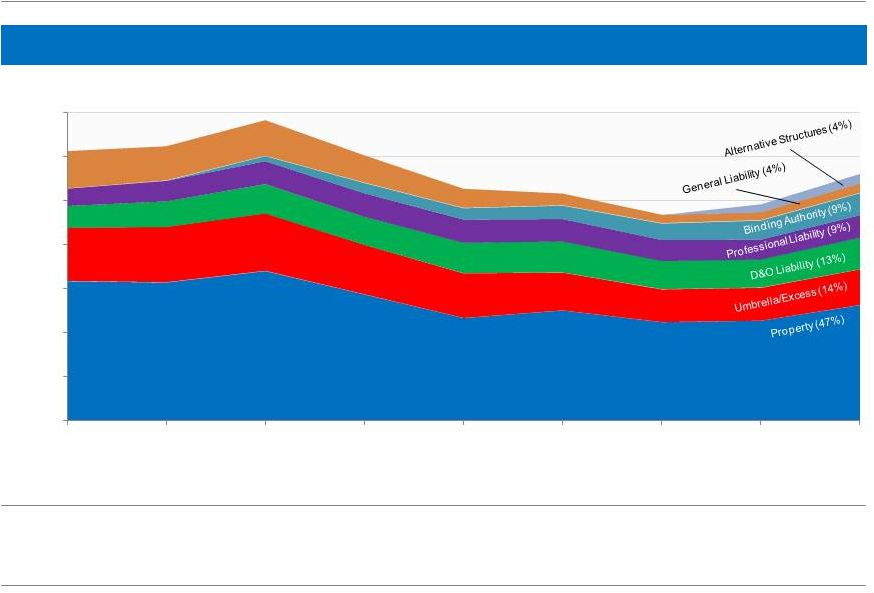
A Diversified Specialty Product Mix
RSUI
GWP Trend
Demonstrated track record of portfolio management based upon
pricing, loss experience and economic conditions
$-
$200
$400
$600
$800
$1,000
$1,200
$1,400
FY 2004
FY 2005
FY 2006
FY 2007
FY 2008
FY2009
FY 2010
FY2011
FY2012 |
 Alleghany
48
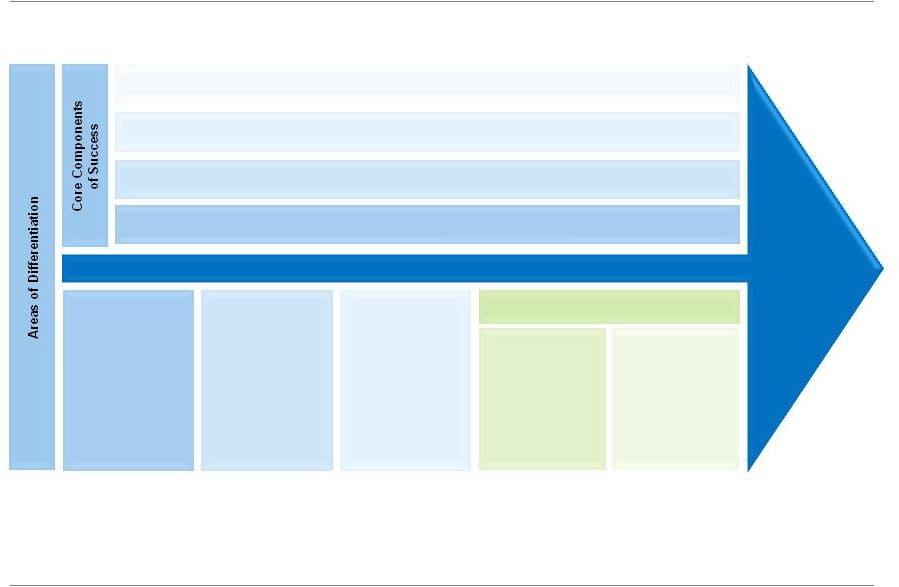
THE RSUI VALUE CHAIN
Overview of the RSUI Value Chain
Severity
Focused
Risk Appetite
Cycle
Management
Property
Catastrophe
Exposure
Management
Employee Expertise and Experience
“Most important thing we do is hire people”
Service
“Respond with speed; positive interactions and relationships”
Management and Infrastructure
“Contrarian and reactive approach to market changes”
Information Technology
“Productive employees, effective communication, and reliable
reporting” Core Measurements of Success
Wholesale
Distribution
Reinsurance
Usage
Risk Mitigation Strategies
Underwriting
Profits
What Makes RSUI Special
RSUI |
 Alleghany
49
Stable, Experienced Senior Team
Dave Leonard
Chairman and CEO
13 YEARS OF SERVICE
RSUI
Management Team
Greg Buonocore
President
14 YEARS OF SERVICE
Phillip McCrorie
Executive Vice President
10 YEARS OF SERVICE
Bill Kautter
SVP
Claims
11 YEARS OF SERVICE
David Norris
SVP
Property
18 YEARS OF SERVICE
Nancy Davis
SVP
Professional Liability
14 YEARS OF SERVICE
Clint Nokes
SVP
Binding Authority
5 YEARS OF SERVICE
Lee Sjostrom
SVP
Chief Financial Officer
9 YEARS OF SERVICE
Kathy Aberson
SVP
Administration
11 YEARS OF SERVICE
Phil Coletti
SVP
Casualty
24 YEARS OF SERVICE
Michelle Eason
SVP
D&O
23 YEARS OF SERVICE
Kelly Walls
SVP
Information Technology
22 YEARS OF SERVICE
Average Industry Experience (years)
Binding
Authority
D&O
Liability
General
Liability
Professional
Liability
Property
Umbrella/
Excess
Underwriting
15
15
25
19
23
27
Claims
27
14
26
17
27
32 |
 Alleghany
50
Property
RSUI
There is widespread discussion about an over-capitalized market, the
impact
that
alternative
markets
are
having
on
reinsurance
costs,
and
the effect of RMS v13.0
Property Market Conditions and Outlook
Renewal
Rate Change
YTD 3Q 2013
$452.8m
5.8%
1.4%
5,133
8.9%
34,540
2.7%
2012
$527.8m
15.5%
5.2%
6,065
10.7%
44,543
15.3%
Premium
Policy Count
New Submissions
Property Coverage
Ground up, primary and excess commercial property business with
$100 million in risk capacity (4 walls)
Preference for business that can be “underwritten from the desk”
like
institutional, public entity, real estate, habitational, hospitality, and
natural catastrophe risks |
 Alleghany
51
Umbrella / Excess
RSUI
Underwriters are seeing opportunities at attachment points and rate
levels they are comfortable with
Umbrella / Excess Market Conditions and Outlook
Renewal
Rate Change
YTD 3Q 2013
$134.5m
16.3%
7.4%
4,781
10.7%
24,277
6.9%
2012
$160.7m
8.1%
4.1%
5,884
1.6%
30,179
6.1%
Premium
Policy Count
New Submissions
Specialty book with up to $30 million in limits per risk Common markets are contractors, manufacturers, wholesalers,
distributors and certain public entities
Umbrella / Excess Coverage |
 Alleghany
52
D&O
Liability
Coverage
D&O Liability
RSUI
Renewal retention continues to be very strong and is ahead of the
prior year for all sectors of the business. Similarly, we have seen
renewal rate increases in all sectors, especially in the private
company market
D&O Liability Market Conditions and Outlook
Renewal
Rate Change
YTD 3Q 2013
$119.5m
17.8%
5.5%
4,517
12.3%
15,713
19.3%
2012
$145.6m
11.5%
4.6%
5,473
9.8%
18,042
31.2%
Premium
Policy Count
New Submissions
Both primary and excess risks with capacity up to $20 million
The risks include public, non-profit, and private organizations.
Policies typically include Employment Practices Liability
|
 Alleghany
53
Professional Liability
RSUI
Premium growth has come from “micro hard markets”
in Lawyers, Real
Estate Agents, and CyberTech
Both primary and excess risks with capacity up to $10 million
Risks are predominantly written claims made
Common classes include Miscellaneous Medical, Miscellaneous,
Architects and Engineers, Lawyers, Insurance Agents and Brokers,
Real
Estate Agent and Brokers, Environmental, CyberTech, Physicians,
Surgeons & Dentists, and Media
Professional Liability Coverage
Renewal
Rate Change
YTD 3Q 2013
$91.8m
16.8%
3.9%
6,403
15.1%
30,454
7.7%
2012
$103.1m
12.7%
3.4%
7,312
11.9%
36,948
19.9%
Premium
Policy Count
New Submissions
Professional Liability Market Conditions and Outlook |
 Alleghany
54
Binding Authority
RSUI
Business opportunities are flowing to Binding Authority as many carriers
reevaluate their books of business, or face difficult financial challenges
RSUI strives to be the company that the market looks to as a consistent
leader in both service and technology
Binding Authority Market Conditions and Outlook
Renewal Rate
Change -
GL
Renewal Rate
Change -
Property
YTD 3Q 2013
$98.1m
32.1%
1.3%
4.6%
44,231
28.9%
2012
$99.3m
13.8%
0.6%
4.0%
45,795
9.7%
Premium
Policy Count
Binding Authority Coverage
Combined Property and Casualty contracts underwritten through 28
appointed Managing General Agents with limited statements of
authority for core Specialty Insurance classes
Premium mix 47% property, 53% casualty |
 Alleghany
55
General Liability
RSUI
Maintain discipline and look for opportunities that are supportive of
underwriting profit
General Liability Market Conditions and Outlook
Renewal
Rate Change
YTD 3Q 2013
$27.6m
0.7%
3.9%
959
3.1%
14,939
2.4%
2012
$42.8m
13.6%
0.4%
1,347
8.5%
19,355
2.9%
Premium
Policy Count
New Submissions
General Liability Coverage
Mainly low frequency/high severity primary risks with limits of
up to $2 million
Common markets are specialty contractors, manufacturers,
wholesalers, and distributors |
 Alleghany
56
Alternative Structures
RSUI
Assumed
Reinsurance
Solar Panel
Warranty
Crop
Reinsurance
Other
Total
YTD 3Q 2013
$26.3m
$5.5m
$2.9m
$2.5m
$37.2m
2012
$34.9m
$6.8m
$1.5m
$0.0m
$43.2m
Alternative Structures Market Conditions and Outlook
Alternative Structures Coverage
Unusual insurance risks that require specialized analysis and
underwriting. Available to our producers to consider risks that
are truly unique
Also includes Assumed Property Reinsurance and Property
Retrocession |
 Alleghany
57
Challenges and Opportunities
RSUI
Challenges
Opportunities
Imitators, newly aggressive competitors or
start-up operations entering the E&S space
Pricing sustainability (especially in Property)
More frequent and more severe weather
related catastrophic loss activity
Maintaining close distribution relationships
as major consolidations occur
RSUI is recognized as the premier Specialty
Insurance franchise with underwriting staff
that has expertise and authority to quickly
react to opportunities
Weakness and disruption in competitors
provide opportunities across our product
lines
Umbrella/Excess, D&O, and Professional
Liability are experiencing growth
opportunities within sub-segments of their
operations |
 Alleghany
58
Financial Snapshot
$1.2 billion net underwriting income
since 2003
Combined ratio of 81.9%
since 2003
Since becoming a subsidiary of
Alleghany in 2003, Stockholder’s equity
has grown at a compound annual growth
rate of 11.53%
RSUI has produced an underwriting
profit in 9 out of the last 10 years
RSUI
Highlights
Summary Financials
($ in millions)
FY
2011
FY
2012
YTD
Q3 2013
Gross premiums written
$986
$1,123
$962
Net premiums written
$628
$715
$631
Net premiums earned
$594
$656
$560
Net losses and loss expenses
(315)
(466)
(302)
Acquisition costs
(75)
(86)
(76)
General & administrative expenses
(96)
(99)
(79)
Underwriting income
$108
$5
$103
GAAP Ratios
Loss and loss expense ratio
53.1%
71.1%
53.9%
Acquisition cost ratio
12.7%
13.1%
13.6%
General & administrative expense ratio
16.1%
15.0%
14.1%
Combined ratio
81.9%
99.2%
81.6% |
 Alleghany
59
Key Takeaways
RSUI
Leverage our 25 year track record as leading specialty insurer
Produce underwriting profits
Maintain our highly employee-centric culture
Remain singularly dedicated to the wholesale distribution channel
Continue to embed Risk Management within each line of
business/operation |
 Alleghany
60
Questions?
RSUI |
 Stephen Sills
Capitol
22 November 2013
Alleghany
61 |
 Alleghany
62
Capitol Companies
Capitol
Committed to becoming the
preeminent specialty insurance
company for small and mid-sized
businesses
Product
Distribution
Technology |
 Alleghany
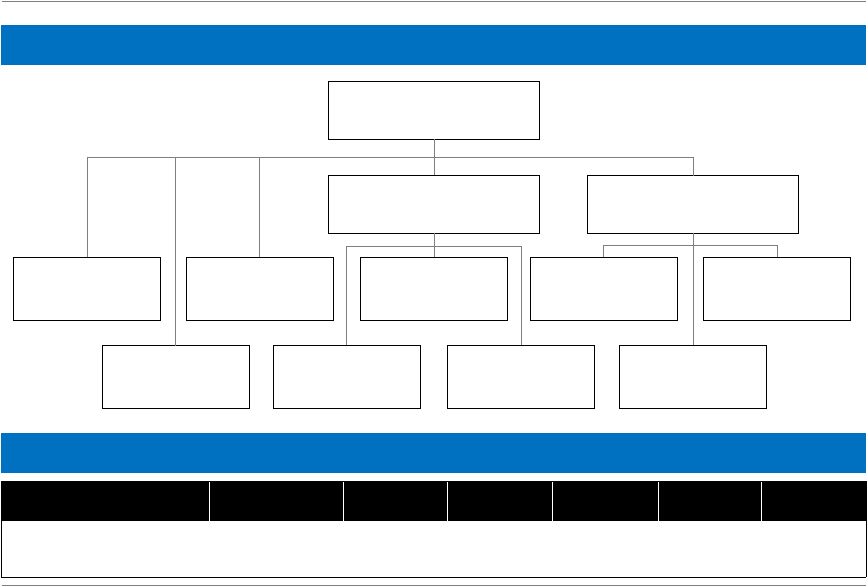
63
Capitol and PRMS Today
P&C includes admitted and surplus lines business
Surety includes commercial and contract bonds
Professional lines includes miscellaneous professional liability,
healthcare professional, medical malpractice, and environmental
professional
Distribute through general and independent agents
Capitol |
 Alleghany
64
Management Team
Stephen Sills
Chairman and CEO
36 YEARS OF EXPERIENCE
Management Team
Dan McGinnis
President
Professional Liability Division
19 YEARS OF EXPERIENCE
Rich Allen
President
Surety & Fidelity Operations
28 YEARS OF EXPERIENCE
Larry Seymour
Vice President
Actuarial & Chief Actuary
20 YEARS OF EXPERIENCE
Alan Ogilvie
Chief Operating Officer
22 YEARS OF EXPERIENCE
Troy Lethem
Vice President
Information Services & CIO
22 YEARS OF EXPERIENCE
John DiBiasi
Vice President
Distribution
36 YEARS OF EXPERIENCE
Paula Pearce
President
Director of Marketing
16 YEARS OF EXPERIENCE
John Rzepinski
Vice President
CFO & Treasurer
30 YEARS OF EXPERIENCE
Capitol |
 Alleghany
65
Product and Geographic Mix
Product Mix
Geographic Mix
Note: YTD September 30, 2013
Capitol
Casualty
37%
Commercial
Surety
25%
Property
17%
BOP
7%
Contract
Surety
5%
Misc. Prof.
Lines
5%
Workers’
Comp.
3%
Comm. Auto
1%
A&H
0.3%
Midwest
31%
Southwest
26%
Southeast
19%
13%
Northwest
7%
Northeast
4%
Mid-Atlantic |
 Alleghany
66
Industry Mix
Industry
Note: YTD September 30, 2013
Capitol
Commercial Surety
25%
Contract Surety
5%
Misc. Prof. Lines
5%
Bars / Taverns
(P&C)
8%
Habit. Dwellings
(P&C)
8%
Restaurants (P&C)
7%
Bus. Services (P&C)
6%
Retail (P&C)
5%
Child Care (P&C)
5%
Construction (P&C)
4%
Amusement (P&C)
3%
Barber / Beauty
(P&C)
3%
Hotel / Motel (P&C)
3%
Detective/Security
(P&C)
All Other (P&C)
12%
1% |
 Alleghany
67
Opportunity to Drive Growth with a Compelling Offering in the Large and
Fragmented SME Market
The SME market is highly fragmented
Few large insurers have focused on the SME
market in the past
Larger insurers are starting to pursue SME
with a micro-targeting strategy, but are moving
slowly
Small insurers lack product breadth,
distribution breadth, and resources to take
more market share
A compelling offering would allow Capitol to
gain profitable share quickly and become a
market leader in its selected markets
(1) Conning Research Report 2011
($ in Billions)
SME Market Share
(1)
Capitol
$0
$10
$20
$30
$40
$50
$60
$70
$80
2011 Market Share
AIG (3%)
Hartford (4%)
State Farm (4%)
Travelers (4%)
Other Small
Insurers (38%)
(Capitol ~0.13%)
Other Medium
Insurers (23%)
Other Large
Insurers (23%)
Nationwide (4%)
$
78 Billion |
 Alleghany
68
Competitive Landscape of Business Model Options
Key competitors are evolving toward a buyer-centric approach and some are
preparing to venture into the direct space
Small
Business
Buyers
Medium Sized
Business
Buyers
Large
Business
Buyers
Product Focus Business
Model
Buyer-Centric Business
Model
Direct to Buyer Business
Model
Limited products to serve
the spectrum of buyer
Lack of focus on targeted
buyers (Product first, buyer
second)
Manual underwriting
Limited Package offerings
Industry-targeted appetite
with full product suite
Automated
Packaged products
Industry-focused marketing
materials
Package and sell commercial
& consumer products
Marketing is targeted to buyers
Direct-to-buyer web portal and
sales channel
Policy and customer service
centers work directly with
buyers
Capitol |
 Alleghany
69
Challenges and Opportunities
Opportunities
Significant underwriting involvement is
required
Product set is not tailored to any segments
of the SME market
“We will entertain anything”
approach
precludes any differentiation and is time
consuming and resource intensive
Lack of automation
We will be more important to our distribution
partners as we identify the buyers that we
want to target
Select segments where we bring expertise
and can leverage cross-division products
into one-stop shop solutions
Continuously assess, prioritize, and launch
new targeted segments and distribution
partners
Build a unified small business system
Challenges
Capitol |
 Alleghany
70
Where We Want to Go
70
Capitol
P&C
Surety
Professional Lines
FY2012
YTD2013
FY2014
FY2015
FY2016 |
 Alleghany
71
Financial Snapshot
(1) YTD through September 30, 2013
Highlights
Summary Financials
Modest underwriting losses in each year
presented
Loss ratio overshadowed by high
expense ratio
Surety business continues to perform
well
Prior year results negatively impacted by
Axiom
Capitol
($ in millions)
FY
2011
FY
2012
YTD
2013
(1)
Gross premiums written
$150
$158
$135
Net premiums written
$142
$149
$126
Net premiums earned
$149
$145
$114
Net losses and loss expenses
(83)
(86)
(57)
Acquisition costs
(36)
(40)
(27)
General & administrative expenses
(36)
(40)
(33)
Underwriting income (loss)
($7)
($21)
($4)
GAAP Ratios
Loss and loss expense ratio
55.7%
59.4%
50.0%
Acquisition cost ratio
24.3%
27.4%
24.0%
General & administrative expense ratio
24.4%
27.4%
29.3%
Combined ratio
104.4%
114.2%
103.2% |
 Alleghany
72
Questions?
Capitol |
 Roger Gorham –
Fixed Income
Jack Liebau –
Public Equity
David
Van
Geyzel
and
Udi
Toledano
–
Private
Capital
Investments
22 November 2013
Alleghany
73 |
 74
Jack Liebau
President & CEO
Jack Liebau
President & CEO
Alleghany Investments
Team includes 6 investment
professionals
Weston Hicks
Alleghany Corporation, President & CEO
Roger Gorham
SVP, Head of Fixed Income,
and Treasurer
Roger Gorham
SVP, Head of Fixed Income,
and Treasurer
David Van
Geyzel
President & CEO
David Van
Geyzel
President & CEO
An integrated investment platform that balances fixed income exposure with public
and private capital Udi
Toledano
Chairman
Udi
Toledano
Chairman
Investments
Team includes 2 Vice Presidents
Support from Alleghany legal,
accounting, and tax groups
Fixed
Income
Alleghany Capital Partners
Public Equity
Alleghany Capital Corporation
Private Capital
Alleghany |
 Alleghany
75
Property
&
Casualty
Insurance
Cycle
–
>
Drives
operational
cash
flow
Catastrophe
Losses
–
>
Drive
near
term
cash
flow
demands
Long-Term
Casualty
Loss
Reserves
–
>
Subject
to
loss
cost
inflation
risk
Mandatory
Fixed
Income
Holdings
–
>
Subject
to
inflation
risk
Manage duration and
credit quality, incorporate
fixed rate and floating rate
securities
Macro Environment and Strategy
Investments
Our
Environment
Our
Strategy
Maintain sufficient liquidity
Own assets and
businesses that do well in
inflationary environments
Alleghany Capital Corporation
Private Capital
Alleghany Capital Partners
Public Equity
Fixed
Income |
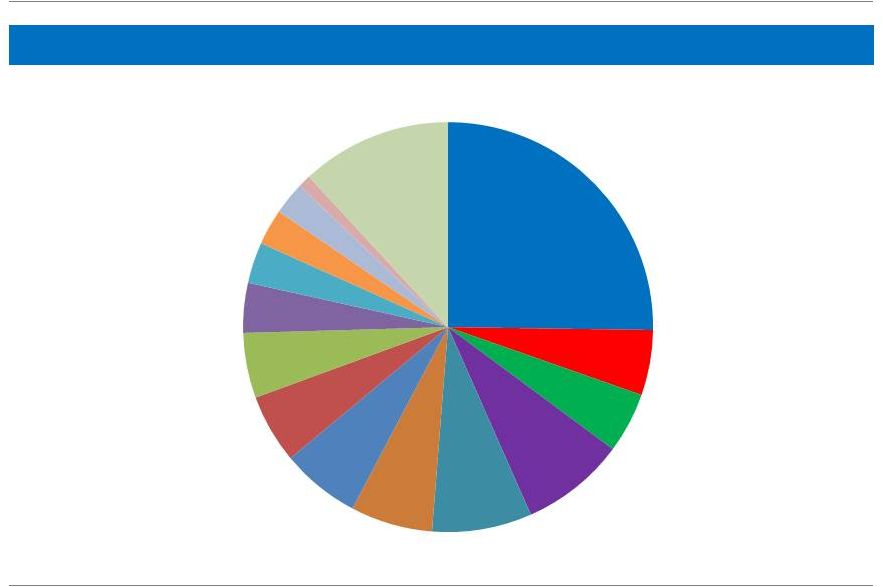
 Portfolio Allocation
Investments
Debt Securities: $15.0 billion
Equity Securities: $2.0 billion
Short-Term Investments: $1.0 billion
Other Invested Assets: $0.8 billion
Cash: $415 million
Total: $19.2 billion
Note: Data as of September 30, 2013
Alleghany
76 |
 Alleghany
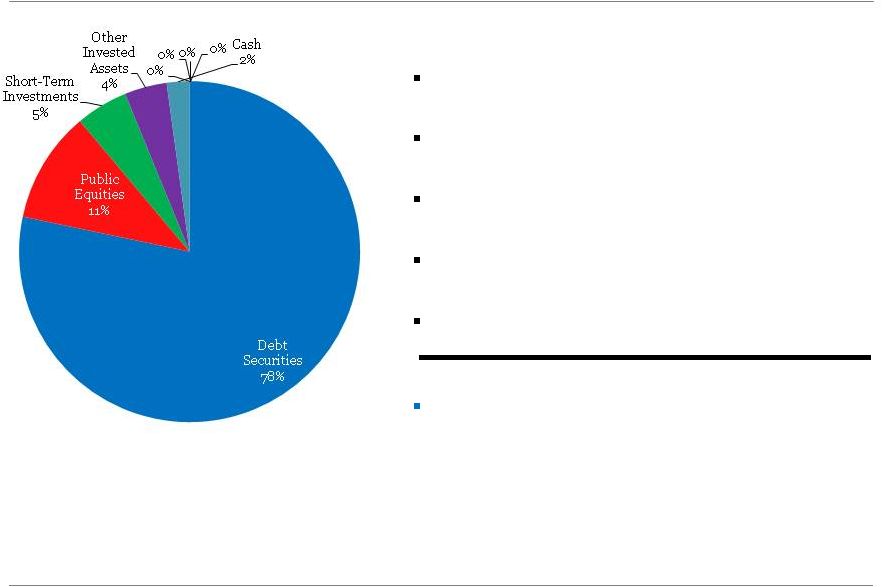
77
Fixed Income: Introduction
Investments
Sector Allocation
Credit Quality ($ in billions)
Duration: 4.3 years
Note: Data as of September 30, 2013
Our goal is to preserve capital and maximize after-tax return
Municipals
37.4%
MBS and
ABS
19.1%
U.S.
Corporate
13.6%
Foreign
Corporate
11.1%
Foreign
Government
6.6%
U.S.
Government
6.3%
Short
5.9%
0.0%
0.0%
Term
$0.1
$1.3
$3.2
$7.8
$2.6
$ -
$4.0
$8.0
Below BBB/Baa
BBB/Baa
A/A
AA/Aa
AAA/Aaa |
 Alleghany
78
Fixed Income: Ares Management, LLC
Investments
July 2013
$250 million direct equity investment
$1 billion total management opportunity
Transaction:
On July 31, 2013, Alleghany acquired a
6.25% stake in Ares Management, LLC for a purchase
price of $250 million and agreed to invest as much as
$1.0 billion in existing and new Ares investment
strategies
Investment Thesis:
Investment in a broad spectrum of
products, including both investment and non-investment
grade securities. Opportunity for Alleghany to access
Ares’
expertise in these products to prudently enhance
Alleghany’s fixed income returns and help Ares expand
into the insurance industry
has acquired a stake in:
Fixed Income Assets and Related Funds
Fixed Income Assets
6%
94%
Investment
grade assets
2%
Below
investment
grade assets
3%
Funds
1%
Ares Managed |
 Alleghany
79
Alleghany Capital Partners (“ACP”): Goal and Strategy
Investments
ACP’s goal is to grow the equity portfolios of Alleghany and its
(re)insurance subsidiaries over the long term, at a rate consistently
above market averages, risk adjusted
ACP believes that intensive fundamental research, concentrated
positions, and long-term holding periods are necessary to produce
consistently superior investment results |
 Alleghany
80
Alleghany Capital Partners: Highlights
Total equity exposure: $2.0 billion
Dividend yield: 2.2%
Team includes 6 investment professionals
Top 5 positions represent more than one third of total equities
Investments
Note: Data as of September 30, 2013 |
 Alleghany
81
Alleghany Capital Corporation (“ACC”): Goal and Strategy
Horizon
Minimum investment
of $50 million, minimum annual
EBITDA of $10 million
Growth Capital
and
Special Situations
Acquisitions,
Recapitalizations, and
Management Buyouts
Control
Investment
Majority
Prefer majority control, but will
consider minority investments
1
2
Minimum investment
of $20 million, includes pre-revenue
companies
Long-term
Flexible
Investments
ACC’s goal is to generate above-market returns over the long-term,
investing primarily in equity securities of private companies
ACC’s strategy is to leverage its competitive advantages of permanent and
scalable capital to generate proprietary deal flow and then partner with a
select group of owner- managers to grow their businesses
|
 Alleghany
82
Company
Highlights
Kentucky Trailer is a leading manufacturer of custom trailers for the moving and
storage industry and other niche markets. Investment closed in August
2013 ACC’s differentiated business model compared with standard
private equity funds was critical to Gary A. Smith, Sr. (CEO) and the Tway
Family Growing business with a dedicated management team, significant
competitive advantages, and meaningful organic and acquisition growth
opportunities Bourn & Koch is a manufacturer of precision machine tools
and provider of related replacement parts and services. Investment
closed in April 2012 ACC’s long-term investment horizon and
willingness to put limited leverage on the company were critical to the
partnership with Tim Helle (President) Niche business with a driven
management team, significant competitive advantages, and strong cash flow
dynamics. Platform for future acquisitions Growth
capital
investments
in
the
oil
and
gas
E&P
industry.
The
core
thesis
for
both investments is based on technology unlocking additional resources
SORC was founded in 2011 and ACC’s initial investment in ORX was made in
2008 ACC’s scalable capital model and long-term investment horizon
were key to ACC’s partnerships with Mark See (CEO of SORC) and Luis
Baños (CEO of ORX ) Alleghany Capital Corporation: Select Portfolio Company
Highlights Investments |
 Alleghany
83
Questions?
Investments |
 Jack
Sennott Financial Statements
22 November 2013
Alleghany
84 |
 Alleghany
85
Financial Goal and Strategy
Financial Statements
Grow BVPS at a rate exceeding total
return on S&P 500
Total Return
Investment
Strategy
Global
Reinsurance
U.S. Specialty
Insurance
Superior Risk
Adjusted
Returns
Core Tenets of Our Strategy
Financial Goal
Own well-capitalized and financially
secure reinsurance and insurance
operations run by high quality
management teams
Align owners’
and managers’
interests by
structuring compensation to reward
underwriting profits
Maintain a strong balance sheet with
conservative reporting and reserving
practices
Maintain flexibility to allocate capital to
highest risk-adjusted return opportunities
Take a long-term approach |
 Alleghany
86
Alleghany Consolidated Statement of Earnings
Financial Statements
($ in millions, except per share data)
September 30, 2013
September 30, 2012
Premiums written:
Gross premiums written
3,752.1
$
3,078.8
$
Net
premiums written 3,285.9
2,700.4
Revenues
Net premiums earned
3,183.2
$
2,622.9
$
Net
investment income 334.5
234.6
Net realized investment gains
95.6
119.8
Other than temporary impairment losses
(41.9)
(2.9)
Gain on bargain purchase
-
494.9
Other income
37.8
43.4
Total revenues
3,609.2
3,512.7
Costs and Expenses
Net loss and loss expenses incurred
1,862.4
1,587.8
Commissions, brokerage and other underwriting expenses
998.8
592.8
All other expenses
134.6
379.0
Interest expense
65.0
46.5
Total costs and expenses
3,060.8
2,606.1
Earnings before income taxes
548.4
906.6
Income taxes
125.0
111.7
Net earnings
423.4
794.9
Net earnings attributable to noncontrolling interest
0.2
-
Net earnings attributable to Alleghany stockholders
423.2
$
794.9
$
Basic earnings per share attributable to Alleghany stockholders
25.20
$
53.19
$
Diluted earnings per share attributable to Alleghany stockholders
25.20
53.14
Ratios and Supplemental Information
Net loss and loss expenses incurred:
Current year
2,043.8
1,594.6
Prior years
(181.4)
(6.8)
1,862.4
$
1,587.8
$
Loss and loss expense ratio
58.5%
60.5%
Expense ratio
31.4%
22.6%
Combined ratio
89.9%
83.1%
Nine Months Ended |
 Alleghany
87
Alleghany Balance Sheet
Financial Statements
($ in
millions)
September 30, 2013
December
31, 2012
Assets
Investments:
Available-for-sale securities at fair value:
Equity securities
2,035.2
$
1,424.0
$
Debt securities
15,041.1
15,999.5
Short-term investments
949.3
366.0
18,025.6
17,789.6
Other invested assets
771.7
537.4
Total investments
18,797.3
18,326.9
Cash
414.7
649.5
Reinsurance recoverables
1,376.1
1,348.6
Goodwill and intangible assets
225.6
212.2
All other assets
2,428.1
2,270.7
Total assets
23,241.8
$
22,808.0
$
Liabilities
and
Stockholders’
Equity
Loss and loss adjustment expenses
12,030.3
$
12,239.8
$
Unearned
premiums 1,830.0
1,705.3
Senior Notes
1,798.7
1,811.5
All other liabilities
843.2
647.6
Total liabilities
16,502.2
16,404.2
$
-
$
-
Total
stockholders’
equity
attributable
to
Alleghany
stockholders
6,716.5
6,403.8
Noncontrolling interest
23.0
-
Total
stockholders’
equity
6,739.6
6,403.8
Total
liabilities
and
stockholders’
equity
23,241.8
$
22,808.0
$
|
 Alleghany
88
Capital Structure and Leverage Ratios
Financial Statements
($ in millions, except ratios)
September 30, 2013
December 31, 2012
Capital Structure
Senior Notes
1,798.7
$
1,811.5
$
Total stockholders’
equity attributable to Alleghany stockholders
6,716.5
6,403.8
Total capitalization
8,515.2
$
8,215.3
$
Debt Detail
Total Debt
1,798.7
$
1,811.5
$
Less: Holding Company Liquidity
(629.2)
(731.7)
Total Net Debt
1,169.5
$
1,079.8
$
Leverage ratios
Total Debt to Capitalization
0.2
0.2
Total Net Debt to Capitalization
0.1
0.1
Net premiums written (trailing 12 months)
4,309.4
$
3,724.0
$
Net
premiums
written
(trailing
12
months)
to
stockholders’
equity
0.6
0.6
Total investments and cash
19,212.0
$
18,976.4
$
Total
investments
and
cash
to
stockholders’
equity
2.9
3.0
Reserve for losses and loss expenses
12,030.3
$
12,239.8
$
Deduct: reinsurance recoverable on ceded
losses (1,310.5)
(1,305.9)
Net reserve for losses and loss expenses
10,719.8
10,933.9
Net
reserve
for
losses
and
loss
expenses
to
stockholders’
equity
1.6
1.7 |
 Alleghany
89
Return on Average Stockholders’
Equity
Financial Statements
Book Value Per Share (through 9/30/13)
Annualized BVPS growth
5.7%
7.5%
($ in millions, except ratios)
September 30, 2013
Opening stockholders’
equity attributable to Alleghany stockholders
6,403.8
$
Closing
stockholders’
equity
attributable
to
Alleghany
stockholders
6,716.5
Average
stockholders’
equity
6,560.2
$
Net earnings attributable to Alleghany stockholders
423.2
$
Return
on
average
stockholders’
equity
6.5%
Annualized
return
on
average
stockholders’
equity
8.6%
Nine Months Ended |
 Alleghany
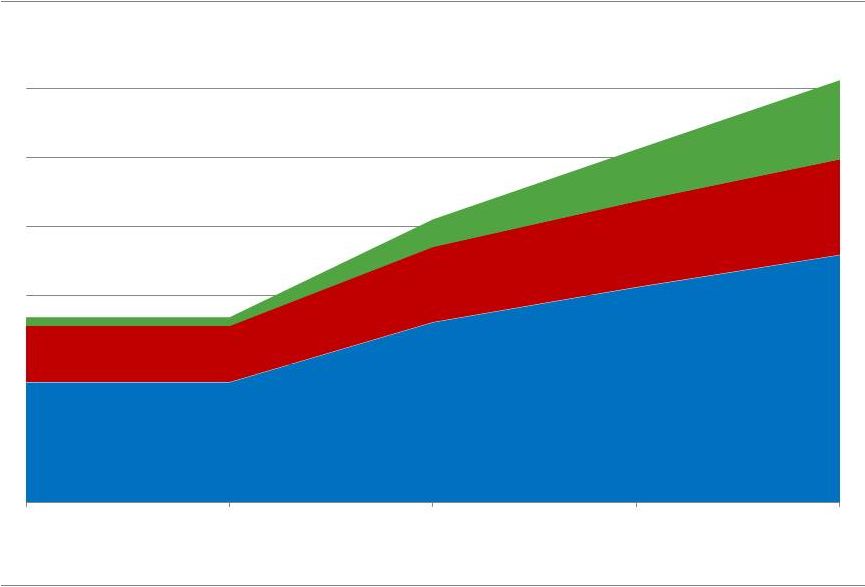
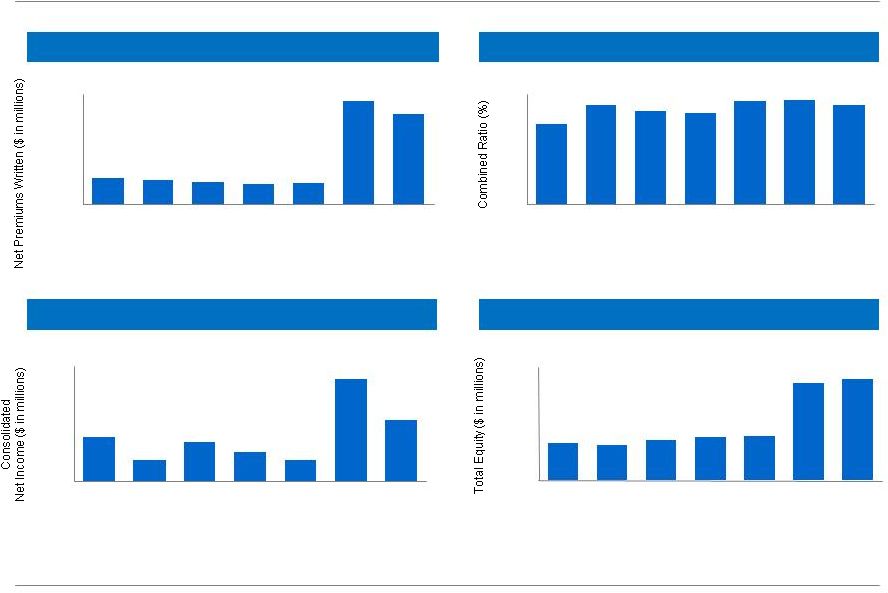
90
Alleghany Consolidated Performance
Financial Statements
Net Premiums Written
Source: Company filings
Consolidated Net Income
(1)
Combined Ratio
Total Equity
(1)
(1)
Attributable to Alleghany stockholders
$299
$148
$271
$199
$143
$702
$423
$0
$200
$400
$600
$800
2007
2008
2009
2010
2011
2012
9/30
2013
$963
$898
$831
$736
$775
$3,724
$3,286
$0
$500
$1,000
$1,500
$2,000
$2,500
$3,000
$3,500
$4,000
2007
2008
2009
2010
2011
2012
9/30
2013
72.5
90.3
84.7
83.0
93.4
94.1
89.9
0
20
40
60
80
100
2007
2008
2009
2010
2011
2012
9/30
2013
$2,485
$2,347
$2,718
$2,909
$2,926
$6,404
$6,717
$0
$1,500
$3,000
$4,500
$6,000
$7,500
2007
2008
2009
2010
2011
2012
9/30
2013 |
 Alleghany
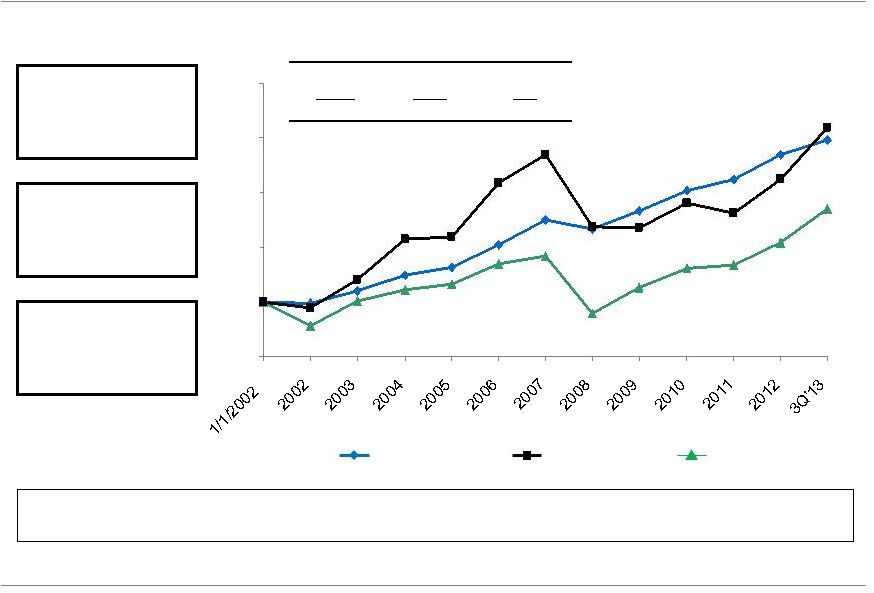
91
Attractive Long-Term Returns
(%)
Alleghany BVPS
Alleghany Price
S&P 500
2002 –
3Q’13 CAGR (%)
(1)
Alleghany
BVPS
8.0%
Alleghany
Price
8.4%
S&P
500
5.4%
+148%
+159%
+85%
Focus on Book Value
per Share Growth
Long-term
Conservative
Orientation
Quasi-autonomous
Subsidiary Operating
Model
Source: SNL Financial, Company filings, CapIQ
(1)
Alleghany price and S&P500 CAGR calculated on a total return basis
Alleghany has a demonstrated track record of creating long-term stockholder
value Financial Statements
50
100
150
200
250
300 |
 Alleghany
92
Summary
Financial Statements
Long-term focus with track record of book value growth
Highly-experienced management team with a demonstrated
track record
Leading franchise across global reinsurance and U.S.
specialty insurance with significant capital and scale
Disciplined underwriter with superior risk management through
insurance cycles
Strong balance sheet with solid financial performance
An integrated investment platform that balances fixed income
exposure with public and private capital
Significant financial flexibility at the holding company level
|
 Alleghany
93
Questions?
Financial Statements |