Attached files
| file | filename |
|---|---|
| 8-K - CURRENT REPORT OF MATERIAL EVENTS OR CORPORATE CHANGES - TIER REIT INC | a13-24607_18k.htm |
Exhibit 99.1
|
|
Third Quarter 2013 Conference Call November 19, 2013 TIERREIT.COM |

|
|
Forward-Looking Statements This presentation contains forward-looking statements, including discussion and analysis of the financial condition of us and our subsidiaries and other matters. These forward-looking statements are not historical facts but are the intent, belief or current expectations of our management based on their knowledge and understanding of our business and industry. Words such as “may,” “anticipates,” “expects,” “intends,” “plans,” “believes,” “seeks,” “estimates,” “would,” “could,” “should” and variations of these words and similar expressions are intended to identify forward-looking statements. We intend that such forward-looking statements be subject to the safe harbor provisions created by Section 27A of the Securities Act of 1933 and Section 21E of the Securities Exchange Act of 1934. These statements are not guarantees of future performance and are subject to risks, uncertainties and other factors, some of which are beyond our control, are difficult to predict and could cause actual results to differ materially from those expressed or forecasted in the forward-looking statements. Forward-looking statements that were true at the time made may ultimately prove to be incorrect or false. We caution you not to place undue reliance on forward-looking statements, which reflect our management's view only as of the date of this presentation. We undertake no obligation to update or revise forward-looking statements to reflect changed assumptions, the occurrence of unanticipated events or changes to future operating results. |

|
|
Forward-Looking Statements Factors that could cause actual results to differ materially from any forward-looking statements made in the presentation include but are not limited to: market and economic challenges experienced by the U.S. economy or real estate industry as a whole and the local economic conditions in the markets in which our properties are located; our ability to renew expiring leases and lease vacant spaces at favorable rates or at all; the inability of tenants to continue paying their rent obligations due to bankruptcy, insolvency or a general downturn in their business; the availability of cash flow from operating activities to fund distributions and capital expenditures; our ability to raise capital in the future by issuing additional equity or debt securities, selling our assets or otherwise, to fund our future capital needs; our ability to strategically dispose of assets on favorable terms; our level of debt and the terms and limitations imposed on us by our debt agreements; our ability to retain our executive officers and other key personnel; the increase in our direct overhead, as a result of becoming a self-managed company; conflicts of interest and competing demands faced by certain of our directors; limitations on our ability to terminate our property management agreement and certain services under our administrative services agreement; unfavorable changes in laws or regulations impacting our business or our assets; and factors that could affect our ability to qualify as a real estate investment trust. The forward-looking statements should be read in light of these and other risk factors identified in the “Risk Factors” section of our 2012 Annual Report on Form 10-K for the year ended December 31, 2012, as filed with the Securities and Exchange Commission. |

|
|
TIERREIT.COM |

|
|
The Economy Sources: U.S. Bureau of Labor Statistics; Bureau of Economic Analysis; CoreLogic; The Conference Board Despite the 16-day government shutdown, total nonfarm payroll rose by 204,000 jobs in October Gross domestic product rose at a 2.8% annual rate in the third quarter September 2013 home prices increased 12% from September 2012 The Leading Economic Index® (LEI) for the U.S. increased 0.7 percent in September to 97.1 (2004 = 100), following a 0.7 percent increase in August, and a 0.4 percent increase in July The Associated Press reported that “a round of U.S. economic data, including Friday's better-than-expected nonfarm payrolls report, ratcheted up expectations that the Fed will soon start ‘tapering’ its $85 billion worth of asset purchases” The Consumer Confidence Index was down sharply to 71.2 in October, from 80.2 in September |

|
|
Portfolio Characteristics (1) Represents our pro rata ownership share Three Eldridge Place Houston, TX Dec. 2012 Sept. 2013 Operating properties 50 40 Square feet (1) 18.9 million 15.9 million Occupancy (1) 86% 87% Markets 26 19 |

|
|
Market Presence – by Percent of Net Operating Income (NOI) * *Represents NOI generated during the three months ended September 30, 2013, by properties owned as of September 30, 2013. Chicago, 24.2% Houston, 15.3% Philly, 14.3% Charlotte, 8.0% DFW, 6.6% Baltimore, 4.5% Louisville, 4.2% Austin, 4.1% D.C., 4.0% Nashville, 1.6% Tampa, 1.2% Atlanta, 0.3% Other, 11.7% |

|
|
Market Presence – Post 10 & 120 S. Riverside Sale by Percent of Net Operating Income (NOI) *Represents NOI generated during the three months ended September 30, 2013, by properties owned as of September 30, 2013. Pre-disposition* Post-disposition Chicago, 24.2% Houston, 15.3% Philly, 14.3% Charlotte, 8.0% DFW, 6.6% Baltimore, 4.5% Louisville, 4.2% Austin, 4.1% D.C., 4.0% Nashville, 1.6% Tampa, 1.2% Atlanta, 0.3% Other, 11.7% Houston, 17.3% Philly, 16.1% Chicago, 14.2% Charlotte, 9.0% DFW, 7.5% Baltimore, 5.1% Louisville, 4.8% Austin, 4.7% D.C., 4.5% Nashville, 1.8% Tampa, 1.4% Atlanta, 0.3% Other, 13.3% |

|
|
Year to Date Accomplishments Managing capital resources Reported a 36% increase in MFFO for the nine months ended September 30, 2013 when compared to the nine months ended September 30, 2012 Achieved total savings from internalization of approximately $8.4 million in the first nine months of 2013 and approximately $11.7 million for the trailing 12 months Achieved year-over-year same store cash NOI growth 4.8%, thru September 30 Increased unrestricted cash to $19.3 million at September 30 from $9.7 million at December 31 Leasing the portfolio and increasing occupancy Leased 2.1 million square feet ytd thru September 30, including 1.3 million square feet of renewal leasing and approximately 800,000 square feet of new and expansion leasing Achieved rental rates 2.3% above expiring leases Despite known move-outs, achieved modest positive net absorption of 20,000 square feet ytd and increased occupancy from 86% at December 31 to 87% at September 30 |

|
|
Year to Date Accomplishments (cont.) Recapitalizing or disposing of remaining troubled assets Completed the recapitalization or disposition efforts on the remaining 2.1 million square feet of troubled assets Recapitalized Paces West (Atlanta, GA), retaining a 10% non-controlling interest Exited Princeton, NJ; Knoxville, TN; Wichita, KS; Staten Island, NY; and Woodcliff Lakes, NJ Sharpening geographic focus Completed the sale of 5&15 Wayside located in Burlington, MA, and the Energy Centre building located in New Orleans, LA, bringing total markets exited during 2013 to seven |

|
|
Year to Date Accomplishments (cont.) Decreasing ownership in select key markets The sale of 10 & 120 S. Riverside on November 14 reduced the portfolio’s net operating income exposure in the Chicago market from 24.2% to 14.2% Strengthening the balance sheet Refinanced the Wanamaker Building, lowering the interest rate from 5.38% to 3.83% Paid down $35 million of our 9.55% mezzanine loan on FOUR40 S. LaSalle (formerly known as One Financial Place) Reduced our debt balance (at ownership share) from $2.17 billion at December 31 to $1.88 billion at September 30 Reduced our debt as a percentage of our December 2012 estimated real estate value from 64.4% at December 31 to 61.3% at September 30 Paid down debt with sale proceeds from 10 & 120 S. Riverside, reducing our leverage to 56.8% based on our December 2012 estimated real estate value and 55.5% based on our November 2013 estimated real estate value |

|
|
Progress on Debt Maturities: 1/2012 vs. 9/2013 (In Millions) $197 - 222 S. Riverside $150 - Bank of America $128 - The Terrace $100 - 1325 G Street $99 - Fifth Third Cleveland & Columbus $66 - Three Parkway $71 - Other Note: Reflects our share of consolidated and unconsolidated properties $105 - Burnett $93 - Louisville $60 - United Plaza $55 - Lawson $44 - Loop Central $59 - Other $200 – Credit facility $125 – FOUR40 S. LaSalle $42 - Other $1,200 $1,000 $800 $600 $400 $200 $- $236 $315 $367 $607 $416 $985 $811 $134 $140 $104 $147 2013 2014 2015 2016 2017 Thereafter |

|
|
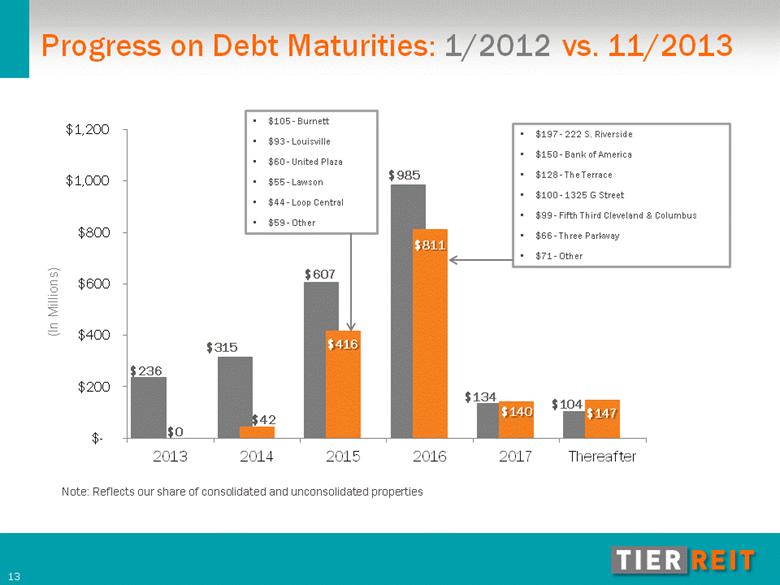
Progress on Debt Maturities: 1/2012 vs. 11/2013 (In Millions) $197 - 222 S. Riverside $150 - Bank of America $128 - The Terrace $100 - 1325 G Street $99 - Fifth Third Cleveland & Columbus $66 - Three Parkway $71 - Other Note: Reflects our share of consolidated and unconsolidated properties $105 - Burnett $93 - Louisville $60 - United Plaza $55 - Lawson $44 - Loop Central $59 - Other $1,200 $1,000 $800 $600 $400 $200 $- $236 $0 $315 $42 $607 $416 $985 $811 $134 $140 $104 $147 2013 2014 2015 2016 2017 Thereafter |
|
|
Modified Funds from Operations (MFFO*) MFFO attributable to common stockholders for the third quarter 2013 was $16.1 million, or $0.05 per diluted share Increase of $0.7 million, or 4.6%, as compared to third quarter 2012 MFFO attributable to common stockholders for the nine months ended September 30, 2013 was $49.3 million, or $0.16 per diluted share Increase of $13.1 million, or 36.2%, as compared to the similar nine month period in 2012 *Reconciliations of net income (loss) to MFFO attributable to common stockholders are contained in the Current Report on Form 8-K filed on November 19, 2013. |

|
|
Third quarter 2013 vs. third quarter 2012 Same store cash NOI* for third quarter 2013 was $40.0 million Decreased $0.8 million, or 1.9%, as compared to third quarter 2012 primarily due to: increased property operating expenses, including repairs and maintenance and demolition costs to prepare vacant space for future leasing partially offset by increased recoveries of property operating expenses and lower utilities costs Third quarter 2013 vs. second quarter 2013 Same store cash NOI* for third quarter 2013 was $40.0 million Decreased $2.0 million, or 4.8%, as compared to second quarter 2013 primarily due to: Decrease in revenue of $0.7 million, or 0.8%, primarily due to: a decline in same store occupancy from 87% to 86% a decrease in property operating expense recoveries partially offset by tenants transitioning from free rent to cash paying rent Increase in expenses of $1.3 million, or 3.1%, primarily due to: repairs and maintenance increased summer utilities consumption real estate tax increases Same Store Results *Reconciliations of net income (loss) to same store cash NOI are contained in the Current Report on Form 8-K filed on November 19, 2013. |
|
|
Nine months ended September 2013 vs. nine months ended September 2012 Same store cash NOI* for year to date 2013 was $123.3 million Increased $5.6 million, or 4.8%, as compared to year to date 2012 due to: Increase in revenue of $9.0 million primarily due to: tenants transitioning from free rent into cash paying rent phase of leases increased recoveries of property operating expense Partially offset by an increase in expenses of $3.4 million primarily due to: Increased property operating expenses, including repairs and maintenance and demolition costs to prepare vacant space for future leasing partially offset by reductions in bad debt expense and real estate taxes Same Store Results *Reconciliations of net income (loss) to same store cash NOI are contained in the Current Report on Form 8-K filed on November 19, 2013. |

|
|
Leasing Cost Analysis Total of $42.6 million in leasing costs for the nine months ended September 30, 2013 Total of $9.5 million in leasing costs in the third quarter 2013 Renewals 635,000 square feet $6.7 million, or $2.65 per square foot per year of lease term, in tenant improvement and commission costs 4.0 year average term Expansions 58,000 square feet $1.3 million, or $4.73 per square foot per year of lease term, in tenant improvement and commission costs 4.6 year average term New leases 53,000 square feet $1.5 million, or $6.04 per square foot per year of lease term, in tenant improvement and commission costs 4.6 year average term Note: These figures include our pro rata share of leasing activity at all properties. Two BriarLake Plaza Houston, TX |

|
|
Portfolio Occupancy Market Net rentable area (in thousands of square feet) September 2013 Chicago, IL 3,711 86% Philadelphia, PA 2,565 91% Houston, TX 1,901 90% Dallas/Ft. Worth, TX 1,158 86% Louisville, KY 1,111 83% Charlotte, NC 891 89% Baltimore, MD 648 86% Austin, TX 619 85% Washington, D.C. 486 70% Nashville, TN 361 93% Tampa, FL 130 100% Atlanta, GA 65 85% Other 2,204 87% Total 15,850 87% Note: Includes all properties owned as of September 30, 2013. Represents our pro rata ownership share. |

|
|
November 2013 Estimated Value per Share The estimated value per share increased from $4.01 at December 17, 2012 to $4.20 at November 1, 2013, an increase of $0.19 cents per share, or 4.7% The Audit Committee engaged Altus Group, an independent, third party real estate research, valuation and advisory firm, to appraise our real estate assets and estimate the fair value of our notes payable and other net assets Factors contributing to the increase in our estimated per share value: Increase of $0.23 in the value of our real estate, including the development of our Two BriarLake Plaza property in Houston, Texas; Increase of $0.11 resulting from the impact of the increase in market borrowing rates since December 2012 on the value of our notes payable; and Offset by $0.15 reduction resulting from the investment of cash proceeds from real estate dispositions into our other real estate assets |

|
|
Objectives and Key Areas of Focus Objectives Maximizing stockholder value Laying the groundwork for distributable cash flow Creating liquidity for our stockholders Key Areas of Focus – 2013 to 2015 Managing capital resources Leasing the portfolio and increasing occupancy to 90% or more Sharpening geographic focus Decreasing ownership in select markets Strengthening the balance sheet by reducing our leverage to approximately 50% Maintaining a well-respected management team |

|
|
Playback Information An audio link for a playback of today’s call will be on our website at www.tierreit.com/ir A recorded playback of today’s call will also be available by calling toll free (888) 203-1112 and using passcode 9007136 Today’s presentation has been filed with the SEC on Form 8-K and is available on our website at www.tierreit.com/ir under the heading SEC Filings Save the date! TIER REIT’s fourth quarter conference call will be held on March 27, 2014. Please check our website for details, and sign up at www.tierreit.com/ir for conference call information and other timely communications |

|
|
Questions |

|
|
Wanamaker Building Philadelphia, PA The Terrace Austin, 1650 Arch Street Philadelphia, PA Three Eldridge Place Houston, FOUR40 S. LaSalle Chicago, IL Terrace Office Park Austin, TX Lakeview Louisville, KY Bank of America Plaza Charlotte, NC |

|
|
Playback Information An audio link for a playback of today’s call will be on our website at www.tierreit.com/ir A recorded playback of today’s call will also be available by calling toll free (888) 203-1112 and using passcode 9007136 Today’s presentation has been filed with the SEC on Form 8-K and is available on our website at www.tierreit.com/ir under the heading SEC Filings Save the date! TIER REIT’s fourth quarter conference call will be held on March 27, 2014. Please check our website for details, and sign up at www.tierreit.com/ir for conference call information and other timely communications |
