Attached files
| file | filename |
|---|---|
| EX-32.1 - CERTIFICATION - ALLTEMP, INC. | f10q0913ex32i_source.htm |
| EX-31.1 - CERTIFICATION - ALLTEMP, INC. | f10q0913ex31i_source.htm |
| EX-31.2 - CERTIFICATION - ALLTEMP, INC. | f10q0913ex31ii_source.htm |
| EX-32.2 - CERTIFICATION - ALLTEMP, INC. | f10q0913ex32ii_source.htm |
UNITED STATES
SECURITIES AND EXCHANGE COMMISSION
WASHINGTON, DC 20549
FORM 10-Q
|
x
|
Quarterly report pursuant to Section 13 or 15(d) of the Securities Exchange Act of 1934
|
For the quarterly period ended September 30, 2013
|
¨
|
Transition report pursuant to Section 13 or 15(d) of the Securities Exchange Act of 1934
|
For the transition period from to .
Commission File Number 033-26828
SOURCE FINANCIAL, INC.
(Exact name of registrant as specified in its charter)
|
Delaware
|
80-0142655
|
|
|
(State or other jurisdiction of
incorporation or organization)
|
(I.R.S. employer
identification number)
|
Level6/97 Pacific Highway
North Sydney NSW 2060
Australia
(Address of principal executive offices and zip code)
+61 2 8907-2500
(Registrant’s telephone number, including area code)
Indicate by check mark whether the registrant (1) has filed all reports required to be filed by Section 13 or 15(d) of the Securities Exchange Act of 1934 during the preceding 12 months (or for such shorter period that the registrant was required to file such reports) and (2) has been subject to such filing requirements for the past 90 days. Yes ¨ No x
Indicate by check mark whether the registrant has submitted electronically and posted on its corporate Web site, if any, every Interactive Data File required to be submitted and posted pursuant to Rule 405 of Regulation S-T (§232.405 of this chapter) during the preceding 12 months (or for such shorter period that the registrant was required to submit and post such files). Yes x No ¨
Indicate by check mark whether the registrant is a large accelerated filer, an accelerated filer, a non-accelerated filer, or a smaller reporting company.
|
Large accelerated filer
|
¨
|
|
Accelerated filer
|
¨
|
||||
|
Non-accelerated filer
|
¨
|
(Do not check if a smaller reporting company)
|
|
Smaller reporting company
|
x
|
|||
Indicate by check mark whether the registrant is a shell company (as defined in Rule 12b-2 of the Exchange Act). Yes ¨ No x
Indicate the number of shares outstanding of each of the issuer’s classes of common stock, as of the latest practicable date. As of November 1, 2013, the Registrant had outstanding 10,300,000 shares of common stock outstanding.
SOURCE FINANCIAL, INC.
FORM 10-Q
INDEX
|
SPECIAL NOTE REGARDING FORWARD-LOOKING STATEMENTS
|
|
|
|
PART I FINANCIAL INFORMATION
|
|
|
|
Item 1.
|
Financial statements
|
2
|
|
Item 2.
|
Management’s Discussion and Analysis of Financial Condition and Results of Operations
|
17
|
|
Item 3.
|
Quantitative and Qualitative Disclosures about Market Risk
|
22
|
|
Item 4.
|
Controls and Procedures
|
23
|
| PART II OTHER INFORMATION |
|
|
|
Item 1A.
|
Risk Factors
|
23
|
|
Item 6.
|
Exhibits
|
24
|
SPECIAL NOTE REGARDING FORWARD-LOOKING STATEMENTS
This document contains certain statements of a forward-looking nature. Such forward-looking statements, including but not limited to statements regarding projected growth, trends and strategies, future operating and financial results, financial expectations and current business indicators are based upon current information and expectations and are subject to change based on factors beyond the control of the Company. Forward-looking statements typically are identified by the use of terms such as “look,” “may,” “should,” “might,” “believe,” “plan,” “expect,” “anticipate,” “estimate” and similar words, although some forward-looking statements are expressed differently. The accuracy of such statements may be impacted by a number of risks and uncertainties that could cause actual results to differ materially from those projected or anticipated, including but not limited to those set forth herein and in our Annual Report on Form 10-K for the fiscal year ended June 30, 2013 filed on October 15, 2013.
Readers are cautioned not to place undue reliance on these forward-looking statements, which speak only as of the date hereof. Except as required by the federal securities laws, we undertake no obligation to update forward-looking information. Nonetheless, the Company reserves the right to make such updates from time to time by press release, periodic report or other method of public disclosure without the need for specific reference to this Report. No such update shall be deemed to indicate that other statements not addressed by such update remain correct or create an obligation to provide any other updates.
PART I FINANCIAL INFORMATION
|
Item 1.
|
Financial Statements
|
SOURCE FINANCIAL, INC. AND SUBSIDIARIES
CONSOLIDATED BALANCE SHEETS
|
September 30,
2013
|
June 30,
2013
|
|||||||
|
(Unaudited)
|
(Restated)
|
|||||||
|
ASSETS
|
||||||||
|
CURRENT ASSETS
|
||||||||
|
Cash and cash equivalents
|
$ | 7,100,551 | $ | 7,205,827 | ||||
|
Trade receivables, net
|
28,192,664 | 27,008,840 | ||||||
|
Inventories
|
235,035 | 220,377 | ||||||
|
Deferred tax asset
|
186,180 | 718,767 | ||||||
|
Other current assets
|
1,326,207 | 820,726 | ||||||
|
TOTAL CURRENT ASSETS
|
37,040,637 | 35,974,537 | ||||||
|
NON-CURRENT ASSETS
|
||||||||
|
Intangible assets, net
|
3,639,080 | 3,512,767 | ||||||
|
Deferred tax asset
|
1,516,610 | 988,860 | ||||||
|
Property, plant and equipment, net
|
575,726 | 578,136 | ||||||
|
Other assets
|
50,000 | 95,973 | ||||||
|
Goodwill
|
70,388 | 69,057 | ||||||
|
TOTAL NON-CURRENT ASSETS
|
5,851,804 | 5,244,793 | ||||||
|
TOTAL ASSETS
|
$ | 42,892,441 | $ | 41,219,330 | ||||
|
LIABILITIES AND STOCKHOLDERS' EQUITY
|
||||||||
|
CURRENT LIABILITIES
|
||||||||
|
Trade and other payables
|
$ | 5,233,635 | $ | 5,250,399 | ||||
|
Wholesale loan facility
|
27,019,113 | 25,669,388 | ||||||
|
Cash reserve
|
2,767,943 | 2,731,094 | ||||||
|
TOTAL CURRENT LIABILITIES
|
35,020,691 | 33,650,881 | ||||||
|
NON-CURRENT LIABILITIES
|
||||||||
|
Shareholder loans
|
96,536 | 45,665 | ||||||
|
TOTAL NON-CURRENT LIABILITIES
|
96,536 | 45,665 | ||||||
|
TOTAL LIABILITIES
|
35,117,227 | 33,696,546 | ||||||
|
STOCKHOLDERS' EQUITY
|
||||||||
|
Preferred stock, Series A, $0.01 par value, 10,000,000 shares authorized, no shares issued and outstanding
|
- | - | ||||||
|
Preferred stock, Series B, $0.01 par value, 10,000,000 shares authorized, 5,000 issued and outstanding
|
50 | 50 | ||||||
|
Common Stock, $0.10 par value, 500,000,000 shares authorized, 9,961,632 shares issued and outstanding respectively
|
996,163
|
996,163
|
||||||
|
Common stock to be issued
|
50,900
|
33,837
|
||||||
|
Additional paid-in capital
|
14,860,310
|
14,462,575
|
||||||
|
Other accumulated comprehensive loss
|
(913,393 | ) | (1,052,144 | ) | ||||
|
Accumulated deficit
|
(7,218,816 | ) | (6,917,697 | ) | ||||
|
TOTAL STOCKHOLDERS' EQUITY
|
7,775,214 | 7,522,784 | ||||||
|
TOTAL LIABILITIES AND STOCKHOLDERS' EQUITY
|
$ | 42,892,441 | $ | 41,219,330 | ||||
The accompanying notes are an integral part of the unaudited consolidated financial statements
2
|
SOURCE FINANCIAL, INC. AND SUBSIDIARIES
|
||||||||
|
CONSOLIDATED STATEMENTS OF OPERATIONS AND COMPREHENSIVE (LOSS) INCOME
|
||||||||
|
FOR THE THREE MONTHS ENDED SEPTEMBER 30, 2013 AND 2012
|
||||||||
|
(UNAUDITED)
|
||||||||
|
September 30,
2013
|
September 30,
2012
|
|||||||
|
|
|
|||||||
|
Revenue
|
$ | 1,375,091 | $ | 1,307,305 | ||||
|
Cost of revenue
|
956,645 | 889,062 | ||||||
|
Gross Profit
|
418,446 | 418,243 | ||||||
|
Operating Expenses
|
||||||||
|
Compensation expenses
|
117,553 | 154,929 | ||||||
|
Research and development expense
|
109,398 | 118,057 | ||||||
|
Bad debt expenses
|
220,993 | 6,950 | ||||||
|
Occupancy expenses
|
61,918 | 58,627 | ||||||
|
Depreciation expense
|
42,260 | 34,795 | ||||||
|
General and administration expenses
|
336,694 | 9,344 | ||||||
|
Total Operating Expenses
|
888,815 | 382,702 | ||||||
|
(Loss) Income from operations
|
(470,370 | ) | 35,541 | |||||
|
Other Income (Expense)
|
||||||||
|
Interest income
|
26,839 | 30,168 | ||||||
|
Research and development grant
|
183,300 | 93,465 | ||||||
|
Finance costs
|
(660 | ) | (141 | ) | ||||
|
Total Other Income
|
209,479 | 123,492 | ||||||
|
(Loss) Income before provision of income taxes
|
(260,891 | ) | 159,033 | |||||
|
Provision for income taxes
|
40,229 | 4,928 | ||||||
|
Net (Loss) Income
|
(301,120 | ) | 154,105 | |||||
|
Other comprehensive income
|
||||||||
|
Foreign currency translation
|
138,751 | 241,928 | ||||||
|
Comprehensive (Loss) Income
|
$ | (162,369 | ) | $ | 396,033 | |||
|
Net (Loss) Income per share
|
||||||||
|
Basic
|
$ | (0.029 | ) | $ | 0.029 | |||
|
Diluted
|
$ | (0.029 | ) | $ | 0.029 | |||
|
Weighted average number of shares used in computing basic and diluted net (loss) income per share:
|
||||||||
|
Basic
|
10,373,128
|
5,300,000 | ||||||
|
Diluted
|
10,373,128
|
5,300,000 | ||||||
|
The accompanying notes are an integral part of the unaudited consolidated financial statements
|
3
|
SOURCE FINANCIAL, INC. AND SUBSIDIARIES
|
||||||||
|
CONSOLIDATED STATEMENTS OF CASH FLOWS
|
||||||||
|
FOR THE THREE MONTHS ENDED SEPTEMBER 30, 2013 AND 2012
|
||||||||
|
(UNAUDITED)
|
||||||||
|
September 30,
2013
|
September 30,
2012
|
|||||||
|
Net (loss) income
|
$ | (301,119 | ) | $ | 154,105 | |||
|
Adjustments to reconcile net (loss) income to net cash
(used in) provided by operating activities: |
||||||||
|
Depreciation and amortization
|
178,601 | 170,293 | ||||||
|
Stock options and shares issued for compensation
|
124,921 | - | ||||||
|
(Increase) decrease in assets:
|
||||||||
|
Trade receivables, net
|
(653,081 | ) | 2,357,747 | |||||
|
Inventories
|
(10,250 | ) | (2,472 | ) | ||||
|
Deferred tax asset
|
37,160 | - | ||||||
|
Other assets
|
(149,386 | ) | 222,523 | |||||
|
Increase (decrease) in current liabilities:
|
||||||||
|
Trade payables
|
(116,052 | ) | (2,268,757 | ) | ||||
|
Net cash (used in) provided by operating activities
|
(889,206 | ) | 633,439 | |||||
|
CASH FLOWS FROM INVESTING ACTIVITIES
|
||||||||
|
Purchase of property, plant and equipment
|
(80,407 | ) | (202,768 | ) | ||||
|
Development of intangible assets
|
(146,640 | ) | - | |||||
|
Net cash used in investing activities
|
(227,047 | ) | (202,768 | ) | ||||
|
CASH FLOWS FROM FINANCING ACTIVITIES
|
||||||||
|
Wholesale loan facility, net
|
841,919 | (2,261,805 | ) | |||||
|
Capital Reserve
|
(61,362 | ) | 192,122 | |||||
|
Shareholder loans, net
|
95,816 | (28,585 | ) | |||||
|
Net cash provided by (used in) financing activities
|
876,373 | (2,098,268 | ) | |||||
|
Effect of exchange rate changes on cash and cash equivalents
|
134,604 | 138,261 | ||||||
|
Net decrease in cash and cash equivalents
|
(105,276 | ) | (1,529,335 | ) | ||||
|
Cash and cash equivalents at the beginning of the period
|
7,205,827 | 5,634,718 | ||||||
|
Cash and cash equivalents at the end of the period
|
$ | 7,100,551 | $ | 4,105,383 | ||||
|
SUPPLEMENTAL DISCLOSURES:
|
||||||||
|
Cash paid during the period for:
|
||||||||
|
Income tax payments
|
$ | 3,069 | $ | 4,928 | ||||
|
Interest payments
|
$ | 466,443 | $ | 456,830 | ||||
|
SUPPLEMENTAL SCHEDULE OF NON- CASH FINANCING ACTIVITIES:
|
||||||||
|
Issuance of stock options
|
$ | 70,123 | $ | - | ||||
|
Restricted stock compensation
|
$ | 344,675 | $ | - | ||||
The accompanying notes are an integral part of the unaudited consolidated financial statements
4
|
SOURCE FINANCIAL, INC. AND SUBSIDIARIES
|
||||||||||||||||||||||||||||||||
|
CONSOLIDATED STATEMENTS OF STOCKHOLDERS' EQUITY
|
||||||||||||||||||||||||||||||||
|
(UNAUDITED)
|
||||||||||||||||||||||||||||||||
|
Additional
|
Accumulated
|
Total
|
||||||||||||||||||||||||||||||
|
Common Stock
|
Preferred Stock
|
Paid in |
Comprehensive
|
Accumulated
|
Stockholders'
|
|||||||||||||||||||||||||||
|
Shares
|
Amount
|
Shares
|
Amount
|
Capital
|
Loss
|
Deficit
|
Equity
|
|||||||||||||||||||||||||
|
Balance June 30, 2013 (Restated)
|
10,300,000
|
$ |
1,030,000
|
5,000 | $ | 50 | $ |
14,462,575
|
$ | (1,052,144 | ) | $ | (6,917,697 | ) | $ | 7,522,784 | ||||||||||||||||
|
Issuance of stock options
|
- | - | - | - | 70,123 | - | - | 70,123 | ||||||||||||||||||||||||
|
Compensation in respect of option and restricted stock granted to employees, directors and third- parties
|
170,632
|
17,063
|
- | - |
327,612
|
- | - | 344,675 | ||||||||||||||||||||||||
|
Net loss for the three months ended September 30, 2013
|
- | - | - | - | - | 138,751 | (301,119 | ) | (162,368 | ) | ||||||||||||||||||||||
|
Balance September 30, 2013
|
10,470,632
|
$ |
1,047,063
|
5,000 | $ | 50 | $ |
14,860,310
|
$ | (913,393 | ) | $ | (7,218,816 | ) | $ | 7,775,214 | ||||||||||||||||
The accompanying notes are an integral part of the unaudited consolidated financial statements
5
SOURCE FINANCIAL, INC. AND SUBSIDIARIES
NOTES TO CONSOLIDATED FINANCIAL STATEMENTS
SEPTEMBER 30, 2013
(UNAUDITED)
Note 1 – BASIS OF PRESENTATION AND ORGANIZATION
Basis of Presentation
The accompanying condensed consolidated financial statements were prepared in conformity with generally accepted accounting principles in the United States (“US GAAP”) and with the instructions to Form 10-Q.
Certain information and footnote disclosures normally included in financial statements prepared in accordance with U.S. GAAP have been condensed or omitted pursuant to U.S. GAAP rules and regulations for presentation of interim financial information. Therefore, the unaudited condensed interim consolidated financial statements should be read in conjunction with the audited annual financial statements for the years ended June 30, 2013 and 2012. Current and future financial statements may not be directly comparable to the Company’s historical financial statements. However, except as disclosed herein, there have been no material changes in the information disclosed in the notes to the financial statements for the year ended June 30, 2013 included in the Company’s Annual Report on Form 10-K filed with the Securities and Exchange Commission. The unaudited consolidated financial statements should be read in conjunction with the financial statements included in the Form 10-K. In the opinion of Management, all adjustments considered necessary for a fair presentation, consisting solely of normal recurring adjustments, have been made. Operating results for the three months ended September 30, 2013 are not necessarily indicative of the results that may be expected for the year ending June 30, 2014.
Restatements
Subsequent to the issuance of the Company's financial statements for the fiscal year ended June 30, 2013, the Company determined that certain shares had been authorized for issuance prior to the merger on June 30, 2013 and presentation of the stockholders’ equity on the consolidated balance sheet had not been accounted properly in the Company’s financial statements. Specifically, the number of shares outstanding as of June 30, 2013 was 10,300,000, of which 338,368 is to be issued. The Company decided to restate the consolidated balance sheet and stockholders’ equity for the fiscal year ended June 30, 2013 which resulted in a change in the opening numbers for the three months ended September 30, 2013.
The effect of the restatements is as follows:
|
CONSOLIDATED BALANCE SHEET
|
||||||||
|
Reported
|
Restated
|
|||||||
|
June 30, 2013
|
June 30, 2013
|
|||||||
|
Preferred stock
|
$ | 50 | $ | 50 | ||||
|
Common stock
|
996,164 | 996,163 | ||||||
| Common stock to be issued | - | 33,837 | ||||||
|
Additional paid in capital
|
14,496,411 | 14,462,575 | ||||||
|
Other comprehensive income
|
(1,052,144 | ) | (1,052,144 | ) | ||||
|
Accumulated deficit
|
(6,917,697 | ) | (6,917,697 | ) | ||||
|
Total Stockholders' Equity
|
$ | 7,522,784 | $ | 7,522,784 | ||||
Note 2 – SUMMARY OF SIGNIFICANT ACCOUNTING POLICIES
Principles of Consolidation
The consolidated financial statements include the accounts of Source Financial, Inc. (“Source”) and its wholly owned subsidiaries: Moneytech Limited (“Moneytech”), Moneytech Finance Pty Ltd, mPayments Pty Ltd., Moneytech POS Pty Ltd., Moneytech Services Pty Ltd, WikiTechnologies, Inc., collectively referred to as the Company. Moneytech USA was formed Decembner 5, 2012 and WikiTechnologies, Inc. was acquired on June 30, 2013. All material intercompany accounts, transactions and profits were eliminated in consolidation.
Equity Investments
The Company uses the equity method of accounting for investments when the percentage of ownership of the investment is between 20% and 50%. The Company includes the proportionate share of the profit or loss as part of the carrying value of the investment.
Use of Estimates
The preparation of financial statements in conformity with US GAAP requires management to make certain estimates and assumptions that affect the reported amounts of assets and liabilities and disclosure of contingent assets and liabilities at the date of the financial statements and the reported amounts of revenues and expenses during the reporting period. Actual results could differ from those estimates. Significant estimates include collectability of accounts receivable and recoverability of long-term assets.
Exchange (Loss) Gain
During the three months ended September 30, 2013 and 2012, the transactions of Moneytech and its wholly owned subsidiaries were denominated in foreign currency and were recorded in Australian dollar (AUD) at the rates of exchange in effect when the transactions occurred. Exchange gains and losses are recognized for the different foreign exchange rates applied when the foreign currency assets and liabilities are settled.
Foreign Currency Translation and Comprehensive (Loss) Income
The accounts of Moneytech and its wholly owned subsidiaries were maintained, and its financial statements were expressed, in AUD. Such financial statements were translated into USD with the AUD as the functional currency. All assets and liabilities were translated at the exchange rate at the balance sheet date, stockholder’s equity is translated at the historical rates and income statement items are translated at the average exchange rate for the period. Transactions in foreign currencies are initially recorded at the functional currency rate ruling at the date of transaction. Any differences between the initially recorded amount and the settlement amount are recorded as a gain or loss on foreign currency transaction in the consolidated statements of operations. The resulting translation adjustments are reported under other comprehensive income as a component of shareholders’ equity.
6
Reportable Segment
The Company has one reportable segment. The Company’s activities are interrelated and each activity is dependent upon and supportive of the other. Accordingly, all significant operating decisions are based on analysis of financial products provided as a single global business.
Revenue Recognition
Revenue is recognized when persuasive evidence of an arrangement exists, delivery has occurred, the fee is fixed or determinable, and collectability is probable. Revenue generally is recognized net of allowances for returns and any taxes collected from customers and subsequently remitted to governmental authorities.
Cost of Revenue
Cost of revenue includes; programs licensed; operating costs including costs of funds and related product support service centers to drive traffic to our websites, costs incurred to support and maintain products and services, including inventory valuation adjustments; costs associated with the delivery of consulting services; and the amortization of capitalized intangible software costs. Capitalized intangible software costs are amortized over the estimated lives of the products.
Research and Development
Research and development expenses include payroll, employee benefits, and other headcount-related expenses associated with product development. Research and development expenses also include third-party development and programming costs, localization costs incurred to translate software for international markets, and the amortization of purchased software code and services content. Such costs related to software development are included in research and development expense until the point that technological feasibility is reached, which for our software products, is generally shortly before the products are put into service. Once technological feasibility is reached, such costs are capitalized and amortized to cost of revenue over the estimated lives of the products. Certain research and development costs are eligible for reimbursement by the Australian government. Research and development expense is included as an operating expense and research and development grant income is reported as other income.
Income Taxes
The Company utilizes FASB Accounting Standards Codification (ASC) Topic 740, Income Taxes, which requires recognition of deferred tax assets and liabilities for the expected future tax consequences of events that were included in the financial statements or tax returns. Under this method, deferred income taxes are recognized for the tax consequences in future years of differences between the tax bases of assets and liabilities and their financial reporting amounts at each period end based on enacted tax laws and statutory tax rates applicable to the periods in which the differences are expected to affect taxable income. Valuation allowances are established, when necessary, to reduce deferred tax assets to the amount expected to be realized.
The Company follows FASB Interpretation No. 48, Accounting for Uncertainty in Income Taxes, (codified in FASB ASC Topic 740). When tax returns are filed, it is likely that some positions taken would be sustained upon examination by the taxing authorities, while others are subject to uncertainty about the merits of the position taken or the amount of the position that would be ultimately sustained. The benefit of a tax position is recognized in the financial statements in the period during which, based on all available evidence, management believes it is more likely than not that the position will be sustained upon examination, including the resolution of appeals or litigation processes, if any. Tax positions taken are not offset or aggregated with other positions. Tax positions that meet the more-likely-than-not recognition threshold are measured as the largest amount of tax benefit that is more than 50 percent likely of being realized upon settlement with the applicable taxing authority. The portion of the benefits associated with tax positions taken that exceeds the amount measured as described above is reflected as a liability for unrecognized tax benefits in the accompanying balance sheets along with any associated interest and penalties that would be payable to the taxing authorities upon examination. Interest associated with unrecognized tax benefits is classified as interest expense and penalties are classified in selling, general and administrative expenses in the statements of income.
At September 30, 2013 and 2012, the Company had not taken any significant uncertain tax positions on its tax returns for 2012 and prior years or in computing its tax provision.
Concentration of Credit Risk
Financial instruments that potentially subject the Company to concentrations of credit risk are cash, accounts receivable and other receivables arising from its normal business activities. The Company places its cash in what it believes to be credit-worthy financial institutions. The Company has a diversified customer base, most of which are in Australia. The Company controls credit risk related to accounts receivable through credit approvals, credit limits and monitoring procedures. The Company routinely assesses the financial strength of its customers and, based upon factors surrounding the credit risk, establishes an allowance, if required, for uncollectible accounts and, as a consequence, believes that its accounts receivable credit risk exposure beyond such allowance is limited.
7
Risks and Uncertainties
The Company is subject to risks from, among other things, competition associated with the industry in general, other risks associated with financing, liquidity requirements, rapidly changing customer requirements, limited operating history, foreign currency exchange rates and the volatility of public markets.
Contingencies
Certain conditions may exist as of the date the financial statements are issued, which may result in a loss to the Company but which will only be resolved when one or more future events occur or fail to occur. The Company’s management and legal counsel assess such contingent liabilities, and such assessment inherently involves judgment. In assessing loss contingencies related to legal proceedings that are pending against the Company or unasserted claims that may result in such proceedings, the Company’s legal counsel evaluates the perceived merits of any legal proceedings or unasserted claims as well as the perceived merits of the amount of relief sought or expected to be sought.
If the assessment of a contingency indicates it is probable that a material loss has been incurred and the amount of the liability can be estimated, then the estimated liability would be accrued in the Company’s financial statements. If the assessment indicates that a potential material loss contingency is not probable but is reasonably possible, or is probable but cannot be estimated, then the nature of the contingent liability, together with an estimate of the range of possible loss if determinable and material would be disclosed. Loss contingencies considered to be remote by management are generally not disclosed unless they involve guarantees, in which case the guarantee would be disclosed.
Cash and Cash Equivalents
Cash and cash equivalents include cash in hand and cash in demand deposits, certificates of deposit and all highly liquid debt instruments with original maturities of three months or less. At September 30, 2013, the Company had $7,100,551 in cash, all of which was on deposit in Australia and not covered by insurance. At September 30, 2012, the Company had $4,105,383 in cash in Australia which was not covered by insurance. The Company has not experienced any losses in such accounts and believes it is not exposed to any risks on its cash in bank accounts.
Allowance for Doubtful Accounts
The Company maintains reserves for potential credit losses on accounts receivable. Management reviews the composition of accounts receivable and analyzes historical bad debts, customer concentrations, customer credit worthiness, current economic trends and changes in customer payment patterns to evaluate the adequacy of these reserves.
Inventory
Inventories are valued at the lower of cost (determined on a weighted average basis) or market. Management compares the cost of inventories with the market value and allowance is made to write down inventories to market value, if lower. As of September 30, 2013 and June 30, 2013, inventory only consisted of finished goods.
Property, Plant & Equipment
Property and equipment is stated at cost and depreciated using the straight-line method over the shorter of the estimated useful life of the asset or the lease term. The estimated useful lives of our property and equipment are generally as follows:
| Computer software | 3 to 10 years |
| Computer hardware | 5 to 15 years |
| Furniture and equipment | 3 to 5 years |
As of September 30, 2013 and June 30, 2013, Property, Plant & Equipment consisted of the following:
|
9/30/2013
|
6/30/2013
|
|||||||
|
Office equipment
|
$ | 36,642 | $ | 35,949 | ||||
|
Furniture and fixtures
|
234,568 | 249,770 | ||||||
|
Computers and software
|
1,344,219 | 1,282,317 | ||||||
|
Accumulated Depreciation
|
(1,039,702 | ) | (989,900 | ) | ||||
| $ | 575,726 | $ | 578,136 | |||||
8
As of September 30, 2013 and 2012, depreciation expense consisted of the following:
|
9/30/2013
|
9/30/2012
|
|||||||
|
Depreciation, operating
|
$ | 42,260 | $ | 34,795 | ||||
|
Depreciation, cost of revenue
|
5,098 | 5,686 | ||||||
|
Total depreciation expense
|
$ | 47,358 | $ | 40,481 | ||||
Fair Value of Financial Instruments
For certain of the Company’s financial instruments, including cash and equivalents, restricted cash, accounts receivable, accounts payable, accrued liabilities and short-term debt, the carrying amounts approximate their fair values due to their short maturities. ASC Topic 820, “Fair Value Measurements and Disclosures,” requires disclosure of the fair value of financial instruments held by the Company. ASC Topic 825, “Financial Instruments,” defines fair value, and establishes a three-level valuation hierarchy for disclosures of fair value measurement that enhances disclosure requirements for fair value measures. The carrying amounts reported in the consolidated balance sheets for receivables and current liabilities each qualify as financial instruments and are a reasonable estimate of their fair values because of the short period of time between the origination of such instruments and their expected realization and their current market rate of interest. The three levels of valuation hierarchy are defined as follows:
Level 1 inputs to the valuation methodology are quoted prices for identical assets or liabilities in active markets.
Level 2 inputs to the valuation methodology include quoted prices for similar assets and liabilities in active markets, and inputs that are observable for the asset or liability, either directly or indirectly, for substantially the full term of the financial instrument.
Level 3 inputs to the valuation methodology are unobservable and significant to the fair value measurement.
The Company analyzes all financial instruments with features of both liabilities and equity under ASC 480, “Distinguishing Liabilities from Equity,” and ASC 815.
As of September 30, 2013, the Company did not identify any assets and liabilities that are required to be presented on the balance sheet at fair value.
Earnings per Share (EPS)
Basic EPS is computed by dividing income available to common shareholders and equivalents by the weighted average number of common shares and equivalents outstanding for the period. Diluted EPS is computed similar to basic net income per share except that the denominator is increased to include the number of additional common shares that would have been outstanding if all the potential common shares, warrants and stock options had been issued and if the additional common shares were dilutive. Diluted EPS is based on the assumption that all dilutive convertible shares and stock options were converted or exercised. Dilution is computed by applying the treasury stock method for the outstanding options and the if-converted method for the outstanding convertible preferred shares. Under the treasury stock method, options and warrants are assumed to be exercised at the beginning of the period (or at the time of issuance, if later), and as if funds obtained thereby were used to purchase common stock at the average market price during the period. Under the if-converted method, convertible outstanding instruments are assumed to be converted into common stock at the beginning of the period (or at the time of issuance, if later).
The following table sets for the computation of basic and diluted earnings per share for the quarters ended September 30, 2013 and 2012:
|
9/30/13
|
9/30/12
|
|||||||
|
|
||||||||
|
Net (loss) income
|
$ | (301,120 | ) | $ | 154,105 | |||
|
Weighted average shares outstanding – basic
|
10,373,128
|
5,300,000 | ||||||
|
Effect of dilutive securities:
|
||||||||
|
Options issued
|
- | - | ||||||
|
Weighted average shares outstanding – diluted
|
10,373,128
|
5,300,000 | ||||||
|
Net (loss) income per share – basic
|
$ | (0.029 | ) | $ | 0.029 | |||
|
Net (loss) income per share – diluted
|
$ | (0.029 | ) | $ | 0.029 | |||
9
The options to purchase up to 41,249 shares of common stock were anti-dilutive during the quarter ended September 30, 2013.
Goodwill
Goodwill represents the excess of the purchase price over the fair value of the net assets acquired in a business combination. Goodwill is not amortized but is evaluated for impairment at the reporting unit level annually as of June 30, or more frequently if events or changes in circumstances indicate that impairment may exist.
Effective October 1, 2011, the Company adopted ASU 2011-08, which allows the Company to first assess qualitative factors to determine whether it is more likely than not that the fair value of a reporting unit is less than its carrying value. This step serves as the basis for determining whether it is necessary to perform the two-step goodwill impairment test. The two-step test first compares the fair value of the reporting unit to its carrying value. If the fair value exceeds the carrying value, no impairment exists, and the second step is not performed. If the fair value is less than the carrying value, the second step is performed to compute the amount of the impairment by comparing the implied fair value of reporting unit goodwill with the carrying amount of that goodwill. The adoption did not have a material impact on the consolidated financial statements.
The Company evaluated its goodwill for impairment on September 30, 2013, and concluded there was no impairment as of that date.
Intangible Assets
The Company records identifiable intangible assets at fair value on the date of acquisition and evaluates the useful life of each asset. Finite-lived intangible assets primarily consist of software development capitalized. Finite-lived intangible assets are amortized on a straight-line basis and are tested for recoverability if events or changes in circumstances indicate that their carrying amounts may not be recoverable. These intangibles have useful lives ranging from 1 to 10 years. No events or changes in circumstances indicate that impairment existed as of September 30, 2013.
Stock-Based Compensation
We recognize all share-based payments to employees and to non-employee directors as compensation for service on our board of directors as compensation expense in the consolidated financial statements based on the fair values of such payments. Stock-based compensation expense recognized each period is based on the value of the portion of share-based payment awards that is ultimately expected to vest during the period. Forfeitures are estimated at the time of grant and revised, if necessary, in subsequent periods if actual forfeitures differ from those estimates.
For share-based payments to consultants and other third-parties, compensation expense is determined at the “measurement date.” The expense is recognized over the vesting period of the award. Until the measurement date is reached, the total amount of compensation expense remains uncertain. We record compensation expense based on the fair value of the award at the reporting date. The awards to consultants and other third-parties are then revalued, or the total compensation is recalculated based on the then current fair value, at each subsequent reporting date.
Recently Issued Accounting Pronouncements
In July 2013, the FASB issued an accounting standards update intended to provide guidance on the presentation of unrecognized tax benefits, reflecting the manner in which an entity would settle, at the reporting date, any additional income taxes that would result from the disallowance of a tax position when net operating loss carryforwards, similar tax losses, or tax credit carryforwards exist. This accounting standard will be effective for the Company beginning June 1, 2014; early adoption is permitted. The Company has early adopted this guidance and the adoption did not have a material impact on the Company's consolidated financial position or results of operations.
10
Note 2 – TRADE RECEIVABLES, NET
As of September 30, 2013 and June 30, 2013, trade receivables consist of the following:
|
9/30/2013
|
6/30/2013
|
|||||||
|
Trade receivables
|
$ | 29,030,945 | $ | 27,740,315 | ||||
|
Allowance for bad debt
|
(838,281 | ) | (731,475 | ) | ||||
|
Total trade receivables, net
|
$ | 28,192,664 | $ | 27,008,840 | ||||
Note 3 – DEFERRED TAX ASSETS
As of September 30, 2013 and June 30, 2013, the Company had deferred tax assets of $1,702,790 and $1,707,627 respectively. The Company had approximately $5,694,583 as of September 30, 2013 and $5,692,050 as of June 30, 2013 in net operating loss (“NOL”) carry forward available to offset future taxable income in Australia. The NOLs can be carried forward without expiration in Australia.
The deferred tax asset as of September 30, 2013 and June 30, 2013 consists of the tax benefit of the NOL carryforward. Management believes that all NOLs will be utilized in the near future and therefore no allowance was provided. Accordingly, the company as of September 30, 2013 and June 30, 2013 has deferred tax asset of:
|
9/30/2013
|
6/30/2013
|
|||||||
|
Current deferred tax assets
|
$ | 186,180 | $ | 718,767 | ||||
|
Non current deferred tax assets
|
1,516,610 | 988,860 | ||||||
|
Deferred tax assets
|
$ | 1,702,790 | $ | 1,707,627 | ||||
Note 4 – OTHER ASSETS
Other assets consist of the following as of September 30, 2013 and June 30, 2013:
|
Other current assets
|
9/30/2013
|
6/30/2013
|
||||||
|
Research and development grant receivable
|
$ | 595,776 | $ | 401,852 | ||||
|
Insurance claim receivable
|
274,751 | 269,556 | ||||||
|
Prepayment
|
96,352 | 66,922 | ||||||
|
Stock based deferred compensation
|
289,876 | - | ||||||
|
Other assets
|
69,453 | 82,396 | ||||||
|
|
$ | 1,326,207 | $ | 820,726 | ||||
|
Other non current assets
|
9/30/2013
|
6/30/2013
|
||||||
|
Deferred payment processing cost
|
$ | 50,000 | $ | 50,000 | ||||
|
Prepaid gift card establishment fees
|
- | 45,973 | ||||||
|
|
$ | 50,000 | $ | 95,973 | ||||
Note 5 – INTANGIBLE ASSETS
Intangible assets consist of the following as of September 30, 2013 and June 30, 2013:
|
9/30/2013
|
6/30/2013
|
|||||||
|
Moneytech and mPayments software
|
$ | 5,964,274 | $ | 5,239,641 | ||||
|
Domain name
|
202,175 | 198,353 | ||||||
|
Accumulated amortization
|
(2,527,369 | ) | (1,925,227 | ) | ||||
| $ | 3,639,080 | $ | 3,512,767 | |||||
The intangible assets are amortized over 10-12 years. Amortization expense of $131,243 and $129,813 were included in cost of revenues for the quarters ended September 30, 2013 and 2012, respectively.
11
Note 6 – GOODWILL
As of September 30, 2013 and June 30, 2013, the Goodwill comprised of the following:
|
9/30/2013
|
6/30/2013
|
|||||||
|
Acquisition cost of Moneytech POS Pty Ltd.
|
$ | 100,072 | $ | 98,180 | ||||
|
Fixed assets received
|
(55,749 | ) | (54,695 | ) | ||||
|
Liability assumed
|
26,065 | 25,572 | ||||||
|
Acquisition cost assigned to goodwill
|
$ | 70,388 | $ | 69,057 | ||||
Note 7 – TRADE AND OTHER PAYABLES
As of September 30, 2013 and June 30, 2013, trade and other payables consist of the following:
|
9/30/2013
|
6/30/2013
|
|||||||
|
Trade payables
|
$ | 4,929,669 | $ | 4,848,656 | ||||
|
Employee benefits
|
259,155 | 279,646 | ||||||
|
Other liabilities
|
44,811 | 122,097 | ||||||
|
Total payables
|
$ | 5,233,635 | $ | 5,250,399 | ||||
Note 8 –CURRENT LIABILITIES
|
|
9/30/2013
|
6/30/2013
|
||||||
|
Wholesale loan facility
|
$ | 27,019,113 | $ | 25,669,388 | ||||
|
Cash reserve
|
2,767,943 | 2,731,094 | ||||||
| $ | 29,787,056 | $ | 28,400,482 | |||||
Wholesale Loan Facility
The Company has a secured line of credit (the “Wholesale Loan Facility” or “RPA” with a bank in Sydney Australia for up to AUD $30,000,000 for the Company to use as of September 30, 2013 and June 30, 2013. The line of credit is secured mainly by trade receivables. Interest is charged at the bank’s reserve rate plus an agreed upon margin from the bank. The agreement is currently set to expire on December 31, 2013 and can be renewed annually in September. The Company has requested the renewal and is awaiting final bank approval. Interest expense charged to cost of revenue related to the loan for the 3 months ended September 30, 2013 and 2012 was approximately USD $465,783 and USD $456,689 , respectively.
Cash Reserve
The Company is required to maintain certain cash reserves with its senior debt provider in accordance with the Receivables Purchase Agreement (RPA) between the parties. The Required Cash Reserve amount may be provided by the Company or its customers and is held in a ‘Cash Reserve Account’ with its senior debt provider in accordance with the RPA’s terms and conditions. The Required Cash Reserve balance is adjusted based on the RPA and the total facility limit provided to the Company by the senior lender.
Note 9 – NON-CURRENT LIABILITY
|
|
9/30/2013
|
6/30/2013
|
||||||
|
Shareholders loans
|
$ | 96,536 | $ | 45,665 | ||||
| $ | 96,536 | $ | 45,665 | |||||
12
Shareholders’ Loan
The company has a loan payable in the amount of AUD $50,000 to a shareholder. The loan is due and payable on September 30, 2014. Interest of 8% is only payable if Moneytech has positive retained earnings at the time of repayment.
The company has a loan payable in the amount of $50,000 to a shareholder. The loan is due and payable on February 21, 2014 with interest of 12%.
Note 10 –STOCKHOLDERS’ EQUITY
Preferred Stock
The Company has 1,000,000 shares Preferred Stock authorized at a par value of $0.01 and there were 5,000 shares of Class B, Preferred Stock issued and outstanding as of September 30, 2013. Under the terms of the Class B Certificate of Designation, the holder(s) of the Series B have the right, until June 30, 2018, to (A) elect the majority of the Company’s Board of Directors and (B) vote on all other matters to come before the holders of common stock (the “Common Shareholders”) with each vote per Series B Preferred Share equal to 1,000 shares of common stock.
After June 30, 2018, the Class B Preferred Shares shall have no voting rights and shall be redeemable by the Company for the sum of one tenth of a cent ($0.001) per Class B Preferred Share. The Class B Preferred Shares will not have any conversion rights and shall not be entitled to receive any dividends, distributions, or other economic or financial interest in the Company, and in the event of a liquidation, dissolution, or winding up of the Company, whether voluntary or involuntary, the holders of Class B Preferred
Common Stock
The Company has 50,000,000 shares of Common Stock authorized at a par value of $0.10 as of September 30, 2013 and 500,000,000 authorized as of June 30, 2013. There were 9,961,637 shares issued and outstanding as of September 30, 2013 and June 30, 2013. The Company has 350,000 shares to be issued as of September 30, 2013. Each Common Stock holder will have one (1) vote.
Note 11 – STOCK COMPENSATION
Restricted shares
On July 23, 2013, the Company entered into a consulting agreement to promote the Company's image in both the industry and capital markets. In connection with the agreements, the Company was to issue 170,631 shares of Common Stock valued at $2.02 (stock price at grant date), and recorded $344,675 as deferred compensation. During the three months ended September 30, 2013, the Company amortized $54,798 as stock-based compensation.
|
Number of
Shares
|
||||
|
Granted but not issued at June 30, 2013
|
338,368
|
|||
|
Issued during quarter ended September 30, 2013
|
-
|
|||
|
Granted during quarter ended September 30, 2013
|
170,632
|
|||
|
Granted but not issued at September 30, 2013
|
509,000
|
|||
13
Note 12 – STOCK OPTIONS
On April 19, 2013, the Company entered into an agreement with a software developer. Upon achievement of certain milestones, the contractor can receive up to 100,000 Performance Based Stock Options at an exercise price of $2.50 per share. The options vest and become exercisable immediately upon grant with a 3 year life. As of September 30, 2013, 10,000 of the Performance Based Stock Options are vested. The FV of the options was calculated using the following assumptions: estimated life of three years, volatility of 351%, risk free interest rate of .35%, and dividend yield of 0%. The grant date FV of options was $249,995.
On July 19, 2013, the Company granted 75,000 Stock Options to each of the three non-employee directors pursuant to the Omnibus Incentive Plan. These Stock Options are exercisable at an exercise price of $2.00 per share. The options vest as to 2,083 shares per non-employee director on September 30, 2013, and as to an additional 2,083 shares each on the last day of each calendar month thereafter through and including August 31, 2016, except that the right to exercise the Options shall vest as to an additional 2,095 shares on the last day of August 31, 2016. The options become exercisable immediately upon vesting and continue in force through June 30, 2020 (the "Expiration Date"), unless sooner terminated as provided herein and in the Plan. The FV of the options was calculated using the following assumptions: estimated life of seven years, volatility of 755 %, risk free interest rate of 2.02%, and dividend yield of 0%. The grant date FV of options was $454,500.
On August 22, 2013, the Company granted 25,000 Stock Options to an employee. These Stock Options are exercisable at an exercise price of $1.30 per share. The options vested and become exercisable immediately upon granting and continue in force through August 22, 2016 (the "Expiration Date"), unless sooner terminated as provided by the agreement. The FV of the options was calculated using the following assumptions: estimated life of three years, volatility of 843%, risk free interest rate of .82%, and dividend yield of 0%. The grant date FV of options was $32,500.
The Company recorded $70,123 option expense in the three months ended September 30, 2013.
The following is a summary of the activity and position as of September 30, 2013.
|
Number of
Stock Options
|
||||
|
Outstanding at June 30, 2013
|
100,000
|
|||
|
Granted
|
250,000
|
|||
|
Exercised
|
-
|
|||
|
Expired
|
-
|
|||
|
Outstanding at September 30, 2013
|
350,000
|
|||
|
Exercisable at September 30, 2013
|
41,249
|
|||
|
Options outstanding at September 30, 2013 are as follows:
|
||||
|
|
Weighted
|
Total
|
|||||||||||
|
Average
|
Weighted
|
Weighted
|
|||||||||||
|
Remaining
|
Average
|
Average
|
|||||||||||
|
Total Options
|
Life
|
Exercise
|
Options
|
Exercise
|
|||||||||
|
Exercise Price
|
Outstanding
|
(Years)
|
Price
|
Exercisable
|
Price
|
||||||||
|
$1.30 to $2.50
|
350,000
|
5.662
|
$ |
1.70
|
41,249
|
$ |
1.70
|
||||||
The fair value of the equity instruments granted was determined using the closing price on the day the shares were granted in the case of shares issued and using the Black and Scholes option valuation model in the case of share options granted.
Note 13 – RELATED PARTY TRANSACTIONS
During the three months ended September 30, 2013 and 2012, the Company paid a company controlled by the President of Source for consulting services in the amount of $26,142 and $29,622, respectively.
14
Note 14 – INCOME TAX
As of September 30, 2013, Moneytech had approximately $5,692,050 in net operating loss (“NOL”) carry forward available to offset future taxable income in Australia. The NOLs can be carried forward without expiration in Australia. The deferred tax asset as of September 30, 2013 and June 30, 2013 consists of the tax benefit of the NOL carry forward. Management believes that all NOLs will be utilized in the near future and therefore no allowance was made.
As of September 30, 2013, Source had NOL’s of approximately $13 million dollars to offset future taxable income in the US. Federal NOLs can generally be carried forward 20 years. However, under Internal Revenue Code section 382 due to the change in ownership there are certain limitations placed on the NOL carryover and Source may only use approximately $161,500 per year of the available NOL. The deferred tax assets of the US entities at September 30, 2013 were fully reserved. Management believes it is more likely than not that these assets will not be realized in the near future.
The following is a reconciliation of the provision for income taxes at the US federal income tax rate to the income taxes reflected in the Statements of Operations and Comprehensive (Loss) Income for the three months ended September 30, 2013 and 2012, respectively:
|
September 30, 2013
|
U.S
|
State
|
International
|
Total
|
||||||||||||
|
Current
|
$ | - | $ | - | $ | - | $ | - | ||||||||
|
Deferred
|
- | - | 40,229 | 40,229 | ||||||||||||
|
Total
|
$ | - | $ | - | $ | 40,229 | $ | 40,229 | ||||||||
|
Total payables
|
||||||||||||||||
|
September 30, 2012
|
U.S
|
State
|
International
|
Total
|
||||||||||||
|
Current
|
$ | - | $ | - | $ | - | $ | - | ||||||||
|
Deferred
|
- | - | 4,928 | 4,928 | ||||||||||||
|
Total
|
$ | - | $ | - | $ | 4,928 | $ | 4,928 | ||||||||
|
Total payables
|
||||||||||||||||
|
Reconciliation of the difference between the statutory U.S. Federal income tax rate and the effective rate is as follows:
|
||||||||
|
9/30/2013
|
9/30/2012
|
|||||||
|
US statutory rates
|
34 | % | 34 | % | ||||
|
Tax rate difference
|
(4 | )% | (4 | )% | ||||
|
Research and development capitalized
|
(12 | )% | - | % | ||||
|
Other expenses (benefits)
|
(33 | )% | (27 | )% | ||||
|
Tax expenses at actual rate
|
(15 | )% | 3 | % | ||||
15
Note 15 - GEOGRAPHIC SEGMENT INFORMATION
As a result of the reverse merger on June 30, 2013 the Company operates in two regions: Australia and United States of America.
All inter-company transactions are eliminated in consolidation. For the quarter ended September 30, 2013 and 2012, geographic segment information is as follows:
|
Three Months Ended September 30, 2013
|
Three Months Ended September 30, 2012
|
|||||||||||||||||||||||||||||||
|
Australia
|
USA
|
Elimination
|
Consolidated
|
Australia
|
USA
|
Elimination
|
Consolidated
|
|||||||||||||||||||||||||
|
Revenue
|
$ | 1,373,452 | $ | 1,639 | $ | - | $ | 1,375,091 | $ | 1,307,305 | $ | - | $ | - | $ | 1,307,305 | ||||||||||||||||
|
Cost of Revenue
|
934,313 | 22,332 | - | 956,645 | 889,062 | - | - | 889,062 | ||||||||||||||||||||||||
|
Total Expenses
|
592,395 | 296,420 | - | 888,815 | 382,702 | - | - | 382,702 | ||||||||||||||||||||||||
|
Other Income (Expense)
|
210,139 | (660 | ) | - | 209,479 | 123,492 | - | - | 123,492 | |||||||||||||||||||||||
|
Net Income (Loss)
|
16,653 | (317,773 | ) | - | (301,120 | ) | 154,105 | - | - | 154,105 | ||||||||||||||||||||||
|
Assets
|
42,333,777 | 558,664 | 42,892,441 | 37,190,011 | - | - | 37,190,011 | |||||||||||||||||||||||||
|
Debt
|
35,057,956 | 59,271 | 35,117,227 | 28,774,919 | - | - | 28,774,919 | |||||||||||||||||||||||||
Note 16 – EQUITY INVESTMENT
On January 16, 2013 the Company entered into an agreement whereby it received a 37.5% equity interest in 360 Market Pty. Limited (“360”) in exchange for allowing 360 to utilize certain license rights. The investment is accounted for by the equity method. For the period from inception to September 30, 2013, 360 incurred a loss and the Company therefore did not recognize any income or return from the investment.
Note 17 –COMMITMENTS
The Company leases two offices under renewable operating leases expiring on August 31, 2014 and July 31, 2015. The aggregate monthly rent is approximately $11,189. For the three months ended September 30, 2013 and 2012, the rental expense was $35,648 and $33,015, respectively.
Future minimum rental payments required under operating leases as of September 30, 2013 are as follows:
|
June 30, 2014
|
$ | 106,478 | ||
|
2015
|
12,800 | |||
| $ | 119,278 |
Note 18 –SUBSEQUENT EVENTS
Management has evaluated events subsequent through November 18, 2013 for transactions and other events that may require adjustment of and/or disclosure in such financial statements and these included:
|
|
·
|
On October 3, 2013 the Company amended and restated the certificate of incorporation to decrease the number of authorized shares of common stock and preferred stock to 50,000,000 and 1,000,000 respectively. The Company also reduced the par value of the common stock to $0.001 from $0.10.
|
16
Item 2. Management’s Discussion and Analysis of Financial Condition and Results of Operations
The following discussion and analysis of our Company’s financial condition and results of operations should be read in conjunction with our unaudited consolidated financial statements and the related notes included elsewhere in this report and with the consolidated financial statements and notes thereto included in the Company’s Annual Report on Form 10-K for the year ended June 30, 2013. This discussion contains forward-looking statements that involve risks and uncertainties. Actual results and the timing of selected events could differ materially from those anticipated in these forward-looking statements.
Overview
Using cutting edge technology, we provide commercial trade financing, money transfer and other financial services to small and medium sized businesses and individuals. Our services are offered in Australia through our subsidiary, Moneytech Limited and its subsidiaries and, in the United States through our subsidiary, WikiTechnologies, Inc.
On June 30, 2013, we acquired Moneytech in exchange for 5,300,000 shares of our common stock (the “Share Exchange”). As a result of the Share Exchange, Moneytech has become our wholly-owned subsidiary, and the former shareholders of Moneytech own in excess of 50% of our outstanding shares of common stock on a fully diluted basis. In connection with acquisition of Moneytech, we issued 5,000 shares of our Series B Preferred Stock to Hugh Evans, the Chairman and Managing Director of Moneytech. The Series B Shares enable Mr. Evans, until June 30, 2018, to (A) elect the majority of our Board of Directors and (B) vote on all other matters presented to the holders of our common stock (the “Common Shareholders”), with each vote per Series B Share equal to 1,000 shares of common stock. After June 30, 2018, the Series B Shares will have no voting rights and may be redeemed by us for a per share price one tenth of a cent ($0.001).
The Share Exchange was accounted for as a recapitalization of Moneytech effected by a share exchange, where Moneytech is considered the acquirer for accounting and financial reporting purposes. Our net assets and liabilities as of the date of the consummation of the Share Exchange were brought forward at their book value and no goodwill was recognized. Consequently, the historical consolidated financial statements of Moneytech are now the historical financial statements of Source Financial, Inc.
A reorganization of the company structure was effected following the acquisition of Moneytech on June 30, 2013. The following chart reflects our organizational structure as of today:
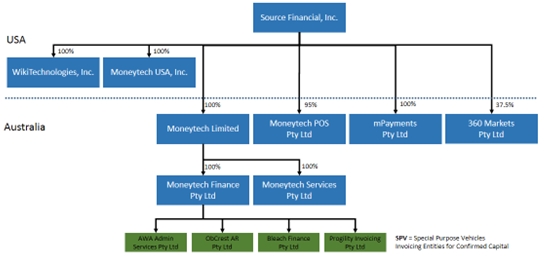
17
Our objective is to become a leading provider of commercial lines of credit and financial services, in particular money transfer services, to small to medium businesses in Australia and the United States, and a provider of money transfer services to individuals in the United States. We seek to differentiate our services by developing and utilizing cutting edge technologies to deliver our services.
Moneytech currently provides asset backed lines of credit in Australia using funds made available under its Receivables Purchase Facility (“RPA” or “Wholesale Loan Facility”) with one of the four leading Australian banks. We also provide payment aggregation and processing solutions in Australia. For the immediate future we intend to continue to focus on our asset backed credit solutions business in Australia while seeking to expand our money transfer businesses in Australia and the United States. We plan to achieve our growth objectives by signing up new customers for our products in existing markets, expanding the services offered to our customers, entering new international markets, and continuing our research and development efforts to launch new technology driven financial products into both the Australian and United States markets.
WikiTechnologies offers on-line financial services through two platforms: WikiPay, a simple, low-cost alternative to existing mobile and online payment solutions; and WikiLoan, a low-cost peer-to-peer lending solution.
Net income attributable to our shareholders, and the associated return on equity, are the primary metrics by which we judge the performance of our business. Accordingly, we closely monitor the primary drivers of net income:
|
·
|
Net financing income - We track the split between the fee, interest, finance charge and fee income earned on our assets and the interest, finance charges and fees incurred on our Wholesale Facility, and continually monitor the components of our yield and our cost of funds. In addition, we monitor external rate trends, including the Reserve Bank of Australia cash rate.
|
|
·
|
Net bad debt losses - Other than our cost of funds, interest expense and related fees, the largest driver of business profitability is the minimization of bad debts. Each asset backed line of credit is priced based on industry and individual customer risk profile. Delinquencies negatively impact our business performance. Our profitability is directly connected to net credit losses; therefore, we closely analyze credit performance and seek to limit our exposure when feasible through the purchase of credit insurance.
|
|
·
|
Costs and expenses - We assess our operational efficiency using our cost-to-income ratio. We perform extensive analysis to determine whether observed fluctuations in cost and expense levels indicate a trend or are the nonrecurring impact of large projects. Our cost and expense analysis also includes a loan- and portfolio-level review of origination and servicing costs to assist us in assessing profitability by pool and vintage. Portfolio volume and rate of turnover determine the magnitude of the impact of each of the above factors on our earnings, we also closely monitor new business volume and business growth.
|
The accounts of Source and its wholly owned subsidiaries are maintained, and its consolidated financial statements are expressed, in Australian dollars. Such financial statements were translated into United States Dollars with the AUD as the functional currency to prepare the consolidated financial statements included in this Report. All assets and liabilities were translated at the exchange rate at the balance sheet date, stockholder’s equity is translated at the historical rates and income statement items are translated at the average exchange rate for the period. Transactions in foreign currencies are initially recorded at the functional currency rate ruling at the date of transaction. Any differences between the initially recorded amount and the settlement amount are recorded as a gain or loss on foreign currency transaction in the consolidated statements of operations. The resulting translation adjustments are reported under other comprehensive income as a component of shareholders’ equity.
Results of Operations
The following discussion of our results of operations constitutes management’s review of the factors that affected our financial and operating performance for the three months ended September 30, 2013 (“Q1 2014”) and September 30, 2012 (“Q1 2013”). This discussion should be read in conjunction with the consolidated financial statements and notes thereto contained elsewhere in this report.
18
Set forth below are certain items from our operating statements for Q1 2014 and Q1 2013:
|
Quarter Ended
|
Quarter Ended |
Dollar
|
Percentage
|
|||||||||||||
| September 30, | September 30, |
Increase
|
Increase
|
|||||||||||||
|
2013
|
2012
|
(Decrease)
|
(Decrease)
|
|||||||||||||
|
Revenue
|
1,375,091 | 1,307,305 | 67,786 | 5 | % | |||||||||||
|
Costs of sales
|
956,645 | 889,062 | 67,583 | 8 | % | |||||||||||
|
Gross profit
|
418,446 | 418,243 | 203 | 0 | % | |||||||||||
|
Compensation expenses
|
117,553 | 154,929 | (37,375 | ) | -24 | % | ||||||||||
|
Research and development expense
|
109,398 | 118,057 |
(8,659
|
) | -7 | % | ||||||||||
|
Bad debt expenses
|
220,993 | 6,950 | 214,043 | 3080 | % | |||||||||||
|
Occupancy expenses
|
61,918 | 58,627 | 3,291 | 6 | % | |||||||||||
|
Depreciation expense
|
42,260 | 34,795 | 7,465 | 21 | % | |||||||||||
|
General and administration expenses
|
336,694 | 9,344 | 327,350 | 3503 | % | |||||||||||
|
(Loss) Income from operations
|
(470,370 | ) | 35,541 | (505,911 | ) | -1423 | % | |||||||||
|
Other income
|
209,479 | 123,492 | 85,987 | 70 | % | |||||||||||
|
(Loss) Income before income tax
|
(260,891 | ) | 159,033 | (419,924 | ) | -264 | % | |||||||||
|
Income tax expense
|
40,229 | 4,928 | 35,301 | 716 | % | |||||||||||
|
Net (loss) income
|
(301,120 | ) | 154,105 | (455,225 | ) | -295 | % | |||||||||
Revenues
Consolidated revenues from operations for Q1 2014 were approximately $1,375,091, an increase of $67,786 or 5% from our consolidated revenues from operations for Q1 2013 of $1,307,305. Excluding differences attributable to changes in foreign exchange rates, revenues increased 19%. The increase resulted primarily from an increase in interest revenue (10%), an increase in fees charged to new customers to set up their accounts (5%) as well as an increase in revenues at Mpos and mPay (2%). Mpos and mPay are subsidiaries of Moneytech which provide money transfer services, including the issuances of gift cards, in Australia. The increase in interest revenue primarily results from the increase in the lines of credit we funded from approximately $62 million during Q1 2013 to $68 million during Q1 2014.
Cost of Revenue; Gross Profit
Our cost of revenue, which is composed principally of the fees and interest we pay on our RPA and the amortization expense of capitalized research and development costs, was $956,645 in Q1 2014, an increase of $67,583 or 8% from our cost of revenue of $889,062 for Q1 2013. Excluding differences attributable to changes in foreign exchange rates, cost of revenue increased 22%. The increase is primarily the result of increases in interest expense (8%), costs associated with setting up the accounts of new customers (7%), amortization of intangibles (2%) and increased costs at Mpos and mPay (2%). In addition, in Q1 2014 we absorbed costs associated with WikiTechnologies which were not part of our cost structure in Q1 2013. The increase in our cost of revenue primarily results from the growth in the volume of credit lines funded in the current period.
The rates of interest charged to our customers decreased at a slower rate than the decrease in the rate of interest paid to the RPA, Nevertheless our gross margin only experienced a slight increase of $203 from $418,243 in Q1 2013 to $418,446 in Q1 2014 as a result of the increases in the other elements included in our cost of revenue.
19
Operating Expenses; Bad Debt Expense; Income from Operations
Apart from the costs under our RPA, the other significant factor in determining our overall profitability is our operating expenses, in particular our bad debt expense. Our bad debt expense for Q1 2014 was $220,993, representing a substantial increase of $214,043 from bad debt expense of $6,950 for Q1 2013. This increase reflects a return to normalcy from unusually low bad debt expense experienced in Q1 2013 and a provision for a new matter in Q1 2014 not anticipated during the year ended June 30, 2013. We constantly evaluate the credit quality of our customers and expect that the rate of growth in our bad debt expense for the remainder of Fiscal 2014 will be more in line with the rate of growth in our portfolio.
Our total operating expenses (other than bad debt) increased by $292,070 or 78% from $375,752 in Q1 2013 to $667,822 in Q1 2014. This increase is primarily reflected by the inclusion of costs associated with the Wiki business ($171,499 or 59%) and the issuance of restricted stock and options to employees, consultants and non-employee directors of the company ($124,921 or 43%).
Other Income; Provision for income taxes; net income (loss)
To date, our other expense (income) has consisted of financing costs other than those incurred under the RPA, offset by interest income on the cash reserves we are required to maintain under the RPA, and research and development grants received from the government. In Q1 2014 we accrued $120,000 for research grants we expect to receive later this year from the Australian government.
Our net loss before tax for Q1 2014 was $260,891, as opposed to net income of $159,033 for Q1 2013. As a result of $40,229 in taxes incurred in Q1 2014, we incurred a net loss after tax for Q1 2014 of $301,120, as compared to net income after tax for Q1 2013 of $154,105. Operations in Australia (Moneytech) remain profitable while operations in the United States (Wiki and Source) are not yet profitable. This is primarily attributable to a delay in marketing activity in Wiki while expenses continue to be incurred ($171,499) and non-cash expenses in Source ($124,921).
Liquidity and Capital Resources
Our ability to offer asset backed credit lines is determined by the amount of our capital and the amount of funds we can borrow. We require a significant amount of liquidity to offer our asset backed credit lines and our rate of growth and profitability will, for the foreseeable future, largely be determined by our ability to raise equity or borrow funds with which to purchase receivables and the effective cost of such funds.
Comparison of Balance Sheet Data as at September 30, 2013 and June 30, 2013
|
September 30,
2013
|
June 30,
2013
|
|||||||
|
Cash and cash equivalents
|
7,100,551 | 7,205,827 | ||||||
|
Trade Receivables
|
28,192,664 | 27,008,840 | ||||||
|
Total Assets
|
42,892,441 | 41,219,330 | ||||||
|
Wholesale Loan Facility
|
27,019,113 | 25,669,388 | ||||||
|
Total Liabilities
|
35,117,227 | 33,696,546 | ||||||
|
TOTAL EQUITY
|
7,775,214 | 7,522,784 | ||||||
Comparison of the Statement of Cash Flows for the Three Months Ended September 30, 2013 and 2012
|
Quarter Ended
|
Quarter Ended
|
|||||||
|
September 30,
2013
|
September 30,
2012
|
|||||||
|
Net cash provided by (used in) operating activities
|
(889,206 | ) | 633,439 | |||||
|
Net cash provided by (used in) investing activities
|
(227,047 | ) | (202,768 | ) | ||||
|
Net cash provided by (used in) financing activities
|
876,373 | (2,098,268 | ) | |||||
|
Exchange rate effect on cash
|
134,604 | 138,261 | ||||||
|
Net cash inflow (outflow)
|
(105,276 | ) | (1,529,335 | ) | ||||
20
Cash Provided by (Used in) Operating Activities
During the quarter ended September 30, 2013, we used approximately $889,206 of net cash in our operating activities. This reflects our net loss of $301,120 plus $588,086 used by changes in operating assets and liabilities net of adjustments for non-cash items. Cash used in working capital items was primarily impacted by an increase in trade receivables of $653,081, reflecting an increase in the volume of credit lines provided and other items which used $238,528. Adjustments for non-cash items consisted of depreciation and amortization in the amount of $178,601 and stock options and shares issued for compensation of $124,921.
During the quarter ended September 30, 2012, we generated approximately $633,439 of net cash from our operating activities. This reflects our net income of $154,105 plus cash provided by changes in operating assets and liabilities and adjustments for non-cash items. Cash provided by working capital items and other activities was primarily impacted by a decrease in trade receivables of $2,357,247, reflecting a decrease in the volume of credit lines provided, substantially offset by a decrease in trade payables of $2,268,757 and other items providing $220,052. Adjustments for non-cash items consisted entirely of depreciation and amortization $170,923.
Cash Provided by (Used in) Investing Activities
During the quarter ended September 30, 2013, net cash used in investing activities of $227,047 was primarily impacted by $146,640 in capitalized costs incurred on the development of intangible assets, principally software related to the Moneytech Exchange and mPay.
During the quarter ended September 30, 2012, net cash used in investing activities of $202,768 primarily reflects capitalized costs incurred on the development of intangible assets, principally software related incurred in the development of the Moneytech Exchange.
Cash Used in Financing Activities
During the quarter ended September 30, 2013, net cash provided by financing activities of $876,373 primarily reflects an increase in our borrowings under the Wholesale Loan Facility of $841,919. Contributions to our capital reserve account received from our customers of $61,362 and loans advanced of $95,816 account for the difference.
During the quarter ended September 30, 2012 net cash provided by financing activities of $2,098,268 primarily reflects an increase in our borrowings under the Wholesale Loan Facility of $2,261,805. Contributions to our capital reserve account received from our customers of $192,192 and loans repaid of $28,585 account for the difference.
Credit Facility
In 2005 we entered into a Receivables Purchase Agreement (the “Wholesale Facility” or the “RPA”) with one of the “Big Four” Australian Banks which has been renewed annually each year thereafter. Pursuant to this Agreement we electronically offer eligible receivables to our lender for purchase on a nightly basis. These offerings are then settled by the lender on a daily basis. The funds we receive upon settlement are automatically and electronically delivered to our customers. Our gross profit is represented by the difference between what we charge our customers in interest, finance charges and fees and what we pay to our lender. Our borrowing limit under the RPA is AUD$50 million, subject to interim agreed upon limits determined by various tests and covenants which currently limit our borrowing capacity to AUD $30 million. As at September 30, 2013 the total amount drawn against the facility was $27,019,113.
21
We pay an interest rate on all borrowed monies under the RPA which is directly linked to the Reserve Bank of Australia cash-rate, a utilization fee charged on monies available to be borrowed but not utilized, an annual line fee and fees for electronically accessing the facility. The Facility contains a number of covenants relating to our financial performance and performance of our receivables portfolio including but not limited to net profit targets, maximum dilution ratios, concentration limits, maximum delinquency ratios and cash reserve requirements. As of the date hereof we are in compliance with all covenants imposed by the RPA.
We, in turn, provide our customers with funds provided by the RPA. We charge each of our clients, interest at a rate above that charged by our lender and seek to have our clients pay a fee corresponding to each of the fees charged to us in respect of their loans. To the extent that the RPA requires that we deposit monies into an account to partially secure repayment of our loans, we seek to have those funds advanced by our customers as a condition of their credit lines. The cash reserve we are required to maintain pursuant to the RPA is included under Cash and cash equivalents on our balance sheet.
Commitments for Capital Expenditures
We do not have any commitments for capital expenditures. Further, the design and technical development of the Moneytech Exchange is completed and it is operational. Although we will continue to upgrade and add additional functionality to the Moneytech Exchange and will need to add additional personnel as we grow, the rate of growth of these expenses should be less than the rate of growth of our revenue. Further, we anticipate that as we expand our portfolio and increase the number of services we offer, the rate of growth in the lines of credit we service and in our revenues will exceed the rate of growth in our operating expenses. There are a number of reasons for this, the most significant being that most of the expense involved with any debtor/obligor is incurred when the relationship is established. In the absence of a default or other triggering event, so long as a debtor/obligor is online, it generates revenue for us with little impact on our operating expenses. We do anticipate a slight increase in the rate of growth of our operating expenses this year due to, among other factors, the fact that Moneytech’s operational financial statements do not include any of the expenses associated with being a public company nor the expenses to be incurred by WikiTechnologies
Off Balance Sheet Items
We do not have any off-balance sheet arrangements, financings, or other relationships with unconsolidated entities or other persons, also known as “special purpose entities” (SPEs).
Critical Accounting Policies
Use of Estimates
Our discussion and analysis of our financial condition and results of operations are based upon our consolidated financial statements, which have been prepared in accordance with accounting principles generally accepted in the United States. The preparation of these financial statements requires us to make estimates and judgments that affect the reported amounts of assets, liabilities, revenues and expenses, and related disclosure of contingent assets and liabilities. We continually evaluate our estimates, including those related to bad debts, recovery of long-lived assets, income taxes, and the impact of changes in currency exchange rates. We base our estimates on historical experience and on various assumptions that we believe to be reasonable under the circumstances, the results of which form the basis for making judgments about the carrying values of assets and liabilities that are not readily apparent from other sources. Any future changes to these estimates and assumptions could cause a material change to our reported amounts of revenues, expenses, assets and liabilities. Actual results may differ from these estimates under different assumptions or conditions. While our significant accounting policies are described in Note 2 to our consolidated financial statements, we believe the following accounting policies are the most critical to aid you in fully understanding and evaluating our financial statements and our management’s discussion and analysis.
The preparation of financial statements in conformity with US GAAP requires management to make certain estimates and assumptions that affect the reported amounts of assets and liabilities and disclosure of contingent assets and liabilities at the date of the financial statements and the reported amounts of revenues and expenses during the reporting period. Actual results could differ from those estimates. Significant estimates include collectability of accounts receivable and recoverability of long-term assets.
Allowance for Doubtful Accounts
The Company maintains reserves for potential credit losses on accounts receivable. Management reviews the composition of accounts receivable and analyzes historical bad debts, customer concentrations, customer credit worthiness, current economic trends and changes in customer payment patterns to evaluate the adequacy of these reserves.
Revenue Recognition
Revenue is recognized when persuasive evidence of an arrangement exists, delivery has occurred, the fee is fixed or determinable, and collectability is probable. Revenue generally is recognized net of allowances for returns and any taxes collected from customers and subsequently remitted to governmental authorities.
Concentration of Credit Risk
Financial instruments that potentially subject the Company to concentrations of credit risk are cash, accounts receivable and other receivables arising from its normal business activities. The Company places its cash in what it believes to be credit-worthy financial institutions. The Company has a diversified customer base, most of which are in Australia. The Company controls credit risk related to accounts receivable through credit approvals, credit limits and monitoring procedures. The Company routinely assesses the financial strength of its customers and, based upon factors surrounding the credit risk, establishes an allowance, if required, for uncollectible accounts and, as a consequence, believes that its accounts receivable credit risk exposure beyond such allowance is limited.
Cost of Revenue
Cost of revenue includes; programs licensed; operating costs including costs of funds and related product support service centers to drive traffic to our websites, costs incurred to support and maintain products and services, including inventory valuation adjustments; costs associated with the delivery of consulting services; and the amortization of capitalized intangible software costs. Capitalized intangible software costs are amortized over the estimated lives of the products.
Exchange (Loss) Gain
During the three months ended September 30, 2013 and 2012, the transactions of Moneytech and its wholly owned subsidiaries were denominated in foreign currency and were recorded in Australian dollar (AUD) at the rates of exchange in effect when the transactions occurred. Exchange gains and losses are recognized for the different foreign exchange rates applied when the foreign currency assets and liabilities are settled.
Foreign Currency Translation and Comprehensive (Loss) Income
The accounts of Moneytech and its wholly owned subsidiaries were maintained, and its financial statements were expressed, in AUD. Such financial statements were translated into USD with the AUD as the functional currency. All assets and liabilities were translated at the exchange rate at the balance sheet date, stockholder’s equity is translated at the historical rates and income statement items are translated at the average exchange rate for the period. Transactions in foreign currencies are initially recorded at the functional currency rate ruling at the date of transaction. Any differences between the initially recorded amount and the settlement amount are recorded as a gain or loss on foreign currency transaction in the consolidated statements of operations. The resulting translation adjustments are reported under other comprehensive income as a component of shareholders’ equity.
|
Item 3.
|
Quantitative and Qualitative Disclosures about Market Risk
|
Not applicable as the Company is a smaller reporting company
22
|
Item 4.
|
Controls and Procedures
|
|
a)
|
Disclosure Controls and Procedures
|
Our disclosure controls and procedures are designed to ensure that information required to be disclosed in reports that we file or submit under the Securities Exchange Act of 1934 is recorded, processed, summarized and reported within the time periods specified in the rules and forms of the United States Securities and Exchange Commission. Our Chief Executive Officer and Chief Financial Officer have reviewed the effectiveness of our “disclosure controls and procedures” (as defined in the Securities Exchange Act of 1934 Rules 13a-15(f) and 15d-15(f) as of the end of the period covered by this report and have concluded that the disclosure controls and procedures are effective.
|
b)
|
Changes in Internal Control over Financial Reporting
|
There have been no changes in the Company’s internal control over financial reporting during the last quarterly period covered by this report that have materially affected, or are reasonably likely to materially affect, the Company’s internal control over financial reporting.
PART II OTHER INFORMATION
|
Item 1A.
|
Risk Factors
|
Our business is subject to numerous risks and uncertainties including but not limited to those discussed in "Risk Factors" in our Annual Report on Form 10-K for fiscal year ended June 30, 2013, filed with the Securities and Exchange Commission on October 15, 2013 which are incorporated by reference into this report.
23
|
Item 6.
|
Exhibits
|
The following exhibits are filed herewith:
|
Exhibit
Number
|
Document
|
|
|
31.1
|
Certifications pursuant to Rule 13a-14(a) or 15d-14(a) under the Securities Exchange Act of 1934, as amended, as adopted pursuant to Section 302 of the Sarbanes-Oxley Act of 2002.
|
|
|
31.2
|
Certifications pursuant to Rule 13a-14(a) or 15d-14(a) under the Securities Exchange Act of 1934, as amended, as adopted pursuant to Section 302 of the Sarbanes-Oxley Act of 2002.
|
|
|
32.1
|
Certifications pursuant to 18 U.S.C. Section 1350, as adopted pursuant to Section 906 of the Sarbanes-Oxley Act of 2002.
|
|
|
32.2
|
Certifications pursuant to 18 U.S.C. Section 1350, as adopted pursuant to Section 906 of the Sarbanes-Oxley Act of 2002.
|
|
24
SIGNATURES
In accordance with the requirements of the Exchange Act, the Company caused this report to be signed on its behalf by the undersigned, thereunto duly authorized.
|
SOURCE FINANCIAL, INC.
|
|||
|
November 19, 2013
|
By:
|
/s/ Hugh Evans
|
|
|
Hugh Evans
Chief Executive Officer
(Principal Executive Officer)
|
|||
|
November 19, 2013
|
By:
|
/s/ Brian M. Pullar
|
|
|
Brian M. Pullar
Chief Financial Officer
(Principal Financial and Accounting Officer)
|
|||
25