Attached files
| file | filename |
|---|---|
| 8-K - FORM 8-K - Intercontinental Exchange, Inc. | t77844_8k.htm |
Exhibit 99.1

ICE Strategic & Financial Update November 19, 2013

CAUTIONARY STATEMENT REGARDING FORWARD LOOKING STATEMENTS This presentation contains “forward - looking statements” made pursuant to the safe harbor provisions of the Private Securities Litigation Reform Act of 1995 . Statements regarding our business that are not historical facts are forward - looking statements that involve risks, uncertainties and assumptions that are difficult to predict . These statements are not guarantees of future performance and actual outcomes and results may differ materially from what is expressed or implied in any forward - looking statement . The factors that might affect our performance include, but are not limited to : our business environment and industry trends ; conditions in global financial markets ; domestic and international economic conditions ; volatility in commodity prices and price volatility of financial contracts such as equity indexes and foreign exchange ; our ability to realize the anticipated benefits of the NYSE Euronext acquisition within the expected time frame, and successfully integrate NYSE Euronext’s operations ; our ability to separate Euronext and Liffe and spin off Euronext ; changes in laws and regulations ; increasing competition and consolidation in our industry ; our ability to identify and effectively pursue acquisitions and strategic alliances and successfully integrate the companies we acquire on a cost - effective basis ; the success of our clearing houses and our ability to minimize the risks associated with operating multiple clearing houses in multiple jurisdictions ; our ability to comply with regulatory requirements ; the performance and reliability of our technology and third party service providers ; technological developments, including ensuring that the technology we utilize is not vulnerable to security risks ; the accuracy of our cost estimates and expectations ; our belief that cash flows will be sufficient to service our debt and fund our working capital needs and capital expenditures for the foreseeable future ; our ability to refinance our debt as planned ; our ability to develop new products and services on a timely and cost - effective basis ; leveraging our risk management capabilities ; maintaining existing market participants and attracting new ones ; protecting our intellectual property rights ; not violating the intellectual property rights of others ; potential adverse litigation results ; our belief in our electronic platform and disaster recovery system technologies ; and identification of trends and how they will impact our business . For a discussion of such risks and uncertainties, which could cause actual results to differ from those contained in the forward - looking statements, see ICE’s Securities and Exchange Commission (SEC) filings, including, but not limited to, the risk factors in ICE’s most recent Annual Report on Form 10 - K for the year ended December 31 , 2012 , as filed with the SEC on February 6 , 2013 , and the risk factors in NYSE Euronext’s SEC filings and the joint proxy statement/prospectus of IntercontinentalExchange Group, Inc . , as filed with the SEC on April 30 , 2013 . These filings are also available in the Investors & Media section of our website . Although we believe that the expectations reflected in the forward - looking statements are reasonable, we cannot guarantee future results, levels of activity, performance or achievements . We caution you not to place undue reliance on these forward - looking statements . Any forward - looking statement speaks only as of the date on which such statement is made, and we undertake no obligation to update any forward - looking statement or statements to reflect events or circumstances after the date on which such statement is made or to reflect the occurrence of an unanticipated event . New factors emerge from time to time, and it is not possible for management to predict all factors that may affect our business and prospects . Further, management cannot assess the impact of each factor on the business or the extent to which any factor, or combination of factors, may cause actual results to differ materially from those contained in any forward - looking statements . GAAP AND NON - GAAP RESULTS This presentation includes non - GAAP measures that exclude certain items the company does not consider reflective of our core business performance . We believe that the presentation of these measures provides investors with greater transparency and supplemental data relating to our financial condition and results of operations . These non - GAAP measures should be considered in context with our combined GAAP results . The reconciliation of Adjusted Operating Expense, Operating Income, Operating Margin and Net Income Attributable to ICE/NYSE Euronext to the equivalent GAAP results appear in the appendix to this presentation and our past SEC filings and information posted on our website, which include an explanation of why we deem these non - GAAP measures meaningful . This presentation is available in the Investors & Media section of our website at www . theice . com and is also available in our Current Report on Form 8 - K filed with the SEC on November 19 , 2013 . Safe Harbor 2
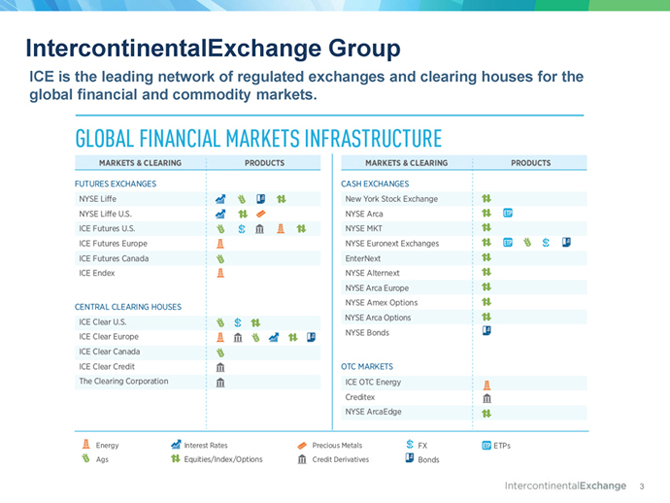
IntercontinentalExchange Group ICE is the leading network of regulated exchanges and clearing houses for the global financial and commodity markets. 3

Strategic Opportunities Capitalize on Clearing Leadership ▪ Driving greater operational and capital efficiencies for market participants ▪ Well - positioned to serve regulatory mandates to clear swaps in US and EU ▪ Leading global CDS clearing houses ▪ Addition of 6th clearing house in Asia; reflects regionalization due to reg reform Build on Strength in Listings, Equities & Equity Options ▪ Build on NYSE leadership in global listings, with focus on technology and international ▪ Leverage globally recognized unique DMM market model ▪ Support greater market stability and confidence with prudent trading policies ▪ Extend technology capabilities of leading equity options business Futures Market Expansion ▪ Grow franchise for financial and commodities futures markets in US, EU and Asia ▪ Global energy leader – hosts >50% of the world’s oil futures trading ▪ Premier interest rates complex across US, Europe; new product opportunities ▪ Strategically positioned to enable migration of OTC markets on - exchange OTC Opportunities Remain ▪ Leader in enhancing market transparency and standardization ▪ Seamless transition of ~800 energy swaps to futures in 2012 ▪ Additional OTC market opportunities across rates, FX and equities ▪ Deliver solutions for financial reform across SEF, SDR, clearing and data Ability to transform markets and drive risk m anagement 4

A Focus on Results Strong Cash Flow & Capital Return ▪ Robust cash flow immediately upon closing, pro - forma ~$1.6 B in TTM Op CF as of 9/30/13 ▪ Rapid projected deleveraging to 1.5x Debt - to - Adj. EBITDA (1) within 18 - 24 months post - close ▪ Flexibility to pursue additional strategic growth opportunities ▪ Dividend beginning 4Q13, $450MM buy - back authorization Successful Integration ▪ Proven integration track record, achievement of synergies and delivery of returns ▪ Significant progress with NYSE Euronext in a short amount of time ▪ Many additional opportunities identified across business lines for growth & efficiency ▪ Improving business cycle; well positioned for economic / market recovery Strong Value Creation ▪ Develop unparalleled depth and breadth of global market infrastructure ▪ Deliver accretion in Year 1 > 20%, higher upon realization of run - rate synergies ▪ Achieve ROIC > Cost of Capital in year 1 ▪ Maintain pay - for - performance culture, and deep management team Synergy Realization & Portfolio Optimization ▪ Exceed original expense synergies of $450MM ▪ Opportunities for revenue synergies with clearing, new product development ▪ Significant savings related to technology, clearing and duplicative expenses Driving best - in - class performance and shareholder returns 5 1. See reconciliation chart on slide 26.

Diversified Across Growth Markets (1) Does not reflect any adjustment for estimated transaction - related non - cash write - down of deferred revenue (2) Other revenues include: NYSE Regulation, Market Connectivity, Co - location, SFTI and other technology services and miscel laneous revenue Exchange - traded Derivatives 44 % Market Data 13% Cash Trading 10% CDS 4% Pro Forma Net Revenue Diversification 3 Q13 LTM Pro Forma Net Revenues: $ 3.7 BN (1) Technology Services & Other 17% 3 Q13 LTM Net Revenues Post - Euronext & Transition of NYXT Businesses CDS 5% 3 Q13 LTM Net Revenues Financials 13% Market Data 13% 3Q13 LTM Pro Forma Net Revenues: $3.1 BN (1) Listings 12% Equity Derivatives 5% Commodities 33% Exchange - traded Derivatives 51% Listings 13% Cash Trading 6% Other (2) 13% Current Business Mix 6
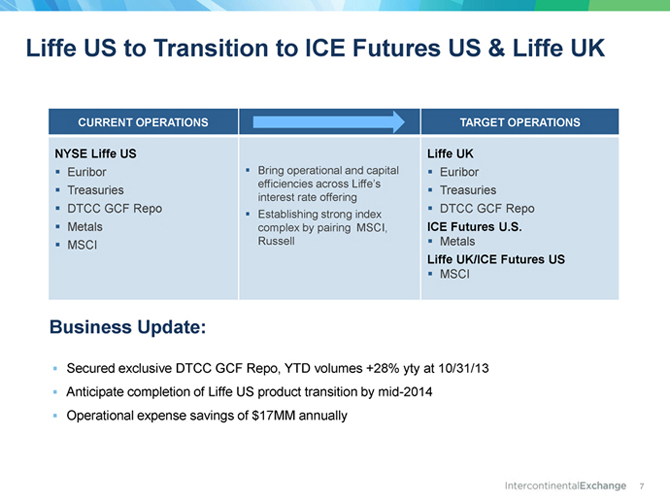
Liffe US to Transition to ICE Futures US & Liffe UK CURRENT OPERATIONS TARGET OPERATIONS NYSE Liffe US ▪ Euribor ▪ Treasuries ▪ DTCC GCF Repo ▪ Metals ▪ MSCI ▪ Bring operational and capital efficiencies across Liffe’s interest rate offering ▪ Establishing strong index complex by pairing MSCI, Russell Liffe UK ▪ Euribor ▪ Treasuries ▪ DTCC GCF Repo ICE Futures U.S. ▪ Metals Liffe UK/ICE Futures US ▪ MSCI ▪ Secured exclusive DTCC GCF Repo, YTD volumes +28% yty at 10/31/13 ▪ Anticipate completion of Liffe US product transition by mid - 2014 ▪ Operational expense savings of $17MM annually Business Update: 7

Euronext Liffe Separation ▪ First priority is to execute on an extensive work plan that has been established with regulators to separate the Euronext and Liffe businesses that merged in 2002 ▪ No strategic opportunities may be pursued with respect to Euronext until separation work is fully completed according to the established work plan, which includes regulatory approvals at multiple junctures ▪ Separation includes implementation of governance changes and development of arm’s - length contracts for licensing technology and shared services ▪ Liffe to gain independent governance via ICE Futures Europe board, which will expanded to include representatives with financial product expertise ▪ Euronext Liffe separation expected to be complete in 1Q14 8
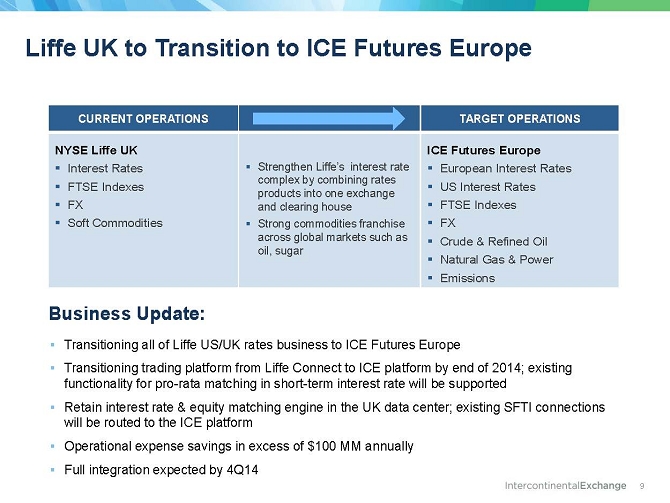
Liffe UK to Transition to ICE Futures Europe CURRENT OPERATIONS TARGET OPERATIONS NYSE Liffe UK ▪ Interest Rates ▪ FTSE Indexes ▪ FX ▪ Soft Commodities ▪ Strengthen Liffe’s interest rate complex by combining rates products into one exchange and clearing house ▪ Strong commodities franchise across global markets such as oil, sugar ICE Futures Europe ▪ European Interest Rates ▪ US Interest Rates ▪ FTSE Indexes ▪ FX ▪ Crude & Refined Oil ▪ Natural Gas & Power ▪ Emissions ▪ Transitioning all of Liffe US/UK rates business to ICE Futures Europe ▪ Transitioning trading platform from Liffe Connect to ICE platform by end of 2014 ; existing functionality for pro - rata matching in short - term interest rate will be supported ▪ Retain interest rate & equity matching engine in the UK data center; existing SFTI connections will be routed to the ICE platform ▪ Operational expense savings in excess of $100 MM annually ▪ Full integration expected by 4Q14 Business Update: 9
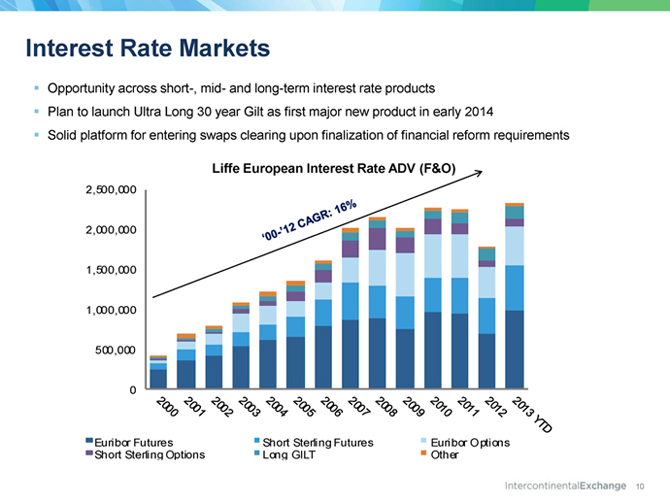
Interest Rate Markets 0 500,000 1,000,000 1,500,000 2,000,000 2,500,000 Euribor Futures Short Sterling Futures Euribor Options Short Sterling Options Long GILT Other ▪ Opportunity across short - , mid - and long - term interest rate products ▪ Plan to launch Ultra Long 30 year Gilt as first major new product in early 2014 ▪ Solid platform for entering swaps clearing upon finalization of financial reform requirements Liffe European Interest Rate ADV (F&O) 10
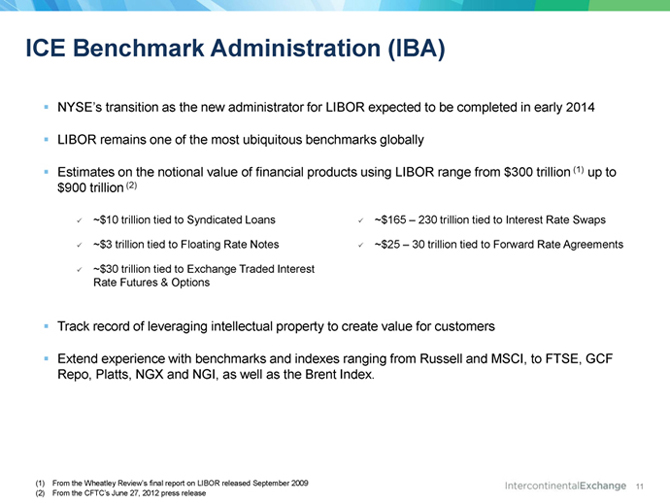
▪ NYSE’s transition as the new administrator for LIBOR expected to be completed in early 2014 ▪ LIBOR remains one of the most ubiquitous benchmarks globally ▪ Estimates on the notional value of financial products using LIBOR range from $300 trillion (1) up to $900 trillion (2) ▪ Track record of leveraging intellectual property to create value for customers ▪ Extend experience with benchmarks and indexes ranging from Russell and MSCI, to FTSE, GCF Repo, Platts, NGX and NGI, as well as the Brent Index. ICE Benchmark Administration (IBA) x ~ $10 trillion tied to Syndicated Loans x ~$3 trillion tied to Floating Rate Notes x ~$30 trillion tied to Exchange Traded Interest Rate Futures & Options x ~ $165 – 230 trillion tied to Interest Rate Swaps x ~$25 – 30 trillion tied to Forward Rate Agreements (1) From the Wheatley Review’s final report on LIBOR released September 2009 (2) From the CFTC’s June 27, 2012 press release 11

Establish Independent Euronext Structure: ▪ Euronext markets in Paris, Amsterdam, Brussels, London and Lisbon & Continental Derivatives ▪ The Euronext perimeter also includes certain commercial technology and exchange solutions that were formerly part of NYXT Key Elements: ▪ European management team and independent board being assembled ▪ ICE to retain a stake in Euronext ▪ Working on completing an IPO by summer 2014 ▪ 723 listed companies as of October 2013 (excluding investment funds) o 656 domestic companies o 67 foreign companies ▪ Supports the CAC 40 Index o Acts as the underlying regional index for derivative contracts ▪ 132 listed companies as of October 2013 o 100 domestic companies o 32 foreign companies ▪ Houses 211 Investment Funds, 9,141 Structured products, 123 ETFs and 1,367 Bonds ▪ Supports the AEX 25 Index o Acts as the underlying regional index for derivative contracts ▪ 158 listed companies as of October 2013 (excluding investment funds) o 128 domestic companies o 30 foreign companies ▪ Supports the BEL 20 Index o Blue - chip index for the Brussels stock market ▪ 49 listed companies as of October 2013 (excluding investment funds) o 46 domestic companies o 3 foreign companies ▪ Supports the PSI 20 Index o Blue - chip index for the Lisbon stock market >$500MM TTM Revenues ~33 - 35% Operating Margins ~ 850 Headcount 12

Pre - eminent Trading & Listing Business $28.6B $7.4B $6.7B $6.5B $5.8B NYSE Euronext Tokyo Nasdaq OMX Brazil LSE YTD 2013 Global IPO Capital Raising - Top 5 by Proceeds $105.3B $32.2B $17.9B $17.4B $16.0B NYSE Euronext Nasdaq OMX LSE Tokyo Hong Kong YTD 2013 Global Follow - On Capital Raising - Top 5 by Proceeds # of Deals # of Deals 72 20 51 6 33 U.S. Cash Equities Trading ▪ Leading market share in cash equities & U.S. equity options ▪ Strong global network, colocation & market data ▪ Focus on market structure improvements NYSE Listings ▪ #1 in global IPO and follow - on proceeds ▪ More IPO and follow - on proceeds raised than next four exchanges combined and ~60% share of technology IPOs ▪ Deepen relationships with issuers and tap new adjacencies 13

Optimize NYXT Portfolio ~$120MM Revenue¹ ~17% EBITDA margin ¹ ~ 600 Headcount ¹ 2014 Estimate; EBITDA margin is a non - GAAP measure and is calculated before corporate allocations. Buy - side Platforms NYFIX ▪ Leading buy - side order and messaging delivery platform, 800 buy - side firms ▪ 11,000 order routing channels ▪ Appia is the leading suite of FIX gateway technology products, deployed in over 1,000 firms in 35 countries Metabit ▪ Leading Japanese EMS and routing network for asset managers and hedge funds ▪ Connectivity to 75 exchanges and 10 dark pools, 100+ individual clients, primarily Japanese firms Market Data Software Data Distribution ▪ Over 200 low latency feed handlers normalizing raw exchange data ▪ Full global coverage across asset classes including equities, derivatives, commodities and FX ▪ SuperFeed product is a hosted, fully managed consolidated feed ▪ SuperFeed aggregates data over 120 markets and delivered over the SFTI network ▪ DART - market data entitlement and usage functionality 14
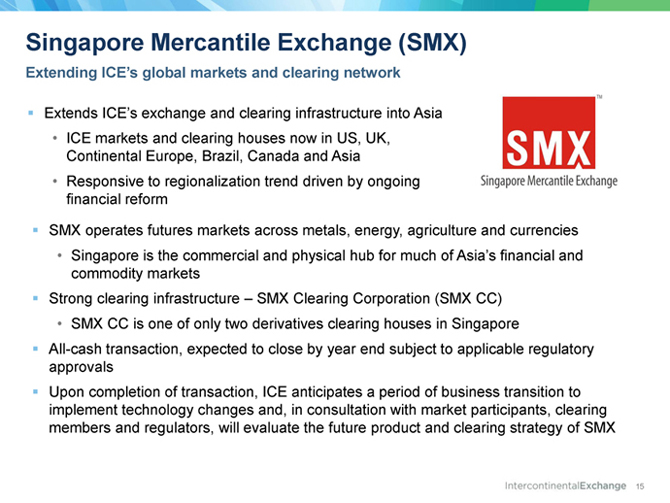
Singapore Mercantile Exchange (SMX) Extending ICE’s global markets and clearing network ▪ Extends ICE’s exchange and clearing infrastructure into Asia • ICE markets and clearing houses now in US, UK, Continental Europe, Brazil, Canada and Asia • Responsive to regionalization trend driven by ongoing financial reform ▪ SMX operates futures markets across metals, energy, agriculture and currencies • Singapore is the commercial and physical hub for much of Asia’s financial and commodity markets ▪ Strong clearing infrastructure – SMX Clearing Corporation (SMX CC) • SMX CC is one of only two derivatives clearing houses in Singapore ▪ All - cash transaction, expected to close by year end subject to applicable regulatory approvals ▪ Upon completion of transaction, ICE anticipates a period of business transition to implement technology changes and, in consultation with market participants, clearing members and regulators, will evaluate the future product and clearing strategy of SMX 15

Combined Trailing Twelve Month (TTM) Financial Highlights Key Financial Adjustments (3) ▪ Non - cash o Elimination of deferred listings revenue - $90MM to $95MM per year o Lower D&A from B/S revaluation to fair market value - $45MM to $50MM per year o Lower Interest Expense from Debt revaluation - $45MM to $50MM per year o Net result is lower revenue, higher margin and negligible earnings impact ▪ $95MM of $450MM synergies achieved o Additional D&A savings raises total operating expense reduction to approximately $500 million ▪ Strong combined cash flows and more efficient capital deployment (1) Represents trailing twelve months ending September 30, 2013 and September 30, 2012, respectively. (2) Represents Non - GAAP measures, as previously presented by each company in its quarterly earnings releases and 8 - K filings. Please see the Appendix of this presentation for the reconciliation to the non - GAAP results. (3) Represents fair market value adjustments to be recorded through purchase price accounting and anticipated synergies, both of whi ch are not reflected in the results in the table. (4) Excludes ICE real estate costs in TTM ‘13 and TTM ’12 and the purchase of the ICE plane in TTM ’12. In millions 16 INCOME STATEMENT TTM '13 (1) TTM '12 (1) Change y/y Total Revenues, less trans-based expenses $3,732 $3,757 -1% Total Operating Expenses $2,228 $2,290 -3% Adj Operating Expenses (2) $2,044 $2,139 -4% Operating Income $1,504 $1,467 3% Adj Operating Income (2) $1,688 $1,618 4% Operating Margin 40% 39% +1pt Adj Operating Margin (2) 45% 43% +2pts Net Income Attributable to ICE Group $1,065 $980 9% Adj Net Income Attributable to ICE Group (2) $1,117 $1,038 8% CASH METRICS TTM '13 (1) TTM '12 (1) Change y/y Operating Cash Flow $1,565 $1,427 10% Cap Ex & Cap SW (4) $191 $214 -11%

Expense Synergies Expect $500MM; $95MM achieved through 3Q13 * Synergy plans developed and in place to achieve a total of ~$500MM * Expect to achieve 70%+ of synergies on a run rate basis exiting 2014 * 90%+ of synergies achieved on a run rate basis exiting 2015 Annual Run-Rate Synergies Description Corporate Integration ~$155MM " Corporate officer redundancies *Organizational restructuring *System & process efficiency improvements *Real estate rationalization Liffe Integration ~$100MM Transition from LCH to ICE *Organizational restructuring *Technology integration Other Business/ Portfolio Rationalization ~$150MM *Transition NYLUS/NYPC to existing ICE entities *Re-segment & rationalize NYXT *Reduced D&A expense due to revaluation of assets Synergies Remaining ~$405MM Total Synergies ~$500MM

$1,260 $600 $800 $12 $55 $73 $250 CP $ 1,350 $850 $0 $250 $500 $750 $1,000 $1,250 $1,500 $1,750 2013 2014 2015 2016 2017 2018 2019 2020 2021 2022 2023 NYX Eurobond ICE 5-Yr Senior Notes ICE 10-Yr Senior Notes Term Loan Facility Commercial Paper NYX Senior Notes 1.4 50 % Debt Structure ▪ Issued $1.4B Senior Notes (A/A3) on October 8 ▪ Target of at or below 1.5x Debt - to - Adj. EBITDA (1) in 18 - 24 months ▪ Intend to refinance bank debt with Commercial Paper (CP), CP to be backstopped by 5 year bank revolver ▪ Estimated cash balance at closing was ~$1.1B ▪ Overall cost of debt around 3% Debt Maturity Schedule as of 11/13/13 closing date 3 18 1. See reconciliation chart on slide 26. 2. CP repayable at any time but maturity shown in 2016 due to the 5 yr revolver backstop. Combined with bank term oans of $390M, total prepayable debt is $1.74B 3. Incorporates $450mm (364 Day Facility) to pay - off the Private Notes and $900mm (5 Year Facility) used to fund $400mm of the cash purchase price and $400mm to payoff the outstanding NYX CP balance at closing along with certain deal fees and expenses. Intend to refinance these bank facilities with commercia l p aper in near term. Debt Outstanding (in $ millions) As of Merger Closing 5.375% NYX Senior Notes (2015) $1,260 (€920) Bank Term Loans (2014-2016) $390 Bank 5 YR/364 Day => CP (2) $1,350 2.00% NYX Senior Notes (2017) $850 2.50% ICE Senior Notes (2018) $600 4.00% ICE Senior Notes (2023) $800 Gross Debt Sub-total $5,250 Debt-to-Adj. EBITDA (1) 2.56x

Guidance & Reporting ▪ Two reporting segments: ICE Group & Euronext ▪ Provide financial information and volumes for our Global Derivatives business (including options) and Cash Equities & Listings Business ▪ Volumes release will reflect combined company beginning in 2014 and move to 3 rd business day of each month. Sections to include: • Commodities (Energy, Agriculture & Metals sub - totals) • Financial (Interest Rates, Indexes & FX) • Equity Derivatives (U.S. Equity Options & Single Stock Equity Derivatives) • U.S. cash equities • Euronext ▪ Historical monthly volumes in new reporting structure to be available in early 2014 Guidance (1) Reporting 19 Key Metrics (1) ICE Group 4Q13 ICE 4Q13 Standalone NYX 4Q13 Standalone Deal Costs (2) $157MM $65MM $92M Expense (3) $330MM $136MM $379MM Tax 27% Interest Expense $25MM D&A $62MM $35MM $67MM (4) Cap Spend (5) $38MM $24MM $26MM Dividend Payment (6) $75MM FY13 Basic Shares Outstanding 114.8MM Weighted Avg. Diluted Share Count 96MM (6) Dividend payable on 12/31/13 to shareholders of record on 12/16/13 with an ex- dividend date of 12/12/13. (1) These figures are illustrative and may differ from actual results. They represent the Company's best estimate as of November 19, 2013. (4) D&A is subject to purchase accounting treatment as a result of the transaction which would reduce this figure by $16MM. (5) Cap Spend includes capital expenditures less real estate and other plus cap labor. (2) Deal costs include $36MM for severance. (3) Expenses do not include a one-time $50MM make whole payment for the prepayment of the $400MM in private notes on October 6, 2013 as well as the impact of deal costs.

Key Milestones 1H14 NYXT Optimization & Liffe Integration End of 2014 70%+ synergies achieved on run rate exiting 2014 In 18-24 Months Debt-to-EBITDA <1.5x 2014 2015 11/13/13 Deal Completion Mid 2014 Euronext / Liffe; Separation & Euronext IPO End of 2014 NYSE Liffe Integration with ICE Futures End of 2015 90%+ synergies achieved on run rate exiting 2015 2014: 20%+ Accretion Continuing to invest for growth & to deliver ROIC above cost of capital
APPENDIX 21

Helpful Website Links ▪ Fact sheet ▪ ICE - NYX Deal ▪ Supplemental Information including volumes and trading days ▪ Management Bios 22

Trailing Twelve Month Calculations 23 Income Statement (in 000's) ICE NYSE Euronext Combined ICE NYSE Euronext Combined Total Revenues, Less Transaction-Based Expenses $1,384,748 $2,347,000 $3,731,748 $1,366,809 $2,390,000 $3,756,809 Total Operating Expenses $565,466 $1,663,000 $2,228,466 $537,352 $1,753,000 $2,290,352 Adjusted Operating Expenses (1) $518,236 $1,526,000 $2,044,236 $534,718 $1,604,000 $2,138,718 Operating Income $819,282 $684,000 $1,503,282 $829,457 $637,000 $1,466,457 Adjusted Operating Income $866,512 $821,000 $1,687,512 $832,091 $786,000 $1,618,091 Operating Margin 59% 29% 40% 61% 27% 39% Adjusted Operating Margin 63% 35% 45% 61% 33% 43% Net Income Attributable to ICE/NYSE Euronext $559,552 $505,000 $1,064,552 $548,877 $431,000 $979,877 Adjusted Net Income Attributable to ICE/NYSE Euronext (2) $589,442 $528,000 $1,117,442 $550,592 $487,000 $1,037,592 Cash Metrics (in 000's) ICE NYSE Euronext Combined ICE NYSE Euronext Combined Operating Cash Flow $722,074 $843,000 $1,565,074 $744,699 $682,000 $1,426,699 Cap Ex and Cap SW $54,055 $137,000 $191,055 $56,713 $157,000 $213,713 (1) Represents total GAAP operating expenses above, net of the operating expense adjustments. Represents total GAAP operating income net of the operating expense adjustments. These adjustments are listed in the ICE and NYSE Euronext Non-GAAP Reconciliations on the following pages. (2) Represents total GAAP net income attributable to ICE/NYSE Euronext above, net of the operating expense adjustments and related tax impact, as listed in the ICE and NYSE Euronext Non-GAAP Reconciliations on the following pages. TTM Ending September 30, 2013 TTM Ending September 30, 2012 TTM Ending September 30, 2013 TTM Ending September 30, 2012

12 Months Ended 9/30/13 12 Months Ended 9/30/12 Net income attributable to ICE $559 $549 Add: NYSE Euronext transaction costs and banker fee relating to other acquisitions (1) 40 - Add: Costs expensed related to the Credit Facilities (1) - 3 Add: Duplicate rent expenses and lease termination costs (1) 7 - Less: Income tax benefit effect related to the items above (17) (1) Adjusted net income attributable to ICE $589 $551 ICE Non - GAAP Reconciliation In millions (1) Adjustments represent a component of operating expense. 24
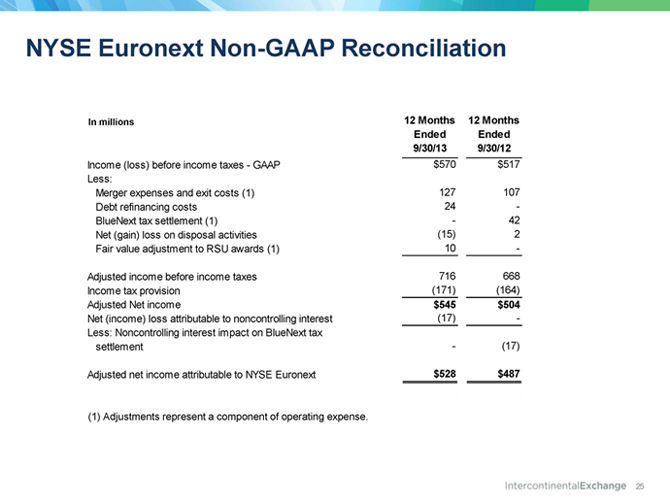
12 Months Ended 9/30/13 12 Months Ended 9/30/12 Income (loss) before income taxes - GAAP $570 $517 Less: Merger expenses and exit costs (1) 127 107 Debt refinancing costs 24 - BlueNext tax settlement (1) - 42 Net (gain) loss on disposal activities (15) 2 Fair value adjustment to RSU awards (1) 10 - Adjusted income before income taxes 716 668 Income tax provision (171) (164) Adjusted Net income $545 $504 Net (income) loss attributable to noncontrolling interest (17) - Less: Noncontrolling interest impact on BlueNext tax settlement - (17) Adjusted net income attributable to NYSE Euronext $528 $487 NYSE Euronext Non - GAAP Reconciliation (1) Adjustments represent a component of operating expense. In millions 25
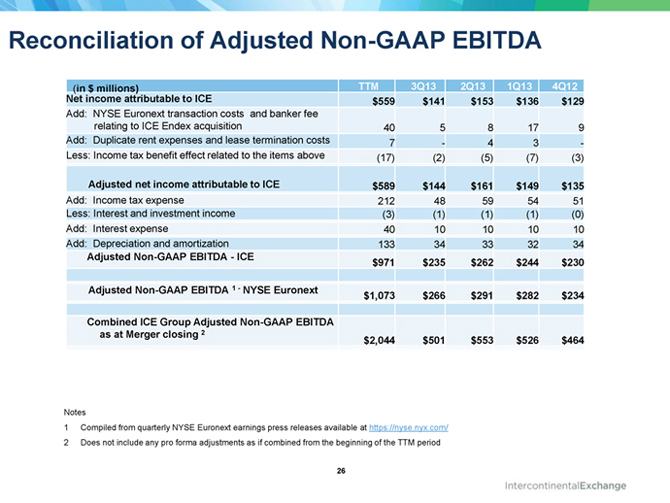
Reconciliation of Adjusted Non - GAAP EBITDA 26 ( in $ millions) T TM 3Q13 2Q13 1Q13 4Q12 Net income attributable to ICE $559 $141 $153 $136 $129 Add: NYSE Euronext transaction costs and banker fee relating to ICE Endex acquisition 40 5 8 17 9 Add: Duplicate rent expenses and lease termination costs 7 - 4 3 - Less: Income tax benefit effect related to the items above (17) (2) (5) (7) (3) Adjusted net income attributable to ICE $589 $144 $161 $149 $135 Add: Income tax expense 212 48 59 54 51 Less: Interest and investment income (3) (1) (1) (1) (0) Add: Interest expense 40 10 10 10 10 Add: Depreciation and amortization 133 34 33 32 34 Adjusted Non - GAAP EBITDA - ICE $971 $235 $262 $2 44 $230 A djusted Non - GAAP EBITDA 1 - NYSE Euronext $1,073 $266 $291 $282 $234 Combined ICE Group Adjusted Non - GAAP EBITDA as at Merger closing 2 $2,044 $501 $ 553 $526 $464 Notes 1 Compiled from quarterly NYSE Euronext earnings press releases available at https://nyse.nyx.com / 2 Does not include any pro forma adjustments as if combined from the beginning of the TTM period