Attached files
| file | filename |
|---|---|
| EX-31.1 - EXHIBIT 31.1 - Intercontinental Exchange, Inc. | ice2017930ex311.htm |
| EX-32.2 - EXHIBIT 32.2 - Intercontinental Exchange, Inc. | ice2017930ex322.htm |
| EX-32.1 - EXHIBIT 32.1 - Intercontinental Exchange, Inc. | ice2017930ex321.htm |
| EX-31.2 - EXHIBIT 31.2 - Intercontinental Exchange, Inc. | ice2017930ex312.htm |
UNITED STATES SECURITIES AND EXCHANGE COMMISSION
Washington, D.C. 20549
Form 10-Q
(Mark One) | |
þ | Quarterly Report Pursuant to Section 13 or 15(d) of the Securities Exchange Act of 1934 |
For the quarterly period ended September 30, 2017 | |
Or | |
¨ | Transition Report Pursuant to Section 13 or 15(d) of the Securities Exchange Act of 1934 |
For the transition period from to | |
Commission File Number 001-36198
INTERCONTINENTAL EXCHANGE, INC.
(Exact name of registrant as specified in its charter)
Delaware | 46-2286804 |
(State or other jurisdiction of incorporation or organization) | (IRS Employer Identification Number) |
5660 New Northside Drive, Atlanta, Georgia | 30328 (Zip Code) |
(Address of principal executive offices) | |
(770) 857-4700
Registrant’s telephone number, including area code
Indicate by check mark whether the registrant: (1) has filed all reports required to be filed by Section 13 or 15(d) of the Exchange Act during the preceding 12 months (or for such shorter period that the registrant was required to file such reports), and (2) has been subject to such filing requirements for the past 90 days. Yes þ No ¨
Indicate by check mark whether the registrant has submitted electronically and posted on its corporate Web site, if any, every Interactive Data File required to be submitted and posted pursuant to Rule 405 of Regulation S-T during the preceding 12 months (or for such shorter period that the registrant was required to submit and post such files). Yes þ No ¨
Indicate by check mark whether the registrant is a large accelerated filer, an accelerated filer, a non-accelerated filer, smaller reporting company or an emerging growth company. See definitions of “large accelerated filer”, “accelerated filer”, “smaller reporting company” and “emerging growth company” in Rule 12b-2 of the Exchange Act.
Large accelerated filer þ | Accelerated filer ¨ | Non-accelerated filer ¨ | Smaller reporting company ¨ | Emerging growth company ¨ |
(Do not check if a smaller company) | ||||
If an emerging growth company, indicate by check mark if the registrant has elected not to use the extended transition period for complying with any new or revised financial accounting standards provided pursuant to Section 13(a) of the Exchange Act. ¨
Indicate by check mark whether the registrant is a shell company (as defined in Rule 12b-2 of the Exchange Act). Yes ¨ No þ
As of October 31, 2017, the number of shares of the registrant’s Common Stock outstanding was 585,026,176 shares.
INTERCONTINENTAL EXCHANGE, INC.
Form 10-Q
Quarterly Period Ended September 30, 2017
TABLE OF CONTENTS
PART I. | Financial Statements | |
Item 1 | ||
Consolidated Balance Sheets as of September 30, 2017 and December 31, 2016 | ||
Consolidated Statements of Income for the nine and three months ended September 30, 2017 and 2016 | ||
Consolidated Statements of Comprehensive Income for the nine and three months ended September 30, 2017 and 2016 | ||
Consolidated Statements of Changes in Equity, Accumulated Other Comprehensive Loss and Redeemable Non-Controlling Interest for the nine months ended September 30, 2017 and for the year ended December 31, 2016 | ||
Consolidated Statements of Cash Flows for the nine months ended September 30, 2017 and 2016 | ||
Item 2 | ||
Item 3 | ||
Item 4 | ||
PART II. | Other Information | |
Item 1 | ||
Item 1A | ||
Item 2 | ||
Item 3 | ||
Item 4 | ||
Item 5 | ||
Item 6 | ||
PART I. Financial Statements
Item 1. Consolidated Financial Statements (Unaudited)
Intercontinental Exchange, Inc. and Subsidiaries
Consolidated Balance Sheets
(In millions, except per share amounts)
(Unaudited)
As of | As of | ||||||
September 30, 2017 | December 31, 2016 | ||||||
Assets: | |||||||
Current assets: | |||||||
Cash and cash equivalents | $ | 419 | $ | 407 | |||
Short-term investments | 16 | 23 | |||||
Short-term restricted cash and investments | 762 | 679 | |||||
Customer accounts receivable, net of allowance for doubtful accounts of $7 at both September 30, 2017 and December 31, 2016 | 897 | 777 | |||||
Margin deposits and guaranty funds | 52,401 | 55,150 | |||||
Prepaid expenses and other current assets | 744 | 97 | |||||
Total current assets | 55,239 | 57,133 | |||||
Property and equipment, net | 1,192 | 1,129 | |||||
Other non-current assets: | |||||||
Goodwill | 12,016 | 12,291 | |||||
Other intangible assets, net | 10,056 | 10,420 | |||||
Long-term restricted cash and investments | 264 | 264 | |||||
Long-term investments | — | 432 | |||||
Other non-current assets | 351 | 334 | |||||
Total other non-current assets | 22,687 | 23,741 | |||||
Total assets | $ | 79,118 | $ | 82,003 | |||
Liabilities and Equity: | |||||||
Current liabilities: | |||||||
Accounts payable and accrued liabilities | $ | 427 | $ | 388 | |||
Section 31 fees payable | 32 | 131 | |||||
Accrued salaries and benefits | 184 | 230 | |||||
Deferred revenue | 228 | 114 | |||||
Short-term debt | 1,197 | 2,493 | |||||
Margin deposits and guaranty funds | 52,401 | 55,150 | |||||
Other current liabilities | 131 | 111 | |||||
Total current liabilities | 54,600 | 58,617 | |||||
Non-current liabilities: | |||||||
Non-current deferred tax liability, net | 2,989 | 2,958 | |||||
Long-term debt | 4,865 | 3,871 | |||||
Accrued employee benefits | 264 | 430 | |||||
Other non-current liabilities | 381 | 337 | |||||
Total non-current liabilities | 8,499 | 7,596 | |||||
Total liabilities | 63,099 | 66,213 | |||||
Commitments and contingencies | |||||||
Redeemable non-controlling interest | — | 36 | |||||
2
Equity: | |||||||
Intercontinental Exchange, Inc. shareholders’ equity: | |||||||
Preferred stock, $0.01 par value; 100 shares authorized; no shares issued or outstanding at September 30, 2017 and December 31, 2016 | — | — | |||||
Common stock, $0.01 par value; 1,500 shares authorized; 600 and 596 shares issued at September 30, 2017 and December 31, 2016, respectively, and 586 and 595 shares outstanding at September 30, 2017 and December 31, 2016, respectively | 6 | 6 | |||||
Treasury stock, at cost; 14 and 1 shares at September 30, 2017 and December 31, 2016, respectively | (833 | ) | (40 | ) | |||
Additional paid-in capital | 11,423 | 11,306 | |||||
Retained earnings | 5,718 | 4,789 | |||||
Accumulated other comprehensive loss | (322 | ) | (344 | ) | |||
Total Intercontinental Exchange, Inc. shareholders’ equity | 15,992 | 15,717 | |||||
Non-controlling interest in consolidated subsidiaries | 27 | 37 | |||||
Total equity | 16,019 | 15,754 | |||||
Total liabilities and equity | $ | 79,118 | $ | 82,003 | |||
See accompanying notes.
3
Intercontinental Exchange, Inc. and Subsidiaries
Consolidated Statements of Income
(In millions, except per share amounts)
(Unaudited)
Nine Months Ended September 30, | Three Months Ended September 30, | ||||||||||||||
2017 | 2016 | 2017 | 2016 | ||||||||||||
Revenues: | |||||||||||||||
Transaction and clearing, net | $ | 2,373 | $ | 2,566 | $ | 758 | $ | 777 | |||||||
Data services | 1,559 | 1,463 | 518 | 489 | |||||||||||
Listings | 315 | 314 | 102 | 106 | |||||||||||
Other revenues | 148 | 131 | 54 | 44 | |||||||||||
Total revenues | 4,395 | 4,474 | 1,432 | 1,416 | |||||||||||
Transaction-based expenses: | |||||||||||||||
Section 31 fees | 275 | 290 | 92 | 94 | |||||||||||
Cash liquidity payments, routing and clearing | 635 | 823 | 197 | 244 | |||||||||||
Total revenues, less transaction-based expenses | 3,485 | 3,361 | 1,143 | 1,078 | |||||||||||
Operating expenses: | |||||||||||||||
Compensation and benefits | 710 | 708 | 231 | 236 | |||||||||||
Professional services | 94 | 101 | 30 | 32 | |||||||||||
Acquisition-related transaction and integration costs | 27 | 61 | 4 | 14 | |||||||||||
Technology and communication | 294 | 277 | 99 | 93 | |||||||||||
Rent and occupancy | 52 | 52 | 17 | 17 | |||||||||||
Selling, general and administrative | 117 | 83 | 38 | 31 | |||||||||||
Depreciation and amortization | 404 | 470 | 128 | 181 | |||||||||||
Total operating expenses | 1,698 | 1,752 | 547 | 604 | |||||||||||
Operating income | 1,787 | 1,609 | 596 | 474 | |||||||||||
Other income (expense): | |||||||||||||||
Interest expense | (137 | ) | (134 | ) | (47 | ) | (44 | ) | |||||||
Other income, net | 198 | 24 | 11 | 13 | |||||||||||
Other income (expense), net | 61 | (110 | ) | (36 | ) | (31 | ) | ||||||||
Income before income tax expense | 1,848 | 1,499 | 560 | 443 | |||||||||||
Income tax expense | 537 | 409 | 185 | 93 | |||||||||||
Net income | $ | 1,311 | $ | 1,090 | $ | 375 | $ | 350 | |||||||
Net income attributable to non-controlling interest | (22 | ) | (20 | ) | (6 | ) | (6 | ) | |||||||
Net income attributable to Intercontinental Exchange, Inc. | $ | 1,289 | $ | 1,070 | $ | 369 | $ | 344 | |||||||
Earnings per share attributable to Intercontinental Exchange, Inc. common shareholders: | |||||||||||||||
Basic | $ | 2.18 | $ | 1.80 | $ | 0.63 | $ | 0.58 | |||||||
Diluted | $ | 2.17 | $ | 1.79 | $ | 0.62 | $ | 0.57 | |||||||
Weighted average common shares outstanding: | |||||||||||||||
Basic | 591 | 595 | 588 | 596 | |||||||||||
Diluted | 595 | 599 | 592 | 600 | |||||||||||
Dividend per share | $ | 0.60 | $ | 0.51 | $ | 0.20 | $ | 0.17 | |||||||
See accompanying notes.
4
Intercontinental Exchange, Inc. and Subsidiaries
Consolidated Statements of Comprehensive Income
(In millions)
(Unaudited)
Nine Months Ended September 30, | Three Months Ended September 30, | ||||||||||||||
2017 | 2016 | 2017 | 2016 | ||||||||||||
Net income | $ | 1,311 | $ | 1,090 | $ | 375 | $ | 350 | |||||||
Other comprehensive income (loss): | |||||||||||||||
Foreign currency translation adjustments, net of tax (expense) benefit of ($11) and $1 for the nine months ended September 30, 2017 and 2016, respectively, and ($4) for the three months ended September 30, 2017 | 130 | (245 | ) | 45 | (46 | ) | |||||||||
Change in fair value of available-for-sale securities | 68 | 117 | — | (12 | ) | ||||||||||
Reclassification of realized gain on available-for-sale investment to other income | (176 | ) | — | — | — | ||||||||||
Other comprehensive income (loss) | 22 | (128 | ) | 45 | (58 | ) | |||||||||
Comprehensive income | $ | 1,333 | $ | 962 | $ | 420 | $ | 292 | |||||||
Comprehensive income attributable to non-controlling interest | (22 | ) | (20 | ) | (6 | ) | (6 | ) | |||||||
Comprehensive income attributable to Intercontinental Exchange, Inc. | $ | 1,311 | $ | 942 | $ | 414 | $ | 286 | |||||||
See accompanying notes.
5
Intercontinental Exchange, Inc. and Subsidiaries
Consolidated Statements of Changes in Equity, Accumulated Other Comprehensive Loss
and Redeemable Non-Controlling Interest
(In millions)
(Unaudited)
Intercontinental Exchange, Inc. Shareholders' Equity | Non- Controlling Interest in Consolidated Subsidiaries | Total Equity | Redeemable Non-Controlling Interest | ||||||||||||||||||||||||||||||||||
Common Stock | Treasury Stock | Additional Paid-in Capital | Retained Earnings | Accumulated Other Comprehensive Loss | |||||||||||||||||||||||||||||||||
Shares | Value | Shares | Value | ||||||||||||||||||||||||||||||||||
Balance, as of December 31, 2015 | 628 | $ | 6 | (34 | ) | $ | (1,448 | ) | $ | 12,290 | $ | 4,148 | $ | (188 | ) | $ | 32 | $ | 14,840 | $ | 35 | ||||||||||||||||
Other comprehensive loss | — | — | — | — | — | — | (156 | ) | — | (156 | ) | — | |||||||||||||||||||||||||
Exercise of common stock options | 1 | — | — | — | 22 | — | — | — | 22 | — | |||||||||||||||||||||||||||
Treasury shares retired in connection with stock split | (35 | ) | — | 35 | 1,512 | (1,142 | ) | (370 | ) | — | — | — | — | ||||||||||||||||||||||||
Repurchases of common stock | — | — | (1 | ) | (50 | ) | — | — | — | — | (50 | ) | — | ||||||||||||||||||||||||
Payments relating to treasury shares | — | — | (1 | ) | (54 | ) | — | — | — | — | (54 | ) | — | ||||||||||||||||||||||||
Stock-based compensation | — | — | — | — | 136 | — | — | — | 136 | — | |||||||||||||||||||||||||||
Issuance of restricted stock | 2 | — | — | — | — | — | — | — | — | — | |||||||||||||||||||||||||||
Adjustment to redemption value | — | — | — | — | — | (2 | ) | — | — | (2 | ) | 1 | |||||||||||||||||||||||||
Distributions of profits | — | — | — | — | — | — | — | (19 | ) | (19 | ) | (3 | ) | ||||||||||||||||||||||||
Dividends paid to shareholders | — | — | — | — | — | (409 | ) | — | — | (409 | ) | — | |||||||||||||||||||||||||
Net income attributable to non-controlling interest | — | — | — | — | — | (27 | ) | — | 24 | (3 | ) | 3 | |||||||||||||||||||||||||
Net income | — | — | — | — | — | 1,449 | — | — | 1,449 | — | |||||||||||||||||||||||||||
Balance, as of December 31, 2016 | 596 | 6 | (1 | ) | (40 | ) | 11,306 | 4,789 | (344 | ) | 37 | 15,754 | 36 | ||||||||||||||||||||||||
Other comprehensive income | — | — | — | — | — | — | 22 | — | 22 | — | |||||||||||||||||||||||||||
Exercise of common stock options | — | — | — | — | 11 | — | — | — | 11 | — | |||||||||||||||||||||||||||
Repurchases of common stock | — | — | (11 | ) | (709 | ) | — | — | — | — | (709 | ) | — | ||||||||||||||||||||||||
Payments relating to treasury shares | — | — | (2 | ) | (85 | ) | — | — | — | — | (85 | ) | — | ||||||||||||||||||||||||
Stock-based compensation | — | — | — | — | 116 | — | — | — | 116 | — | |||||||||||||||||||||||||||
Issuance of restricted stock | 4 | — | — | 1 | (1 | ) | — | — | — | — | — | ||||||||||||||||||||||||||
Acquisition of non-controlling interest | — | — | — | — | (9 | ) | — | — | (5 | ) | (14 | ) | — | ||||||||||||||||||||||||
Acquisition of redeemable non-controlling interest | — | — | — | — | — | (2 | ) | — | — | (2 | ) | (37 | ) | ||||||||||||||||||||||||
Distributions of profits | — | — | — | — | — | — | — | (26 | ) | (26 | ) | — | |||||||||||||||||||||||||
Dividends paid to shareholders | — | — | — | — | — | (358 | ) | — | — | (358 | ) | — | |||||||||||||||||||||||||
Net income attributable to non-controlling interest | — | — | — | — | — | (22 | ) | — | 21 | (1 | ) | 1 | |||||||||||||||||||||||||
Net income | — | — | — | — | — | 1,311 | — | — | 1,311 | — | |||||||||||||||||||||||||||
Balance, as of September 30, 2017 | 600 | $ | 6 | (14 | ) | $ | (833 | ) | $ | 11,423 | $ | 5,718 | $ | (322 | ) | $ | 27 | $ | 16,019 | $ | — | ||||||||||||||||
As of | As of | ||||||
September 30, 2017 | December 31, 2016 | ||||||
Accumulated other comprehensive loss was as follows: | |||||||
Foreign currency translation adjustments | $ | (215 | ) | $ | (345 | ) | |
Fair value of available-for-sale securities | — | 108 | |||||
Comprehensive income from equity method investment | 2 | 2 | |||||
Employee benefit plans adjustments | (109 | ) | (109 | ) | |||
Accumulated other comprehensive loss | $ | (322 | ) | $ | (344 | ) | |
See accompanying notes.
6
Intercontinental Exchange, Inc. and Subsidiaries
Consolidated Statements of Cash Flows
(In millions)
(Unaudited)
Nine Months Ended September 30, | |||||||
2017 | 2016 | ||||||
Operating activities: | |||||||
Net income | $ | 1,311 | $ | 1,090 | |||
Adjustments to reconcile net income to net cash provided by operating activities: | |||||||
Depreciation and amortization | 404 | 470 | |||||
Stock-based compensation | 102 | 90 | |||||
Deferred taxes | 58 | 20 | |||||
Cetip realized investment gain, net | (114 | ) | — | ||||
Other | (13 | ) | 2 | ||||
Changes in assets and liabilities: | |||||||
Customer accounts receivable | (153 | ) | (88 | ) | |||
Other current and non-current assets | (29 | ) | (8 | ) | |||
Section 31 fees payable | (99 | ) | (83 | ) | |||
Deferred revenue | 133 | 144 | |||||
Other current and non-current liabilities | (190 | ) | (129 | ) | |||
Total adjustments | 99 | 418 | |||||
Net cash provided by operating activities | 1,410 | 1,508 | |||||
Investing activities: | |||||||
Capital expenditures | (136 | ) | (166 | ) | |||
Capitalized software development costs | (104 | ) | (88 | ) | |||
Cash received for divestitures (net of cash paid for acquisitions) | 9 | — | |||||
Proceeds from sale of Cetip, net | 438 | — | |||||
Decrease (increase) in restricted cash and investments | (80 | ) | 18 | ||||
Other | — | (70 | ) | ||||
Net cash provided by (used in) investing activities | 127 | (306 | ) | ||||
Financing activities: | |||||||
Repayments of commercial paper, net | (445 | ) | (1,006 | ) | |||
Proceeds from debt facilities, net | 985 | — | |||||
Repayments of debt facilities | (850 | ) | — | ||||
Repurchases of common stock | (709 | ) | — | ||||
Dividends to shareholders | (358 | ) | (307 | ) | |||
Payments relating to treasury shares received for restricted stock tax payments and stock option exercises | (85 | ) | (51 | ) | |||
Acquisition of non-controlling interest and redeemable non-controlling interest | (55 | ) | — | ||||
Other | (17 | ) | (2 | ) | |||
Net cash used in financing activities | (1,534 | ) | (1,366 | ) | |||
Effect of exchange rate changes on cash and cash equivalents | 9 | (5 | ) | ||||
Net increase (decrease) in cash and cash equivalents | 12 | (169 | ) | ||||
Cash and cash equivalents, beginning of period | 407 | 627 | |||||
Cash and cash equivalents, end of period | $ | 419 | $ | 458 | |||
Supplemental cash flow disclosure: | |||||||
Cash paid for income taxes | $ | 511 | $ | 362 | |||
Cash paid for interest | $ | 99 | $ | 92 | |||
See accompanying notes.
7
Intercontinental Exchange, Inc. and Subsidiaries
Notes to Consolidated Financial Statements
(Unaudited)
1. | Description of Business |
We are a leading global operator of regulated exchanges, clearing houses and listings venues, and a provider of data services for commodity and financial markets. We operate regulated marketplaces for listing, trading and clearing a broad array of derivatives contracts and securities across major asset classes, including energy and agricultural commodities, interest rates, equities, equity derivatives, exchange traded funds, credit derivatives, bonds and currencies. We offer end-to-end market data services to support the trading, investment and risk management needs of customers across virtually all asset classes.
Our exchanges include futures exchanges in the United States, or U.S., United Kingdom, or U.K., European Union, or EU, Canada and Singapore, and cash equities, equity options and bond exchanges in the U.S. We also operate over-the-counter, or OTC, markets for physical energy and credit default swaps, or CDS, trade execution. To serve global derivatives markets, we operate central counterparty clearing houses in the U.S., U.K., EU, Canada and Singapore (Note 9). We offer a range of data services for global financial and commodity markets, including pricing and reference data, exchange data, analytics, feeds, desktop and connectivity solutions. Through our markets, clearing houses, listings and market data services, we provide end-to-end solutions for our customers through liquid markets, benchmark products, access to capital markets, and related services to support their ability to manage risk and raise capital.
2. | Summary of Significant Accounting Policies |
Basis of Presentation
The accompanying unaudited consolidated financial statements have been prepared by us in accordance with U.S. generally accepted accounting principles, or U.S. GAAP, pursuant to the rules and regulations of the Securities and Exchange Commission, or SEC, regarding interim financial reporting. Accordingly, the unaudited consolidated financial statements do not include all of the information and footnotes required by U.S. GAAP for complete financial statements and should be read in conjunction with our audited consolidated financial statements and related notes thereto for the year ended December 31, 2016. The accompanying unaudited consolidated financial statements reflect all adjustments that are, in our opinion, necessary for a fair presentation of results for the interim periods presented. These adjustments are of a normal recurring nature.
Preparing financial statements requires us to make certain estimates and assumptions that affect the amounts that are reported in the consolidated financial statements and accompanying disclosures. Although these estimates are based on our best knowledge of current events and actions that we may undertake in the future, actual results may be different from these estimates. The results of operations for the nine and three months ended September 30, 2017 are not necessarily indicative of the results to be expected for any future period or the full fiscal year.
The accompanying unaudited consolidated financial statements include the accounts of us and our wholly-owned and controlled subsidiaries. All intercompany balances and transactions between us and our wholly-owned and controlled subsidiaries have been eliminated in the consolidation. For those consolidated subsidiaries in which our ownership is less than 100% and for which we have control over the assets and liabilities and the management of the entity, the outside stockholders’ interests are shown as non-controlling interests. In instances where outside stockholders’ hold an option to require us to repurchase the outside stockholders’ interest, these interests are shown as redeemable non-controlling interests (Note 3).
Held for Sale
We classify long-lived assets or disposal groups as held for sale in the period in which all of the following criteria are met: management commits to a plan to sell; the long-lived asset or disposal group is available for immediate sale in its present condition subject only to terms that are usual and customary for sales of such long-lived assets or disposal groups; an active program to locate a buyer and other actions required to complete the plan to sell have been initiated; the sale is probable within one year; the asset or disposal group is being actively marketed for sale at a price that is reasonable in relation to its current fair value; and it is unlikely that significant changes to the plan will be made or that the plan will be withdrawn. Long-lived assets and disposal groups classified as held for sale are measured at the lower of their carrying amount or fair value less costs to sell. Any loss resulting from this measurement is recognized in the period in which the held for sale criteria are met. Conversely, gains are not recognized until the date of sale. The fair value of a long-lived asset less any costs to sell is assessed each reporting period it remains classified as held for sale, and any change in fair value is reported as an adjustment to the carrying value of the asset, except that increases in fair value are limited to prior decreases recorded. Upon being classified as held for sale, depreciation and amortization is ceased. See Note 10 for information regarding our classification of Trayport as held for sale as of September 30, 2017.
New and Recently Adopted Accounting Pronouncements
8
The Financial Accounting Standards Board, or FASB, has issued Accounting Standards Update No. 2014-09, Revenue from Contracts with Customers (Topic 606), or ASU 606. ASU 606 provides guidance outlining a single comprehensive model for entities to use in accounting for revenue arising from contracts with customers that supersedes most current revenue recognition guidance. This guidance requires us to recognize revenue when we transfer promised goods or services to customers in an amount that reflects the consideration to which the entity expects to be entitled in exchange for those goods or services. We are required to adopt ASU 606 at the beginning of our first quarter of fiscal 2018. The new guidance requires enhanced disclosures, including revenue recognition policies to identify performance obligations to customers and significant judgments in measurement and recognition. The new guidance may be applied retrospectively to each prior period presented or retrospectively with the cumulative effect recognized as of the date of adoption. We will apply the guidance retrospectively to each prior period presented when adopted, and provide the relevant disclosures in the first interim and annual periods in which we adopt the guidance. Based on our preliminary assessment, we expect that the adoption may accelerate the timing of recognition of a portion of original listing fees related to our New York Stock Exchange, or NYSE, businesses, which are currently deferred over an estimated customer life of nine years. We do not expect the adoption of this guidance to have a material impact on our consolidated financial statements within any accounting period presented. We are continuing our assessment, which may identify other impacts of the adoption of ASU 606.
The FASB has issued Accounting Standards Update No. 2016-01, Financial Instruments - Overall (Subtopic 825-10): Recognition and Measurement of Financial Assets and Financial Liabilities, or ASU 2016-01. ASU 2016-01 provides updated guidance for the recognition, measurement, presentation, and disclosure of certain financial assets and liabilities, including the requirement that equity investments (except those accounted for under the equity method of accounting or those that result in consolidation of the investee) are to be measured at fair value with changes in fair value recognized in net income. We are required to adopt ASU 2016-01 at the beginning of our first quarter of fiscal 2018. On October 24, 2017, we made an investment in Euroclear plc, or Euroclear (Note 3), which will be impacted by our adoption of ASU 2016-01. Euroclear does not currently have a readily determinable fair market value as it is not a publicly listed company. Therefore, in accordance with and upon adoption of ASU 2016-01, we would only adjust the fair value of our investment in Euroclear if there is an observable price change in an orderly Euroclear transaction and any change in the fair value will be recognized in net income.
The FASB has issued Accounting Standards Update No. 2016-02, Leases, or ASU 2016-02. ASU 2016-02 requires an entity to recognize both assets and liabilities arising from financing and operating leases, along with additional qualitative and quantitative disclosures. A lessee should recognize in its balance sheet a liability to make lease payments (the lease liability) and a right-of-use asset representing its right to use the underlying asset for the lease term. In transition, lessees and lessors are required to recognize and measure leases at the beginning of the earliest period presented using a modified retrospective approach. ASU 2016-02 is required to be adopted at the beginning of our first quarter of fiscal 2019, with early adoption permitted. We will not adopt ASU 2016-02 early, but we are currently evaluating this guidance to determine the potential impact on our consolidated financial statements.
The FASB has issued Accounting Standards Update No. 2016-18, Statement of Cash Flows: Restricted Cash, or ASU 2016-18, that will require entities to show the changes in the total of cash, cash equivalents, restricted cash and restricted cash equivalents in the statement of cash flows. As a result, entities will no longer present transfers between cash and cash equivalents and restricted cash and restricted cash equivalents in the statement of cash flows. When cash, cash equivalents, restricted cash and restricted cash equivalents are presented in more than one line item on the balance sheet, the new guidance requires a reconciliation of the totals in the statement of cash flows to the related captions in the balance sheet. This reconciliation can be presented either on the face of the statement of cash flows or in the notes to the financial statements. Entities will also have to disclose the nature of their restricted cash and restricted cash equivalent balances. We are required to adopt ASU 2016-18 at the beginning of our first quarter of fiscal 2018, with early adoption permitted. We will be required to apply the guidance retrospectively when adopted, and provide the relevant disclosures in the first interim and annual periods in which we adopt the guidance. We will not adopt ASU 2016-18 early, but do expect to be impacted by the new presentation and disclosure requirements required by ASU 2016-18 due to our restricted and unrestricted cash balances.
The FASB has issued Accounting Standards Update No. 2017-07, Compensation-Retirement Benefits (Topic 715): Improving the Presentation of Net Periodic Pension Cost and Net Periodic Postretirement Benefit Cost, or ASU 2017-07. The amendments in this update require that an employer disaggregate the service cost component from the other components of net benefit cost. The amendments also provide explicit guidance on how to present the service cost component in the same line item as other related compensation costs, and the other components of net benefit cost in the income statement outside of operating income. The guidance only allows the service cost component of net benefit cost to be eligible for capitalization. We are required to adopt ASU 2017-07 at the beginning of our first quarter of fiscal 2018, with early adoption permitted. We will be required to apply the guidance retrospectively when adopted, and provide the relevant disclosures in the first interim and annual periods in which we adopt the guidance. We will not adopt ASU 2017-07 early and we do not expect the adoption of this guidance to have a material impact on our consolidated financial statements within any accounting period presented.
9
3. | Acquisitions, Investments and Divestitures |
Pending Acquisition of Virtu BondPoint
On October 24, 2017, we entered into a definitive agreement to acquire 100% of Virtu BondPoint from Virtu Financial, Inc. for $400 million in cash. The transaction is expected to close in the first quarter of 2018, and the closing is subject to applicable regulatory reviews and approvals. Virtu BondPoint is a leading provider of electronic fixed income trading solutions for the buy-side and sell-side offering access to centralized liquidity and automated trade execution services through its alternative trading system, or ATS, linking more than 500 financial services firms.
Investment in Euroclear
On October 24, 2017, we acquired a 4.7% stake in Euroclear for €275 million ($326 million) in cash. Euroclear is a leading provider of post-trade services, including settlement, central securities depositories and related services for cross-border transactions across asset classes.
Acquisition of Global Research Division’s Index Business from Bank of America Merrill Lynch, or BofAML
On October 20, 2017, we acquired BofAML's Global Research division’s index business. BofAML indices are the second largest group of fixed income indices as measured by assets under management, or AUM, globally. The AUM benchmarked against our combined fixed income indices is nearly $1 trillion, and the indices have been re-branded as the ICE BofAML indices.
Purchase of Minority Interests
For consolidated subsidiaries in which our ownership is less than 100% and for which we have control over the assets, liabilities and management of the entity, the outside stockholders’ interests are shown as non-controlling interest in our consolidated financial statements. As of December 31, 2016, non-controlling interest included those related to the operating results of our CDS clearing subsidiaries in which non-ICE limited partners held a 42.5% net profit sharing interest; ICE Endex in which Gasunie held a 21% ownership interest; and ICE Clear Netherlands in which ABN AMRO Clearing Bank N.V. held a 25% ownership interest. For both ICE Endex and ICE Clear Netherlands, in addition to the non-controlling interest reported in the consolidated statements of income, we reported redeemable non-controlling interest in the consolidated balance sheets which represents the minority interest redemption fair value for each company.
During June 2017, we purchased both Gasunie’s 21% minority ownership interest in ICE Endex and ABN AMRO Clearing Bank N.V.’s 25% minority ownership interest in ICE Clear Netherlands. Subsequent to these acquisitions, we own 100% of ICE Endex and ICE Clear Netherlands and will no longer include any non-controlling interest amounts for ICE Endex and ICE Clear Netherlands in our consolidated financial statements. During April 2017, we purchased 3.2% of the net profit sharing interest in our CDS clearing subsidiaries from a non-ICE limited partner and the remaining non-ICE limited partners hold a 39.3% net profit sharing interest as of September 30, 2017.
NYSE Governance Services Divestiture
On June 1, 2017, we sold NYSE Governance Services to Marlin Heritage, L.P. NYSE Governance Services provides governance and compliance analytics and education solutions for organizations and their boards of directors through dynamic learning solutions. We recognized a net loss of $6 million on the sale of NYSE Governance Services, which was recorded as amortization expense within our data and listings segment in the accompanying consolidated statements of income for the nine months ended September 30, 2017.
TMX Atrium Acquisition
On May 1, 2017, we acquired 100% of TMX Atrium, a global extranet and wireless services business, from TMX Group. TMX Atrium provides low-latency access to markets and market data across 12 countries, more than 30 major trading venues, and ultra-low latency wireless connectivity to access markets and market data in the Toronto, New Jersey and Chicago metro areas. The wireless assets consist of microwave and millimeter networks that transport market data and provide private bandwidth. TMX Atrium is now part of ICE Data Services and is being integrated with our connectivity services.
Interactive Data Managed Solutions (IDMS) Divestiture
On March 31, 2017, we sold Interactive Data Managed Solutions, or IDMS, a unit of Interactive Data, to FactSet. IDMS is a managed solutions and portal provider for the global wealth management industry. There was no gain or loss recognized on the sale of IDMS.
10
National Stock Exchange Acquisition
On January 31, 2017, we acquired 100% of National Stock Exchange, Inc., now named NYSE National. The acquisition gives the NYSE Group a fourth U.S. exchange license. NYSE National is distinct from NYSE Group’s three listings exchanges because NYSE National will only be a trading venue and will not be a listings market. NYSE Group’s three listings exchanges, NYSE, NYSE American (NYSE American was formerly known as NYSE MKT) and NYSE Arca, have unique market models designed for corporate and exchange traded fund, or ETF, issuers. After closing the transaction, NYSE National ceased operations on February 1, 2017. We will engage with NYSE National members, buy-side participants and retail brokerage firms before finalizing operational plans for NYSE National’s re-launch, which is expected to occur in 2018.
4. | Goodwill and Other Intangible Assets |
The following is a summary of the activity in the goodwill balance for the nine months ended September 30, 2017 (in millions):
Goodwill balance at December 31, 2016 | $ | 12,291 | |
Acquisitions (divestitures), net | 1 | ||
Foreign currency translation | 57 | ||
Reclassification to held for sale | (331 | ) | |
Other activity, net | (2 | ) | |
Goodwill balance at September 30, 2017 | $ | 12,016 | |
The following is a summary of the activity in the other intangible assets balance for the nine months ended September 30, 2017 (in millions):
Other intangible assets balance at December 31, 2016 | $ | 10,420 | |
Acquisitions (divestitures), net | 5 | ||
Foreign currency translation | 60 | ||
Reclassification to held for sale | (214 | ) | |
Other activity, net | (9 | ) | |
Amortization of other intangible assets | (206 | ) | |
Other intangible assets balance at September 30, 2017 | $ | 10,056 | |
We completed the acquisitions of TMX Atrium and NYSE National and sold NYSE Governance Services and IDMS during the nine months ended September 30, 2017 (Note 3). We reclassified the net assets of Trayport, including the related goodwill and other intangible assets, and they are being recorded as held for sale as of September 30, 2017 (Note 10). The foreign currency translation adjustments in the tables above result from a portion of our goodwill and other intangible assets being held at our U.K., EU and Canadian subsidiaries, some of whose functional currencies are not the U.S. dollar. The changes in other activity, net in the tables above primarily relate to adjustments to the fair value of the net tangible and identifiable intangible assets and liabilities relating to the acquisitions, with a corresponding adjustment to goodwill.
In August 2016, we sold certain of Creditex’s U.S. voice brokerage operations to Tullett Prebon. During the third quarter of 2016, we discontinued Creditex’s U.K. voice brokerage operations. We continue to operate Creditex’s electronically traded markets and systems, post-trade connectivity platforms and intellectual property. Based on an analysis of these factors, it was determined that the carrying value of the Creditex customer relationship intangible asset was not fully recoverable and an impairment of the asset was recorded in September 2016 for $33 million based on a discounted cash flow calculation. The impairment was recorded as amortization expense within our trading and clearing segment in the accompanying consolidated statements of income for the nine and three months ended September 30, 2016.
Other than the Creditex customer relationship intangible asset impairment discussed above, we did not recognize any impairment losses on goodwill or other intangible assets during the nine and three months ended September 30, 2017 and 2016.
5. | Deferred Revenue |
Deferred revenue represents cash received that is yet to be recognized as revenue. Total deferred revenue was $366 million as of September 30, 2017, including $228 million in current deferred revenue and $138 million in non-current deferred revenue. The
11
changes in our deferred revenue during the nine months ended September 30, 2017 are as follows (in millions):
Annual Listings Revenue | Original Listings Revenues | Other Listings Revenues | Data Services and Other Revenues | Total | |||||||||||||||
Deferred revenue balance at December 31, 2016 | $ | — | $ | 66 | $ | 83 | $ | 88 | $ | 237 | |||||||||
Additions | 367 | 17 | 49 | 345 | 778 | ||||||||||||||
Amortization | (276 | ) | (8 | ) | (31 | ) | (324 | ) | (639 | ) | |||||||||
Less NYSE Governance Services, IDMS and Trayport (Notes 3 and 10) | — | — | — | (10 | ) | (10 | ) | ||||||||||||
Deferred revenue balance at September 30, 2017 | $ | 91 | $ | 75 | $ | 101 | $ | 99 | $ | 366 | |||||||||
6. | Debt |
Our total debt, including short-term and long-term debt, consisted of the following as of September 30, 2017 and December 31, 2016 (in millions):
As of September 30, 2017 | As of December 31, 2016 | ||||||
Debt: | |||||||
Commercial Paper | $ | 1,197 | $ | 1,642 | |||
NYSE Notes (2.00% senior unsecured notes due October 5, 2017) | — | 851 | |||||
Short-term debt | 1,197 | 2,493 | |||||
2018 Senior Notes (2.50% senior unsecured notes due October 15, 2018) | 599 | 598 | |||||
2020 Senior Notes (2.75% senior unsecured notes due December 1, 2020) | 1,243 | 1,242 | |||||
2022 Senior Notes (2.35% senior unsecured notes due September 15, 2022) | 495 | — | |||||
2023 Senior Notes (4.00% senior unsecured notes due October 15, 2023) | 791 | 790 | |||||
2025 Senior Notes (3.75% senior unsecured notes due December 1, 2025) | 1,242 | 1,241 | |||||
2027 Senior Notes (3.10% senior unsecured notes due September 15, 2027) | 495 | — | |||||
Long-term debt | 4,865 | 3,871 | |||||
Total debt | $ | 6,062 | $ | 6,364 | |||
Amended Credit Facility
We had previously entered into a $3.4 billion senior unsecured revolving credit facility, or the Credit Facility, which was scheduled to end on November 13, 2020. On August 18, 2017, we agreed with the lenders, amongst other items, to extend the maturity date to August 18, 2022, herein referred to as the Amended Credit Facility. The Amended Credit Facility includes an option for us to propose an increase in the aggregate amount available for borrowing by up to $975 million, subject to the consent of the lenders funding the increase and certain other conditions. The commitments available under the Amended Credit Facility are scheduled to reduce to $3.2 billion on November 13, 2020.
Other amendments within the Amended Credit Facility include, but are not limited to, (i) eliminating the step-up in the commitment fee ratings-based grid that was scheduled to take effect in April 2019, (ii) removing ICE Europe Parent Limited as a party to the credit agreement, (iii) removing the guaranty by ICE in respect of ICE Europe Parent Limited, (iv) increasing the maximum leverage ratio to 3.50:1.00, and (v) up to two times, increasing the maximum leverage ratio from 3.50:1.00 to 4.00:1.00 for a period of one year following a material acquisition.
No amounts were outstanding under the Amended Credit Facility as of September 30, 2017. We incurred debt issuance costs of $5 million relating to the Amended Credit Facility and they are presented in the accompanying consolidated balance sheet as other non-current assets and will be amortized over the life of the Amended Credit Facility.
Of the $3.4 billion that is currently available for borrowing under the Amended Credit Facility, $1.2 billion is required to back-stop the amount outstanding under our Commercial Paper Program as of September 30, 2017. The amount required to back-stop the amounts outstanding under the Commercial Paper Program will fluctuate as we increase or decrease our commercial paper borrowings. The remaining $2.2 billion available under the Amended Credit Facility as of September 30, 2017 is available to us to use for working capital and general corporate purposes including, but not limited to, acting as a back-stop to future increases in the amounts outstanding under the Commercial Paper Program.
12
Senior Notes
On August 17, 2017, we issued $1.0 billion in aggregate senior notes, including $500 million principal amount of 2.35% senior unsecured fixed rate notes due September 2022, or the 2022 Senior Notes, and $500 million principal amount of 3.10% senior unsecured fixed rate notes due September 2027, or the 2027 Senior Notes. We used the majority of the net proceeds from the 2022 Senior Notes and 2027 Senior Notes offering to fund the redemption of the NYSE Notes.
We incurred debt issuance costs of $8 million relating to the issuance of the 2022 Senior Notes and the 2027 Senior Notes and they are presented in the accompanying consolidated balance sheet as a deduction from the carrying amount of the related debt liability and will be amortized over the life of the 2022 Senior Notes and the 2027 Senior Notes. The 2022 Senior Notes and 2027 Senior Notes contain affirmative and negative covenants, including, but not limited to, certain redemption rights, limitations on liens and indebtedness and limitations on certain mergers, sales, dispositions and lease-back transactions.
Commercial Paper Program
We have entered into a U.S. dollar commercial paper program, or the Commercial Paper Program. Our Commercial Paper Program is currently backed by the borrowing capacity available under the Amended Credit Facility, equal to the amount of the commercial paper that is issued and outstanding at any given point in time. The effective interest rate of commercial paper issuances does not materially differ from short term interest rates (such as USD LIBOR). The fluctuation of these rates due to market conditions may impact our interest expense.
Commercial paper notes of $1.2 billion with original maturities ranging from 2 to 75 days were outstanding as of September 30, 2017 under our Commercial Paper Program. As of September 30, 2017, the weighted average interest rate on the $1.2 billion outstanding under our Commercial Paper Program was 1.23% per annum, with a weighted average maturity of 29 days. We repaid $445 million of the amounts outstanding under the Commercial Paper Program during the nine months ended September 30, 2017 primarily using net cash proceeds received from the sale of our investment in Cetip (Note 11) and cash flows from operations.
NYSE Notes
The $850 million, 2.00% senior unsecured fixed rate NYSE Notes were due in October 2017. We paid off the NYSE Notes in September 2017 using the majority of the proceeds from the 2022 Senior Notes and 2027 Senior Notes offering.
We previously provided condensed consolidating financial statements for Intercontinental Exchange, Inc., or ICE (Parent), NYSE Holdings LLC and the subsidiary non-guarantors in a footnote to our consolidated financial statements. However, in connection with the NYSE Notes being paid off in September 2017, all guarantees between ICE and NYSE Holdings LLC were terminated and we are no longer required to include a condensed consolidating financial statements footnote in our quarterly and annual filings.
7. | Equity |
We currently sponsor employee and director stock option and restricted stock plans. Stock options and restricted stock are granted at the discretion of the compensation committee of the board of directors. All stock options and restricted stock awards are granted at an exercise price equal to the fair value of the common stock on the date of grant. The grant date fair value is based on the closing stock price on the date of grant. The fair value of the stock options and restricted stock on the date of grant is recognized as expense over the vesting period, net of estimated forfeitures. The non-cash compensation expenses recognized in our consolidated statements of income for stock options and restricted stock were $102 million and $90 million for the nine months ended September 30, 2017 and 2016, respectively, and $34 million and $30 million for the three months ended September 30, 2017 and 2016, respectively.
Stock Option Plans
The following is a summary of stock options for the nine months ended September 30, 2017:
Number of Options | Weighted Average Exercise Price per Option | |||||
Outstanding at December 31, 2016 | 3,878,705 | $ | 36.05 | |||
Granted | 730,913 | 57.34 | ||||
Exercised | (429,435 | ) | 26.38 | |||
Outstanding at September 30, 2017 | 4,180,183 | 40.77 | ||||
Details of stock options outstanding as of September 30, 2017 are as follows:
13
Number of Options | Weighted Average Exercise Price | Weighted Average Remaining Contractual Life (Years) | Aggregate Intrinsic Value (In millions) | |||||||||
Vested or expected to vest | 4,180,183 | $ | 40.77 | 6.7 | $ | 117 | ||||||
Exercisable | 3,022,120 | $ | 35.72 | 5.9 | $ | 100 | ||||||
The total intrinsic value of stock options exercised during the nine months ended September 30, 2017 and 2016 were $15 million and $15 million, respectively, and $8 million and $5 million for the three months ended September 30, 2017 and 2016, respectively. As of September 30, 2017, there were $10 million in total unrecognized compensation costs related to stock options. These costs are expected to be recognized over a weighted average period of 1.8 years as the stock options vest.
We use the Black-Scholes option pricing model for purposes of valuing stock option awards. During the nine months ended September 30, 2017 and 2016, we used the weighted-average assumptions in the table below to compute the value of all options for shares of common stock granted to employees:
Nine Months Ended September 30, | |||||||
Assumptions: | 2017 | 2016 | |||||
Risk-free interest rate | 1.84 | % | 1.51 | % | |||
Expected life in years | 5.0 | 5.0 | |||||
Expected volatility | 21 | % | 24 | % | |||
Expected dividend yield | 1.40 | % | 1.36 | % | |||
Estimated weighted-average fair value of options granted per share | $ | 10.50 | $ | 9.88 | |||
The risk-free interest rate is based on the zero-coupon U.S. Treasury yield curve in effect at the time of grant. The expected life computation is derived from historical exercise patterns and anticipated future patterns. Expected volatilities are based on historical volatility of our stock.
Restricted Stock Plans
In January 2017, we reserved a maximum of 1,534,218 restricted shares for potential issuance as performance-based restricted shares to certain of our employees. The number of shares that will ultimately be granted under this award will be based on our actual financial performance as compared to financial performance targets set by our board of directors and compensation committee for the year ending December 31, 2017, as well as our 2017 total shareholder return as compared to that of the S&P 500 Index. The maximum compensation expense to be recognized under these performance-based restricted shares is $85 million if the maximum financial performance target is met and all 1,534,218 shares vest. The compensation expense to be recognized under these performance-based restricted shares will be $42 million if the target financial performance is met, which would result in 767,109 shares vesting. We will recognize expense on an accelerated basis over the three-year vesting period based on our quarterly assessment of the probable 2017 actual financial performance as compared to the 2017 financial performance targets. As of September 30, 2017, we determined that it is probable that the financial performance level will be at target for 2017. Based on this assessment, we recorded non-cash compensation expense of $18 million and $6 million for the nine and three months ended September 30, 2017, respectively, related to these shares and the remaining $24 million in non-cash compensation expense will be recorded on an accelerated basis over the remaining vesting period, including $6 million of which will be recorded during the fourth quarter of 2017.
The following is a summary of the non-vested restricted shares for the nine months ended September 30, 2017:
Number of Restricted Stock Shares | Weighted Average Grant-Date Fair Value per Share | ||||
Non-vested at December 31, 2016 | 6,435,871 | $ | 45.33 | ||
Granted | 3,186,709 | 57.28 | |||
Vested | (3,412,678) | 44.59 | |||
Forfeited | (370,008) | 51.65 | |||
Non-vested at September 30, 2017 | 5,839,894 | 52.47 | |||
Restricted stock shares granted in the table above include both time-based and performance-based grants. Performance-based shares have been presented to reflect the actual shares to be issued based on the achievement of past performance targets. Non-vested performance-based restricted shares granted are presented in the table above at the target number of restricted shares that would vest if the performance targets are met. As of September 30, 2017, there were $171 million in total unrecognized compensation costs related to the time-based restricted stock and the performance-based restricted stock. These costs are expected to be recognized over a
14
weighted-average period of 1.6 years as the restricted stock vests. These unrecognized compensation costs assume that a target performance level will be met on the performance-based restricted shares granted in January 2017. During the nine months ended September 30, 2017 and 2016, the total fair value of restricted stock vested under all restricted stock plans was $199 million and $120 million, respectively.
Stock Repurchase Program
In August 2016, our board of directors approved an aggregate of $1.0 billion for future repurchases of our common stock with no fixed expiration date, subject to applicable laws and regulations. The shares repurchased are held in treasury stock. As of September 30, 2017, the remaining board authorization permits repurchases of up to $241 million of our common stock. In September 2017, our board of directors approved an aggregate of $1.2 billion for future repurchases of our common stock with no fixed expiration date that becomes effective as of January 1, 2018. We expect funding for any share repurchases to come from our operating cash flow or borrowings under our debt facilities or commercial paper program. Repurchases may be made from time to time on the open market, through established trading plans, in privately-negotiated transactions or otherwise, in accordance with all applicable securities laws, rules and regulations. We have entered into a Rule 10b5-1 trading plan, as authorized by our board of directors, to govern some or all of the repurchases of our shares of common stock. We may discontinue the stock repurchases at any time and may amend or terminate the Rule 10b5-1 trading plan at any time. The approval of our board of directors for the share repurchases does not obligate us to acquire any particular amount of our common stock. In addition, our board of directors may increase or decrease the amount of capacity we have for repurchases from time to time.
During the nine months ended September 30, 2017, we repurchased 11,469,042 shares of our outstanding common stock at a cost of $709 million, excluding shares withheld upon vesting of equity awards. These repurchases were completed on the open market and under our 10b5-1 trading plan. The timing and extent of future repurchases that are not made pursuant to a Rule 10b5-1 trading plan will be at our discretion and will depend upon many conditions. Our management periodically reviews whether or not to be active in repurchasing our stock. In making a determination regarding any stock repurchases, we consider multiple factors. The factors may include: overall stock market conditions, our common stock price movements, the remaining amount authorized for repurchases by our board of directors, the potential impact of a stock repurchase program on our corporate debt ratings, our expected free cash flow and working capital needs, our current and future planned strategic growth initiatives, and other potential uses of our cash and capital resources.
Dividends
During the nine months ended September 30, 2017 and 2016, we paid cash dividends per share of $0.60 and $0.51, respectively, for an aggregate payout of $358 million and $307 million, respectively. The declaration of dividends is subject to the discretion of our board of directors, and may be affected by various factors, including our future earnings, financial condition, capital requirements, levels of indebtedness, credit ratings and other considerations our board of directors deem relevant. Our board of directors has adopted a quarterly dividend declaration policy providing that the declaration of any dividends will be determined quarterly by the board or audit committee of the board of directors taking into account such factors as our evolving business model, prevailing business conditions and our financial results and capital requirements, without a predetermined annual net income payout ratio.
8. | Income Taxes |
Our effective tax rate was 29% and 27% for the nine months ended September 30, 2017 and 2016, respectively, and 33% and 21% for the three months ended September 30, 2017 and 2016, respectively. The effective tax rates for the nine and three months ended September 30, 2017 and 2016 were lower than the federal statutory rate primarily due to favorable foreign income tax rate differentials, deferred tax benefits as a result of a U.K. income tax rate reduction enacted in the third quarter of 2016, and tax benefits associated with a divestiture in the second quarter of 2017, partially offset by state income taxes including additional tax expense from an Illinois corporate income tax rate increase enacted in the third quarter of 2017. Favorable foreign income tax rate differentials result primarily from lower income tax rates in the U.K. and various other lower tax jurisdictions as compared to the income tax rates in the U.S.
The effective tax rate for the three months ended September 30, 2017 is higher than the effective tax rate for the comparable period in 2016 primarily because of deferred tax benefits from a U.K. corporate income tax reduction in the third quarter of 2016 and additional tax expense as a result of an Illinois corporate income tax rate increase enacted in the third quarter of 2017. The same U.K. and Illinois factors affect the effective tax rate comparison for the nine months ended September 30, 2017 and 2016. Additionally, the nine month effective tax rate difference is impacted by tax benefits associated with a divestiture during the second quarter of 2017, partially offset by an income tax expense increase due to a relatively higher U.S. mix of income.
Our non-U.S. subsidiaries had $4.3 billion in cumulative undistributed earnings as of September 30, 2017. This amount represents the post-income tax earnings under U.S. GAAP adjusted for previously taxed income. The earnings from our non-U.S. subsidiaries are considered to be indefinitely reinvested. Accordingly, no provision for U.S. federal and state income taxes has been made in the accompanying consolidated financial statements. Further, a determination of the unrecognized deferred tax liability is not
15
practicable. Any future distribution by way of dividend of these non-U.S. earnings may subject us to both U.S. federal and state income taxes, as adjusted for non-U.S. tax credits, and withholding taxes payable to various non-U.S. countries.
9. | Clearing Organizations |
We operate regulated central counterparty clearing houses for the settlement and clearance of derivative contracts. The clearing houses include ICE Clear Europe, ICE Clear Credit, ICE Clear US, ICE Clear Canada, ICE Clear Netherlands and ICE Clear Singapore (referred to herein collectively as the “ICE Clearing Houses”).
• | ICE Clear Europe performs the clearing and settlement for all futures and options contracts traded through ICE Futures Europe and ICE Endex, for energy futures and options contracts trading through ICE Futures U.S., and for CDS contracts submitted for clearing in Europe. |
• | ICE Clear Credit performs the clearing and settlement for CDS contracts submitted for clearing in North America. |
• | ICE Clear US performs the clearing and settlement of agricultural, metals, currencies and financial futures and options contracts traded through ICE Futures U.S. |
• | ICE Clear Canada performs the clearing and settlement for all futures and options contracts traded through ICE Futures Canada. |
• | ICE Clear Netherlands offers clearing for equity options. |
• | ICE Clear Singapore performs the clearing and settlement for all futures and options contracts traded through ICE Futures Singapore. |
Each of the ICE Clearing Houses requires all clearing members to maintain cash on deposit or pledge certain assets, which may include government obligations, non-government obligations or gold to guarantee performance of the clearing members’ open positions. Such amounts in total are known as “original margin”. The ICE Clearing Houses may make intraday original margin calls in circumstances where market conditions require additional protection. The daily profits and losses from and to the ICE Clearing Houses due to the marking-to-market of open contracts are known as “variation margin”. The ICE Clearing Houses mark all outstanding contracts to market, and therefore pay and collect variation margin, at least once daily, and in some cases multiple times throughout the day. Marking-to-market allows the ICE Clearing Houses to identify any clearing members that may be unable to satisfy the financial obligations resulting from changes in the prices of their open contracts before those financial obligations become exceptionally large and jeopardize the ability of the ICE Clearing Houses to ensure financial performance of clearing members’ open positions.
Each of the ICE Clearing Houses requires that each clearing member make deposits into a fund known as a “guaranty fund”, which is maintained by the relevant ICE Clearing House. These amounts serve to secure the obligations of a clearing member to the ICE Clearing House to which it has made the guaranty fund deposit and may be used to cover losses sustained by the respective ICE Clearing House in the event of a default of a clearing member.
The ICE Clearing Houses seek to reduce their exposure through a risk management program that includes initial and ongoing financial standards for clearing member admission and continued membership, original and variation margin requirements, and mandatory deposits to the guaranty fund. The amounts that the clearing members are required to maintain in the original margin and guaranty fund accounts are determined by standardized parameters established by the risk management departments and reviewed by the risk committees and the boards of directors of each of the ICE Clearing Houses and may fluctuate over time. As of September 30, 2017 and December 31, 2016, the ICE Clearing Houses have received or have been pledged $91.6 billion and $95.7 billion, respectively, in cash and non-cash collateral in original margin and guaranty fund deposits to cover price movements of underlying contracts for both periods. The ICE Clearing Houses also have powers of assessment that provide the ability to collect additional funds from their clearing members to cover a defaulting member’s remaining obligations up to the limits established under the respective rules of each ICE Clearing House.
Should a particular clearing member fail to deposit original margin, or fail to make a variation margin payment, when and as required, the relevant ICE Clearing House may liquidate or hedge the clearing member’s open positions and use the clearing member’s original margin and guaranty fund deposits to make up any amount owed. In the event that those deposits are not sufficient to pay the amount owed in full, the ICE Clearing Houses may utilize the respective guaranty fund deposits of their respective clearing members on a pro-rata basis for that purpose.
We have contributed cash of $150 million, $50 million and $50 million to the guaranty funds of ICE Clear Europe, ICE Clear Credit and ICE Clear US, respectively, as of September 30, 2017, and such amounts are at risk and could be used in the event of a clearing member default where the amount of the defaulting clearing member’s original margin and guaranty fund deposits are insufficient. We have also contributed $4 million in cash in total to the guaranty funds of ICE Clear Canada, ICE Clear Netherlands and ICE Clear Singapore. The $254 million combined contributions to the guaranty funds as of September 30, 2017 and December 31, 2016 are included in long-term restricted cash in the accompanying consolidated balance sheets.
16
As of September 30, 2017, our cash margin deposits and guaranty fund were as follows for the ICE Clearing Houses (in millions):
ICE Clear Europe | ICE Clear Credit | ICE Clear US | Other ICE Clearing Houses | Total | |||||||||||||||
Original margin | $ | 20,686 | $ | 21,911 | $ | 4,004 | $ | 103 | $ | 46,704 | |||||||||
Guaranty fund | 3,025 | 2,345 | 305 | 22 | 5,697 | ||||||||||||||
Total | $ | 23,711 | $ | 24,256 | $ | 4,309 | $ | 125 | $ | 52,401 | |||||||||
As of December 31, 2016, our cash margin deposits and guaranty fund were as follows for the ICE Clearing Houses (in millions):
ICE Clear Europe | ICE Clear Credit | ICE Clear US | Other ICE Clearing Houses | Total | |||||||||||||||
Original margin | $ | 27,046 | $ | 16,833 | $ | 6,184 | $ | 107 | $ | 50,170 | |||||||||
Guaranty fund | 2,444 | 2,135 | 316 | 85 | 4,980 | ||||||||||||||
Total | $ | 29,490 | $ | 18,968 | $ | 6,500 | $ | 192 | $ | 55,150 | |||||||||
We have recorded these cash deposits in the accompanying consolidated balance sheets as current assets with corresponding current liabilities to the clearing members of the relevant ICE Clearing House. All cash and securities are available only to meet the financial obligations of that clearing member to the relevant ICE Clearing House. ICE Clear Europe, ICE Clear Credit, ICE Clear US, ICE Clear Canada, ICE Clear Netherlands and ICE Clear Singapore are separate legal entities and are not subject to the liabilities of the other ICE Clearing Houses or the obligations of the members of the other ICE Clearing Houses. The amount of these cash deposits may fluctuate due to the types of margin collateral choices available to clearing members and the change in the amount of deposits required. As a result, these assets and corresponding liabilities may vary significantly over time.
Of the cash held by the ICE Clearing Houses, as of September 30, 2017, $28.3 billion is secured in reverse repurchase agreements with primarily overnight maturities or direct investment in government securities. ICE Clear Credit, a systemically important financial market utility as designated by the Financial Stability Oversight Council, held $19.7 billion of its U.S. dollar cash in the guaranty fund and in original margin in cash accounts at the Federal Reserve Bank of Chicago as of September 30, 2017. During the quarter ended September 30, 2017, ICE Clear Europe established a Euro denominated account at the De Nederlandsche Bank, or DNB, the central bank of the Netherlands. This account provides the flexibility for ICE Clear Europe to place Euro denominated cash margin securely at a national bank, in particular during periods when liquidity in the Euro repo markets may temporarily become contracted, such as over a quarter or year end. As of September 30, 2017, ICE Clear Europe held $1.5 billion at DNB. The remaining cash deposits at the ICE Clearing Houses are held in demand deposit accounts at large, highly rated financial institutions and directly in U.S. Treasury securities with original maturities of less than 12 months. The carrying value of these securities approximates their fair value due to the short-term nature of the instruments and repurchase agreements.
In addition to the cash deposits for original margin and the guaranty fund, the ICE Clearing Houses have also received other assets from clearing members, which include government obligations, and may include other non-cash collateral such as certain agency and corporate debt or gold to mitigate credit risk. These assets are not reflected in the accompanying consolidated balance sheets as the risks and rewards of these assets remain with the clearing members unless the ICE Clearing Houses have sold or re-pledged the assets or in the event of a clearing member default, where the clearing member is no longer entitled to redeem the assets. Any income, gain or loss accrues to the clearing member. For certain non-cash deposits, the ICE Clearing Houses may impose discount or “haircut” rates to ensure adequate collateral levels to account for fluctuations in the market value of these deposits. As of September 30, 2017 and December 31, 2016, the assets pledged by the clearing members as original margin and guaranty fund deposits for each of the ICE Clearing Houses are detailed below (in millions):
As of September 30, 2017 | As of December 31, 2016 | ||||||||||||||||||||||||||||||
ICE Clear Europe | ICE Clear Credit | ICE Clear US | Other ICE Clearing Houses | ICE Clear Europe | ICE Clear Credit | ICE Clear US | Other ICE Clearing Houses | ||||||||||||||||||||||||
Original margin: | |||||||||||||||||||||||||||||||
Government securities at face value | $ | 24,611 | $ | 4,339 | $ | 9,738 | $ | 24 | $ | 22,961 | $ | 6,013 | $ | 10,542 | $ | 37 | |||||||||||||||
Other | — | — | — | — | — | — | — | 368 | |||||||||||||||||||||||
Total | $ | 24,611 | $ | 4,339 | $ | 9,738 | $ | 24 | $ | 22,961 | $ | 6,013 | $ | 10,542 | $ | 405 | |||||||||||||||
Guaranty fund: | |||||||||||||||||||||||||||||||
Government securities at face value | $ | 305 | $ | 42 | $ | 160 | $ | 2 | $ | 217 | $ | 178 | $ | 147 | $ | 40 | |||||||||||||||
17
10. | Held for Sale |
On December 11, 2015, we acquired 100% of Trayport in a stock transaction. The total purchase price was $620 million, comprised of 12.6 million shares of our common stock. Trayport is a software company that licenses its technology to serve exchanges, OTC brokers and traders to facilitate electronic and hybrid trade execution primarily in the energy markets.
The U.K. Competition and Markets Authority, or the CMA, undertook a review of our acquisition of Trayport under the merger control laws of the U.K. In October 2016, the CMA issued its findings and ordered a divestment of Trayport to remedy what the CMA determined to be a substantial lessening of competition. In November 2016, we filed an appeal with the Competition Appeal Tribunal, or the CAT, to challenge the CMA’s decision. In March 2017, the CAT upheld the CMA decision that we should divest Trayport. Following the CAT’s judgment, we asked for leave to appeal the CAT’s decision at the U.K. Court of Appeals. In May 2017, the U.K. Court of Appeals denied our request for leave to appeal. We are obligated to sell Trayport by January 2018.
The functional currency of Trayport is the pound sterling, as this is the currency in which Trayport operates. The $620 million in Trayport net assets were recorded on our December 11, 2015 opening balance sheet at a pound sterling/U.S. dollar exchange rate of 1.5218 (£407 million). Because our consolidated financial statements are presented in U.S. dollars, we must translate the Trayport net assets into U.S. dollars at the exchange rates in effect at the end of each reporting period. Therefore, increases or decreases in the value of the U.S. dollar against the pound sterling will affect the value of the Trayport balance sheet, with gains or losses included in the cumulative translation adjustment account, a component of equity. As a result of the decrease in the pounds sterling/U.S. dollar exchange rate to 1.3398 as of September 30, 2017, the portion of our equity attributable to the Trayport net assets in accumulated other comprehensive loss from foreign currency translation was $74 million as of September 30, 2017.
As of June 30, 2017, we classified Trayport as held for sale and ceased depreciation and amortization of the property and equipment and other intangible assets (Note 2). As of September 30, 2017, the adjusted carrying value of Trayport’s net assets is $609 million, which is equal to the $535 million carrying value plus the $74 million in accumulated other comprehensive loss from foreign currency translation.
On October 27, 2017, we entered into a definitive agreement to sell Trayport to TMX Group for £550 million ($722 million based on the pounds sterling/U.S. dollar exchange rate of 1.3129 as of October 27, 2017). The proceeds of such sale will include a combination of cash and our acquisitions of Natural Gas Exchange, Inc., or NGX, and Shorcan Energy Brokers Inc., or Shorcan Energy, both wholly-owned subsidiaries of TMX Group. NGX, headquartered in Calgary, provides electronic trading, central counterparty clearing and data services to the North American natural gas, electricity and oil markets. Shorcan Energy offers brokerage services for the North American crude oil markets. If regulatory approval for the acquisitions of NGX and Shorcan Energy is not received within the required time to complete the sale of Trayport, then the sale of Trayport will proceed for cash consideration in the amount of £550 million and we would have one year from the signing date to close on the acquisitions of NGX and Shorcan Energy for cash consideration payable to TMX Group. We will recognize a gain on the closing of this transaction, equal to the gross proceeds received from TMX Group, less the adjusted carrying value and the costs to sell Trayport.
Trayport is included in our data and listings segment. The total assets held for sale as of September 30, 2017 were $595 million and were reclassified and are included in “prepaid expenses and other current assets” in our accompanying consolidated balance sheet and the total liabilities held for sale as of September 30, 2017 were $60 million and were reclassified and are included in “other current liabilities” in our accompanying consolidated balance sheet. The carrying amounts of the major classes of assets and liabilities of Trayport are as follows as of September 30, 2017 (in millions):
18
Assets held for sale: | |||
Cash and cash equivalents | $ | 5 | |
Goodwill | 341 | ||
Other intangibles, net | 220 | ||
Other current and non-current assets | 29 | ||
Total assets held for sale (included in prepaid expenses and other current assets) | $ | 595 | |
Liabilities held for sale: | |||
Deferred tax liabilities, net | $ | 39 | |
Other current and non-current liabilities | 21 | ||
Total liabilities held for sale (included in other current liabilities) | $ | 60 | |
Accumulated other comprehensive loss from foreign currency translation classified as held for sale in equity | $ | 74 | |
11. | Fair Value Measurements |
Our financial instruments consist primarily of cash and cash equivalents, short-term and long-term restricted cash and investments, short-term and long-term investments, customer accounts receivable, margin deposits and guaranty funds, cost and equity method investments, short-term and long-term debt and certain other short-term assets and liabilities. The fair value of our financial instruments are measured based on a three-level hierarchy:
• | Level 1 inputs — quoted prices for identical assets or liabilities in active markets. |
• | Level 2 inputs — observable inputs other than Level 1 inputs such as quoted prices for similar assets and liabilities in active markets or inputs other than quoted prices that are directly observable. |
• | Level 3 inputs — unobservable inputs supported by little or no market activity and that are significant to the fair value of the assets or liabilities. |
We use Level 1 inputs to determine fair value. The Level 1 assets consist of U.S. Treasury securities, equity and other securities listed in active markets, and investments in publicly traded mutual funds held for the purpose of providing future payments of the supplemental executive retirement and the supplemental executive savings plans.
Financial assets and liabilities recorded in the accompanying consolidated balance sheets as of September 30, 2017 and December 31, 2016 are classified in their entirety based on the lowest level of input that is significant to the asset or liability’s fair value measurement. Financial instruments measured at fair value on a recurring basis as of September 30, 2017 and December 31, 2016 are as follows (in millions):
As of September 30, 2017 | As of December 31, 2016 | ||||||||||||||||||||||
Level 1 | Level 2 and 3 | Total | Level 1 | Level 2 and 3 | Total | ||||||||||||||||||
Assets at fair value: | |||||||||||||||||||||||
Long-term investment in equity securities | $ | — | $ | — | $ | — | $ | 432 | $ | — | $ | 432 | |||||||||||
U.S. Treasury securities | 734 | — | 734 | 500 | — | 500 | |||||||||||||||||
Mutual Funds | 16 | — | 16 | 23 | — | 23 | |||||||||||||||||
Total assets at fair value | $ | 750 | $ | — | $ | 750 | $ | 955 | $ | — | $ | 955 | |||||||||||
As of September 30, 2017, the fair value of our $495 million 2027 Senior Notes was $498 million, the fair value of our $1.24 billion 2025 Senior Notes was $1.32 billion, the fair value of our $791 million 2023 Senior Notes was $851 million, the fair value of our $495 million 2022 Senior Notes was $499 million, the fair value of our $1.24 billion 2020 Senior Notes was $1.28 billion, and the fair value of our $599 million 2018 Senior Notes was $604 million. The fair values of these fixed rate notes were estimated using quoted market prices for these instruments. The fair value of our commercial paper approximates the carrying value since the rates of interest on this short-term debt approximate market rates as of September 30, 2017. All other financial instruments are determined to approximate carrying value due to the short period of time to their maturities.
Until March 29, 2017, we held a 12% ownership interest in Cetip, S.A., or Cetip, which we classified as an available-for-sale long-term investment. Cetip was recorded at its fair value using its quoted market price. Changes in the fair value of available-for-sale securities are reflected in accumulated other comprehensive income, and include the effects of both stock price and foreign currency
19
translation fluctuations. The unrealized holding gains and losses are excluded from earnings and reported in other comprehensive income until realized. Realized gains and losses, and declines in value deemed to be other-than-temporary, are recognized in earnings.
We acquired the common stock of Cetip for an aggregate consideration of $514 million in cash in July 2011. During the year ended December 31, 2013, we recognized an impairment loss on our Cetip investment of $190 million, primarily due to unfavorable foreign exchange rate changes, which was equal to the difference between the $324 million fair value as of December 31, 2013 and the original investment cost of $514 million. The $324 million fair value of the Cetip investment as of December 31, 2013 became our new cost basis. The long-term investment in equity securities as of December 31, 2016 represents our investment in Cetip, which was valued at $432 million, including a $108 million accumulated unrealized gain.
On March 29, 2017, Cetip and BM&FBOVESPA S.A. finalized a merger agreement. BM&FBOVESPA S.A., which changed its name to B3 S.A. - Brasil, Bolsa, Balcao, or B3, following the merger with Cetip, is a stock exchange and operator of registration, clearing, custodial and settlement services for equities, financial securities, indices, rates, commodities and currencies and is located in São Paulo, Brazil. The merger valued our Cetip investment at $500 million. We received the proceeds in cash and in B3 common stock.
The cash component was valued at $319 million, which was subject to Brazilian capital gains tax of $28 million that was remitted to the Brazilian tax authorities in March 2017. We received net cash proceeds in April 2017 of $286 million, which is net of a foreign exchange loss of $6 million that was incurred in April 2017. We received 29,623,756 B3 common shares valued at their quoted market price of $181 million. In April 2017, we sold the B3 common shares for net proceeds of $152 million, which is net of a capital gain tax of $26 million that was remitted to the Brazilian tax authorities and further transaction expenses of $3 million that were incurred in April 2017. We used the $438 million in net cash and stock proceeds received from the merger and sale of B3 shares to pay down amounts outstanding under our Commercial Paper Program and for share repurchases.
The $500 million fair value of our investment in Cetip included an accumulated unrealized gain of $176 million, based on the $324 million cost basis. In connection with the sale of our equity investment in Cetip, the $176 million, accumulated unrealized gain was reclassified out of accumulated other comprehensive income and was recognized in other income as a realized investment gain in the accompanying consolidated statement of income for the nine months ended September 30, 2017.
As of September 30, 2017, we held $734 million in U.S. Treasury securities. Of these securities, $534 million were recorded as short-term restricted cash and investments and $200 million were recorded as long-term restricted cash and investments in the accompanying consolidated balance sheet as of September 30, 2017. We account for the U.S. Treasury securities held using the available-for-sale method.
Mutual funds represent equity and fixed income mutual funds held for the purpose of providing future payments for the supplemental executive savings plan and the supplemental executive retirement plan and are classified as available-for-sale securities.
We did not use Level 2 and 3 inputs to determine the fair value of assets or liabilities measured at fair value on a recurring basis as of September 30, 2017 or December 31, 2016. We measure certain assets, such as intangible assets and cost and equity method investments, at fair value on a non-recurring basis. These assets are recognized at fair value if they are deemed to be impaired. As of September 30, 2017 and December 31, 2016, none of these assets were required to be recorded at fair value since no impairments were recorded.
12. | Segment Reporting |
We operate two business segments: our Trading and Clearing segment and our Data and Listings segment. This presentation is reflective of how our chief operating decision maker reviews and operates our business. Our Trading and Clearing segment comprises our transaction-based execution and clearing businesses. Our Data and Listings segment comprises our subscription-based data services and securities listings businesses. Our chief operating decision maker does not review total assets, intersegment revenues/expenses or statements of income below operating income by segments; therefore, such information is not presented below. Financial data for our business segments is as follows for the nine and three months ended September 30, 2017 and 2016 (in millions):
20
Trading and Clearing Segment | Data and Listings Segment | Consolidated | |||||||||
Nine Months Ended September 30, 2017: | |||||||||||
Revenues, less transaction-based expenses | $ | 1,611 | $ | 1,874 | $ | 3,485 | |||||
Operating expenses | 643 | 1,055 | 1,698 | ||||||||
Operating income | 968 | 819 | 1,787 | ||||||||
Nine Months Ended September 30, 2016: | |||||||||||
Revenues, less transaction-based expenses | $ | 1,584 | $ | 1,777 | $ | 3,361 | |||||
Operating expenses | 672 | 1,080 | 1,752 | ||||||||
Operating income | 912 | 697 | 1,609 | ||||||||
Trading and Clearing Segment | Data and Listings Segment | Consolidated | |||||||||
Three Months Ended September 30, 2017 | |||||||||||
Revenues, less transaction-based expenses | $ | 523 | $ | 620 | $ | 1,143 | |||||
Operating expenses | 213 | 334 | 547 | ||||||||
Operating income | 310 | 286 | 596 | ||||||||
Three Months Ended September 30, 2016 | |||||||||||
Revenues, less transaction-based expenses | $ | 483 | $ | 595 | $ | 1,078 | |||||
Operating expenses | 245 | 359 | 604 | ||||||||
Operating income | 238 | 236 | 474 | ||||||||
Revenue from two clearing members of our Trading and Clearing segment comprised 10% of our Trading and Clearing revenues for the nine and three months ended September 30, 2017 and revenue from one clearing member of our Trading and Clearing segment comprised 10% of our Trading and Clearing revenues for the nine and three months ended September 30, 2016. Clearing members are primarily intermediaries and represent a broad range of principal trading firms. If a clearing member ceased its operations, we believe that the trading firms would continue to conduct transactions and would clear those transactions through another clearing member firm. No additional customers or clearing members accounted for more than 10% of our segment revenues or consolidated revenues for the nine and three months ended September 30, 2017 and 2016.
13. | Earnings Per Common Share |
The following is a reconciliation of the numerators and denominators of the basic and diluted earnings per common share computations for the nine and three months ended September 30, 2017 and 2016 (in millions, except per share amounts):
Nine Months Ended September 30, | Three Months Ended September 30, | ||||||||||||||
2017 | 2016 | 2017 | 2016 | ||||||||||||
Basic: | |||||||||||||||
Net income attributable to Intercontinental Exchange, Inc. | $ | 1,289 | $ | 1,070 | $ | 369 | $ | 344 | |||||||
Weighted average common shares outstanding | 591 | 595 | 588 | 596 | |||||||||||
Basic earnings per common share | $ | 2.18 | $ | 1.80 | $ | 0.63 | $ | 0.58 | |||||||
Diluted: | |||||||||||||||
Weighted average common shares outstanding | 591 | 595 | 588 | 596 | |||||||||||
Effect of dilutive securities - stock options and restricted shares | 4 | 4 | 4 | 4 | |||||||||||
Diluted weighted average common shares outstanding | 595 | 599 | 592 | 600 | |||||||||||
Diluted earnings per common share | $ | 2.17 | $ | 1.79 | $ | 0.62 | $ | 0.57 | |||||||
Basic earnings per common share is calculated using the weighted average common shares outstanding during the period. Common equivalent shares from stock options and restricted stock awards, using the treasury stock method, are included in the diluted per share calculations unless the effect of their inclusion would be antidilutive. During the nine months ended September 30, 2017 and 2016, 7,380 and 715,955 outstanding stock options, respectively, were not included in the computation of diluted earnings per common share since the inclusion would have had an antidilutive effect because the outstanding stock option exercise prices were
21
greater than the average market price of the common shares during the relevant periods. Certain figures in the table above may not recalculate due to rounding.
14. | Subsequent Events |
We have evaluated subsequent events and determined that no events or transactions met the definition of a subsequent event for purposes of recognition or disclosure in the accompanying consolidated financial statements except those events disclosed in Notes 2, 3 and 10.
22
ITEM 2. | MANAGEMENT’S DISCUSSION AND ANALYSIS OF FINANCIAL CONDITION AND RESULTS OF OPERATIONS |
This Quarterly Report on Form 10-Q, including the sections entitled “Notes to Consolidated Financial Statements”, “Legal Proceedings” and “Management’s Discussion and Analysis of Financial Condition and Results of Operations”, contains “forward-looking statements” as defined in the Private Securities Litigation Reform Act of 1995. Any statements contained herein that are not statements of historical fact may be forward-looking statements. Any forward looking statements are based on our present beliefs and assumptions as well as the information currently available to us. Forward-looking statements may be introduced by or contain terminology such as “may”, “will”, “should”, “could”, “would”, “targets”, “goal”, “expect”, “intend”, “plan”, “anticipate”, “believe”, “estimate”, “predict”, “potential”, “continue”, or the antonyms of these terms or other comparable terminology. These statements relate to future events or our future financial performance and involve known and unknown risks, uncertainties and other factors that may cause our results, levels of activity, performance, cash flows, financial position or achievements to differ materially from those expressed or implied by these forward-looking statements. These risks and other factors include those set forth in Item 1(A) under the caption “Risk Factors” in our Annual Report on Form 10-K for the year ended December 31, 2016, or our 2016 Form 10-K, as filed with the SEC on February 7, 2017.
Forward-looking statements and other risks and factors that may affect our performance include, but are not limited to: conditions in global financial markets and domestic and international economic, political and social conditions; the impact of the introduction of or any changes in laws, regulations, rules or government policy with respect to financial markets, increased regulatory scrutiny or enforcement actions and our ability to comply with these requirements; volatility in commodity prices, equity prices, and price volatility of financial benchmarks and instruments such as interest rates, credit spreads, equity indices and foreign exchange rates; the business environment in which we operate and trends in our industry, including trading volumes, clearing, data services, fees, changing regulations, competition and consolidation; the success of our clearing houses and our ability to minimize the risks associated with operating clearing houses in multiple jurisdictions; the success of our equity exchanges and the exchanges’ compliance with their regulatory and oversight responsibilities; the resilience of our electronic platforms and soundness of our business continuity and disaster recovery plans; continued high renewal rates of subscription-based data revenues; our ability to identify and effectively pursue, implement and integrate acquisitions and strategic alliances; our ability to complete and realize the synergies and benefits of our acquisitions within the expected time frame, and to integrate acquired operations with our business; our ability to effectively maintain our growth; the performance and reliability of our other technologies and those of third party service providers, including our ability to keep pace with technological developments and ensure that the technology we utilize is not vulnerable to security risks or other disruptive events; our ability to identify trends and adjust our business to benefit from such trends; the accuracy of our cost and other financial estimates and our belief that cash flows from operations will be sufficient to service our debt and fund our operational and capital expenditure needs; our ability to maintain existing market participants and data customers, and attract new ones, and to offer additional products and services, leverage our risk management capabilities and enhance our technology in a timely and cost-effective fashion; our ability to attract and retain key talent; our ability to protect our intellectual property rights and to operate our business without violating the intellectual property rights of others; and potential adverse results of threatened or pending litigation and regulatory actions and proceedings.
We caution you not to place undue reliance on any forward-looking statements as they speak only as of the date on which such statements were made, and we undertake no obligation to update any forward-looking statement or to reflect the occurrence of an unanticipated event. New factors emerge from time to time, and it is not possible for management to predict all factors that may affect our business and prospects. Further, management cannot assess the impact of each factor on the business or the extent to which any factor, or combination of factors, may cause actual results to differ materially from those contained in any forward-looking statements.
In this Quarterly Report on Form 10-Q, unless otherwise indicated, the terms “Intercontinental Exchange”, “ICE”, “we”, “us”, “our”, “our company” and “our business” refer to Intercontinental Exchange, Inc., together with its consolidated subsidiaries. Due to rounding, figures may not sum exactly.
Overview
We are a leading global operator of regulated exchanges, clearing houses and listings venues, and a provider of data services for commodity and financial markets. We operate regulated marketplaces for trading, listing and clearing a broad array of derivatives contracts and securities across major asset classes, including energy and agricultural commodities, interest rates, equities, equity derivatives, exchange traded funds, credit derivatives, bonds and currencies. We offer end-to-end market data services to support the trading, investment and risk management needs of customers across virtually all asset classes.
Our exchanges include futures exchanges in the U.S., U.K., EU, Canada and Singapore, and cash equities, equity options and bond exchanges in the U.S. We also operate OTC markets for physical energy and CDS trade execution. To serve global derivatives markets, we operate central counterparty clearing houses in the U.S., U.K., EU, Canada and Singapore. We offer a range of data services for global financial and commodity markets, including pricing and reference data, exchange data, analytics, feeds, desktop and connectivity solutions. Through our markets, clearing houses, listings and market data services, we provide end-to-end solutions
23
for our customers through liquid markets, benchmark products, access to capital markets, and related services to support their ability to manage risk and raise capital. Our business is currently conducted as two reportable business segments, our Trading and Clearing segment and our Data and Listings segment, and the majority of our identifiable assets are located in the U.S. and U.K.
Recent Developments
Pending Divestiture of Trayport and Its Classification as Held for Sale
On December 11, 2015, we acquired 100% of Trayport in a stock transaction. The total purchase price was $620 million, comprised of 12.6 million shares of our common stock. Trayport is a software company that licenses its technology to serve exchanges, OTC brokers and traders to facilitate electronic and hybrid trade execution primarily in the energy markets.
The U.K. Competition and Markets Authority, or the CMA, undertook a review of our acquisition of Trayport under the merger control laws of the U.K. In October 2016, the CMA issued its findings and ordered a divestment of Trayport to remedy what the CMA determined to be a substantial lessening of competition. In November 2016, we filed an appeal with the Competition Appeal Tribunal, or the CAT, to challenge the CMA’s decision. In March 2017, the CAT upheld the CMA decision that we should divest Trayport. Following the CAT’s judgment, we asked for leave to appeal the CAT’s decision at the U.K. Court of Appeals. In May 2017, the U.K. Court of Appeals denied our request for leave to appeal. We are obligated to sell Trayport by January 2018.
The functional currency of Trayport is the pound sterling, as this is the currency in which Trayport operates. The $620 million in Trayport net assets were recorded on our December 11, 2015 opening balance sheet at a pound sterling/U.S. dollar exchange rate of 1.5218 (£407 million). Because our consolidated financial statements are presented in U.S. dollars, we must translate the Trayport net assets into U.S. dollars at the exchange rates in effect at the end of each reporting period. Therefore, increases or decreases in the value of the U.S. dollar against the pound sterling will affect the value of the Trayport balance sheet, with gains or losses included in the cumulative translation adjustment account, a component of equity. As a result of the decrease in the pounds sterling/U.S. dollar exchange rate to 1.3398 as of September 30, 2017, the portion of our equity attributable to the Trayport net assets in accumulated other comprehensive loss from foreign currency translation was $74 million as of September 30, 2017.
As of June 30, 2017, we classified Trayport as held for sale and ceased depreciation and amortization of the property and equipment and other intangible assets (Note 2). As of September 30, 2017, the adjusted carrying value of Trayport’s net assets is $609 million, which is equal to the $535 million carrying value plus the $74 million in accumulated other comprehensive loss from foreign currency translation.
On October 27, 2017, we entered into a definitive agreement to sell Trayport to TMX Group for £550 million ($722 million based on the pounds sterling/U.S. dollar exchange rate of 1.3129 as of October 27, 2017). The proceeds of such sale will include a combination of cash and our acquisitions of Natural Gas Exchange, Inc., or NGX, and Shorcan Energy Brokers Inc., or Shorcan Energy, both wholly-owned subsidiaries of TMX Group. NGX, headquartered in Calgary, provides electronic trading, central counterparty clearing and data services to the North American natural gas, electricity and oil markets. Shorcan Energy offers brokerage services for the North American crude oil markets. If regulatory approval for the acquisitions of NGX and Shorcan Energy is not received within the required time to complete the sale of Trayport, then the sale of Trayport will proceed for cash consideration in the amount of £550 million and we would have one year from the signing date to close on the acquisitions of NGX and Shorcan Energy for cash consideration payable to TMX Group. We will recognize a gain on the closing of this transaction, equal to the gross proceeds received from TMX Group, less the adjusted carrying value and the costs to sell Trayport.
Trayport is included in our data and listings segment. The total assets held for sale as of September 30, 2017 were $595 million and were reclassified and are included in “prepaid expenses and other current assets” in our accompanying consolidated balance sheet and the total liabilities held for sale as of September 30, 2017 were $60 million and were reclassified and are included in “other current liabilities” in our accompanying consolidated balance sheet. Refer to note 10 to our consolidated financial statements and related notes, which are included elsewhere in this Quarterly Report, for more information on the pending divestiture of Trayport and its classification as held for sale.
Pending Acquisition of Virtu BondPoint
On October 24, 2017, we entered into a definitive agreement to acquire 100% of Virtu BondPoint from Virtu Financial, Inc. for $400 million in cash. The transaction is expected to close in the first quarter of 2018, and the closing is subject to applicable regulatory reviews and approvals. Virtu BondPoint is a leading provider of electronic fixed income trading solutions for the buy-side and sell-side offering access to centralized liquidity and automated trade execution services through its ATS linking more than 500 financial services firms.
24
Investment in Euroclear
On October 24, 2017, we acquired a 4.7% stake in Euroclear for €275 million ($326 million) in cash. Euroclear is a leading provider of post-trade services, including settlement, central securities depositories and related services for cross-border transactions across asset classes.
Acquisition of Global Research Division’s Index Business from Bank of America Merrill Lynch (BofAML)
On October 20, 2017, we acquired BofAML's Global Research division’s index business. BofAML indices are the second largest group of fixed income indices as measured by assets under management, or AUM, globally. The AUM benchmarked against our combined fixed income indices is nearly $1 trillion, and the indices have been re-branded as the ICE BofAML indices.
Purchase of Minority Interests
During June 2017, we purchased both Gasunie’s 21% minority ownership interest in ICE Endex and ABN AMRO Clearing Bank N.V.’s 25% minority ownership interest in ICE Clear Netherlands. Subsequent to these acquisitions, we own 100% of ICE Endex and ICE Clear Netherlands and will no longer include any non-controlling interest amounts for ICE Endex and ICE Clear Netherlands in our consolidated financial statements. During April 2017, we purchased 3.2% of the net profit sharing interest in our CDS clearing subsidiaries from a non-ICE limited partner and the remaining non-ICE limited partners hold a 39.3% net profit sharing interest as of September 30, 2017. See “- Consolidated Non-Operating Income (Expense)” below.
NYSE Governance Services Divestiture
On June 1, 2017, we sold NYSE Governance Services to Marlin Heritage, L.P. NYSE Governance Services provides governance and compliance analytics and education solutions for organizations and their boards of directors through dynamic learning solutions. We recognized a net loss of $6 million on the sale of NYSE Governance Services, which was recorded as amortization expense within our data and listings segment in the accompanying consolidated statements of income for the nine months ended September 30, 2017.
TMX Atrium Acquisition
On May 1, 2017, we acquired 100% of TMX Atrium, a global extranet and wireless services business, from TMX Group. TMX Atrium provides low-latency access to markets and market data across 12 countries, more than 30 major trading venues, and ultra-low latency wireless connectivity to access markets and market data in the Toronto, New Jersey and Chicago metro areas. The wireless assets consist of microwave and millimeter networks that transport market data and provide private bandwidth. Our customers are increasingly seeking wireless services for use in their trading strategies. TMX Atrium is now part of ICE Data Services and is being integrated with our connectivity services.
Cetip Investment Gain
Until March 29, 2017, we held a 12% ownership interest in Cetip, which we classified as an available-for-sale long-term investment. On March 29, 2017, Cetip and BM&FBOVESPA S.A. finalized a merger agreement. BM&FBOVESPA S.A., which changed its name to B3 S.A. - Brasil, Bolsa, Balcao, or B3, following the merger with Cetip, is a stock exchange and operator of registration, clearing, custodial and settlement services for equities, financial securities, indices, rates, commodities and currencies and is located in São Paulo, Brazil. The merger valued our Cetip investment at $500 million. We received the proceeds in cash and in B3 common stock.
The cash component was valued at $319 million, which was subject to Brazilian capital gains tax of $28 million that was remitted to the Brazilian tax authorities in March 2017. We received net cash proceeds in April 2017 of $286 million, which is net of a foreign exchange loss of $6 million that was incurred in April 2017. We received 29,623,756 B3 common shares valued at their quoted market price of $181 million. In April 2017, we sold the B3 common shares for net proceeds of $152 million, which is net of a capital gain tax of $26 million that was remitted to the Brazilian tax authorities and further transaction expenses of $3 million that were incurred in April 2017. We used the $438 million in net cash and stock proceeds received from the merger and sale of B3 shares to pay down amounts outstanding under our Commercial Paper Program and for share repurchases.
The $500 million fair value of our investment in Cetip included an accumulated unrealized gain of $176 million, based on the $324 million cost basis. In connection with the sale of our equity investment in Cetip, the $176 million accumulated unrealized gain was reclassified out of accumulated other comprehensive income and was recognized in other income as a realized investment gain in the accompanying consolidated statement of income for the nine months ended September 30, 2017.
Refer to note 11 to our consolidated financial statements and related notes, which are included elsewhere in this Quarterly Report, for more information on the Cetip investment gain.
25
Interactive Data Managed Solutions Divestiture
On March 31, 2017, we sold IDMS, a unit of Interactive Data, to FactSet. IDMS is a managed solutions and portal provider for the global wealth management industry. There was no gain or loss recognized on the sale of IDMS.
National Stock Exchange Acquisition
On January 31, 2017, we acquired 100% of National Stock Exchange, Inc., now named NYSE National. The acquisition gives the NYSE Group a fourth U.S. exchange license. NYSE National is distinct from NYSE Group’s three listings exchanges because NYSE National will only be a trading venue and will not be a listings market. NYSE Group’s three listings exchanges, NYSE, NYSE American (NYSE American was formerly known as NYSE MKT) and NYSE Arca, have unique market models designed for corporate and ETF issuers. After closing the transaction, NYSE National ceased operations on February 1, 2017. We will engage with NYSE National members, buy-side participants and retail brokerage firms before finalizing operational plans for NYSE National’s re-launch, which is expected to occur in 2018.
Regulation
Our markets are primarily subject to the jurisdiction of regulatory agencies in the U.S., U.K., EU, Canada and Singapore. Global policy makers have undertaken reviews of their existing legal framework governing financial markets in connection with regulatory reform, and have either passed new laws and regulations, or are in the process of debating and/or enacting new laws and regulations that apply to our business and to our customers’ businesses. Legislative and regulatory actions may impact the way in which we or our customers conduct business and may create uncertainty, which could affect trading volumes or demand for market data. As discussed in Item 1 “Business - Regulation” included in our 2016 Form 10-K, the implementation of Markets in Financial Instruments Directives II, or MiFID II, and its counterpart the European Market Infrastructure Regulation, or EMIR, may result in operational, regulatory and/or business risk.
Most of the specific regulations which support the MiFID II framework have now been approved by the European Parliament and European Council. The European Securities and Markets Authority, or ESMA, and the national regulatory authorities are continuing to work on detailed aspects of the framework which are relevant to the markets operated by ICE Futures Europe and ICE Endex, including position limits and the determination of pre-trade and post-trade price transparency requirements for financial instruments. We expect the entire set of position limits for commodity contracts to be published by the end of 2017. We are accessing any potential market impacts as the requirements are published, however any impacts are uncertain at this time.
In March 2017, the U.K. officially triggered Article 50 and notified the EU of its intention of leaving the EU. The triggering of Article 50 begins the process of withdrawal from the EU, which will last two years unless extended by the unanimous decision of member states. We are monitoring the impact to our business of the U.K. leaving the EU. The impact to our business and corresponding regulatory changes are uncertain at this time, and may not be known in the near future.
In 2017, the Commodity Futures Trading Commission, or CFTC, announced its new agenda calling for regulatory simplification and the reduction of regulatory burdens. The CFTC is looking to restructure its rules by moving away from prescriptive regulations and adopting a principles-based approach. The restructuring of regulations could apply to our business and to our customers’ businesses. Any impacts are uncertain at this time, and may not be known in the near future.
In June 2017, the European Commission published a proposal to revise the current regulatory structure for non-EU clearing houses. The nature and extent of the regulation would depend on the “impact” of a non-EU clearing house’s business in the EU. The publication discusses a “sliding scale” of regulation that includes: continued implementation of the existing EMIR equivalence and recognition regime for low impact non-EU clearing houses; direct regulatory oversight for medium impact non-EU clearing houses; and, with respect to systemically important, high impact, non-EU clearing houses, an undefined “location” requirement. Details on the classification of non-EU clearing will be established by the European Commission in cooperation with ESMA and the European System of Central Banks. The proposal will undergo legislative review by the European Parliament and the EU Member States, and is subject to change. The proposal could have an impact on our non-EU clearing houses to the extent they are deemed to be doing business in Europe.
Financial Highlights
The following summarizes our results and significant changes in our consolidated financial performance for the periods presented (dollars in millions, except per share amounts, and YTD represents the nine-month periods ended September 30th):
26
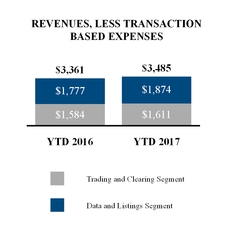
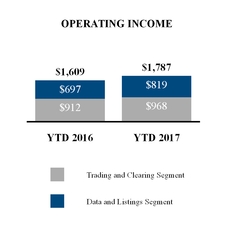
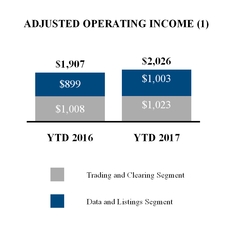
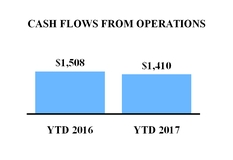
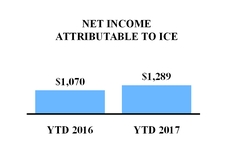
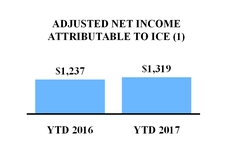
Nine Months Ended September 30, | Three Months Ended September 30, | ||||||||||||||||||||
2017 | 2016 | Change | 2017 | 2016 | Change | ||||||||||||||||
Revenues, less transaction-based expenses | $ | 3,485 | $ | 3,361 | 4 | % | $ | 1,143 | $ | 1,078 | 6 | % | |||||||||
Operating expenses | $ | 1,698 | $ | 1,752 | (3) | % | $ | 547 | $ | 604 | (10) | % | |||||||||
Adjusted operating expenses(1) | $ | 1,459 | $ | 1,454 | — | % | $ | 476 | $ | 484 | (2) | % | |||||||||
Operating income | $ | 1,787 | $ | 1,609 | 11 | % | $ | 596 | $ | 474 | 26 | % | |||||||||
Adjusted operating income(1) | $ | 2,026 | $ | 1,907 | 6 | % | $ | 667 | $ | 594 | 13 | % | |||||||||
Operating margin | 51 | % | 48 | % | 3 pts | 52 | % | 44 | % | 8 pts | |||||||||||
Adjusted operating margin(1) | 58 | % | 57 | % | 1 pt | 58 | % | 55 | % | 3 pts | |||||||||||
Other income (expense), net | $ | 61 | $ | (110 | ) | n/a | $ | (36 | ) | $ | (31 | ) | 14 | % | |||||||
Income tax expense | $ | 537 | $ | 409 | 31 | % | $ | 185 | $ | 93 | 100 | % | |||||||||
Effective tax rate | 29 | % | 27 | % | 2 pts | 33 | % | 21 | % | 12 pts | |||||||||||
Net income attributable to ICE | $ | 1,289 | $ | 1,070 | 21 | % | $ | 369 | $ | 344 | 7 | % | |||||||||
Adjusted net income attributable to ICE(1) | $ | 1,319 | $ | 1,237 | 7 | % | $ | 430 | $ | 385 | 12 | % | |||||||||
Diluted earnings per share attributable to ICE common shareholders | $ | 2.17 | $ | 1.79 | 21 | % | $ | 0.62 | $ | 0.57 | 9 | % | |||||||||
Adjusted diluted earnings per share attributable to ICE common shareholders(1) | $ | 2.22 | $ | 2.07 | 7 | % | $ | 0.73 | $ | 0.64 | 14 | % | |||||||||
Cash flows from operating activities | $ | 1,410 | $ | 1,508 | (7) | % | |||||||||||||||
(1) The adjusted numbers in the charts and table above are calculated by excluding items that are not reflective of our cash operations and core business performance, and for adjusted net income attributable to ICE and adjusted diluted earnings per share attributable to ICE common shareholders, are presented net of taxes. As a result, these adjusted numbers are not calculated in accordance with GAAP. See “- Non-GAAP Financial Measures” below.
• | Revenues, less transaction-based expenses, increased $124 million and $65 million for the nine and three months ended September 30, 2017, respectively, from the comparable periods in 2016. See “- Trading and Clearing Segment” and “Data and Listings Segment” below for a discussion of the significant changes in our revenues. The increase in revenues includes $34 million in unfavorable foreign exchange effects arising from the strengthening U.S. dollar for the nine months ended September 30, 2017, from the comparable period in 2016, and $3 million in favorable foreign exchange effects arising from the weakening U.S. dollar for the three months ended September 30, 2017, from the comparable period in 2016. See Item 3 |
27
“Quantitative and Qualitative Disclosures About Market Risk - Foreign Currency Exchange Rate Risk” below for additional information on the impact of currency fluctuations. Excluding the $34 million in unfavorable foreign exchange effects for the nine months ended September 30, 2017 and the $3 million in favorable foreign exchange effects for the three months ended September 30, 2017, our revenues, less transaction-based expenses, would have been $3.5 billion and $1.1 billion for the nine and three months ended September 30, 2017, respectively, an increase of 5% and 6%, respectively, from the comparable periods in 2016.
• | Operating expenses decreased $54 million and $57 million for the nine and three months ended September 30, 2017, respectively, from the comparable periods in 2016. During the nine and three months ended September 30, 2016, we recorded a $33 million Creditex customer relationship intangible asset impairment. See “- Consolidated Operating Expenses” below for a discussion of the significant changes in our operating expenses. The decrease in operating expenses includes $19 million in favorable foreign exchange effects arising from the strengthening U.S. dollar for the nine months ended September 30, 2017, from the comparable period in 2016, and $1 million in unfavorable foreign exchange effects arising from the weakening U.S. dollar for the three months ended September 30, 2017, from the comparable period in 2016. |
• | In connection with Cetip’s merger with BM&FBOVESPA S.A., we recognized a $176 million realized investment gain in other income (expense), net for the nine months ended September 30, 2017, and $9 million in foreign exchange losses and transaction expenses in other income (expense), net for the nine months ended September 30, 2017. See “- Recent Developments - Cetip Investment Gain” above. |
Variability in Quarterly Comparisons
The business environments in which we operate directly affect our results of operations. Our results have been and will continue to be affected by many factors, including, without limitation, market volatility and the level of trading activity in our markets, which during any period is significantly influenced by general market conditions; legislative and regulatory changes, as well as our fulfillment of our regulatory obligations; competition; demand for our market data services and our market share; our system reliability; our ability to offer new products; our acquisition activities and the pace of industry consolidation; broad trends in the data and finance industry; the number and financial health of companies listed on our cash markets; geopolitical events; real and perceived supply and demand imbalances; changing technology in the financial services industry; and our reputation, among other factors. In particular, in recent years, our business environment has been characterized by industry consolidation and increasing competition among global markets for trading, clearing and listings; the globalization of exchanges, customers and competitors; market participants’ rising demand for speed and data capacity, which requires ongoing investment in technology; evolving and disparate regulation across multiple jurisdictions; and increasing focus on capital and cost efficiencies.
Price volatility increases the need to hedge risk and creates demand among market participants for the exchange of risk through trading and clearing. Market liquidity is one of the primary market attributes for attracting and maintaining customers and is an important indicator of a market’s strength. In addition, the ability to evolve existing products to serve emerging needs, develop new products and respond to competitive dynamics in pricing, exclusivity and consolidation is important to our business. Changes in these and other factors could cause our revenues to fluctuate from period to period and these fluctuations may affect the reliability of period to period comparisons of our revenues and operating results. For additional information regarding the factors that affect our results of operations, see Item 1(A) “Risk Factors” included in our 2016 Form 10-K.
Segment Reporting
We operate two business segments: our Trading and Clearing segment and our Data and Listings segment. This presentation is reflective of how our chief operating decision maker reviews and operates our business. Our Trading and Clearing segment comprises our transaction-based execution and clearing businesses. Our Data and Listings segment comprises our subscription-based data services and securities listings businesses. Our chief operating decision maker does not review total assets, intersegment revenues/expenses or statements of income below operating income by segments; therefore, such information is not presented below.
While revenues are allocated directly to segments, a significant portion of our operating expenses are not solely related to a specific segment because the expenses serve functions that are necessary for the operation of both segments. Because these expenses do not relate to a single segment, we have employed a reasonable allocation method to allocate expenses between the segments for presentation purposes. We have elected to use a pro-rata revenue approach as the allocation method for the expenses that do not relate solely to one segment. Further, precise allocation of expenses to specific revenue streams within these segments is not reasonably possible. Accordingly, we did not allocate expenses to specific revenue streams within the segments.
28
Trading and Clearing Segment
The following charts and table present our selected statements of income data for our Trading and Clearing segment (dollars in millions and YTD represents the nine-month periods ended September 30th):
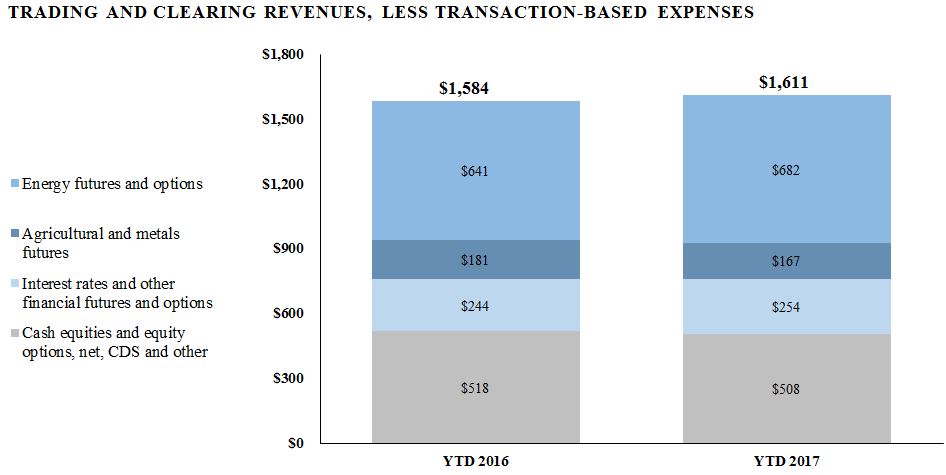
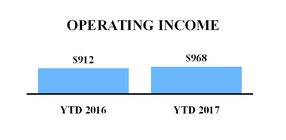
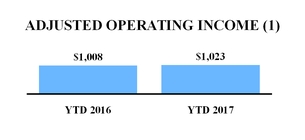
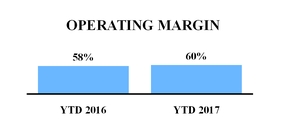
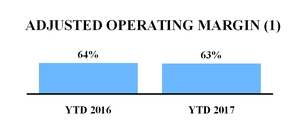
(1) The adjusted numbers in the charts above are calculated by excluding items that are not reflective of our cash operations and core business performance. As a result, these adjusted numbers are not calculated in accordance with U.S. GAAP. See “- Non-GAAP Financial Measures” below.
29
Nine Months Ended September 30, | Three Months Ended September 30, | ||||||||||||||||||||
2017 | 2016 | Change | 2017 | 2016 | Change | ||||||||||||||||
Revenues: | |||||||||||||||||||||
Brent crude futures and options contracts | $ | 249 | $ | 224 | 11 | % | $ | 80 | $ | 70 | 13 | % | |||||||||
Other oil futures and options contracts | 104 | 86 | 21 | 35 | 30 | 21 | |||||||||||||||
Gasoil futures and options contracts | 85 | 73 | 17 | 32 | 25 | 24 | |||||||||||||||
Natural gas futures and options contracts | 153 | 154 | (1 | ) | 48 | 46 | 5 | ||||||||||||||
Power futures and options contracts | 52 | 62 | (17 | ) | 15 | 18 | (16 | ) | |||||||||||||
Emissions and other energy futures and options contracts | 39 | 42 | (8 | ) | 13 | 10 | 14 | ||||||||||||||
Sugar futures and options contracts | 78 | 91 | (14 | ) | 23 | 25 | (3 | ) | |||||||||||||
Other agricultural and metals futures and options contracts | 89 | 90 | (1 | ) | 26 | 27 | (4 | ) | |||||||||||||
Interest rates futures and options contracts | 149 | 137 | 9 | 48 | 37 | 32 | |||||||||||||||
Other financial futures and options contracts | 105 | 107 | (2 | ) | 34 | 33 | 1 | ||||||||||||||
Cash equities and equity options | 1,126 | 1,354 | (17 | ) | 355 | 410 | (13 | ) | |||||||||||||
Credit default swaps | 107 | 109 | (2 | ) | 37 | 35 | 5 | ||||||||||||||
Other transactions | 37 | 37 | (1 | ) | 12 | 11 | 3 | ||||||||||||||
Transaction and clearing, net | 2,373 | 2,566 | (8 | ) | 758 | 777 | (3 | ) | |||||||||||||
Other revenues | 148 | 131 | 14 | 54 | 44 | 24 | |||||||||||||||
Revenues | 2,521 | 2,697 | (7 | ) | 812 | 821 | (1 | ) | |||||||||||||
Transaction-based expenses | 910 | 1,113 | (18 | ) | 289 | 338 | (15 | ) | |||||||||||||
Revenues, less transaction-based expenses | 1,611 | 1,584 | 2 | 523 | 483 | 8 | |||||||||||||||
Other operating expenses | 498 | 468 | 6 | 168 | 156 | 7 | |||||||||||||||
Acquisition-related transaction and integration costs | — | 8 | (97 | ) | — | 1 | (84 | ) | |||||||||||||
Depreciation and amortization (including impairment) | 145 | 196 | (26 | ) | 45 | 88 | (49 | ) | |||||||||||||
Operating expenses | 643 | 672 | (4 | ) | 213 | 245 | (13 | ) | |||||||||||||
Operating income | $ | 968 | $ | 912 | 6 | % | $ | 310 | $ | 238 | 30 | % | |||||||||
Transaction and Clearing Revenues
Overview
Our transaction and clearing revenues are reported on a net basis, except for the NYSE transaction-based expenses discussed below, and consist of fees collected from our derivatives, cash equities and equity options trading and derivatives clearing. In our derivatives markets, we earn transaction and clearing revenues from both counterparties to each contract that is traded and/or cleared, and in our equity and equity options markets, we receive trade execution fees as well as routing fees related to orders in our markets which are routed to other markets for execution.
Rates per-contract are driven by the number of contracts or securities traded and the fees charged per contract, net of certain rebates. Our per-contract transaction and clearing revenues will depend upon many factors, including, but not limited to, market conditions, transaction and clearing volume, product mix, pricing, applicable revenue sharing and market making agreements, and new product introductions. Because transaction and clearing revenues are generally assessed on a per-contract basis, revenues and profitability fluctuate with changes in contract volume and due to product mix.
For both the nine months ended September 30, 2017 and 2016, 20% of our Trading and Clearing segment revenues, less transaction-based expenses, were billed in pounds sterling or euros and for the three months ended September 30, 2017 and 2016, 21% and 18%, respectively, were billed in pounds sterling or euros. As the pound sterling or euro exchange rate changes, the U.S. equivalent of revenues denominated in foreign currencies changes accordingly. The strengthening of the U.S. dollar compared to the pound sterling and euro for the nine months ended September 30, 2017, from the comparable period in 2016, reduced our Trading and Clearing segment revenues, less transaction-based expenses, by $21 million and the weakening of the U.S. dollar compared to the pound sterling and euro for the three months ended September 30, 2017, from the comparable period in 2016, increased our Trading and Clearing segment revenues, less transaction-based expenses, by $2 million. See Item 3 “- Quantitative and Qualitative Disclosures About Market Risk - Foreign Currency Exchange Rate Risk” below for additional information on the impact of currency fluctuations.
30
Our transaction and clearing revenues are presented net of rebates. We recorded rebates of $576 million and $502 million for the nine months ended September 30, 2017 and 2016, respectively, and $178 million and $155 million for the three months ended September 30, 2017 and 2016, respectively. We offer rebates in certain of our markets primarily to support market liquidity and trading volume by providing qualified participants in those markets a discount to the applicable commission rate. Such rebates are calculated based on volumes traded. The increase in the rebates is due primarily to an increase in the number of participants in the rebate programs offered on various contracts, an increase in our traded volume and an increase in the number of rebate programs.
Commodities Markets
We operate global crude oil and refined oil futures markets, including the ICE Brent, ICE WTI and ICE Gasoil futures and options contracts, as well as approximately 500 refined oil futures products that relate to our benchmark futures contracts and other key price benchmarks. The ICE Brent crude contract is relied upon by a broad range of global market participants, including oil producing nations and multinational companies, to price and hedge their crude oil production and consumption. ICE Gasoil is a key refined oil benchmark in Europe and Asia. Total oil volume and revenues increased 18% and 14%, respectively, for the nine months ended September 30, 2017 from the comparable period in 2016 and increased 20% and 17%, respectively, for the three months ended September 30, 2017 from the comparable period in 2016. ICE Brent crude futures and options volume increased 17% and 18% for the nine and three months ended September 30, 2017, respectively, from the comparable periods in 2016 and ICE WTI crude futures and options volume increased 23% and 26% for the nine and three months ended September 30, 2017, respectively, from the comparable periods in 2016. The increase in total oil volume was primarily driven by price volatility related to shifting supply and demand dynamics globally, while oil revenues grew at a slightly lower rate due to customer and product mix.
Our global natural gas futures and options volume increased 3% and revenues decreased 1%, respectively, for the nine months ended September 30, 2017 from the comparable period in 2016 and volume decreased 4% and revenues increased 5%, respectively, for the three months ended September 30, 2017 from the comparable period in 2016. Volume increased for the year to date period primarily due to growth in U.S. natural gas volume due to greater price volatility in the first nine months of 2017 than in the comparable period in 2016 and revenues decreased primarily due to increased market making rebates that apply at higher volume levels and the impact of foreign currency translation in our European natural gas products.
Total volume and revenues in our agricultural and metals futures and options markets decreased 9% and 7%, respectively, for the nine months ended September 30, 2017 from the comparable period in 2016 and decreased 7% and 3%, respectively, for the three months ended September 30, 2017 from the comparable period in 2016. Volume in our largest agricultural contract, sugar futures and options, decreased 12% and 5% for the nine and three months ended September 30, 2017, respectively, from the comparable periods in 2016, and other agricultural and metal futures and options volume decreased 6% and 9% for the nine and three months ended September 30, 2017, respectively, from the comparable period in 2016. The decreases in agricultural volume were primarily driven by the reduced price volatility in 2017 compared to the higher price volatility in 2016 which was driven by more extreme weather conditions in 2016.
Financial Markets
Financial futures and options volume and revenue increased 23% and 4%, respectively, for the nine months ended September 30, 2017 from the comparable period in 2016, and volume and revenue increased 19% and 17%, respectively, for the three months ended September 30, 2017 from the comparable period in 2016. Interest rate futures and options volume increased 37% and 33% for the nine and three months ended September 30, 2017, respectively, from the comparable periods in 2016, primarily due to expectations for heightened central bank activity during 2017. Interest rate futures and options revenues increased less than traded volumes, compared to the prior year periods, primarily due to the impact of foreign currency translation and increased market making rebates that apply at higher volume levels. Other financial futures and options volume decreased 14% and 16% for the nine and three months ended September 30, 2017, respectively, from the comparable periods in 2016, primarily due to lower price volatility in global equity markets.
Cash equities handled volume decreased 18% and 13% for the nine and three months ended September 30, 2017, from the comparable periods in 2016, respectively, primarily due to a reduction in U.S. equities volatility during 2017 compared to the prior year periods. Cash equities revenues, net of transaction-based expenses, were $149 million for the nine months ended September 30, 2017, a decrease of 11% from $166 million for the nine months ended September 30, 2016 and $46 million for the three months ended September 30, 2017, a decrease of 9% from $49 million for the three months ended September 30, 2016. Equity options volume decreased 16% and 6% for the nine and three months ended September 30, 2017, from the comparable periods in 2016, respectively, primarily due to lower U.S. equity market volatility. Equity options revenues, net of transaction-based expenses, were $67 million for the nine months ended September 30, 2017, a decrease of 9% from $74 million for the nine months ended September 30, 2016 and $20 million for the three months ended September 30, 2017, a decrease of 5% from $22 million for the three months ended September 30, 2016.
31
CDS clearing revenues were $86 million and $79 million for the nine months ended September 30, 2017 and 2016, respectively, and $30 million and $26 million for the three months ended September 30, 2017 and 2016, respectively. The notional value of CDS cleared during the same periods were $8.9 trillion and $9.0 trillion for the nine months ended September 30, 2017 and 2016, respectively, and $3.3 trillion and $2.6 trillion for the three months ended September 30, 2017 and 2016, respectively. The increase in CDS clearing revenues was driven by record buyside clearing during the nine and three months ended September 30, 2017. CDS trade execution revenues were $21 million and $30 million for the nine months ended September 30, 2017 and 2016, respectively, and $6 million and $9 million for the three months ended September 30, 2017 and 2016, respectively. The decrease in CDS trade execution revenues for the nine and three months ended September 30, 2017, from the comparable periods in 2016, is primarily due to the sale and discontinuance of our CDS voice brokerage operations in the third quarter of 2016.
Other Revenues
Other revenues primarily include interest income on certain clearing margin deposits, regulatory penalties and fines, fees for use of our facilities, regulatory fees charged to member organizations of our U.S. securities exchanges, designated market maker service fees, exchange membership fees and agricultural grading and certification fees. The increase in other revenues for the nine and three months ended September 30, 2017, from the comparable periods in 2016, is primarily due to a $6 million breakup fee received in August 2017 related to the termination of the derivatives clearing agreement with Euronext NV, under which ICE Clear Netherlands was to provide clearing of Euronext NV’s financial and commodity derivatives.
Selected Operating Data
The following charts and table present trading activity in our futures and options markets by commodity type based on the total number of contracts traded, as well as futures and options rate per contract (in millions, except for percentages and rate per contract amounts and YTD represents the nine-month periods ended September 30th):
32
Volume and Rates per Contract | ||||
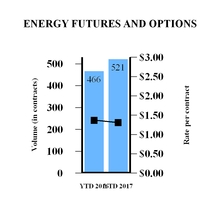
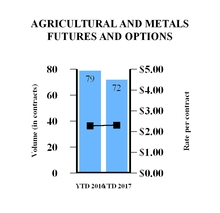
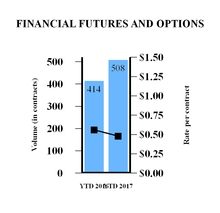
Nine Months Ended September 30, | Three Months Ended September 30, | ||||||||||||||||||||
2017 | 2016 | Change | 2017 | 2016 | Change | ||||||||||||||||
Number of contracts traded: | |||||||||||||||||||||
Brent crude futures and options | 199 | 169 | 17 | % | 64 | 53 | 18 | % | |||||||||||||
Other oil futures and options | 84 | 69 | 21 | 28 | 23 | 23 | |||||||||||||||
Gasoil futures and options | 57 | 50 | 15 | 21 | 18 | 25 | |||||||||||||||
Natural gas futures and options | 164 | 160 | 3 | 47 | 49 | (4 | ) | ||||||||||||||
Power futures and options | 10 | 11 | (13 | ) | 2 | 3 | (11 | ) | |||||||||||||
Emissions and other energy futures and options | 7 | 7 | (12 | ) | 3 | 2 | 15 | ||||||||||||||
Sugar futures and options | 31 | 36 | (12 | ) | 9 | 10 | (5 | ) | |||||||||||||
Other agricultural and metals futures and options | 41 | 43 | (6 | ) | 12 | 12 | (9 | ) | |||||||||||||
Interest rates futures and options | 410 | 300 | 37 | 122 | 92 | 33 | |||||||||||||||
Other financial futures and options | 98 | 114 | (14 | ) | 27 | 35 | (16 | ) | |||||||||||||
Total | 1,101 | 959 | 15 | % | 335 | 297 | 13 | % | |||||||||||||
Rate per contract: | |||||||||||||||||||||
Energy futures and options rate per contract | $ | 1.31 | $ | 1.37 | (5 | )% | $ | 1.35 | $ | 1.36 | (1 | )% | |||||||||
Agricultural and metals futures and options rate per contract | $ | 2.31 | $ | 2.28 | 1 | % | $ | 2.32 | $ | 2.22 | 4 | % | |||||||||
Financial futures and options rate per contract | $ | 0.48 | $ | 0.56 | (14 | )% | $ | 0.53 | $ | 0.53 | 1 | % | |||||||||
Open interest is the aggregate number of contracts (long or short) that clearing members hold either for their own account or on behalf of their clients. The following charts and table present our quarter-end open interest for our futures and options contracts (in thousands, except for percentages):
33
Open Interest | ||||
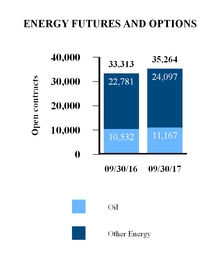
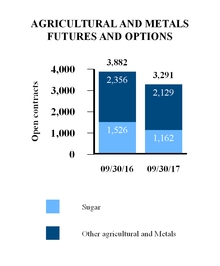
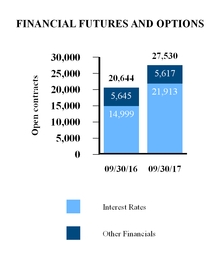
As of September 30, | ||||||||
2017 | 2016 | Change | ||||||
Open interest — in thousands of contracts: | ||||||||
Brent crude futures and options | 4,278 | 4,410 | (3 | )% | ||||
Other oil futures and options | 5,824 | 5,143 | 13 | |||||
Gasoil futures and options | 1,065 | 979 | 9 | |||||
Natural gas futures and options | 18,918 | 16,736 | 13 | |||||
Power futures and options | 2,980 | 3,682 | (19 | ) | ||||
Emissions and other energy futures and options | 2,199 | 2,363 | (7 | ) | ||||
Sugar futures and options | 1,162 | 1,526 | (24 | ) | ||||
Other agricultural and metals futures and options | 2,129 | 2,356 | (10 | ) | ||||
Interest rates futures and options | 21,913 | 14,999 | 46 | |||||
Other financial futures and options | 5,617 | 5,645 | — | |||||
Total | 66,085 | 57,839 | 14 | % | ||||
The following charts and table present selected cash equities and equity options trading data (all trading volume below is presented as net daily trading volume and is single counted and YTD represents the nine-month periods ended September 30th):
34
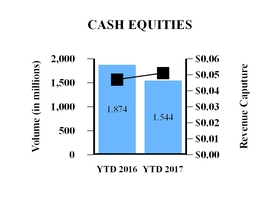
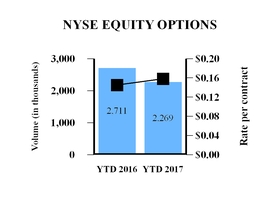
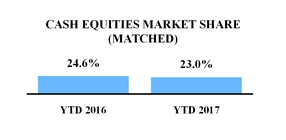
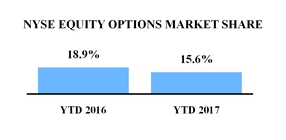
Nine Months Ended September 30, | Three Months Ended September 30, | ||||||||||||||||
2017 | 2016 | Change | 2017 | 2016 | Change | ||||||||||||
Cash equities (shares in millions): | |||||||||||||||||
NYSE listed (tape A) issues: | |||||||||||||||||
Handled volume | 1,101 | 1,296 | (15 | )% | 1,014 | 1,121 | (10 | )% | |||||||||
Matched volume | 1,091 | 1,282 | (15 | )% | 1,006 | 1,111 | (9 | )% | |||||||||
Total NYSE listed consolidated volume | 3,463 | 3,968 | (13 | )% | 3,194 | 3,475 | (8 | )% | |||||||||
Share of total matched consolidated volume | 31.5 | % | 32.3 | % | (0.8 pts) | 31.5 | % | 32.0 | % | (0.5 pts) | |||||||
NYSE Arca, NYSE American and regional listed (tape B) issues: | |||||||||||||||||
Handled volume | 298 | 381 | (22 | )% | 257 | 329 | (22 | )% | |||||||||
Matched volume | 290 | 368 | (21 | )% | 250 | 319 | (22 | )% | |||||||||
Total NYSE Arca, NYSE American and regional listed consolidated volume | 1,222 | 1,558 | (22 | )% | 1,030 | 1,321 | (22 | )% | |||||||||
Share of total matched consolidated volume | 23.7 | % | 23.6 | % | 0.1 pt | 24.2 | % | 24.2 | % | 0.1 pt | |||||||
Nasdaq listed (tape C) issues: | |||||||||||||||||
Handled volume | 145 | 197 | (26 | )% | 140 | 167 | (16 | )% | |||||||||
Matched volume | 136 | 187 | (27 | )% | 132 | 158 | (17 | )% | |||||||||
Total Nasdaq listed consolidated volume | 1,913 | 1,932 | (1 | )% | 1,841 | 1,797 | 2 | % | |||||||||
Share of total matched consolidated volume | 7.1 | % | 9.7 | % | (2.6 pts) | 7.2 | % | 8.8 | % | (1.7 pts) | |||||||
Total cash handled volume | 1,544 | 1,874 | (18 | )% | 1,411 | 1,617 | (13 | )% | |||||||||
Total cash market share matched | 23.0 | % | 24.6 | % | (1.7 pts) | 22.9 | % | 24.1 | % | (1.2 pts) | |||||||
Equity options (contracts in thousands): | |||||||||||||||||
NYSE equity options volume | 2,269 | 2,711 | (16 | )% | 2,348 | 2,486 | (6 | )% | |||||||||
Total equity options volume | 14,505 | 14,374 | 1 | % | 14,098 | 13,797 | 2 | % | |||||||||
NYSE share of total equity options | 15.6 | % | 18.9 | % | (3.2 pts) | 16.7 | % | 18.0 | % | (1.4 pts) | |||||||
Revenue capture or rate per contract: | |||||||||||||||||
Cash equities revenue capture (per 100 shares) | $0.051 | $0.047 | 9 | % | $0.051 | $0.048 | 6 | % | |||||||||
Equity options rate per contract | $0.158 | $0.145 | 9 | % | $0.142 | $0.139 | 2 | % | |||||||||
35
Handled volume represents the total number of shares of equity securities, exchange traded funds, or ETFs, and crossing session activity internally matched on our exchanges or routed to and executed on an external market center. Matched volume represents the total number of shares of equity securities, ETFs and crossing session activity executed on our exchanges.
Transaction-Based Expenses
Our equities and equity options markets pay fees to the SEC pursuant to Section 31 of the Exchange Act. Section 31 fees are recorded on a gross basis as a component of transaction and clearing fee revenue. These Section 31 fees are designed to recover the government’s costs of supervising and regulating the securities markets and securities professionals. We, in turn, collect activity assessment fees, which are included in transaction and clearing revenues in our consolidated statements of income, from member organizations clearing or settling trades on the equities and options exchanges and recognize these amounts when invoiced. The activity assessment fees are designed so that they are equal to the Section 31 fees that are included in transaction-based expenses in our consolidated statements of income. As a result, activity assessment fees and the corresponding Section 31 fees do not have an impact on our net income. Activity assessment fees received are included in cash at the time of receipt and, as required by law, the amount due to the SEC is remitted semi-annually and recorded as an accrued liability until paid. As of September 30, 2017, the accrued liability related to the un-remitted SEC Section 31 fees was $32 million.
We also incur liquidity payments made to cash and options trading customers and routing charges made to other exchanges that are included in transaction-based expenses. We incur routing charges when we do not have the best bid or offer in the market for a security that a customer is trying to buy or sell on one of our securities exchanges. In that case, we route the customer’s order to the external market center that displays the best bid or offer. The external market center charges us a fee per share (denominated in tenths of a cent per share) for routing to its system. We record routing charges on a gross basis as a component of transaction and clearing fee revenue.
Operating Expenses, Operating Income and Operating Margin
Trading and Clearing segment operating expenses decreased $29 million and $32 million for the nine and three months ended September 30, 2017, respectively, from the comparable periods in 2016. During the nine and three months ended September 30, 2016, we recorded a $33 million Creditex customer relationship intangible asset impairment. See “- Consolidated Operating Expenses” below for a discussion of the significant changes in our operating expenses. Trading and Clearing segment operating income increased $56 million and $72 million for the nine and three months ended September 30, 2017, respectively, from the comparable periods in 2016. Trading and Clearing segment operating margins were 60% and 58% for the nine months ended September 30, 2017 and 2016, respectively, and 59% and 49% for the three months ended September 30, 2017 and 2016, respectively.
Trading and Clearing segment adjusted operating expenses were $588 million and $576 million for the nine months ended September 30, 2017 and 2016, respectively, and $196 million and $188 million for the three months ended September 30, 2017 and 2016, respectively. Trading and Clearing segment adjusted operating income was $1.0 billion for both the nine months ended September 30, 2017 and 2016 and $327 million and $295 million for the three months ended September 30, 2017 and 2016, respectively. Trading and Clearing segment adjusted operating margins were 63% and 64% for the nine months ended September 30, 2017 and 2016, respectively, and 62% and 61% for the three months ended September 30, 2017 and 2016, respectively. See “- Non-GAAP Financial Measures” below.
36
Data and Listings Segment
The following charts and table present our selected statements of income data for our Data and Listings segment (dollars in millions and YTD represents the nine-month periods ended September 30th):
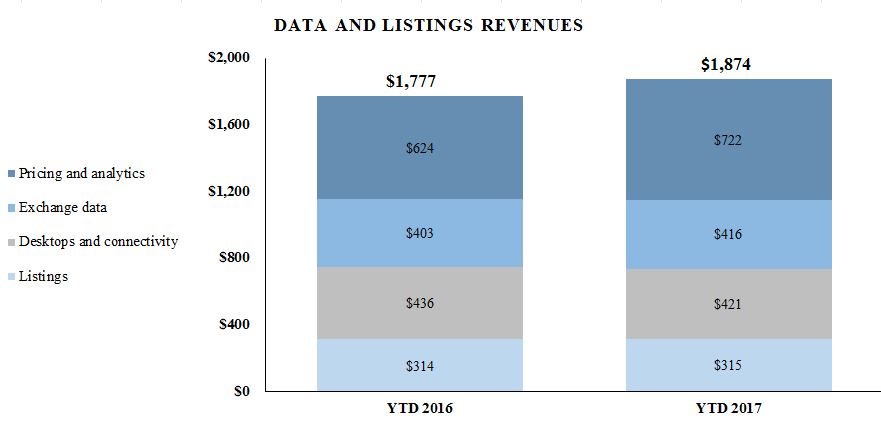
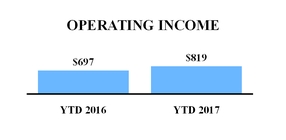
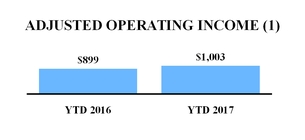
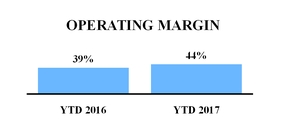
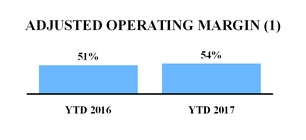
(1) The adjusted numbers in the charts above are calculated by excluding items that are not reflective of our cash operations and core business performance. As a result, these adjusted numbers are not calculated in accordance with U.S. GAAP. See “- Non-GAAP Financial Measures” below.
37
Nine Months Ended September 30, | Three Months Ended September 30, | ||||||||||||||||||||
2017 | 2016 | Change | 2017 | 2016 | Change | ||||||||||||||||
Revenues: | |||||||||||||||||||||
Pricing and analytics | $ | 722 | $ | 624 | 16 | % | $ | 242 | $ | 209 | 16 | % | |||||||||
Exchange data | 416 | 403 | 3 | 136 | 136 | 1 | |||||||||||||||
Desktops and connectivity | 421 | 436 | (4 | ) | 140 | 144 | (4 | ) | |||||||||||||
Data services | 1,559 | 1,463 | 7 | 518 | 489 | 6 | |||||||||||||||
Listings | 315 | 314 | — | 102 | 106 | (3 | ) | ||||||||||||||
Revenues | 1,874 | 1,777 | 5 | 620 | 595 | 4 | |||||||||||||||
Other operating expenses | 769 | 753 | 2 | 247 | 253 | (3 | ) | ||||||||||||||
Acquisition-related transaction and integration costs | 27 | 53 | (51 | ) | 4 | 13 | (74 | ) | |||||||||||||
Depreciation and amortization | 259 | 274 | (5 | ) | — | 83 | 93 | (10 | ) | ||||||||||||
Operating expenses | 1,055 | 1,080 | (2 | ) | 334 | 359 | (7 | ) | |||||||||||||
Operating income | $ | 819 | $ | 697 | 18 | % | $ | 286 | $ | 236 | 22 | % | |||||||||
The Data and Listings segment represents subscription-based, or recurring, revenues from data services and listings services offered across our trading and clearing businesses and ICE Data Services. Through ICE Data Services, we generate revenues from a range of market data services, including the dissemination of our exchange and evaluated pricing data and analytics, desktops, connectivity and market data. Through NYSE, NYSE American and NYSE Arca, we generate listings revenue related to the provision of listings services for public companies and ETFs, and related corporate actions for listed companies.
For the nine months ended September 30, 2017 and 2016, 10% and 12%, respectively, of our Data and Listings segment revenues were billed in pounds sterling or euros and for the three months ended September 30, 2017 and 2016, 10% and 12%, respectively, were billed in pounds sterling or euros (all relating to our data services revenues). As the pound sterling or euro exchange rate changes, the U.S. equivalent of revenues denominated in foreign currencies changes accordingly. The strengthening of the U.S. dollar compared to the pound sterling and euro for the nine months ended September 30, 2017, from the comparable period in 2016, reduced our Data and Listings segment revenues by $13 million and the weakening of the U.S. dollar compared to the pound sterling and euro for the three months ended September 30, 2017, from the comparable period in 2016, increased our Data and Listings segment revenues by $1 million.
Data Services Revenues
Our pricing and analytics services consist of an extensive set of independent evaluated pricing services focused primarily on fixed income and international equity securities, valuation services, reference data, market data, end of day pricing, fixed income, equity portfolio analytics and risk management analytics. We also serve as an administrator of regulated benchmarks. Our index services offer a range of products across fixed income, energy, equities, ETFs and other asset classes to provide the methodology, pricing and licensing of indices and benchmarks.
Our exchange data revenues primarily represent subscription fees for the provision of our market data that is created from activity on our exchanges, which is driven by the products and technology we develop to deliver real-time views of markets and related information. In our derivatives markets, exchange data revenues relate to subscription fees charged for customer and license access from third party data vendors, or quote vendors such as Thomson Reuters and Bloomberg, and from end users, as well as view-only data access, direct access services, terminal access, daily indices, forward curves, and end of day reports.
We also earn exchange data revenues relating to our cash equity and options markets, and related data services. We collect cash trading market data fees principally for consortium-based data products and, to a lesser extent, for NYSE proprietary data products. Consortium-based data fees are determined by the securities industry plans and are charged to vendors based on their redistribution of data. Consortium-based data revenues (net of administrative costs) are distributed to participating securities markets on the basis of a formula set by the SEC under Regulation NMS. Last trade prices and quotes in New York Stock Exchange-listed, NYSE American-listed, and NYSE Arca-listed securities are disseminated through “Tape A” and “Tape B”, which constitute the majority of our revenues from consortium-based market data revenues.
Our desktop and connectivity services comprise technology-based information platforms, feeds and connectivity solutions. These include trading applications, desktop solutions, data feeds and infrastructure to support trading, voice brokers and investment functions. Our desktop and web-based applications deliver real-time market information, analytical and decision support tools to support trading and investment decisions. Through our consolidated feeds, clients receive market data from global exchanges, trading venues, news and data sources for exchange-traded and OTC markets. Our services offer clients a secure, resilient, private multi-
38
participant network that provides access to global exchanges and content service providers. Our infrastructure managed services solution also offers colocation space, direct exchange access, proximity hosting and support services that enable access to real-time exchange data, and facilitates low latency, secure electronic market access.
Our data services revenues increased 7% and 6% for the nine and three months ended September 30, 2017, respectively, from the comparable periods in 2016, primarily due to the strong retention rate of existing customers, the addition of new customers, increased purchases by existing customers, the development of new and enhanced products serving the need for an expanded range of data, regulatory compliance and analytics solutions, and our acquisitions of Securities Evaluations and Credit Market Analysis from S&P Global in October 2016. These increases were partially offset by the impact of foreign currency translation and the divestiture of IDMS in our desktop and connectivity business.
Annual Subscription Value (ASV)
Annual Subscription Value, or ASV, represents, at a point in time, the data services revenues subscribed for the succeeding twelve months. ASV does not include new sales, contract terminations or price changes that may occur during that 12-month period. ASV also does not include certain data services revenue streams that are not subscription-based. ASV is adjusted for material acquisitions, divestitures or discontinued businesses to provide an organic view of comparable performance on a year over year basis at a beginning of the quarter. Thus, while it is an indicative backward-looking metric, it does not provide a growth forecast of the next twelve months of data services revenues.
As of September 30, 2017, ASV was $1.7 billion, a 6% increase compared to ASV of $1.7 billion as of September 30, 2016. Underpinning this growth is strength in both our pricing and analytics and our connectivity services business lines.
Listings Revenues
We recognize listings revenues in our securities markets from fees applicable to companies listed on our cash equities exchanges - original listing fees and annual listing fees. Original listing fees consist of two components: initial listing fees and fees related to corporate-related actions. Initial listing fees, subject to a minimum and maximum amount, are based on the number of shares that a company initially lists. Initial listing fees are recognized as revenue on a straight-line basis over estimated service periods of nine years for NYSE and five years for NYSE Arca and NYSE American. U.S. companies pay annual fees based on the number of outstanding shares the company has and non-U.S. companies pay annual fees based on the number of outstanding shares the company has issued or held in the U.S. Annual fees are recognized as revenue on a pro rata basis over the calendar year, and generally received as cash in the first quarter of the year.
In addition, we earn corporate actions-related listing fees in connection with actions involving the issuance of new shares, such as stock splits, rights issues and sales of additional securities, as well as mergers and acquisitions. Corporate actions-related listing fees are recognized as revenue on a straight-line basis over estimated service periods of six years for NYSE and three years for NYSE Arca and NYSE American. Unamortized balances are recorded as deferred revenue in our consolidated balance sheet.
Operating Expenses, Operating Income and Operating Margin
Data and Listings segment operating expenses decreased $25 million for both the nine and three months ended September 30, 2017 from the comparable periods in 2016. See “- Consolidated Operating Expenses” below for a discussion of the significant changes in our operating expenses. Data and Listings segment operating income increased $122 million and $50 million for the nine and three months ended September 30, 2017, respectively, from the comparable periods in 2016. Data and Listings segment operating margins were 44% and 39% for the nine months ended September 30, 2017 and 2016, respectively, and 46% and 40% for the three months ended September 30, 2017 and 2016, respectively. The operating income and operating margin increases were primarily driven by the data revenue increases discussed above.
Data and Listings segment adjusted operating expenses were $871 million and $878 million for the nine months ended September 30, 2017 and 2016, respectively, and $280 million and $296 million for the three months ended September 30, 2017 and 2016, respectively. Data and Listings segment adjusted operating income was $1.0 billion and $899 million for the nine months ended September 30, 2017 and 2016, respectively, and $340 million and $299 million for the three months ended September 30, 2017 and 2016, respectively. Data and Listings segment adjusted operating margins were 54% and 51% for the nine months ended September 30, 2017 and 2016, respectively, and 55% and 50% for the three months ended September 30, 2017 and 2016, respectively. See “- Non-GAAP Financial Measures” below.
39
Consolidated Operating Expenses
The following chart and table present our consolidated operating expenses (dollars in millions and YTD represents the nine-month periods ended September 30th):
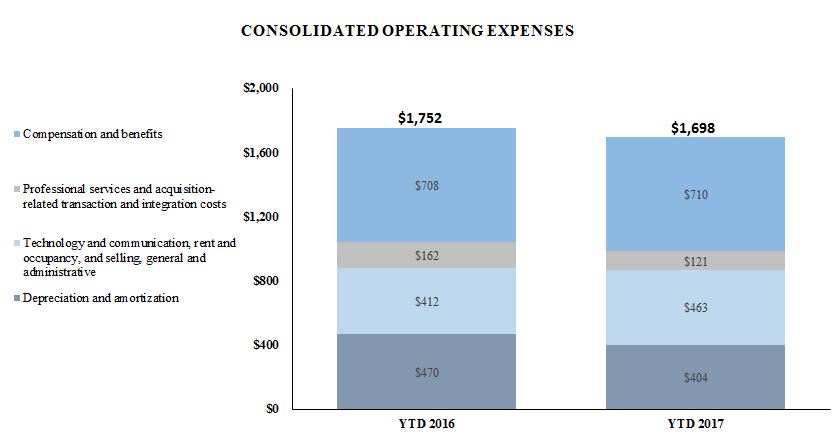
Nine Months Ended September 30, | Three Months Ended September 30, | ||||||||||||||||||||
2017 | 2016 | Change | 2017 | 2016 | Change | ||||||||||||||||
Compensation and benefits | $ | 710 | $ | 708 | — | % | $ | 231 | $ | 236 | (2 | )% | |||||||||
Professional services | 94 | 101 | (7 | ) | 30 | 32 | (7 | ) | |||||||||||||
Acquisition-related transaction and integration costs | 27 | 61 | (56 | ) | 4 | 14 | (75 | ) | |||||||||||||
Technology and communication | 294 | 277 | 6 | 99 | 93 | 6 | |||||||||||||||
Rent and occupancy | 52 | 52 | — | 17 | 17 | 2 | |||||||||||||||
Selling, general and administrative | 117 | 83 | 41 | 38 | 31 | 20 | |||||||||||||||
Depreciation and amortization | 404 | 470 | (14 | ) | 128 | 181 | (29 | ) | |||||||||||||
Total operating expenses | $ | 1,698 | $ | 1,752 | (3 | )% | $ | 547 | $ | 604 | (10 | )% | |||||||||
For the nine months ended September 30, 2017 and 2016, 15% and 18%, respectively, of our consolidated operating expenses were incurred in pounds sterling or euros and 14% and 16%, respectively, for the three months ended September 30, 2017 and 2016 were billed in pounds sterling or euros. As the pound sterling or euro exchange rate changes, the U.S. equivalent of operating expenses denominated in foreign currencies changes accordingly. The strengthening of the U.S. dollar compared to the pound sterling and euro for the nine months ended September 30, 2017, from the comparable period in 2016, decreased our consolidated operating expenses by $19 million and the weakening of the U.S. dollar compared to the pound sterling and euro for the three months ended September 30, 2017, from the comparable period in 2016, increased our consolidated operating expenses by $1 million.
As of September 30, 2017, we had 5,100 employees and as of September 30, 2016, we had 5,447 employees. Our employee headcount decreased over the last year primarily due to the divestiture of IDMS in March 2017, the divestiture of NYSE Governance Services in June 2017 and employee terminations in connection with our integration of Interactive Data. These decreases in our employee headcount were partially offset by the acquisitions of Securities Evaluations and Credit Market Analysis in October 2016 and TMX Atrium in May 2017 (see “- Recent Developments” above). Non-cash compensation expenses recognized in our consolidated financial statements for employee stock options and restricted stock were $102 million and $90 million for the nine months ended September 30, 2017 and 2016, respectively, and $34 million and $30 million for the three months ended September 30,
40
2017 and 2016, respectively. We incurred non-acquisition related employee severance costs of $16 million and $10 million for the nine months ended September 30, 2017 and 2016, respectively, and $8 million and $7 million for the three months ended September 30, 2017 and 2016, respectively, including $4 million in severance costs related to Creditex’s U.K. voice brokerage operations discontinuance during the nine and three months ended ended September 30, 2016.
Our compensation and benefits expenses increased for the nine months ended September 30, 2017, from the comparable period in 2016, primarily due to the integration of the Interactive Data employees into the ICE incentive plans during 2017, partially offset by the net decrease in our employee headcount, the foreign currency decrease relating to our U.K. and European based employees compensation expenses incurred in pounds sterling or euros, and the decrease in the non-acquisition related employee severance costs. Our compensation and benefits expenses decreased for the three months ended September 30, 2017 from the comparable period in 2016, primarily due to the reduction in our employee headcount from the IDMS and NYSE Governance Services divestitures.
We incurred acquisition-related transaction and integration costs of $27 million and $4 million during the nine and three months ended September 30, 2017, respectively, primarily relating to our integrations of Interactive Data, Securities Evaluations and Credit Market Analysis. We incurred acquisition-related transaction and integration costs of $61 million and $14 million during the nine and three months ended September 30, 2016, respectively, primarily relating to our integration of Interactive Data, Trayport and NYSE, our investment in MERS, our acquisition of Securities Evaluations and Credit Market Analysis, and various other potential and discontinued acquisitions. The integration costs primarily relate to employee termination, lease termination and professional services costs.
Technology and communication expenses increased for the nine and three months ended September 30, 2017, from the comparable periods in 2016, primarily due to the acquisitions of Securities Evaluations and Credit Market Analysis.
Selling, general and administrative expenses increased for the nine and three months ended September 30, 2017, from the comparable periods in 2016, primarily due to the acquisitions of Securities Evaluations and Credit Market Analysis, $14 million and $4 million in accruals made during the nine and three months ended September 30, 2017, respectively, relating to ongoing investigations and inquiries, and the release of non-income-related tax reserves of $18 million during the nine months ended September 30, 2016. See Part II, Item 1 “- Legal Proceedings” below for additional information on the accruals for the ongoing investigations and inquiries.
We recorded amortization expenses on the intangible assets acquired as part of our acquisitions, as well as on other intangible assets, of $206 million and $246 million for the nine months ended September 30, 2017 and 2016, respectively, and $64 million and $82 million for the three months ended September 30, 2017 and 2016, respectively. We recorded depreciation expenses on our fixed assets of $192 million and $191 million for the nine months ended September 30, 2017 and 2016, respectively, and $64 million and $66 for the three months ended September 30, 2017 and 2016, respectively. In addition, we recognized a net loss of $6 million on the sale of NYSE Governance Services, which was recorded in depreciation and amortization expenses for the nine months ended September 30, 2017 (see “- Recent Developments” above) and we recorded an impairment of the Creditex customer relationship intangible asset of $33 million in September 2016, which was recorded in depreciation and amortization expenses for the nine and three months ended September 30, 2016. The decrease in the amortization expenses recorded on the intangibles assets for the nine and three months ended September 30, 2017, from the comparable periods in 2016, is primarily due to a reduction in amortization expenses recorded on intangible assets which became fully amortized (primarily related to certain of the NYSE intangible assets), partially offset by amortization expenses on the Securities Evaluations, Credit Market Analysis and TMX Atrium intangible assets.
In August 2016, we sold certain of Creditex’s U.S. voice brokerage operations to Tullett Prebon. During the third quarter of 2016, we discontinued Creditex’s U.K. voice brokerage operations. We continue to operate Creditex's electronically traded markets and systems, post-trade connectivity platforms and intellectual property. In connection with the divesting of the voice brokerage business, it was determined that the carrying value of the CDS Creditex customer relationship intangible asset was not fully recoverable and an impairment of the asset was recorded in September 2016 for $33 million.
41
Consolidated Non-Operating Income (Expense)
Income and expenses incurred through activities outside of our core operations are considered non-operating. The following table presents our non-operating income (expenses) (dollars in millions):
Nine Months Ended September 30, | Three Months Ended September 30, | ||||||||||||||||||||
2017 | 2016 | Change | 2017 | 2016 | Change | ||||||||||||||||
Other income (expense): | |||||||||||||||||||||
Interest expense | $ | (137 | ) | $ | (134 | ) | 2 | % | $ | (47 | ) | $ | (44 | ) | 7 | % | |||||
Other income, net | 198 | 24 | n/a | 11 | 13 | (12) | |||||||||||||||
Total other income (expense), net | $ | 61 | $ | (110 | ) | n/a | $ | (36 | ) | $ | (31 | ) | 14 | % | |||||||
Net income attributable to non-controlling interest | $ | (22 | ) | $ | (20 | ) | 10 | % | $ | (6 | ) | $ | (6 | ) | 1 | % | |||||
We recognized equity income relating to our ownership in MERSCORP Holdings, Inc., owner of Mortgage Electronic Registrations Systems, Inc., or collectively MERS, which we acquired in the third quarter of 2016, and The Options Clearing Corporation, or OCC, in other income, which was $23 million and $15 million for the nine months ended September 30, 2017 and 2016, respectively, and $10 million and $8 million for the three months ended September 30, 2017 and 2016, respectively.
In connection with Cetip’s merger with BM&FBOVESPA S.A., we recognized a $176 million realized investment gain in other income for the nine months ended September 30, 2017 and we recognized $9 million in foreign exchange losses and transaction expenses in other expense for the nine months ended September 30, 2017. See “- Recent Developments - Cetip Investment Gain” above. We recognized dividend income received relating to our investment in Cetip in other income of $5 million and $12 million for the nine months ended September 30, 2017 and 2016, respectively, and $4 million for the three months ended September 30, 2016. We will no longer receive any dividends from Cetip or B3 subsequent to the first quarter of 2017.
We incurred foreign currency transaction losses of $2 million for the nine months ended September 30, 2017, and there was no impact for the nine months ended September 30, 2016. We incurred foreign currency transaction (losses) gains of ($1 million) and $1 million for the three months ended September 30, 2017 and 2016, respectively. This was primarily attributable to the fluctuations of the pound sterling and euro relative to the U.S. dollar. Foreign currency gains and losses are recorded in other income (expense) and relate to the settlement of foreign currency assets, liabilities and payables that occur through our foreign operations that are received in non-functional currencies due to the increase or decrease in the period-end foreign currency exchange rates between periods.
For consolidated subsidiaries in which our ownership is less than 100%, and for which we have control over the assets, liabilities and management of the entity, the outside stockholders’ interests are shown as non-controlling interest in our consolidated financial statements. As of December 31, 2016, non-controlling interest included those related to the operating results of our CDS clearing subsidiaries in which non-ICE limited partners held a 42.5% net profit sharing interest; ICE Endex in which Gasunie held a 21% ownership interest; and ICE Clear Netherlands in which ABN AMRO Clearing Bank N.V. held a 25% ownership interest. For both ICE Endex and ICE Clear Netherlands, in addition to the non-controlling interest reported in the consolidated statements of income, we reported redeemable non-controlling interest in the consolidated balance sheets which represents the minority interest redemption fair value for each company.
During June 2017, we purchased both Gasunie’s 21% minority ownership interest in ICE Endex and ABN AMRO Clearing Bank N.V.’s 25% minority ownership interest in ICE Clear Netherlands. Subsequent to these acquisitions, we own 100% of ICE Endex and ICE Clear Netherlands and will no longer include any non-controlling interest amounts for ICE Endex and ICE Clear Netherlands in our consolidated financial statements. During April 2017, we purchased 3.2% of the net profit sharing interest in our CDS clearing subsidiaries from a non-ICE limited partner and the remaining non-ICE limited partners hold a 39.3% net profit sharing interest as of September 30, 2017.
Consolidated Income Tax Provision
Consolidated income tax expense was $537 million and $409 million for the nine months ended September 30, 2017 and 2016, respectively, and $185 million and $93 million for the three months ended September 30, 2017 and 2016, respectively. The change in consolidated income tax expense between periods is primarily due to the tax impact of changes in our pre-tax income and the changes in our effective tax rate each period. Our effective tax rate was 29% and 27% for the nine months ended September 30, 2017 and 2016, respectively, and 33% and 21% for the three months ended September 30, 2017 and 2016, respectively.
The effective tax rates for the nine and three months ended September 30, 2017 and 2016 were lower than the federal statutory rate primarily due to favorable foreign income tax rate differentials, deferred tax benefits as a result of a U.K. income tax rate reduction enacted in the third quarter of 2016, and tax benefits associated with a divestiture in the second quarter of 2017, partially offset by state income taxes including additional tax expense from an Illinois corporate income tax rate increase enacted in the third
42
quarter of 2017. Favorable foreign income tax rate differentials result primarily from lower income tax rates in the U.K. and various other lower tax jurisdictions as compared to the income tax rates in the U.S.
The effective tax rate for the three months ended September 30, 2017 is higher than the effective tax rate for the comparable period in 2016 primarily because of deferred tax benefits from a U.K. corporate income tax reduction in the third quarter of 2016 and additional tax expense as a result of an Illinois corporate income tax rate increase enacted in the third quarter of 2017. The same U.K. and Illinois factors affect the effective tax rate comparison for the nine months ended September 30, 2017 and 2016. Additionally, the nine month effective tax rate difference is impacted by tax benefits associated with a divestiture during the second quarter of 2017, partially offset by an income tax expense increase due to a relatively higher U.S. mix of income.
Quarterly Results of Operations
The following quarterly unaudited consolidated statements of income data have been prepared on substantially the same basis as our audited consolidated financial statements and include all adjustments, consisting only of normal recurring adjustments, necessary for the fair presentation of our consolidated results of operations for the quarters presented. The historical results for any quarter do not necessarily indicate the results expected for any future period. The following table sets forth quarterly consolidated statements of
43
income data (in millions):
Three Months Ended, | |||||||||||||||||||
September 30, 2017 | June 30, 2017 | March 31, 2017 | December 31, 2016 | September 30, 2016 | |||||||||||||||
Revenues: | |||||||||||||||||||
Brent crude futures and options contracts | $ | 80 | $ | 89 | $ | 80 | $ | 75 | $ | 70 | |||||||||
Other oil futures and options contracts | 35 | 34 | 35 | 32 | 30 | ||||||||||||||
Gasoil futures and options contracts | 32 | 27 | 26 | 25 | 25 | ||||||||||||||
Natural gas futures and options contracts | 48 | 50 | 55 | 54 | 46 | ||||||||||||||
Power futures and options contracts | 15 | 19 | 18 | 21 | 18 | ||||||||||||||
Emissions and other energy futures and options contracts | 13 | 12 | 14 | 17 | 10 | ||||||||||||||
Sugar futures and options contracts | 23 | 29 | 26 | 18 | 25 | ||||||||||||||
Other agricultural and metals futures and options contracts | 26 | 33 | 30 | 29 | 27 | ||||||||||||||
Interest rates futures and options contracts | 48 | 52 | 49 | 40 | 37 | ||||||||||||||
Other financial futures and options contracts | 34 | 37 | 34 | 34 | 33 | ||||||||||||||
Cash equities and equity options | 355 | 390 | 381 | 426 | 410 | ||||||||||||||
Credit default swaps | 37 | 33 | 37 | 34 | 35 | ||||||||||||||
Other transactions | 12 | 12 | 13 | 13 | 11 | ||||||||||||||
Total transaction and clearing, net | 758 | 817 | 798 | 818 | 777 | ||||||||||||||
Pricing and analytics | 242 | 242 | 238 | 234 | 209 | ||||||||||||||
Exchange data | 136 | 142 | 138 | 132 | 136 | ||||||||||||||
Desktops and connectivity | 140 | 137 | 144 | 149 | 144 | ||||||||||||||
Total data services | 518 | 521 | 520 | 515 | 489 | ||||||||||||||
Listings | 102 | 107 | 106 | 105 | 106 | ||||||||||||||
Other revenues | 54 | 49 | 45 | 46 | 44 | ||||||||||||||
Total Revenues | 1,432 | 1,494 | 1,469 | 1,484 | 1,416 | ||||||||||||||
Transaction-based expenses | 289 | 316 | 305 | 346 | 338 | ||||||||||||||
Total revenues, less transaction-based expenses | 1,143 | 1,178 | 1,164 | 1,138 | 1,078 | ||||||||||||||
Compensation and benefits | 231 | 234 | 245 | 237 | 236 | ||||||||||||||
Professional services | 30 | 32 | 32 | 36 | 32 | ||||||||||||||
Acquisition-related transaction and integration costs | 4 | 9 | 14 | 19 | 14 | ||||||||||||||
Technology and communication | 99 | 97 | 98 | 97 | 93 | ||||||||||||||
Rent and occupancy | 17 | 17 | 18 | 18 | 17 | ||||||||||||||
Selling, general and administrative | 38 | 38 | 41 | 33 | 31 | ||||||||||||||
Depreciation and amortization (1) | 128 | 142 | 134 | 140 | 181 | ||||||||||||||
Total operating expenses | 547 | 569 | 582 | 580 | 604 | ||||||||||||||
Operating income | 596 | 609 | 582 | 558 | 474 | ||||||||||||||
Other income (expense), net (2) | (36 | ) | (44 | ) | 141 | (28 | ) | (31 | ) | ||||||||||
Income tax expense (3) | 185 | 139 | 213 | 171 | 93 | ||||||||||||||
Net income | $ | 375 | $ | 426 | $ | 510 | $ | 359 | $ | 350 | |||||||||
Net income attributable to non-controlling interest | (6 | ) | (8 | ) | (8 | ) | (7 | ) | (6 | ) | |||||||||
Net income attributable to ICE | $ | 369 | $ | 418 | $ | 502 | $ | 352 | $ | 344 | |||||||||
(1) The depreciation and amortization expenses for the three months ended September 30, 2016 include a $33 million Creditex customer relationship intangible asset impairment, and for the three months ended June 30, 2017 include a $6 million net loss on the sale of NYSE Governance Services.
(2) In connection with Cetip’s merger with BM&FBOVESPA S.A., we recognized a $176 million realized investment gain in other income (expense), net for the three months ended March 31, 2017 and $9 million in foreign losses and transaction expenses in other income (expense), net for the three months ended June 30, 2017.
(3) The income tax expense for the three months ended September 30, 2016 includes a deferred tax benefit associated with future U.K. income tax rate reductions.
44
Liquidity and Capital Resources
Below are charts that reflect our capital allocation. The acquisition and integration costs in the chart below includes the acquisition-related transaction and integration costs in each period (YTD represents the nine-month periods ended September 30th):
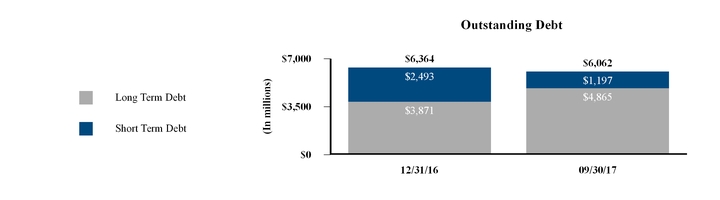
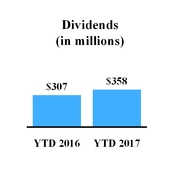
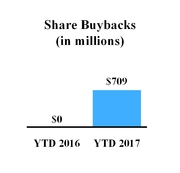
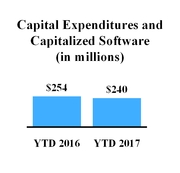
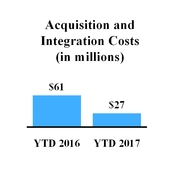
We have financed our operations, growth and cash needs primarily through income from operations and borrowings under our various debt facilities. Our principal capital requirements have been to fund capital expenditures, working capital, strategic acquisitions and investments, stock repurchases, dividends to our shareholders and the continued development of our technology platforms that support our businesses. We believe that our cash on hand and cash flows from operations will be sufficient to repay our outstanding debt as it matures. In the future, we may need to incur additional debt or issue additional equity securities, which we may be unable to do or to do on favorable terms. See “- Future Capital Requirements” below.
Our commercial paper program enables us to borrow efficiently at reasonable short term interest rates and provides us with the flexibility to de-lever using our strong annual cash flows from operating activities whenever our leverage becomes elevated as a result of investment or acquisition activities. We reduced our outstanding commercial paper during the nine months ended September 30, 2017 by $445 million primarily using net cash proceeds received from the sale of our investment in Cetip and cash flows from operations. See “- Recent Developments - Cetip Investment Gain” above and “- Debt” below.
Upon maturity of old issuances of commercial paper and to the extent old issuances are not repaid by cash on hand, we are exposed to the rollover risk of not being able to issue new commercial paper. To mitigate the rollover risk, we maintain an undrawn back-stop bank revolving credit facility for an aggregate amount equaling at any time the amount issued under our commercial paper program. If we were not able to issue new commercial paper, we have the option of drawing on the back-stop revolving facility, however electing to do so would result in higher interest expense. See “- Debt” below.
Consolidated cash and cash equivalents were $419 million and $407 million as of September 30, 2017 and December 31, 2016, respectively, and short-term and long-term restricted cash and investments were $1.0 billion and $943 million as of September 30, 2017 and December 31, 2016, respectively.
As of September 30, 2017, the amount of unrestricted cash held by our non-U.S. subsidiaries was $246 million. While we consider our non-U.S. earnings to be indefinitely reinvested overseas, if these cash balances are needed for our operations in the U.S., any repatriation by way of dividend may be subject to both U.S. federal and state income taxes, as adjusted for any non-U.S. tax credits. However, we do not have any current needs or foreseeable future needs or other plans to repatriate cash by way of dividends from our non-U.S. subsidiaries.
45
Our board of directors has adopted a quarterly dividend declaration policy providing that the declaration of any dividends will be approved quarterly by the board of directors or audit committee of the board of directors taking into account such factors as our evolving business model, prevailing business conditions and our financial results and capital requirements, without a predetermined annual net income payout ratio. During the third quarter of 2017, we paid a quarterly dividend of $0.20 per share of our common stock for an aggregate payout of $119 million, and the aggregate dividend payout for the nine months ended September 30, 2017 was $358 million. On November 2, 2017, we announced a $0.20 per share dividend for the fourth quarter of 2017 with the dividend payable on December 29, 2017 to shareholders of record as of December 14, 2017.
In August 2016, our board of directors approved an aggregate of $1.0 billion for future repurchases of our common stock with no fixed expiration date, subject to applicable laws and regulations. During the three months ended December 31, 2016, we repurchased 902,920 shares of our outstanding common stock at a cost of $50 million, and during the nine months ended September 30, 2017, we repurchased 11,469,042 shares of our outstanding common stock at a cost of $709 million, excluding shares withheld upon vesting of equity awards. These repurchases were completed on the open market and under our 10b5-1 trading plan. As of September 30, 2017, the remaining board authorization permits repurchases of up to $241 million of our common stock. In September 2017, our board of directors approved an aggregate of $1.2 billion for future repurchases of our common stock with no fixed expiration date that becomes effective as of January 1, 2018. Refer to note 7 to our consolidated financial statements and related notes, which are included elsewhere in this Quarterly Report, for more information on our stock repurchase program.
Cash Flows
The following tables present the major components of net increases (decreases) in cash and cash equivalents (in millions):
Nine Months Ended September 30, | |||||||
2017 | 2016 | ||||||
Net cash provided by (used in): | |||||||
Operating activities | $ | 1,410 | $ | 1,508 | |||
Investing activities | 127 | (306 | ) | ||||
Financing activities | (1,534 | ) | (1,366 | ) | |||
Effect of exchange rate changes | 9 | (5 | ) | ||||
Net increase (decrease) in cash and cash equivalents | $ | 12 | $ | (169 | ) | ||
Operating Activities
Net cash provided by operating activities primarily consists of net income adjusted for certain non-cash items, including depreciation and amortization and the effects of changes in working capital. Fluctuations in net cash provided by operating activities are primarily attributable to increases and decreases in our net income between periods and due to fluctuations in working capital. The $98 million decrease in net cash provided by operating activities for the nine months ended September 30, 2017, from the comparable period in 2016, is primarily due to a $136 million contribution that was made to our pension plan in September 2017, compared to a $10 million contribution that was made to our pension plan in September 2016. The pension contribution in September 2017 allowed us to reach 99% funding of our pension obligation and allowed us to immunize the liability against future market fluctuations. For additional information on our pension plan, refer to note 14 to our consolidated financial statements and related notes in Part II, Item 8, “Financial Statements and Supplementary Data”, in our 2016 Form 10-K.
Investing Activities
Consolidated net cash used in investing activities for the nine months ended September 30, 2017 and 2016 primarily relates to the net cash received from our sale of Cetip, increases in our capital expenditures and capitalized software development costs, and changes in our restricted cash. We received net cash proceeds from the sale of Cetip of $438 million. See “- Recent Developments” above.
We had capital expenditures of $136 million and $166 million for the nine months ended September 30, 2017 and 2016, respectively, and we had capitalized software development expenditures of $104 million and $88 million for the nine months ended September 30, 2017 and 2016, respectively. The capital expenditures primarily relate to hardware purchases to continue the development and expansion of our electronic platforms, data services and clearing houses and leasehold improvements associated with the new and renovated office spaces in Atlanta, New York and London. The software development expenditures primarily relate to the continued development and expansion of our electronic trading platforms, data services and clearing houses.
We had net increase/(decrease) in restricted cash and investments of $80 million and ($18 million) for the nine months ended September 30, 2017 and 2016, respectively. The net restricted cash increase for the nine months ended September 30, 2017 primarily related to increases in the regulatory capital restricted cash at ICE Clear Europe and ICE Clear US primarily due to revenue increases,
46
additional costs incurred due to the growth of our clearing businesses and additional regulatory capital buffers. The net restricted cash decrease for the nine months ended September 30, 2016 primarily related to the elimination of the regulatory capital restricted cash at LIFFE Administration and Management, or Liffe, and a decrease in the restricted cash held as escrow for the SuperDerivatives acquisition. The restricted cash decreases in 2016 were partially offset by increases in the regulatory capital restricted cash at ICE Clear Europe and ICE Futures Europe primarily due to additional costs incurred due to the growth of our trading and clearing businesses and additional regulatory capital buffers required by the Bank of England that we classified as restricted cash.
Financing Activities
Consolidated net cash used in financing activities for the nine months ended September 30, 2017 primarily relates to $445 million in net repayments under our commercial paper program, $985 million in net proceeds from the 2022 Senior Notes and 2027 Senior Notes offering, $850 million in repayments of the NYSE Notes, $709 million in repurchases of common stock, $358 million in dividend payments to our shareholders, and $85 million in cash payments related to treasury shares received for restricted stock tax payments and stock options exercises. Consolidated net cash used in financing activities for the nine months ended September 30, 2016 primarily relates to $1.0 billion in net repayments under our commercial paper program, $307 million in dividend payments to our shareholders, and $51 million in cash payments related to treasury shares received for restricted stock tax payments and stock options exercises. See “- Debt” below.
Debt
Our total debt, including short-term and long-term debt, consisted of the following as of September 30, 2017 and December 31, 2016 (in millions):
As of September 30, 2017 | As of December 31, 2016 | ||||||
Debt: | |||||||
Commercial Paper | $ | 1,197 | $ | 1,642 | |||
NYSE Notes (2.00% senior unsecured notes due October 5, 2017) | — | 851 | |||||
Short-term debt | 1,197 | 2,493 | |||||
2018 Senior Notes (2.50% senior unsecured notes due October 15, 2018) | 599 | 598 | |||||
2020 Senior Notes (2.75% senior unsecured notes due December 1, 2020) | 1,243 | 1,242 | |||||
2022 Senior Notes (2.35% senior unsecured notes due September 15, 2022) | 495 | — | |||||
2023 Senior Notes (4.00% senior unsecured notes due October 15, 2023) | 791 | 790 | |||||
2025 Senior Notes (3.75% senior unsecured notes due December 1, 2025) | 1,242 | 1,241 | |||||
2027 Senior Notes (3.10% senior unsecured notes due September 15, 2027) | 495 | — | |||||
Long-term debt | 4,865 | 3,871 | |||||
Total debt | $ | 6,062 | $ | 6,364 | |||
Amended Credit Facility
We had previously entered into a $3.4 billion senior unsecured revolving credit facility, or the Credit Facility, which was scheduled to end on November 13, 2020. On August 18, 2017, we agreed with the lenders, amongst other items, to extend the maturity date to August 18, 2022, herein referred to as the Amended Credit Facility. The Amended Credit Facility includes an option for us to propose an increase in the aggregate amount available for borrowing by up to $975 million, subject to the consent of the lenders funding the increase and certain other conditions. The commitments available under the Amended Credit Facility are scheduled to reduce to $3.2 billion on November 13, 2020.
Other amendments within the Amended Credit Facility include, but are not limited to, (i) eliminating the step-up in the commitment fee ratings-based grid that was scheduled to take effect in April 2019, (ii) removing ICE Europe Parent Limited as a party to the credit agreement, (iii) removing the guaranty by ICE in respect of ICE Europe Parent Limited, (iv) increasing the maximum leverage ratio to 3.50:1.00, and (v) up to two times, increasing the maximum leverage ratio from 3.50:1.00 to 4.00:1.00 for a period of one year following a material acquisition. No amounts were outstanding under the Amended Credit Facility as of September 30, 2017.
Of the $3.4 billion that is currently available for borrowing under the Amended Credit Facility, $1.2 billion is required to back-stop the amount outstanding under our Commercial Paper Program as of September 30, 2017. The amount required to back-stop the amounts outstanding under the Commercial Paper Program will fluctuate as we increase or decrease our commercial paper borrowings. The remaining $2.2 billion available under the Amended Credit Facility as of September 30, 2017 is available to us to use for working capital and general corporate purposes including, but not limited to, acting as a back-stop to future increases in the amounts outstanding under the Commercial Paper Program.
47
Senior Notes
On August 17, 2017, we issued $1.0 billion in aggregate senior notes, including $500 million principal amount of 2.35% senior unsecured fixed rate notes due September 2022, or the 2022 Senior Notes, and $500 million principal amount of 3.10% senior unsecured fixed rate notes due September 2027, or the 2027 Senior Notes. We used the majority of the net proceeds from the 2022 Senior Notes and 2027 Senior Notes offering to fund the redemption of the NYSE Notes. The 2022 Senior Notes and 2027 Senior Notes contain affirmative and negative covenants, including, but not limited to, certain redemption rights, limitations on liens and indebtedness and limitations on certain mergers, sales, dispositions and lease-back transactions.
Commercial Paper Program
We have entered into a U.S. dollar commercial paper program, or the Commercial Paper Program. Our Commercial Paper Program is currently backed by the borrowing capacity available under the Amended Credit Facility, equal to the amount of the commercial paper that is issued and outstanding at any given point in time. The effective interest rate of commercial paper issuances does not materially differ from short term interest rates (such as USD LIBOR). The fluctuation of these rates due to market conditions may impact our interest expense.
Commercial paper notes of $1.2 billion with original maturities ranging from 2 to 75 days were outstanding as of September 30, 2017 under our Commercial Paper Program. As of September 30, 2017, the weighted average interest rate on the $1.2 billion outstanding under our Commercial Paper Program was 1.23% per annum, with a weighted average maturity of 29 days. We repaid $445 million of the amounts outstanding under the Commercial Paper Program during the nine months ended September 30, 2017 primarily using net cash proceeds received from the sale of our investment in Cetip and cash flows from operations.
NYSE Notes
The $850 million, 2.00% senior unsecured fixed rate NYSE Notes were due in October 2017. We paid off the NYSE Notes in September 2017 using the majority of the proceeds from the 2022 Senior Notes and 2027 Senior Notes offering.
Committed Contingent Liquidity Facilities
As a liquidity tool to support the management of initial margin and guaranty fund deposits, ICE Clear Europe, ICE Clear Credit and ICE Clear US have entered into Committed Repurchase Agreement Facilities, or Committed Repo. Additionally, ICE Clear Credit has entered into Committed F/X Facilities to support these liquidity needs. As of September 30, 2017, the following facilities were in place:
ICE Clear Europe: $1.05 billion in Committed Repo to finance U.S. dollar, euro and pound sterling deposits.
ICE Clear Credit: | $300 million in Committed Repo to finance U.S. dollar and euro deposits, €500 million in Committed Repo to finance euro deposits, and €1.4 billion in Committed F/X Facilities to finance euro payment obligations. |
ICE Clear US: $250 million in Committed Repo to finance U.S. dollar deposits.
Future Capital Requirements
Our future capital requirements will depend on many factors, including the rate of growth across our trading and clearing and data and listings segments, strategic plans and acquisitions, available sources for financing activities, required technology and clearing initiatives, regulatory requirements, the timing and introduction of new products and enhancements to existing products, the geographic mix of our business, potential stock repurchases, and the continuing market acceptance of our electronic trading and clearing platforms. We currently expect to make aggregate operational capital expenditures and to incur capitalized software development costs ranging between $280 million and $300 million for the year ended December 31, 2017, which we believe will support the enhancement of our technology, business integration and the continued growth of our businesses. In addition, we currently expect $50 million in non-operational expenditures during 2017, primarily associated with leasehold improvements at our New York headquarters.
As of September 30, 2017, we had $6.1 billion in outstanding debt. We currently have a $3.4 billion Amended Credit Facility. After factoring in the $1.2 billion required to backstop our Commercial Paper Program as of September 30, 2017, $2.2 billion of our Amended Credit Facility is currently available for general corporate purposes. The Amended Credit Facility and our Commercial Paper Program are currently the only significant agreements or arrangements that we have with third parties for liquidity and capital resources. In the event of any strategic acquisitions, mergers or investments, or if we are required to raise capital for any reason or desire to return capital to our stockholders, we may incur additional debt, issue additional equity to raise necessary funds, repurchase additional shares of our common stock or pay a dividend. However, we cannot provide assurance that such financing or transactions will be available or successful, or that the terms of such financing or transactions will be favorable to us. See “- Debt” above.
48
Non-GAAP Financial Measures
We use non-GAAP measures internally to evaluate our performance and in making financial and operational decisions. When viewed in conjunction with our GAAP results and the accompanying reconciliation, we believe that our presentation of these measures provides investors with greater transparency and a greater understanding of factors affecting our financial condition and results of operations than GAAP measures alone. In addition, we believe the presentation of these measures is useful to investors for period-to-period comparison of results because the items described below as adjustments to GAAP are not reflective of our core business performance. These financial measures are not in accordance with, or an alternative to, GAAP financial measures and may be different from non-GAAP measures used by other companies. We use these adjusted results because we believe they more clearly highlight trends in our business that may not otherwise be apparent when relying solely on GAAP financial measures, since these measures eliminate from our results specific financial items that have less bearing on our core operating performance. We strongly recommend that investors review the GAAP financial measures included in this Quarterly Report, including our consolidated financial statements and the notes thereto.
Adjusted operating expenses, adjusted operating income, adjusted operating margin, adjusted net income attributable to ICE common shareholders and adjusted earnings per share for the periods presented below are calculated by adding or subtracting the adjustments described below, which are not reflective of our cash operations and core business performance, and their related income tax effect and other tax adjustments (in millions, except for percentages and per share amounts):
Trading and Clearing Segment | Data and Listings Segment | Consolidated | |||||||||||||||||||||
Nine Months Ended September 30, | Nine Months Ended September 30, | Nine Months Ended September 30, | |||||||||||||||||||||
2017 | 2016 | 2017 | 2016 | 2017 | 2016 | ||||||||||||||||||
Revenues, less transaction-based expenses | $ | 1,611 | $ | 1,584 | $ | 1,874 | $ | 1,777 | $ | 3,485 | $ | 3,361 | |||||||||||
Operating expenses | $ | 643 | $ | 672 | $ | 1,055 | $ | 1,080 | $ | 1,698 | $ | 1,752 | |||||||||||
Less: Interactive Data and NYSE transaction and integration costs | — | 1 | 23 | 30 | 23 | 31 | |||||||||||||||||
Less: Amortization of acquisition-related intangibles | 41 | 58 | 155 | 172 | 196 | 230 | |||||||||||||||||
Less: Net loss on divestiture of NYSE Governance Services | — | — | 6 | — | 6 | — | |||||||||||||||||
Less: Accruals relating to ongoing investigations and inquiries | 14 | — | — | — | 14 | — | |||||||||||||||||
Less: Creditex customer relationship intangible asset impairment | — | 33 | — | — | — | 33 | |||||||||||||||||
Less: Employee severance costs related to Creditex U.K. brokerage operations | — | 4 | — | — | — | 4 | |||||||||||||||||
Adjusted operating expenses | $ | 588 | $ | 576 | $ | 871 | $ | 878 | $ | 1,459 | $ | 1,454 | |||||||||||
Operating income | $ | 968 | $ | 912 | $ | 819 | $ | 697 | $ | 1,787 | $ | 1,609 | |||||||||||
Adjusted operating income | $ | 1,023 | $ | 1,008 | $ | 1,003 | $ | 899 | $ | 2,026 | $ | 1,907 | |||||||||||
Operating margin | 60 | % | 58 | % | 44 | % | 39 | % | 51 | % | 48 | % | |||||||||||
Adjusted operating margin | 63 | % | 64 | % | 54 | % | 51 | % | 58 | % | 57 | % | |||||||||||
Net income attributable to ICE common shareholders | $ | 1,289 | $ | 1,070 | |||||||||||||||||||
Add: Interactive Data and NYSE transaction and integration costs | 23 | 31 | |||||||||||||||||||||
Add: Amortization of acquisition-related intangibles | 196 | 230 | |||||||||||||||||||||
Add: Net loss on divestiture of NYSE Governance Services | 6 | — | |||||||||||||||||||||
Add: Employee severance costs related to Creditex U.K. brokerage operations | — | 4 | |||||||||||||||||||||
Add: Creditex customer relationship intangible asset impairment | — | 33 | |||||||||||||||||||||
Add: Accruals relating to ongoing investigations and inquiries | 14 | — | |||||||||||||||||||||
Less: Cetip investment gain | (176 | ) | — | ||||||||||||||||||||
Add: Foreign exchange loss and transaction expenses on sale of Cetip | 9 | — | |||||||||||||||||||||
Less: Income tax effect for the above items | (54 | ) | (111 | ) | |||||||||||||||||||
Add: Deferred tax adjustment on acquisition-related intangibles | 12 | 14 | |||||||||||||||||||||
Less: Other tax adjustments | — | (34 | ) | ||||||||||||||||||||
Adjusted net income attributable to ICE common shareholders | $ | 1,319 | $ | 1,237 | |||||||||||||||||||
Basic earnings per share attributable to ICE common shareholders | $ | 2.18 | $ | 1.80 | |||||||||||||||||||
Diluted earnings per share attributable to ICE common shareholders | $ | 2.17 | $ | 1.79 | |||||||||||||||||||
Adjusted basic earnings per share attributable to ICE common shareholders | $ | 2.23 | $ | 2.08 | |||||||||||||||||||
Adjusted diluted earnings per share attributable to ICE common shareholders | $ | 2.22 | $ | 2.07 | |||||||||||||||||||
49
Trading and Clearing Segment | Data and Listings Segment | Consolidated | |||||||||||||||||||||
Three Months Ended September 30, | Three Months Ended September 30, | Three Months Ended September 30, | |||||||||||||||||||||
2017 | 2016 | 2017 | 2016 | 2017 | 2016 | ||||||||||||||||||
Revenues, less transaction-based expenses | $ | 523 | $ | 483 | $ | 620 | $ | 595 | $ | 1,143 | $ | 1,078 | |||||||||||
Operating expenses | $ | 213 | $ | 245 | $ | 334 | $ | 359 | $ | 547 | $ | 604 | |||||||||||
Less: Interactive Data and NYSE transaction and integration costs | — | — | 3 | 7 | 3 | 7 | |||||||||||||||||
Less: Amortization of acquisition-related intangibles | 13 | 20 | 51 | 56 | 64 | 76 | |||||||||||||||||
Less: Accruals relating to ongoing investigations and inquiries | 4 | — | — | — | 4 | — | |||||||||||||||||
Less: Creditex customer relationship intangible asset impairment | — | 33 | — | — | — | 33 | |||||||||||||||||
Less: Employee severance costs related to Creditex U.K. brokerage operations | — | 4 | — | — | — | 4 | |||||||||||||||||
Adjusted operating expenses | $ | 196 | $ | 188 | $ | 280 | $ | 296 | $ | 476 | $ | 484 | |||||||||||
Operating income | $ | 310 | $ | 238 | $ | 286 | $ | 236 | $ | 596 | $ | 474 | |||||||||||
Adjusted operating income | $ | 327 | $ | 295 | $ | 340 | $ | 299 | $ | 667 | $ | 594 | |||||||||||
Operating margin | 59 | % | 49 | % | 46 | % | 40 | % | 52 | % | 44 | % | |||||||||||
Adjusted operating margin | 62 | % | 61 | % | 55 | % | 50 | % | 58 | % | 55 | % | |||||||||||
Net income attributable to ICE common shareholders | $ | 369 | $ | 344 | |||||||||||||||||||
Add: Interactive Data and NYSE transaction and integration costs | 3 | 7 | |||||||||||||||||||||
Add: Amortization of acquisition-related intangibles | 64 | 76 | |||||||||||||||||||||
Add: Accruals relating to ongoing investigations and inquiries | 4 | — | |||||||||||||||||||||
Add: Employee severance costs related to Creditex U.K. brokerage operations | — | 4 | |||||||||||||||||||||
Add: Creditex customer relationship intangible asset impairment | — | 33 | |||||||||||||||||||||
Less: Income tax effect for the above items | (22 | ) | (45 | ) | |||||||||||||||||||
Add: Deferred tax adjustment on acquisition-related intangibles | 12 | — | |||||||||||||||||||||
Less: Other tax adjustments | — | (34 | ) | ||||||||||||||||||||
Adjusted net income attributable to ICE common shareholders | $ | 430 | $ | 385 | |||||||||||||||||||
Basic earnings per share attributable to ICE common shareholders | $ | 0.63 | $ | 0.58 | |||||||||||||||||||
Diluted earnings per share attributable to ICE common shareholders | $ | 0.62 | $ | 0.57 | |||||||||||||||||||
Adjusted basic earnings per share attributable to ICE common shareholders | $ | 0.73 | $ | 0.65 | |||||||||||||||||||
Adjusted diluted earnings per share attributable to ICE common shareholders | $ | 0.73 | $ | 0.64 | |||||||||||||||||||
Acquisition-related transaction costs are included as part of our core business expenses, except for those that are directly related to the announcement, closing, financing or termination of a transaction. However, the acquisition-related transaction and integration costs relating to Interactive Data and NYSE are included in non-GAAP adjustments given the sizes of these acquisitions. As of June 30, 2016, the integration of NYSE had been completed and we will no longer include any NYSE integration costs as non-GAAP adjustments following this date. Amortization of acquisition-related intangibles are included in non-GAAP adjustments as excluding these non-cash expenses provides greater clarity regarding our financial strength and stability of cash operating results. During the nine months ended September 30, 2017, we include as non-GAAP adjustments the Cetip realized investment gain and the foreign exchange loss and transaction expenses on the sale of Cetip, as the sale of Cetip is not part of our core business operations. During the nine and three months ended September 30, 2017, we include as non-GAAP adjustments the accruals relating to ongoing investigations and inquiries as it is a non-recurring item. During the nine months ended September 30, 2017, we include as a non-GAAP adjustment the NYSE Governance Services net loss on divestiture as it is a non-recurring item. During the nine and three months ended September 30, 2016, we include as non-GAAP adjustments the Creditex U.K. voice brokerage severance costs related to its discontinuance and the related Creditex customer relationship intangible asset impairment expense as it is a non-recurring item.
The income tax effects relating to the items above are included in non-GAAP adjustments as well as deferred tax adjustments on acquisition-related intangibles and other tax adjustments. The tax items in non-GAAP adjustments are either the tax impacts of the pre-tax non-GAAP adjustments or are tax items as described below that are not in the normal course of business and are not indicative of our core business performance. The non-GAAP income tax effect adjustments above for the nine months ended September 30, 2017 include tax benefits associated with the divestiture of NYSE Governance Services. Deferred tax adjustments on acquisition-related intangibles for the nine months ended September 30, 2017 and 2016 primarily include the impact of U.S.
50
state tax law and apportionment changes which resulted in deferred tax benefits. Other tax adjustments for the nine and three months ended September 30, 2016 relate to U.K. corporate income tax rate changes.
For additional information on these items, refer to our consolidated financial statements and related notes, which are included elsewhere in this Quarterly Report and “- Recent Developments ”, “- Consolidated Operating Expenses”, “- Consolidated Non-Operating Income (Expense)”, “- Consolidated Income Tax Provision” and Part II, Item 1 “- Legal Proceedings”.
Contractual Obligations and Commercial Commitments
In the third quarter of 2017, there were no significant changes to our contractual obligations and commercial commitments from those disclosed in the section “Management’s Discussion and Analysis of Financial Condition and Results of Operations” in our 2016 Form 10-K.
Off-Balance Sheet Arrangements
We do not have any relationships with unconsolidated entities or financial partnerships, often referred to as structured finance or special purpose entities, which have been established for the purpose of facilitating off-balance sheet arrangements or other contractually narrow or limited purposes.
New and Recently Adopted Accounting Pronouncements
Refer to note 2 to our consolidated financial statements above for information on the new and recently adopted accounting pronouncements that are applicable to us.
Critical Accounting Policies and Estimates
In the third quarter of 2017, there were no significant changes to our critical accounting policies and estimates from those disclosed in the section “Management’s Discussion and Analysis of Financial Condition and Results of Operations” in our 2016 Form 10-K.
ITEM 3. QUANTITATIVE AND QUALITATIVE DISCLOSURES ABOUT MARKET RISK
As a result of our operating and financing activities, we are exposed to market risks such as interest rate risk, foreign currency exchange rate risk and credit risk. We have implemented policies and procedures designed to measure, manage, monitor and report risk exposures, which are regularly reviewed by the appropriate management and supervisory bodies.
Interest Rate Risk
We have exposure to market risk for changes in interest rates relating to our cash and cash equivalents, short-term investments, short-term and long-term restricted cash and investments, and indebtedness. As of September 30, 2017 and December 31, 2016, our cash and cash equivalents, short-term investments and short-term and long-term restricted cash and investments were $1.5 billion and $1.4 billion, respectively, of which $259 million and $272 million, respectively, were denominated in pounds sterling, euros or Canadian dollars. The remaining cash and cash equivalents, short-term investments and short-term and long-term restricted cash and investments are denominated in U.S. dollars. We do not use our investment portfolio for trading or other speculative purposes. A hypothetical decrease in long-term interest rates to zero basis points would decrease annual pre-tax earnings by $7 million as of September 30, 2017, assuming no change in the amount or composition of our cash and cash equivalents, short-term investments and short-term and long-term restricted cash and investments.
As of September 30, 2017, we had $6.1 billion in outstanding debt, of which $4.9 billion relates to our senior notes, which bear interest at fixed interest rates. The remaining amount outstanding of $1.2 billion relates to our Commercial Paper Program, which bears interest at fluctuating rates and, therefore, subjects us to interest rate risk. A hypothetical 100 basis point increase in long-term interest rates relating to the amounts outstanding under our Commercial Paper Program as of September 30, 2017 would decrease annual pre-tax earnings by $12 million, assuming no change in the volume or composition of our outstanding indebtedness and no hedging activity.
The interest rates on our Commercial Paper Program are currently evaluated based upon current maturities and market conditions. The weighted average interest rate on our Commercial Paper Program increased from 0.74% as of December 31, 2016 to 1.23% as of September 30, 2017. The increase in the Commercial Paper Program weighted average interest rate was primarily due to the decisions by the U.S. Federal Reserve in March 2017 and in June 2017 to increase the federal funds short-term interest rate by an aggregate 50 basis points to 1.25%. The Federal Reserve also signaled that they intend to continue to increase the federal fund short-term interest rate over the next several years, and if this occurs, this will continue to increase the weighted average interest rate on our
51
Commercial Paper Program. See Item 2 “- Management’s Discussion and Analysis of Financial Condition and Results of Operations - Debt” included elsewhere in this Quarterly Report.
Foreign Currency Exchange Rate Risk
As an international business, we are subject to foreign currency exchange rate risk. We may experience gains or losses from foreign currency transactions in the future given that a significant part of our assets, liabilities, revenues and expenses are recorded in euros or pounds sterling. Certain assets, liabilities, revenues and expenses of foreign subsidiaries are denominated in the local functional currency of such subsidiaries. Our exposure to foreign denominated earnings for the nine and three months ended September 30, 2017 is presented by primary foreign currency in the following table (dollars in millions, except exchange rates):
Nine Months Ended September 30, 2017 | Three Months Ended September 30, 2017 | ||||||||||||||
Pound sterling | Euro | Pound sterling | Euro | ||||||||||||
Average exchange rate to the U.S. dollar in the current year period | 1.2760 | 1.1136 | 1.3091 | 1.1752 | |||||||||||
Average exchange rate to the U.S. dollar in the same period in the prior year | 1.3992 | 1.1167 | 1.3142 | 1.1160 | |||||||||||
Average exchange rate increase (decrease) | (9 | )% | — | % | — | % | 5 | % | |||||||
Foreign denominated percentage of: | |||||||||||||||
Revenues, less transaction-based expenses | 10 | % | 4 | % | 10 | % | 5 | % | |||||||
Operating expenses | 12 | % | 3 | % | 12 | % | 2 | % | |||||||
Operating income | 9 | % | 6 | % | 9 | % | 7 | % | |||||||
Impact of the currency fluctuations (1) on: | |||||||||||||||
Revenues, less transaction-based expenses | $ | (34 | ) | $ | — | $ | — | $ | 3 | ||||||
Operating expenses | $ | (19 | ) | $ | — | $ | — | $ | 1 | ||||||
Operating income | $ | (15 | ) | $ | — | $ | — | $ | 2 | ||||||
(1) Represents the impact of currency fluctuation for the nine and three months ended September 30, 2017 compared to the same periods in the prior year.
We have a significant part of our assets, liabilities, revenues and expenses recorded in pounds sterling or euros. For the nine and three months ended September 30, 2017, 14% and 15%, respectively, of our consolidated revenues, less transaction-based expenses, were denominated in pounds sterling or euros and 15% and 14%, respectively, of our consolidated expenses were denominated in pounds sterling or euros. As the pound sterling or euro exchange rate changes, the U.S. equivalent of revenues and expenses denominated in foreign currencies changes accordingly.
We have foreign currency transaction risk related to the settlement of foreign currency denominated assets, liabilities and payables that occur through our operations, which are received in or paid in pounds sterling or euros, due to the increase or decrease in the foreign currency exchange rates between periods. We incurred foreign currency transaction losses of $2 million for the nine months ended September 30, 2017, and there was no impact for the nine months ended September 30, 2016. We incurred foreign currency transaction (losses) gains of ($1 million) and $1 million for the three months ended September 30, 2017 and 2016, respectively. The foreign currency transactions gains (losses) were primarily attributable to the fluctuations of the pound sterling and euro relative to the U.S. dollar. A 10% adverse change in the underlying foreign currency exchange rates as of September 30, 2017 would result in a foreign currency transaction loss of $3 million, assuming no change in the composition of the foreign currency denominated assets, liabilities and payables and assuming no hedging activity.
We entered into foreign currency hedging transactions during the nine and three months ended September 30, 2017 as economic hedges to help mitigate a portion of our foreign exchange risk exposure and may enter into additional hedging transactions in the future to help mitigate our foreign exchange risk exposure. Although we may enter into additional hedging transactions in the future to help mitigate our foreign exchange risk exposure, these hedging arrangements may not be effective, particularly in the event of imprecise forecasts of the levels of our non-U.S. denominated assets and liabilities.
We have foreign currency translation risk equal to our net investment in our foreign subsidiaries. The financial statements of these subsidiaries are translated into U.S. dollars using a current rate of exchange, with gains or losses included in the cumulative translation adjustment account, a component of equity. Our exposure to the net investment in foreign currencies is presented by primary foreign currencies in the table below (in millions):
52
As of September 30, 2017 | |||||||
Position in pounds sterling | Position in euros | ||||||
Assets | £ | 1,282 | € | 151 | |||
of which goodwill represents | 268 | 43 | |||||
Liabilities | 130 | 44 | |||||
Net currency position | £ | 1,152 | € | 107 | |||
Impact on consolidated equity of a 10% decrease in foreign currency exchange rates | $ | 154 | $ | 13 | |||
As of September 30, 2017 and December 31, 2016, the portion of our equity attributable to accumulated other comprehensive loss from foreign currency translation was $215 million and $345 million, respectively. As of September 30, 2017, we had net exposure of pounds sterling and euros of £1.2 billion ($1.5 billion) and €107 million ($126 million), respectively. Based on these September 30, 2017 net currency positions, a hypothetical 10% decrease of the pound sterling against U.S. dollar would negatively impact our equity by $154 million and a hypothetical 10% decrease of the euro against U.S. dollar would negatively impact our equity by $13 million. For the nine and three months ended September 30, 2017, currency exchange rate differences had a positive impact of $130 million and $45 million, respectively, on our consolidated equity, primarily due to the increase in the pound sterling/U.S. dollar exchange rate to 1.3398 as of September 30, 2017 (from 1.2336 as of December 31, 2016). The future impact on our business relating to the U.K. leaving the European Union and the corresponding regulatory changes are uncertain at this time, including future impacts on currency exchange rates.
Credit Risk
We are exposed to credit risk in our operations in the event of a counterparty default. We limit our exposure to credit risk by rigorously selecting the counterparties with which we make our investments and execute agreements. Credit risk is monitored by using exposure limits depending on ratings assigned by rating agencies as well as the nature and maturity of transactions. Our investment objective is to invest in securities that preserve principal while maximizing yields, without significantly increasing risk. We seek to substantially mitigate credit risk associated with investments by ensuring that these financial assets are placed with governments, well-capitalized financial institutions and other creditworthy counterparties.
An ongoing review is performed to evaluate changes in the status of counterparties. In addition to the intrinsic creditworthiness of counterparties, our policies require diversification of counterparties (banks, financial institutions, bond issuers and funds) so as to avoid a concentration of risk.
Our clearing houses hold material amounts of clearing member cash deposits which are held or invested primarily to provide security of capital while minimizing credit, market and liquidity risks. Refer to note 9 to our consolidated financial statements, which are included elsewhere in this Quarterly Report, for more information on the clearing houses cash deposits, which were $52.4 billion as of September 30, 2017. While we seek to achieve a reasonable rate of return which may generate interest income for our clearing members, we are primarily concerned with preservation of capital and managing the risks associated with these deposits. As the clearing houses may pass on interest revenues (minus costs) to the members, this could include negative or reduced yield due to market conditions. For a summary of the risks associated with this investment activity and how these risks are mitigated, see Part II, Item 7(A) “Quantitative and Qualitative Disclosures About Market Risk” in our 2016 Form 10-K.
Impact of Inflation
We have not been adversely affected by inflation as technological advances and competition have generally caused prices for the hardware and software that we use for our electronic platforms to remain constant or to decline. In the event of inflation, we believe that we will be able to pass on any price increases to our participants, as the prices that we charge are not governed by long-term contracts.
ITEM 4. CONTROLS AND PROCEDURES
(a) Evaluation of Disclosure Controls and Procedures. As of the end of the period covered by this report, an evaluation was carried out by our management, with the participation of our Chief Executive Officer and Chief Financial Officer, of the effectiveness of our disclosure controls and procedures (as defined in Rule 13a-15(e) under the Exchange Act). Based upon that evaluation, our Chief Executive Officer and Chief Financial Officer concluded that these disclosure controls and procedures were effective as of the end of the period covered by this report.
53
(b) Changes in Internal Controls over Financial Reporting. There were no changes in our internal controls over financial reporting that occurred during our most recent fiscal quarter that have materially affected, or are reasonably likely to materially affect, our internal controls over financial reporting. As a result, no corrective actions were taken.
PART II. Other Information
ITEM 1. LEGAL PROCEEDINGS
We are subject to legal proceedings, claims and investigations that arise in the ordinary course of our business. These include, for example, several ongoing investigations and inquiries from the SEC and other regulators as well as the matters described in Part I, Item 3 “Legal Proceedings” in our 2016 Form 10-K. We establish accruals for those matters in circumstances when a loss contingency is considered probable and the related amount is reasonably estimable. Any such accruals may be adjusted as circumstances change. During the nine and three months ended September 30, 2017, we recorded $14 million and $4 million in expense accruals, respectively, relating to ongoing investigations and inquiries. Assessments of losses are inherently subjective and involve unpredictable factors. We do not believe that the resolution of these legal matters will have a material adverse effect on our consolidated financial conditions, results of operations or liquidity. It is possible, however, that future results of operations for any particular quarterly or annual period may be materially and adversely affected by any developments in legal proceedings, claims and investigations.
Further, as previously disclosed in our Annual Report on Form 10-K for the fiscal year ended December 31, 2016, in May 2014, three purported class action lawsuits were filed and later amended in the Southern District by Harold Lanier against the securities exchanges that are participants in each of the three national market system data distribution plans - the Consolidated Tape Association/Consolidated Quotation Plan, the Nasdaq UTP Plan, and the Options Price Reporting Authority, or the Plans, - which are established under the Exchange Act and regulated by the SEC. New York Stock Exchange LLC, NYSE Arca, Inc. and NYSE MKT LLC, which are our subsidiaries, were among the defendants named in one or more of the suits, in which Lanier claimed to sue on behalf of himself and all other similarly situated subscribers to the market data disseminated by the Plans. Lanier’s allegations included that the exchange participants in the Plans breached agreements with subscribers by disseminating market data in a discriminatory manner in that other “preferred” customers allegedly received their data faster than the proposed class. In September 2014, the defendants moved to dismiss the amended complaints, and in April 2015, the court issued an opinion and order granting the motion and dismissing the three lawsuits with prejudice. In September 2016, the Second Circuit entered an order affirming the dismissal of the lawsuits. In November 2016, the Second Circuit denied a petition filed by Lanier, relating only to the lawsuit involving the Options Price Reporting Authority plan, seeking a rehearing by the panel of judges that decided the appeal or, in the alternative, for review by the full Second Circuit. Lanier has not sought review of these matters by the U.S. Supreme Court and we consider this matter closed.
ITEM 1(A). RISK FACTORS
In the third quarter of 2017, there were no significant new risk factors from those disclosed in Part 1, Item 1A, “Risk Factors” in our 2016 Form 10-K. In addition to the other information set forth in this Quarterly Report, including the regulatory update information of Item 2 - Management’s Discussion and Analysis of Financial Condition and Results of Operations, you should carefully consider the factors discussed under “Risk Factors” and the regulation discussion under “Business - Regulation” in our 2016 Form 10-K. These risks could materially and adversely affect our business, financial condition and results of operations. The risks and uncertainties in our 2016 Form 10-K are not the only ones facing us. Additional risks and uncertainties not presently known to us or that we currently believe to be immaterial may also adversely affect our business.
ITEM 2. UNREGISTERED SALES OF EQUITY SECURITIES AND USE OF PROCEEDS
Stock Repurchases
The table below sets forth the information with respect to purchases made by or on behalf of Intercontinental Exchange, Inc. or any “affiliated purchaser” (as defined in Rule 10b-18(a)(3) under the Securities Exchange Act) of our common stock during the three months ended September 30, 2017.
54
Period (2017) | Total number of shares purchased | Average price paid per share | Total number of shares purchased as part of publicly announced plans or programs(1) | Approximate dollar value of shares that may yet be purchased under the plans or programs (in millions)(1) |
July 1 - July 31 | 1,146,769 | $66.21 | 9,877,202 | $405 |
August 1 - August 31 | 1,362,945 | $65.32 | 11,240,147 | $316 |
September 1 - September 30 | 1,131,815 | $66.32 | 12,371,962 | $241 |
Total | 3,641,529 | $65.90 | 12,371,962 | $241 |
(1) | Refer to Note 7 to our consolidated financial statements and related notes, which are included elsewhere in this Quarterly Report, for details on our stock repurchase plans. |
ITEM 3. DEFAULTS UPON SENIOR SECURITIES
None.
ITEM 4. MINE SAFETY DISCLOSURES
Not applicable.
ITEM 5. OTHER INFORMATION
Not applicable.
55
ITEM 6. EXHIBITS
Exhibit Number | Description of Document | |
4.1 | — | |
4.2 | — | |
4.3 | — | |
4.4 | — | |
10.1 | — | |
10.2 | — | |
— | ||
31.2 | — | |
32.1 | — | |
32.2 | — | |
101 | — | The following materials from Intercontinental Exchange, Inc.’s Quarterly Report on Form 10-Q for the quarter ended September 30, 2017, formatted in XBRL (Extensible Business Reporting Language): (i) the Consolidated Balance Sheets, (ii) the Consolidated Statements of Income, (iii) the Consolidated Statements of Comprehensive Income, (iv) the Consolidated Statements of Changes in Equity, Accumulated Other Comprehensive Loss and Redeemable Non-Controlling Interest (v) Consolidated Statements of Cash Flows and (vi) Notes to Consolidated Financial Statements, tagged as blocks of text.* |
* | As provided in Rule 406T of Regulation S-T, this information is “furnished” and not “filed” for purposes of Sections 11 and 12 of the Securities Act of 1933 and Section 18 of the Securities Exchange Act of 1934. Such exhibit will not be deemed to be incorporated by reference into any filing under the Securities Act of 1933 or the Securities Exchange Act of 1934 unless Intercontinental Exchange, Inc. specifically incorporates it by reference. |
56
SIGNATURES
Pursuant to the requirements of Section 13 or 15(d) of the Securities Exchange Act of 1934, the Registrant has duly caused this Report to be signed on its behalf by the undersigned, thereunto duly authorized.
Intercontinental Exchange, Inc. (Registrant) | |||
Date: November 2, 2017 | By: | /s/ Scott A. Hill | |
Scott A. Hill | |||
Chief Financial Officer | |||
(Principal Financial Officer) | |||
57