Attached files
| file | filename |
|---|---|
| 8-K - Vertex Energy Inc. | vertex8k111313.htm |
| EX-99.1 - Vertex Energy Inc. | ex99-1.htm |
EXHIBIT 99.2
INVESTOR PRESENTATION RECOVERING TOMORROW’S ENERGY NOVEMBER 2013 VTNR NASDAQ listed
Disclaimer This document may contain forward-looking statements including words such as “may,” “can,” “could,” “should,” “predict,” “aim,” “potential,” “continue,” “opportunity,” “intend,” “goal,” “estimate,” “expect,” “expectations,” “project,” “projections,” “plans,” “anticipates,” “believe,” “think,” “confident,” “scheduled,” or similar expressions, as well as information about management’s view of Vertex Energy’s future expectations, plans and prospects, within the safe harbor provisions under Private Securities Litigation Reform Act of 1995. These statements involve known and unknown risks, uncertainties and other factors which may cause the results of Vertex Energy, its divisions and concepts to be materially different than those expressed or implied in such statements. These risk factors and others are included from time to time in documents Vertex Energy files with the Securities and Exchange Commission, including, but not limited to, its Form 10-Ks, Form 10-Qs and Form 8-Ks. Other unknown or unpredictable factors also could have material adverse effects on Vertex Energy’s future results. The forward-looking statements included in this presentation are made only as of the date hereof. Vertex Energy cannot guarantee future results, levels of activity, performance or achievements. Accordingly, you should not place undue reliance on these forward-looking statements. Finally, Vertex Energy undertakes no obligation to update these statements after the date of this presentation, except as required by law, and also undertakes no obligation to update or correct information prepared by third parties that are not paid for by Vertex Energy. Notice of Prospectus The issuer has filed a registration statement (including a prospectus) with the SEC for the offering to which this communication relates. Before you invest, you should read the prospectus in that registration statement and other documents the issuer has filed with the SEC for more complete information about the issuer and this offering. You may get these documents for free by visiting EDGAR on the SEC website at www.sec.gov. Alternatively, the issuer, any underwriter or any dealer participating in the offering will arrange to send you the prospectus after filing if you request it by calling (612) 334-6342. Industry Information Information regarding market and industry statistics contained in this presentation is based on information available to us that we believe is accurate. It is generally based on publications that are not produced for investment or economic analysis.

The offering Exchange / Ticker: NASDAQ Capital Market: VTNR Type of Security: Registered Common Stock Type of Offering: Publicly Marketed Follow-On Offering Amount: $8,000,000 Overallotment Option:$1,200,000 (15%) Use of Proceeds: General Corporate Purposes, Including Potential Acquisitions Sole Book-Runner:Craig-Hallum Capital Group Expected Pricing: Wednesday, November 20th Management: Ben Cowart – Founder, Chairman & CEO Chris Carlson – Chief Financial Officer
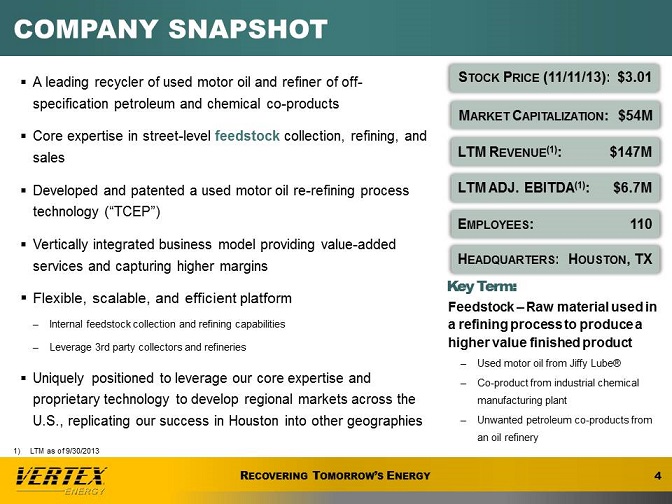
COMPANY SNAPSHOT A leading recycler of used motor oil and refiner of off-specification petroleum and chemical co-products Core expertise in street-level feedstock collection, refining, and sales Developed and patented a used motor oil re-refining process technology (“TCEP”) Vertically integrated business model providing value-added services and capturing higher margins Flexible, scalable, and efficient platform Internal feedstock collection and refining capabilities Leverage 3rd party collectors and refineries Uniquely positioned to leverage our core expertise and proprietary technology to develop regional markets across the U.S., replicating our success in Houston into other geographies Stock Price (11/11/13): $3.01 Market Capitalization: $54M LTM Revenue(1): $147M LTM ADJ. EBITDA(1): $6.7M Employees: 110 Headquarters: Houston, TX Key Term: Feedstock – Raw material used in a refining process to produce a higher value finished product Used motor oil from Jiffy Lube® Co-product from industrial chemical manufacturing plant Unwanted petroleum co-products from an oil refinery
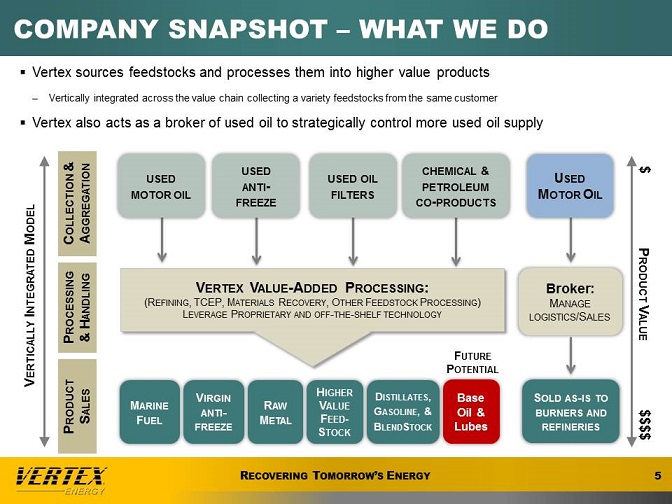
COMPANY SNAPSHOT – what we do Vertex sources feedstocks and processes them into higher value products Vertically integrated across the value chain collecting a variety feedstocks from the same customer Vertex also acts as a broker of used oil to strategically control more used oil supply Vertically Integrated Model Product Sales Processing & Handling Collection & Aggregation used motor oil used anti-freeze used oil filters chemical & petroleum co-products Vertex Value-Added Processing: (Refining, TCEP, Materials Recovery, Other Feedstock Processing) Leverage Proprietary and off-the-shelf technology Broker: Manage logistics/Sales Marine Fuel Virgin anti-freeze Raw Metal Higher Value Feed-Stock Distillates, Gasoline, & BlendStock Base Oil & Lubes Future Potential Sold as-is to burners and refineries Product Value

Used motor oil recycling industry The U.S. used motor oil recycling industry is approximately $2.4 - $2.8 billion Of the 1.3 billion gallons of used oil generated annually, less than 35% is re-refined while the rest is burned or improperly disposed Cheap natural gas creating need for more re-refinement and processors like Vertex Used oil collectors historically sold to local industrial burners Industrial burners are switching to cheap natural gas, and collectors without infrastructure are now selling to re-refineries Market price for burning linked to cheap natural gas while price for re-refined oil is more closely linked to higher priced diesel As more of the 700 million gallons of burned oil is re-refined, the market size will increase considerably assuming the spread between diesel and natural gas holds Burners (paper mill, asphalt kiln) Re-refineries (Base Stock) Vacuum Gas Oil (VGO) Export (utility blends) High Value Fuel (Thermal Chemical Extraction Process - TCEP) 1.3 Billion Gallons of Used Oil*

Used motor oil recycling Value chain GENERATORS Third parties generate used oil through core business Jiffy Lube®, car dealerships, etc. COLLECTORS Collect used oil from generators Typically local or regional Highly fragmented AGGREGATORS Purchase used oil from collectors Sell and deliver it as feedstock for processors PROCESSORS Process used oil into a higher value product Technology upgrades feedstock into higher value end products END USERS End product is used as an industrial fuel, ship fuel, base oil, or refinery feedstock Vertical Integration Enables Vertex To Control More Of The Value Chain & Capture Higher Margins
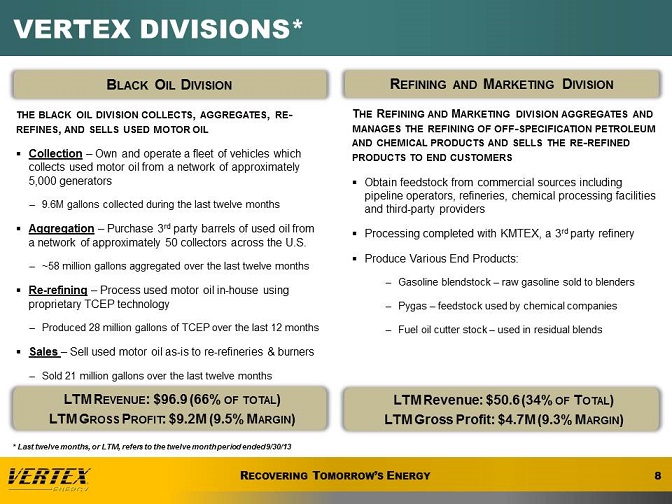
Vertex Divisions* Black Oil Division the black oil division collects, aggregates, re-refines, and sells used motor oil Collection – Own and operate a fleet of vehicles which collects used motor oil from a network of approximately 5,000 generators 9.6M gallons collected during the last twelve months Aggregation – Purchase 3rd party barrels of used oil from a network of approximately 50 collectors across the U.S. ~58 million gallons aggregated over the last twelve months Re-refining – Process used motor oil in-house using proprietary TCEP technology Produced 28 million gallons of TCEP over the last 12 months Sales – Sell used motor oil as-is to re-refineries & burners Sold 21 million gallons over the last twelve months LTM Revenue: $96.9 (66% of total) LTM Gross Profit: $9.2M (9.5% Margin) Refining and Marketing Division The Refining and Marketing division aggregates and manages the refining of off-specification petroleum and chemical products and sells the re-refined products to end customers Obtain feedstock from commercial sources including pipeline operators, refineries, chemical processing facilities and third-party providers Processing completed with KMTEX, a 3rd party refinery Produce Various End Products: Gasoline blendstock – raw gasoline sold to blenders Pygas – feedstock used by chemical companies Fuel oil cutter stock – used in residual blends LTM Revenue: $50.6 (34% of Total) LTM Gross Profit: $4.7M (9.3% Margin) * Last twelve months, or LTM, refers to the twelve month period ended 9/30/13
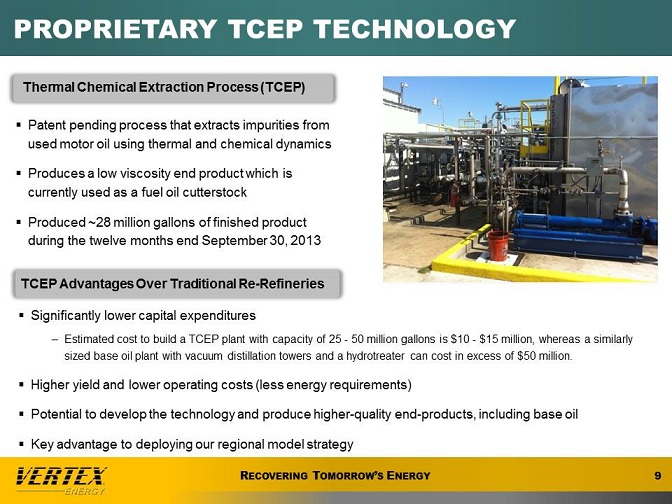
Proprietary tceP Technology Thermal Chemical Extraction Process (TCEP) Patent pending process that extracts impurities from used motor oil using thermal and chemical dynamics Produces a low viscosity end product which is currently used as a fuel oil cutterstock Produced ~28 million gallons of finished product during the twelve months end September 30, 2013 TCEP Advantages Over Traditional Re-Refineries Significantly lower capital expenditures Estimated cost to build a TCEP plant with capacity of 25 - 50 million gallons is $10 - $15 million, whereas a similarly sized base oil plant with vacuum distillation towers and a hydrotreater can cost in excess of $50 million. Higher yield and lower operating costs (less energy requirements) Potential to develop the technology and produce higher-quality end-products, including base oil Key advantage to deploying our regional model strategy

Facilities In-House Re-Refinery Cedar Marine Terminal – TCEP Facility Baytown, TX Third-Party Refinery KMTEX Port Arthur, TX

Black oil division footprint Vertex black oil aggregation network spans the entire U.S. Houston, Texas Mobile, Alabama Columbus, Ohio
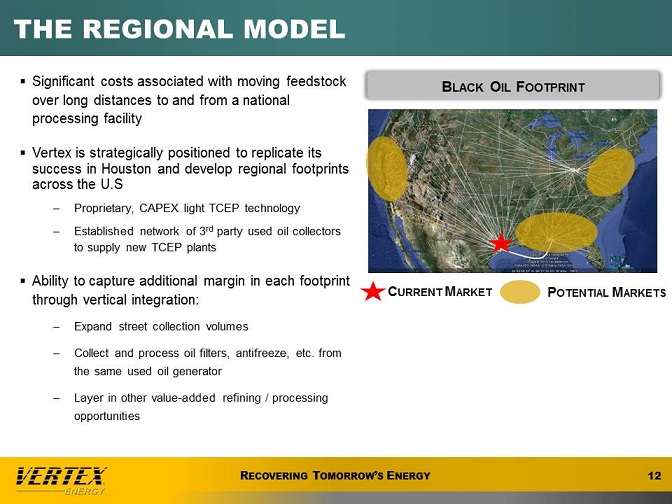
The regional model Significant costs associated with moving feedstock over long distances to and from a national processing facility Vertex is strategically positioned to replicate its success in Houston and develop regional footprints across the U.S Proprietary, CAPEX light TCEP technology Established network of 3rd party used oil collectors to supply new TCEP plants Ability to capture additional margin in each footprint through vertical integration: Expand street collection volumes Collect and process oil filters, antifreeze, etc. from the same used oil generator Layer in other value-added refining / processing opportunities Black Oil Footprint Current Market Potential Markets
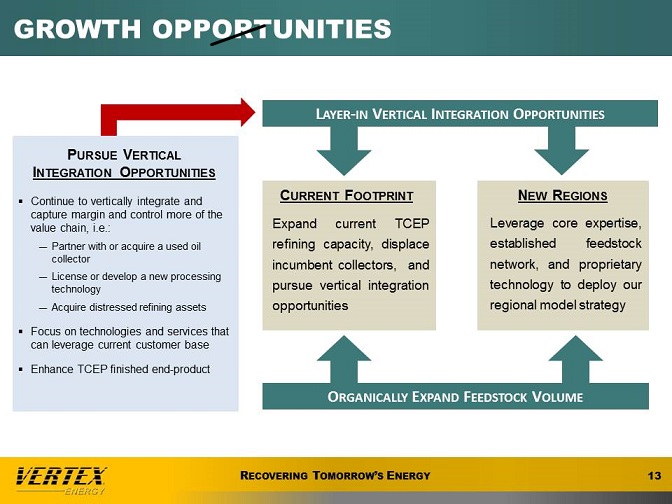
Growth opportunities Pursue Vertical Integration Opportunities Continue to vertically integrate and capture margin and control more of the value chain, i.e.: Partner with or acquire a used oil collector License or develop a new processing technology Acquire distressed refining assets Focus on technologies and services that can leverage current customer base Enhance TCEP finished end-product Layer-in Vertical Integration Opportunities Current Footprint Expand current TCEP refining capacity, displace incumbent collectors, and pursue vertical integration opportunities New Regions Leverage core expertise, established feedstock network, and proprietary technology to deploy our regional model strategy Organically Expand Feedstock Volume
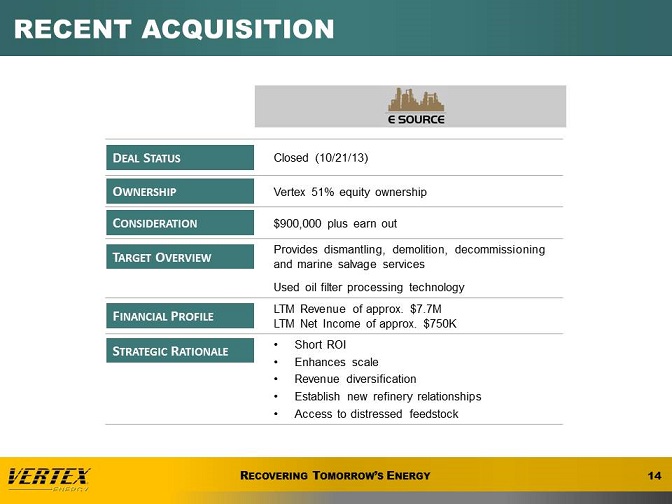
Recent acquisition ESOURCE Deal Status Closed (10/21/13) Ownership Vertex 51% equity ownership Consideration$900,000 plus earn out Target Overview Provides dismantling, demolition, decommissioning and marine salvage services Used oil filter processing technology Financial Profile LTM Revenue of approx. $7.7M LTM Net Income of approx. $750K Strategic Rationale Short ROI Enhances scale Revenue diversification Establish new refinery relationships Access to distressed feedstock
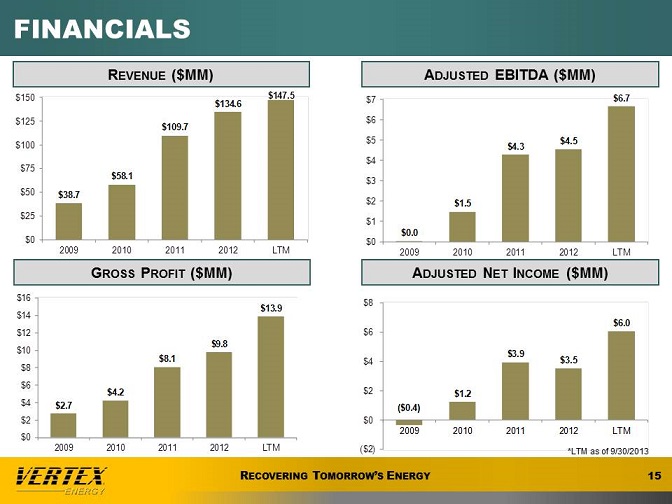
Financials Revenue ($MM) Gross Profit ($MM) Adjusted EBITDA ($MM) Adjusted Net Income ($MM) *LTM as of 9/30/2013
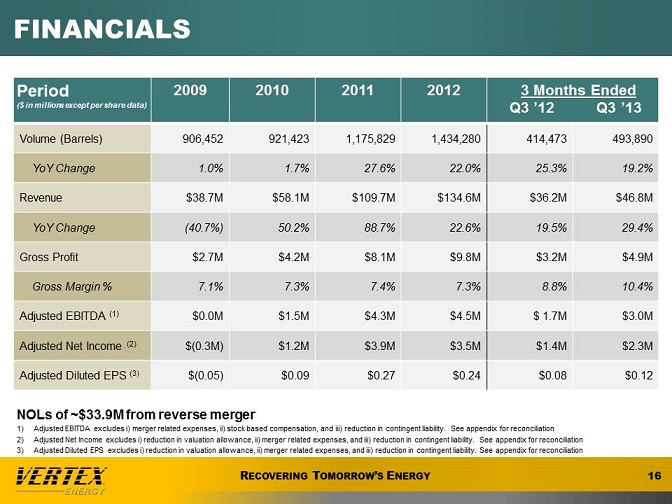
Financials Period ($ in millions except per share data) 2009 2010 2011 2012 3 Months Ended Q3 ’12 Q3 ’13 Volume (Barrels) 906,452 921,423 1,175,829 1,434,280 414,473 493,890 YoY Change 1.0% 1.7% 27.6% 22.0% 25.3% 19.2% Revenue $38.7M $58.1M $109.7M $134.6M $36.2M $46.8M YoY Change (40.7%) 50.2% 88.7% 22.6% 19.5% 29.4% Gross Profit $2.7M $4.2M $8.1M $9.8M $3.2M $4.9M Gross Margin % 7.1% 7.3% 7.4% 7.3% 8.8% 10.4% Adjusted EBITDA (1) $0.0M $1.5M $4.3M $4.5M $ 1.7M $3.0M Adjusted Net Income (2) $(0.3M) $1.2M $3.9M $3.5M $1.4M $2.3M Adjusted Diluted EPS (3) $(0.05) $0.09 $0.27 $0.24 $0.08 $0.12 NOLs of ~$33.9M from reverse merger Adjusted EBITDA excludes i) merger related expenses, ii) stock based compensation, and iii) reduction in contingent liability. See appendix for reconciliation Adjusted Net Income excludes i) reduction in valuation allowance, ii) merger related expenses, and iii) reduction in contingent liability. See appendix for reconciliation Adjusted Diluted EPS excludes i) reduction in valuation allowance, ii) merger related expenses, and iii) reduction in contingent liability. See appendix for reconciliation

Target model Target represents management’s objectives only and does not constitute a financial forecast or projection of future company performance. These management objectives are for the company’s annual Non-GAAP operating model after a period of approximately 3-5 years from 2013
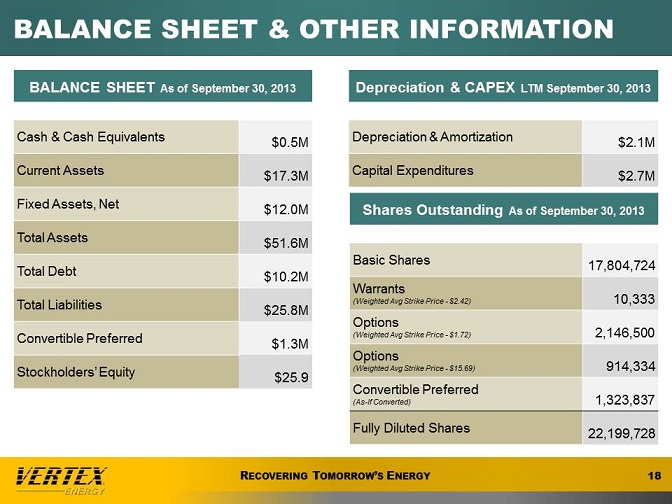
Balance sheet & other information BALANCE SHEET As of September 30, 2013 Cash & Cash Equivalents $0.5M Current Assets $17.3M Fixed Assets, Net $12.0M Total Assets $51.6M Total Debt $10.2M Total Liabilities $25.8M Convertible Preferred $1.3M Stockholders’ Equity $25.9 Depreciation & CAPEX LTM September 30, 2013 Depreciation & Amortization $2.1M Capital Expenditures $2.7M Shares Outstanding As of September 30, 2013 Basic Shares 17,804,724 Warrants (Weighted Avg Strike Price - $2.42) 10,333 Options (Weighted Avg Strike Price - $1.72) 2,146,500 Options (Weighted Avg Strike Price - $15.69) 914,334 Convertible Preferred (As-If Converted) 1,323,837 Fully Diluted Shares 22,199,728
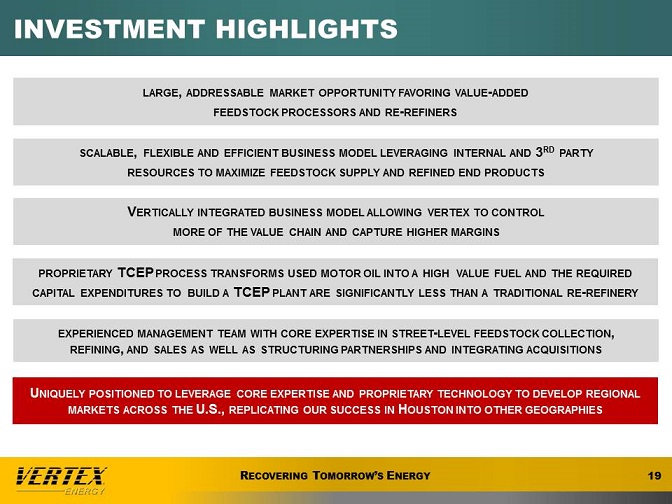
Investment highlights large, addressable market opportunity favoring value-added feedstock processors and re-refiners scalable, flexible and efficient business model leveraging internal and 3rd party resources to maximize feedstock supply and refined end products Vertically integrated business model allowing vertex to control more of the value chain and capture higher margins proprietary TCEP process transforms used motor oil into a high value fuel and the required capital expenditures to build a TCEP plant are significantly less than a traditional re-refinery experienced management team with core expertise in street-level feedstock collection, refining, and sales as well as structuring partnerships and integrating acquisitions Uniquely positioned to leverage core expertise and proprietary technology to develop regional markets across the U.S., replicating our success in Houston into other geographies

Management team Benjamin P. Cowart | Chief Executive Officer, Chairman of the Board, Founder 26+ years petroleum recovery industry, pioneering the reclamation industry by developing recycling options for many hydrocarbon residual materials once managed as hazardous wastes Matthew Lieb | Chief Operating Officer 17+ years business leadership, operations, consulting expertise, 3 startups and public company experience Chris Carlson | Chief Financial Officer 12+ years financial management, energy, commodity, treasury and risk management John Strickland | Manager of Supply & Trading 27+ years management and marketing of fuels and petroleum blending operations Greg Wallace | Manager of Refining & Marketing 22+ years processing, trading and marketing of petroleum and chemicals Mike Stieneker| General Manager of H&H Oil Collections 20+ years management and operations of Used Oil Collections Mike Carter| General Manager of Operations and Regulatory Compliance 20+ years management and terminal operations
APPENDIX
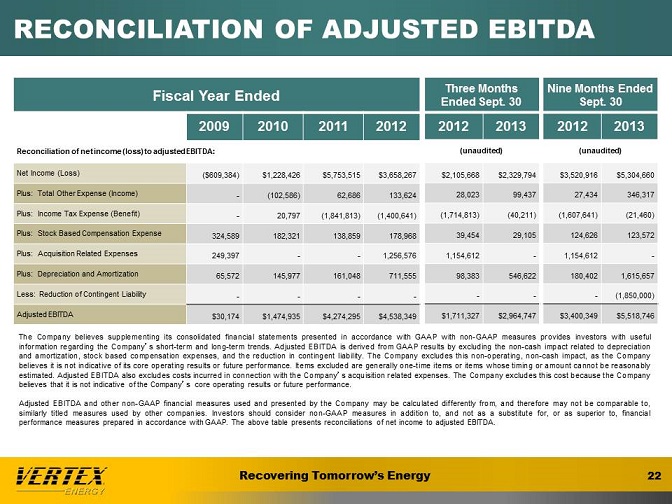
reconciliation of Adjusted EBITDA Fiscal Year Ended 2009 2010 2011 2012 Reconciliation of net income (loss) to adjusted EBITDA: Net Income (Loss) ($609,384) $1,228,426 $5,753,515 $3,658,267 Plus: Total Other Expense (Income) - (102,586) 62,686 133,624 Plus: Income Tax Expense (Benefit) - 20,797 (1,841,813) (1,400,641) Plus: Stock Based Compensation Expense 324,589 182,321 138,859 178,968 Plus: Acquisition Related Expenses 249,397 - - 1,256,576 Plus: Depreciation and Amortization 65,572 145,977 161,048 711,555 Less: Reduction of Contingent Liability Adjusted EBITDA $30,174 $1,474,935 $4,274,295 $4,538,349 Three Months Ended Sept. 30 2012 2013 (unaudited) $2,105,668 $2,329,794 28,023 99,437 (1,714,813) (40,211) 39,454 29,105 1,154,612 -98,383 546,622 $1,711,327 $2,964,747 Nine Months Ended Sept. 30 2012 2013 (unaudited) $3,520,916 $5,304,660 27,434 346,317 (1,607,641) (21,460) 124,626 123,572 1,154,612 - 180,402 1,615,657 - (1,850,000) $3,400,349 $5,518,746 The Company believes supplementing its consolidated financial statements presented in accordance with GAAP with non-GAAP measures provides investors with useful information regarding the Company’s short-term and long-term trends. Adjusted EBITDA is derived from GAAP results by excluding the non-cash impact related to depreciation and amortization, stock based compensation expenses, and the reduction in contingent liability. The Company excludes this non-operating, non-cash impact, as the Company believes it is not indicative of its core operating results or future performance. Items excluded are generally one-time items or items whose timing or amount cannot be reasonably estimated. Adjusted EBITDA also excludes costs incurred in connection with the Company’s acquisition related expenses. The Company excludes this cost because the Company believes that it is not indicative of the Company’s core operating results or future performance. Adjusted EBITDA and other non-GAAP financial measures used and presented by the Company may be calculated differently from, and therefore may not be comparable to, similarly titled measures used by other companies. Investors should consider non-GAAP measures in addition to, and not as a substitute for, or as superior to, financial performance measures prepared in accordance with GAAP. The above table presents reconciliations of net income to adjusted EBITDA.
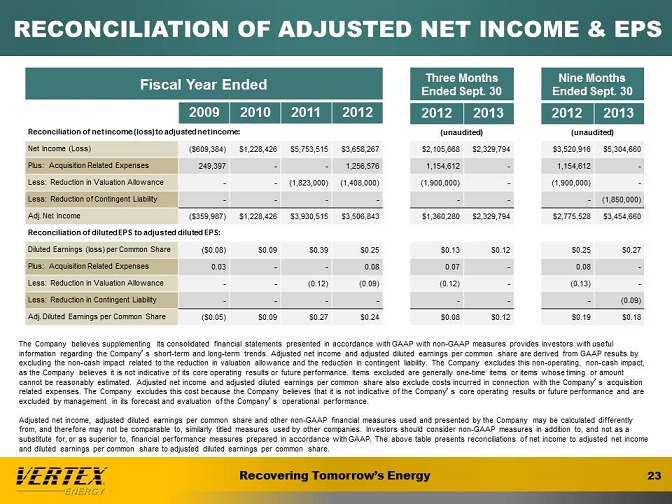
reconciliation of Adjusted net income & EPS Fiscal Year Ended 2009 2010 2011 2012 Reconciliation of net income (loss) to adjusted net income: Net Income (Loss) ($609,384) $1,228,426 $5,753,515 $3,658,267 Plus: Acquisition Related Expenses 249,397 - - 1,256,576 Less: Reduction in Valuation Allowance - - (1,823,000) (1,408,000) Less: Reduction of Contingent Liability Adj. Net Income ($359,987) $1,228,426 $3,930,515 $3,506,843 Reconciliation of diluted EPS to adjusted diluted EPS: Diluted Earnings (loss) per Common Share ($0.08) $0.09 $0.39 $0.25 Plus: Acquisition Related Expenses 0.03 - - 0.08 Less: Reduction in Valuation Allowance - - (0.12) (0.09) Less: Reduction in Contingent Liability Adj. Diluted Earnings per Common Share ($0.05) $0.09 $0.27 $0.24 Three Months Ended Sept. 30 2012 2013 (unaudited) $2,105,668 $2,329,794 1,154,612 - (1,900,000) -$1,360,280 $2,329,794 $0.13 $0.12 0.07 - (0.12) - - - $0.08 $0.12 Nine Months Ended Sept. 30 2012 2013 (unaudited) $3,520,916 $5,304,660 1,154,612 - (1,900,000) - - (1,850,000) $2,775,528 $3,454,660 $0.25 $0.27 0.08 - (0.13) - - (0.09) $0.19 $0.18 The Company believes supplementing its consolidated financial statements presented in accordance with GAAP with non-GAAP measures provides investors with useful information regarding the Company’s short-term and long-term trends. Adjusted net income and adjusted diluted earnings per common share are derived from GAAP results by excluding the non-cash impact related to the reduction in valuation allowance and the reduction in contingent liability. The Company excludes this non-operating, non-cash impact, as the Company believes it is not indicative of its core operating results or future performance. Items excluded are generally one-time items or items whose timing or amount cannot be reasonably estimated. Adjusted net income and adjusted diluted earnings per common share also exclude costs incurred in connection with the Company’s acquisition related expenses. The Company excludes this cost because the Company believes that it is not indicative of the Company’s core operating results or future performance and are excluded by management in its forecast and evaluation of the Company’s operational performance. Adjusted net income, adjusted diluted earnings per common share and other non-GAAP financial measures used and presented by the Company may be calculated differently from, and therefore may not be comparable to, similarly titled measures used by other companies. Investors should consider non-GAAP measures in addition to, and not as a substitute for, or as superior to, financial performance measures prepared in accordance with GAAP. The above table presents reconciliations of net income to adjusted net income and diluted earnings per common share to adjusted diluted earnings per common share.