Attached files
| file | filename |
|---|---|
| 8-K - 8-K - HARDINGE INC | a13-23631_28k.htm |
| EX-99.1 - EX-99.1 - HARDINGE INC | a13-23631_2ex99d1.htm |
Exhibit 99.2
|
|
Third Quarter Financial Results Conference Call November 7, 2013 NASDAQ: HDNG www.hardinge.com Edward J. Gaio Vice President and Chief Financial Officer Richard L. Simons Chairman, President and Chief Executive Officer |

|
|
Safe Harbor Statement This presentation may contain forward-looking statements (within the meaning of Section 27A of the Securities Act of 1933, as amended and Section 21E of the Securities Exchange Act of 1934, as amended). Any such statements are based upon management’s current expectations that involve risks and uncertainties. Any statements that are not statements of historical fact or that are about future events may be deemed to be forward-looking statements. For example, words such as “may”, “will”, “should”, “estimates”, “predicts”, “potential”, “continue”, “strategy”, “believes”, “anticipates”, “plans”, “expects”, “intends” and similar expressions are intended to identify forward-looking statements. The Company’s actual results or outcomes and the timing of certain events may differ significantly from those discussed in any forward-looking statements. The following factors are among those that could cause actual results to differ materially from the forward-looking statements, which involve risks and uncertainties, and that should be considered in evaluating any such statement: fluctuations in the machine tool business cycles, changes in general economic conditions in the U.S. or internationally, the mix of products sold and the profit margins thereon, the relative success of the Company’s entry into new product and geographic markets, the Company’s ability to manage its operating costs, actions taken by customers such as order cancellations or reduced bookings by customers or distributors, competitor’s actions such as price discounting or new product introductions, governmental regulations and environmental matters, changes in the availability of cost of materials and supplies, the implementation of new technologies and currency fluctuations. The Company undertakes no obligation to publicly update any forward-looking statement, whether as a result of new information, future events, or otherwise. 2 |

|
|
Third Quarter Sales 3 ($ in millions) $320 $214 $257 $342 $334 $82 Quarterly Net Sales Annual Net Sales $83 $90 Acquisitions mostly offset organic sales declines compared with Q3 2012 Organic sales to Europe and Asia improved over trailing second quarter $67 $81 Actual net sales may differ due to rounding differences. |

|
|
Gross Margin 4 Quarterly Sales and Gross Margin Annual Sales and Gross Margin Net Sales (in millions) Q3 2013 gross margin impacted by changes in product mix Annualized gross margin improvement over prior years due to favorable product mix and increased productivity *Gross Profit and Gross Margin for Q2 2013, Q3 2013, 2009 and Q3 2013 TTM were adjusted to exclude unusual items. See supplemental slides for Adjusted Gross Profit and Gross Margin reconciliation and other important disclaimers regarding adjusted Gross Profit and Gross Margin. Actual net sales may differ due to rounding differences. |

|
|
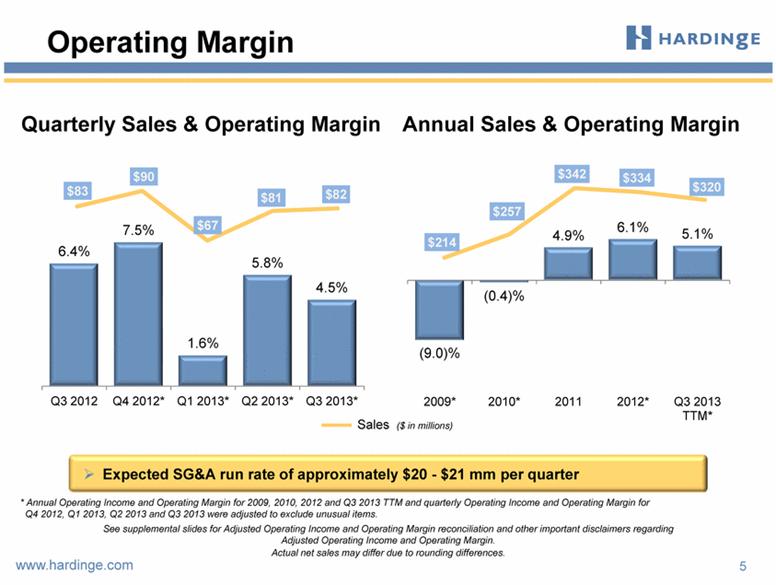
Operating Margin 5 Quarterly Sales & Operating Margin Annual Sales & Operating Margin Expected SG&A run rate of approximately $20 - $21 mm per quarter Sales ($ in millions) * Annual Operating Income and Operating Margin for 2009, 2010, 2012 and Q3 2013 TTM and quarterly Operating Income and Operating Margin for Q4 2012, Q1 2013, Q2 2013 and Q3 2013 were adjusted to exclude unusual items. See supplemental slides for Adjusted Operating Income and Operating Margin reconciliation and other important disclaimers regarding Adjusted Operating Income and Operating Margin. Actual net sales may differ due to rounding differences. |
|
|
Quarterly Net Income Annual Net Income Net Income 6 ($ in millions) * Annual Net Income for 2009, 2010, 2012 and Q3 2013 TTM and quarterly Net Income for Q4 2012, Q1 2013, Q2 2013 and Q3 2013 were adjusted to exclude unusual items. See supplemental slides for Adjusted Net Income reconciliation and other important disclaimers regarding Adjusted Net Income. |

|
|
Emphasis on Productivity and Cash Managed Working Capital* as a Percent of Sales 7 Receivable Days Outstanding (Avg) Inventory Turns (Avg) * Managed Working Capital is defined as: Receivables + Inventory - Payables - Customer Deposits |

|
|
8 Financial Strength Total Capitalization ($ in millions) * Reflects expansion capital investments in China and Switzerland of $17.2 million in 2011 and $3.3 million in 2012. ** Guidance of approximately $4 million provided on 11/7/2013. Cash & Cash Equivalents Capital Expenditures $166.5 $162.9 $168.5 $181.2 $207.2 ** Total Capitalization YTD 2013 capex was $2.2 million Q3 2013 Q3 2012 Cash provided by operating activities $6.4 $5.4 CapEx (0.6) (0.8) Operating free cash flow $5.8 $4.6 |

|
|
9 Geographic Diversity Creates Larger Addressable Market ($ in millions) Annual Orders $288 $372 $297 $175 $277 Quarterly Orders $69 $73 $79 $67 $58 Q3 2013 orders include $10.6 million of orders from acquired operations Orders in Europe and North America included $5.9 million and $3.1 million, respectively, of orders from acquired operations Organic Europe orders recovered in Q3 2013; flat with prior-year period, up $5.6 million over trailing second quarter |

|
|
10 ($ in millions) Backlog Lead times vary by product line Grinding: six to nine months Milling and turning: two to six months Workholding parts and accessories: standard - next day, Specials – four to eight weeks Enhanced Backlog through Acquisitions $127 $125 $123 $130 $123 |

|
|
Oxford Economics Machine Tool Forecast Source: Oxford Economics Fall 2013 Global Machine Tool Outlook Report 11 Emerging Economies Drive Demand Machine Tool Consumption (in US$ billions) Previous world peak surpassed in 2011 China: 69% of Asian demand by 2016 Drivers of Machine Tool Consumption: Replacing technologically obsolete older machines Shrinking supply of skilled machinists Growing middle class in emerging economies Advancing productivity for global competitiveness Oxford Machine Tool Forecast 2013-2017 CAGR World ~8% Asia ~9% Europe ~6% Americas ~5% |

|
|
12 Overview and Outlook Long-term outlook on machine tool industry remains positive Hardinge 2013 outlook Acquisitions help offset decline in North America and Europe organic sales; expecting sales levels comparable with or slightly lower than 2012 sales of $334 million Strong fourth quarter on heavy shipments of Usach backlog Expecting growth in 2014 Macroeconomic factors expected to drive China and U.S. improvements Europe bottomed in mid 2013, modest recovery expected to continue during 2014 Acquisitions have improved margin profile Strengthening earnings power and building more leverage into business Engineering and development focused on maintaining competitive edge Rationalization of sales channels: most recently in the U.K. Hardinge Inc. Performance Excellence – our Lean Six Sigma performance improvement initiative |

|
|
Third Quarter 2013 Earnings Conference Call November 7, 2013 NASDAQ: HDNG www.hardinge.com |

|
|
NASDAQ: HDNG SUPPLEMENTAL INFORMATION www.hardinge.com |

|
|
Adjusted Gross Profit Reconciliation 15 ($ in millions) Gross Profit and Gross Margin for 2009 , Q2 2013, Q3 2013 and Q3 2013 TTM were adjusted to exclude unusual items as listed above Hardinge believes that when used in conjunction with GAAP measures, Adjusted Gross Profit, which is a non-GAAP measure, assists in the understanding of Hardinge’s operating performance. Q1 Q2 Q3 TTM 2009 2010 2011 2012 2013 2013 2013 Q3 2013 Sales $ 214.1 $ 257.0 $ 341.6 $ 334.4 $ 67.2 $ 80.8 $ 82.3 $ 320.9 Cost of sales 173.3 195.7 250.5 237.6 48.2 57.4 59.3 227.8 Gross profit 40.8 61.3 91.1 96.8 19.0 23.4 23.0 93.0 Inventory impairment 5.0 - - - - - - - Inventory step-up charge - - - - - 0.8 0.4 1.2 Adjusted gross profit $ 45.8 $ 61.3 $ 91.1 $ 96.8 $ 19.0 $ 24.2 $ 23.4 $ 94.2 Adjusted gross margin 21.4% 23.9% 26.7% 29.0% 28.2% 29.9% 28.5% 29.4% |

|
|
Annual Adjusted Net Income and Operating Income 16 ($ in millions) Net Income, Operating Income and Operating Margin in 2009, 2010, 2012 and Q3 2013 TTM were adjusted to exclude unusual items as listed above. Hardinge believes that when used in conjunction with GAAP measures, adjusted Net Income (loss) and adjusted Operating Income (loss), which are non-GAAP measures, assist in the understanding of Hardinge’s operating performance. 2009 2010 2011 2012 Q3 2013 TTM Net (loss) income ($33.3) ($5.2) $12.0 $17.9 $11.5 Inventory impairment 5.0 - - - - Restructuring 5.4 - - - - Gain on sale & acquisition - (1.7) - - - Inventory step-up charge - - - - 1.2 Acquisition transaction expense - - - 0.3 2.2 Other adjustment - 3.5 - (2.7) (2.5) Net (loss) income / adjusted net (loss) income (22.9) (3.4) 12.0 15.5 12.4 Plus: Interest expense, net 1.8 0.3 0.2 0.7 1.0 Adjusted income tax expense 1.9 2.2 4.4 4.2 2.9 Adjusted operating income (loss) ($19.2) ($0.9) $16.6 $20.4 $16.3 Sales $214.1 $257.0 $341.6 $334.4 $320.9 Adjusted operating margin (9.0)% (0.4)% 4.9% 6.1% 5.1% |

|
|
Quarterly Adjusted Net Income and Operating Income 17 ($ in millions) Net Income, Operating Income and Operating Margin in Q4 2012, Q1 2013 and Q2 2013 were adjusted to exclude unusual items as listed above. Hardinge believes that when used in conjunction with GAAP measures, adjusted Net Income (loss) and adjusted Operating Income (loss), which are non-GAAP measures, assist in the understanding of Hardinge’s operating performance. Q4 2012 Q1 2013 Q2 2013 Q3 2013 Net income 7.752 $ 0.040 $ 2.265 $ 1.479 $ Inventory step-up charge - - 0.774 0.430 Acquisition transaction expense 0.290 0.645 0.970 0.281 Other adjustment (2.720) - - 0.186 Adjusted net income 5.322 0.685 4.009 2.376 Plus: Interest expense, net 0.181 0.190 0.297 0.311 Adjusted income tax expense 1.332 0.222 0.383 0.989 Adjusted operating income 6.835 1.097 4.689 3.676 Sales 90.560 $ 67.219 $ 80.814 $ 82.258 $ Adjusted operating margin 7.5% 1.6% 5.8% 4.5% |

|
|
Quarterly Financial Appendix 18 ($ in millions, except for per share data) |
