Attached files
| file | filename |
|---|---|
| 8-K - 8-K - Advanced Emissions Solutions, Inc. | d624488d8k.htm |
| EX-99.1 - EX-99.1 - Advanced Emissions Solutions, Inc. | d624488dex991.htm |
 2013
Third Quarter Conference Call November 7,2013
www.advancedemissionssolutions.com
©
2013 Advanced Emissions Solutions, Inc.
Exhibit 99.2 |
 This
presentation includes forward-looking statements within the meaning of Section 21E of the Securities Exchange Act of
1934, which provides a "safe harbor" for such statements in certain
circumstances. The forward-looking statements include statements or
expectations regarding future contracts, projects, demonstrations and technologies; amount and
timing of production of RC, revenues, earnings, cash flows and other financial
measures; future operations; our ability to capitalize on and expand our
business to meet opportunities in our target markets and profit from our proprietary
technologies; scope, timing and impact of current and anticipated regulations and
legislation; future supply and demand; the ability of our technologies to assist
our customers in complying with government regulations and related matters.
These statements are based on current expectations, estimates, projections, beliefs and
assumptions of our management. Such statements involve significant risks and
uncertainties. Actual events or results could differ materially from those
discussed in the forward-looking statements as a result of various factors,
including but not limited to, changes in laws,
regulations and IRS interpretations or guidance, government funding, accounting rules,
prices, economic conditions and market demand; timing of laws, regulations and
any legal challenges to or repeal of them; failure of the RC facilities to
produce coal that qualifies for tax credits; termination of or amendments to the
contracts for RC facilities; decreases in the production of RC; failure to lease
or sell the remaining RC facilities on a timely basis; our inability to ramp up
operations to effectively address expected growth in our target markets; inability to
commercialize our technologies on favorable terms; impact of competition;
availability, cost of and demand for alternative tax credit vehicles and other
technologies; technical, start-up and operational difficulties; availability of raw
materials and equipment; loss of key personnel; intellectual property
infringement claims from third parties; seasonality and other factors discussed in greater
detail in our filings with the Securities and Exchange Commission (SEC). You are
cautioned not to place undue reliance on such statements and to consult our SEC
filings for additional risks and uncertainties that may apply to our business and the
ownership of our securities. Our forward-looking statements are presented as of the
date made, and we disclaim any duty to update such statements unless required by
law to do so. We refer to certain non-GAAP financial measures in this
presentation. Reconciliations of these non-GAAP financial measures to the most
directly comparable GAAP financial measures can be found within this
presentation. SAFE HARBOR
©
2012-2013 Advanced Emissions Solutions, Inc.
-2- |
 -3-
2013 Advanced Emissions Solutions, Inc |
 EMISSION
CONTROL MATS market developing as expected
ADES is prepared for the equipment market
Supply agreements already in place, engineering capabilities expanded
$1-$2B market for consumables to control mercury starting in 2016
ADA has proprietary chemical additive for this market
©
2012-2013 Advanced Emissions Solutions, Inc.
-4- |
 100+
MT/yr
~25
MT/yr
8 facilities
leased/sold
~5
MT/yr
©
2012-2013 Advanced Emissions Solutions, Inc.
-5-
10/29/13 A
12/31/13
3/31/14
12/31/14
3 facilities
CCS-operated
Additional 2
facilities in
full-time
operation
(using M-45-
PC™
technology)
All 28 RC facilities are expected to be in full-time operations by year end 2014
CCS
expects
to
retain
and
operate,
and/or
participate
in
some
RC
facilities
to
generate
tax
credits
sufficient
to
offset
expected
tax
liability
Full-Time Operations Roadmap
2015
2021
Additional
4 facilities
in full-time
operation
Additional
11 facilities
in full-time
operation
28
facilities in
full-time
operation
TM |
 REFINED COAL:
FINANCIAL
IMPACT
OF
GAAP
REPORTING
©
2012-2013 Advanced Emissions Solutions, Inc.
-6-
CCS incurs no operating
costs for the RC facility
CCS receives ~$3-$4/ton in
rental income from RC
investor
CCS spends ~$3/T to
operate RC facility
CCS generates ~$7.50/T in
tax credits for its members
CCS incurs no operating
costs for the RC facility
CCS generates no value
RC facility
leased/sold
to RC
investor
RC facility
operated by
CCS
RC facility
not in full-
time
operation
* ADA’s 42.5% share of tax credits included in net deferred tax assets. NDTA
are offset by a valuation allowance as discussed in the footnotes to the financial statements
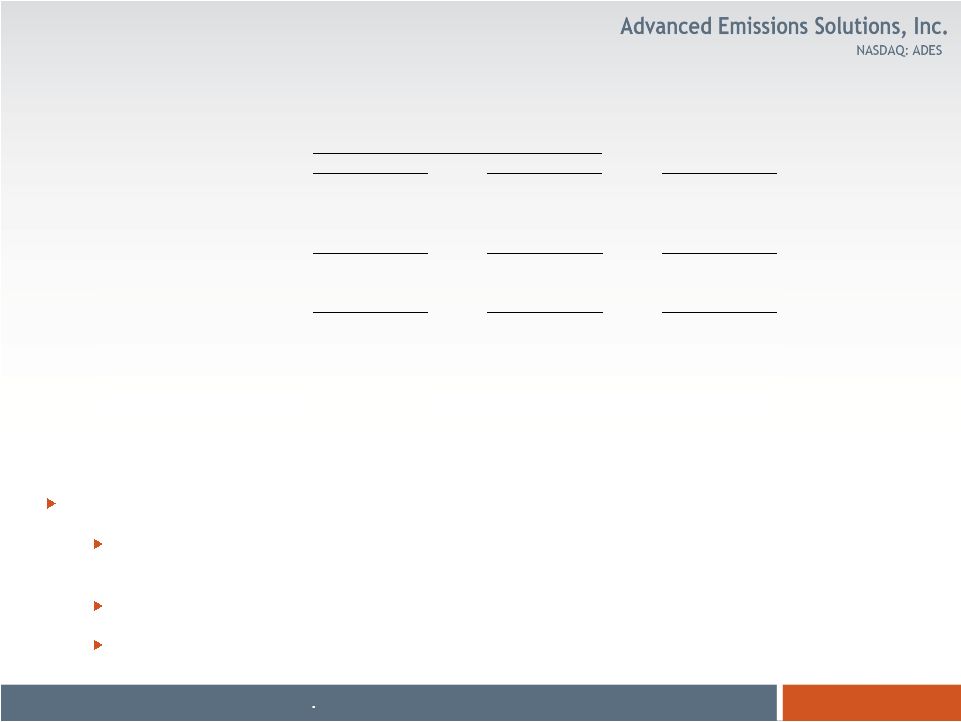
Typical RC facility
producing 4MT/Y
Quarterly
($M)
Annually
($M)
Cash Spent
$ --
$ --
Cash Received
$ --
$ --
Tax Benefits Generated
$ --
$ --
Status
Financial Impact
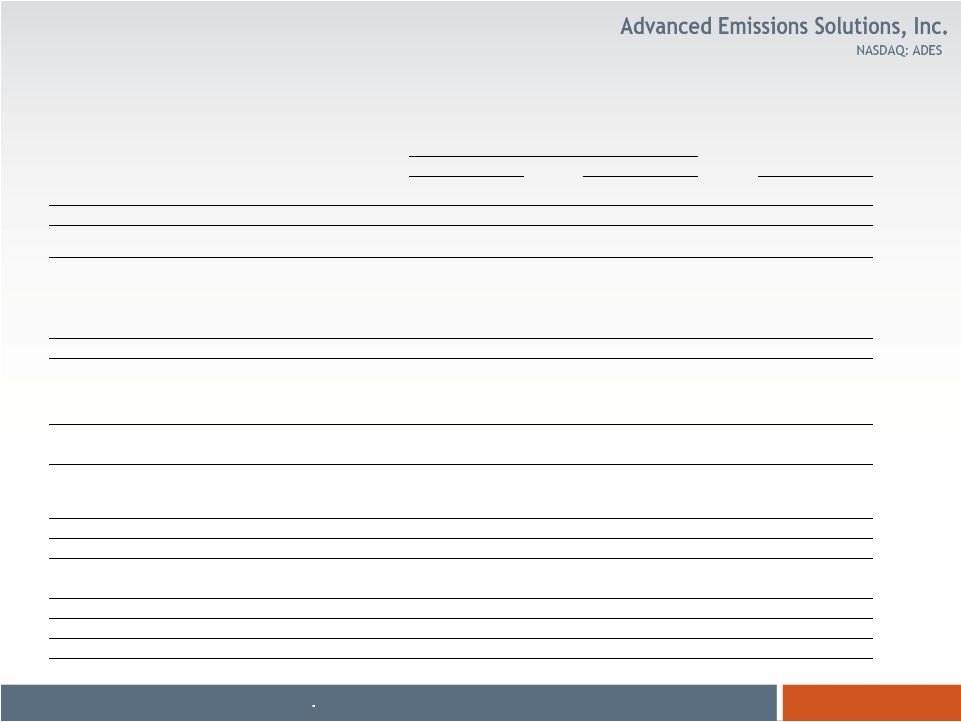
Typical RC facility
producing 4MT/Y
Quarterly
($M)
Annually
($M)
Cash Spent
$3.0
$12.0
Cash Received
$ --
$ --
Tax Benefits Generated*
~$7.50
~$30.0
Typical RC facility
producing 4MT/Y
Quarterly
($M)
Annually
($M)
Cash Spent
$ --
$ --
Cash Received
$3.5
$14.0
Tax Benefits Generated
$ --
$ -- |
 Developing proprietary solid sorbent capture
technology to capture CO
2
from flue gas in
conventional coal-fired boilers
DOE and industry funding:
Phase I -
$3.8 M, R&D at 1 KWe scale, Completed in
2011
Phase II -
$20.5 M, 51-month contract to validate
technology at 1 MWe scale
Pilot Design: 2012, Construction: 2013, Testing: 2014
Located at Southern Company’s Plant Miller
Advantages over competing technologies:
For customer: lower cost and less parasitic energy
For ADA: continuous revenues from sale of
proprietary chemical sorbents
CO
2
CAPTURE:
OVERVIEW
Pilot plant being assembled
at Plant Miller
©
2012-2013 Advanced Emissions Solutions, Inc.
-7- |
 2013
Q3
REVIEW
AND
FINANCIAL
RESULTS
MARK
M KINNIES,
SVP
AND
CFO
©
2013 Advanced Emissions Solutions, Inc
-8-
C |
  Clean
Coal operated 10 RC facilities in 3Q13, 7 of which were leased or sold to RC
investors
In 3Q13 the three RC facilities operated by Clean Coal incurred operating expenses of
$3.1M but generated $6.8M in tax credits
The operation of these units included $36M in pass-through coal
purchases/sales REFINED
COAL
©
2013 Advanced Emissions Solutions, Inc
-9-
$(000)
2013
2012
Coal sales
35,568
$
59,021
$
31,769
$
Rental and other income
20,270
11,176
12,419
Total RC Revenues
55,838
$
70,197
$
44,188
$
Cost of Revenues
39,626
$
67,269
$
36,167
$
Gross Profit
16,212
$
2,928
$
8,021
$
Gross Profit Margin Percentage
29%
4%
18%
Adjusted Gross Profit*
19,338
$
11,041
$
12,393
$
Adjusted Gross Profit Margin Percentage*
95%
99%
99%
* Adjusted gross profit and adjusted gross profit margin percentage excludes coal sales and
raw coal purchases and retained tonnage operating expense See Appendix for explanation
of non-GAAP measures. Operating Statistics (millions)
Tons for leased facilities
5.3
2.8
2.6
Tons retained
1.0
2.5
1.2
Total tons treated
6.3
5.3
3.8
Tax Credits generated by JV
6.8
$
16.1
$
7.7
$
Tax Credits to ADA (42.5%)
2.9
$
6.8
$
3.3
$
For the Three Months Ended
September 30, For the Three
Months Ended
June 30, 2013 |
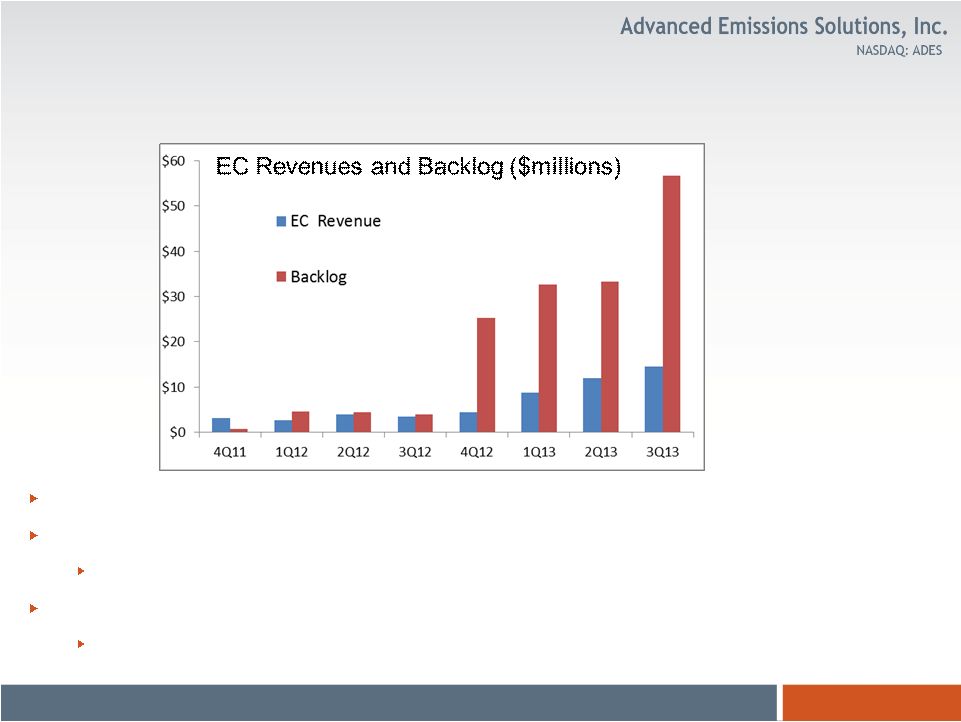
  MATS
rule finalized in March 2012- compliance by 2015/2016
3Q13 Revenues up 300% year-over-year, driven by MATS demand for ACI
and DSI systems
Backlog at 9/30/13 stands at $56.6M, up from $33.2M at 6/30/2013
Currently working on bids or discussing potential projects for ACI and DSI
systems in excess of $120 million
EMISSION
CONTROL
©
2013 Advanced Emissions Solutions, Inc
-10-
2013
2012
$(000)
Systems and equipment
12,094
$
2,299
$
9,915
$
Consulting and development
2,150
968
2,020
Chemicals
254
213
79
Total EC
Revenues 14,498
$
3,480
$
12,014
$
Cost of Revenues
11,836
$
2,683
$
9,711
$
Gross Profit
2,662
$
797
$
2,303
$
Gross Profit Margin Percentage
18%
23%
19%
EC Segment Backlog
56,600
$
3,900
$
33,200
$
For the Three Months Ended September 30,
For the Three
Months Ended
June 30, 2013 |
  In
Phase II of DOE and Industry funded $20.5M 51-month contract to scale
technology to 1MW Project started in June 2012
Estimated completion of construction in 2014
Testing in Fall 2014
CO
2
CAPTURE
©
2013 Advanced Emissions Solutions, Inc
-11-
2013
2012
$(000)
Total CC Revenues
4,257
$
676
$
2,728
$
Cost of Revenues
3,998
$
444
$
2,458
$
Gross Profit
259
$
232
$
270
$
Gross Profit Margin Percentage
6%
34%
10%
Total Backlog
4,300
$
14,600
$
8,500
$
For the Three Months Ended September 30,
For the Three
Months Ended
June 30, 2013 |
  FINANCIAL RESULTS
©
2013 Advanced Emissions Solutions, Inc
-12-
$(000)
2013
2012
Revenues
74,593
$
74,353
$
58,930
$
*Revenues excluding coal sales
39,025
$
15,332
$
27,161
$
Gross Margin Before Depreciation and Amortization
19,133
$
3,957
$
10,594
$
General and administrative
8,955
5,173
8,109
Research and development
976
882
577
Depreciation and amortization
1,433
1,239
1,347
Operating Income (Loss)
7,769
$
(3,337)
$
561
$
Income from unconsolidated entity
547
232
274
Interest expense and other income, net
(25)
(115)
(83)
Other expense
(438)
(848)
(735)
Income (Loss) from Continuing Operations Before Income
Taxes and Non-controlling interests
7,853
$
(4,068)
$
17
$
Income taxes
-
-
-
Non-controlling
interests (6,262)
120
(3,195)
Net Income (Loss) Attributable to ADA
1,591
$
(3,948)
$
(3,178)
$
Net Income (Loss) Per Basic and Diluted Common
Share Attributable to ADA
0.16
$
(0.39)
$
(0.32)
$
Weighted Average Common Shares Outstanding
10,110
10,017
10,076
Weighted Average Diluted Common Shares Outstanding
10,278
10,017
10,076
*See page 15 for explanation of non-GAAP
measure For the Three Months Ended September 30,
For the Three
Months Ended
June 30, 2013 |
 BALANCE SHEET
HIGHLIGHTS
$s in Millions
*Included in working capital at 9/30/13 is $50.2 million in deferred revenue. Included in working capital at 12/31/12 are $21.2 million in
deposits and $4.5 million in deferred revenue ** Long-term liabilities include $17.2
million and $0.9 million at 9/30/13 and 12/31/12 respectively, related
to Clean Coal
-13-
©
2013 Advanced Emissions Solutions, Inc |
 APPENDIX
-14-
©
2013 Advanced Emissions Solutions, Inc |
  NON-GAAP FINANCIAL
MEASURES
-15-
©
2013 Advanced Emissions Solutions, Inc
$(000)
September 30, 2013
September 30, 2012
June 30, 2013
Coal sales and cost of raw coal
35,568
$
59,021
$
31,769
$
Operating costs of retained
tonnage 3,126
$
8,349
$
4,372
$
Adjusted gross
profit and adjusted gross margin percentage excludes coal sales and raw coal purchases and retained tonnage
operating expenses. Adjusted gross profit and adjusted gross profit percentage are
non-GAAP financial measures which are used to provide investors with greater
transparency with respect to the effect on gross margin from Clean Coal’s operation of certain RC
facilities for its own account. We believe these non-GAAP financial measures provide
meaningful supplemental information for investors regarding the performance of our
business and the effect on gross margin and gross margin percentage of the operation of
these RC facilities by Clean Coal for its own account. For the Three Months Ended
|
 CONTACTS Graham Mattison
Vice President, Investor Relations
(646)-319-1417
graham.mattison@adaes.com
Michael D. Durham, Ph.D., MBA
President & CEO
Mark H. McKinnies
SVP & CFO
-16-
©
2013 Advanced Emissions Solutions, Inc |