Attached files
| file | filename |
|---|---|
| 8-K - 8-K - ENCORE CAPITAL GROUP INC | d626857d8k.htm |
 Encore Capital Group, Inc.
Q3 2013 EARNINGS CALL
Exhibit 99.1 |
 PROPRIETARY
2
CAUTIONARY NOTE ABOUT
FORWARD-LOOKING STATEMENTS
The statements in this presentation that are not
historical facts, including, most importantly, those
statements preceded by, or that include, the words
“will,” “may,” “believe,” “projects,” “expects,”
“anticipates” or the negation thereof, or similar
expressions, constitute “forward-looking statements”
within the meaning of the Private Securities Litigation
Reform Act of 1995 (the “Reform Act”). These
statements may include, but are not limited to,
statements regarding our future operating results,
earnings per share, and growth. For all “forward-
looking statements,” the Company claims the
protection of the safe harbor for forward-looking
statements contained in the Reform Act. Such
forward-looking statements involve risks, uncertainties
and other factors which may cause actual results,
performance or
achievements of the Company and its subsidiaries
to be materially different from any future results,
performance or achievements expressed or implied
by such forward-looking statements. These risks,
uncertainties and other factors are discussed in the
reports filed by the Company with the Securities
and Exchange Commission, including its most
recent report on Form 10-K, and its subsequent
reports on form 10-Q, each as it may be amended
from time to time. The Company disclaims any
intent or obligation to update these forward-looking
statements. |
 PROPRIETARY
3
ENCORE DELIVERED A RECORD QUARTER
Estimated Remaining Collections of $4.0 billion
* From continuing operations attributable to Encore
** Please refer to Appendix for reconciliation of Adjusted EPS, Adjusted EBITDA, and
Adjusted Net Income to GAAP *** Cost to Collect is Adjusted Operating Cost /
Dollars collected. See Appendix for reconciliation of Adjusted Operating Cost to GAAP
Note: All Figures Include Cabot Credit Management UK results unless otherwise
indicated $27
$22
40.7%
$234 million
$380 million
$1.02
$0.82
million
million
GAAP EPS*
Adjusted EPS**
Collections
Adjusted EBITDA**
Adjusted
Net Income**
GAAP Net Income*
Cost to Collect*** |
 PROPRIETARY
4
YEAR TO DATE PERFORMANCE HAS BEEN STRONG
* From continuing operations attributable to Encore
** Please refer to Appendix for reconciliation of Adjusted EPS, Adjusted EBITDA, and
Adjusted Net Income to GAAP *** Cost to Collect is Adjusted Operating Cost /
Dollars collected. See Appendix for reconciliation of Adjusted Operating Cost to GAAP
Note: All Figures Include Cabot Credit Management UK results unless otherwise
indicated $69
$53
38.9% $586
million
$928 million
$2.06
$2.74
million
million
Adjusted Net
Income**
Adjusted EPS**
Adjusted EBITDA**
Collections
GAAP EPS*
GAAP Net Income*
Cost to Collect*** |
 PROPRIETARY
5
OUR STRATEGIC MOVES ARE BEARING FRUIT
Asset Acceptance
Continued to move accounts to
Encore -
835k in Q3
Collections were ahead of plan
Expenses were under budget
Cabot Credit Management
Analysis well underway to
expand into new market
segments
India team fully engaged –
expect to be making calls into
the UK in Q1 2014
Propel
Now in 9 states
First Nevada tax lien transfer
executed
Well positioned for industry
consolidation |
  6
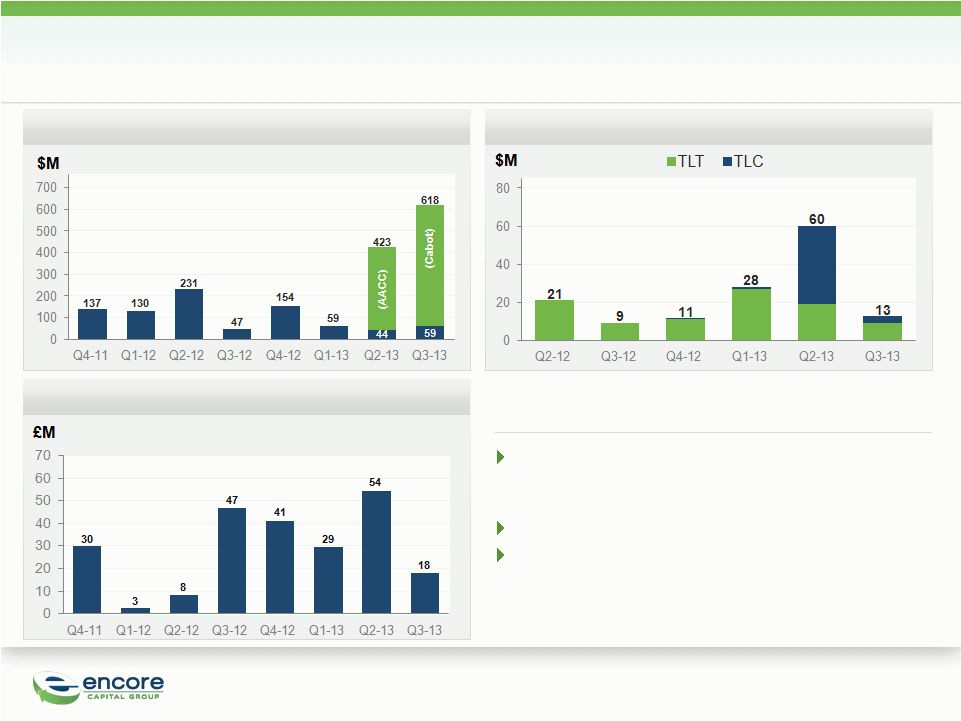
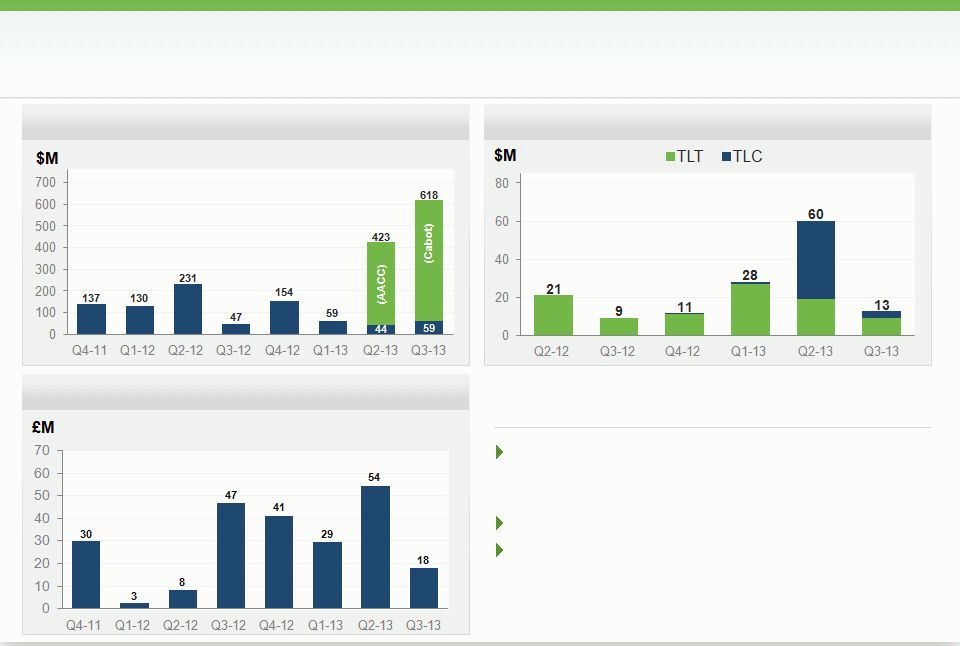
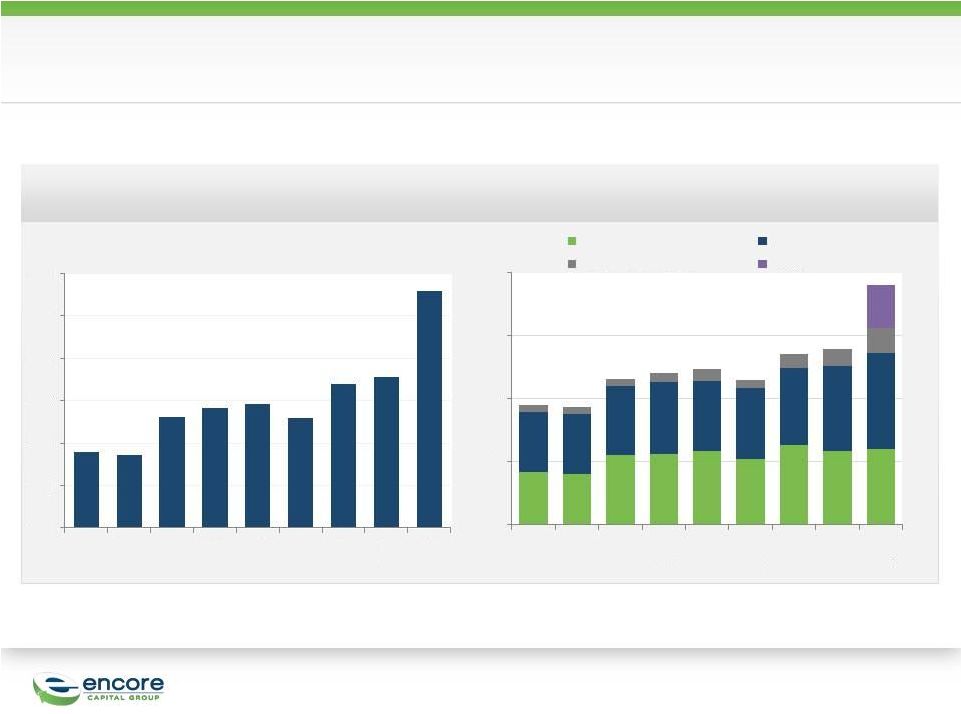
GROWTH IN DEPLOYMENTS WAS LED BY THE
ACQUISITION OF CABOT CREDIT MANAGEMENT
PROPEL DEPLOYMENTS
CABOT DEPLOYMENTS
DEPLOYMENTS
Market comments
US direct-from-issuer pricing pressure remains,
with consolidation among fewer, more stable
buyers
UK market dominated by a few large players
UK issuer inventory backlog expected to come to
market over the next few years
PROPRIETARY |
 PROPRIETARY
7
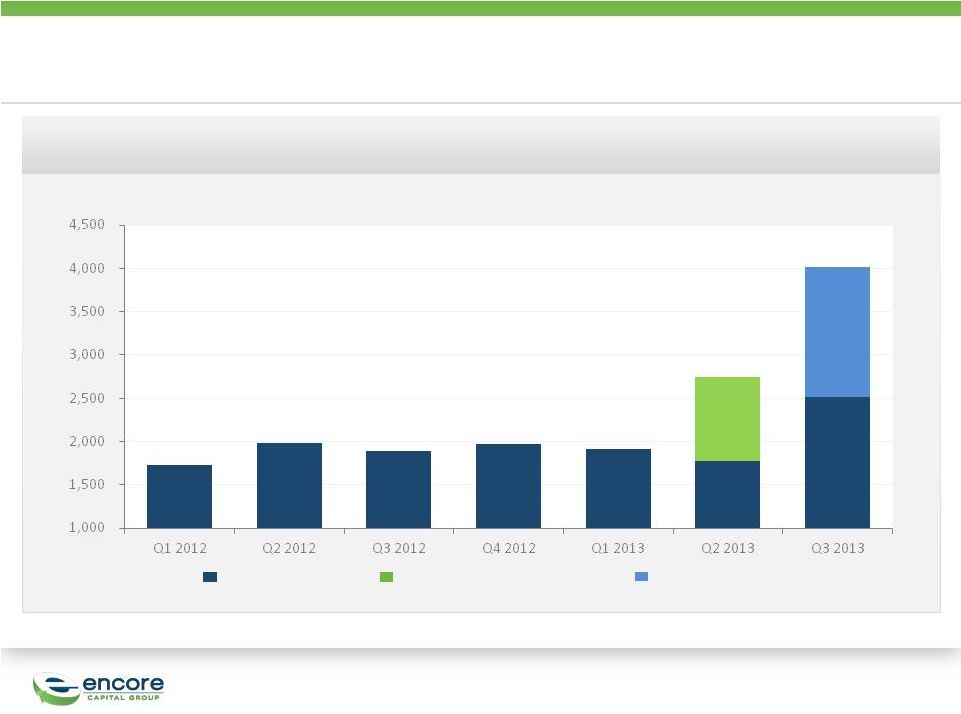
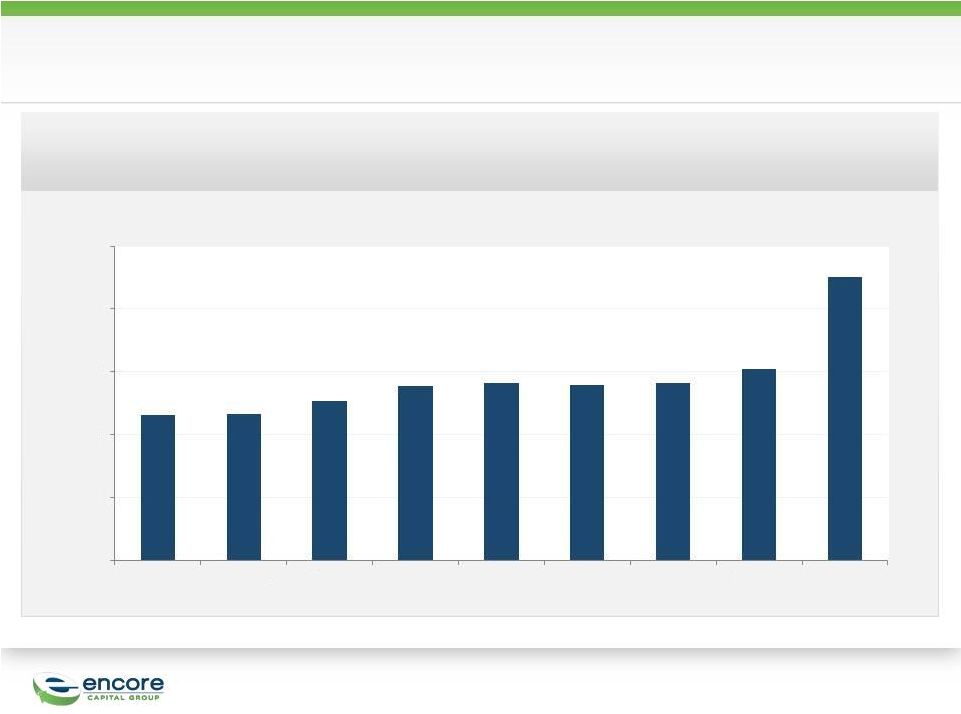
THE CABOT TRANSACTION RESULTED IN STRONG
GROWTH IN ERC
$M
Encore ERC
Asset Acceptance ERC
Cabot ERC
2,519
1,780
1,911
1,967
1,890
1,983
1,724
1,503
4,022
2,741
961
Estimated Remaining Collections |
 PROPRIETARY
8
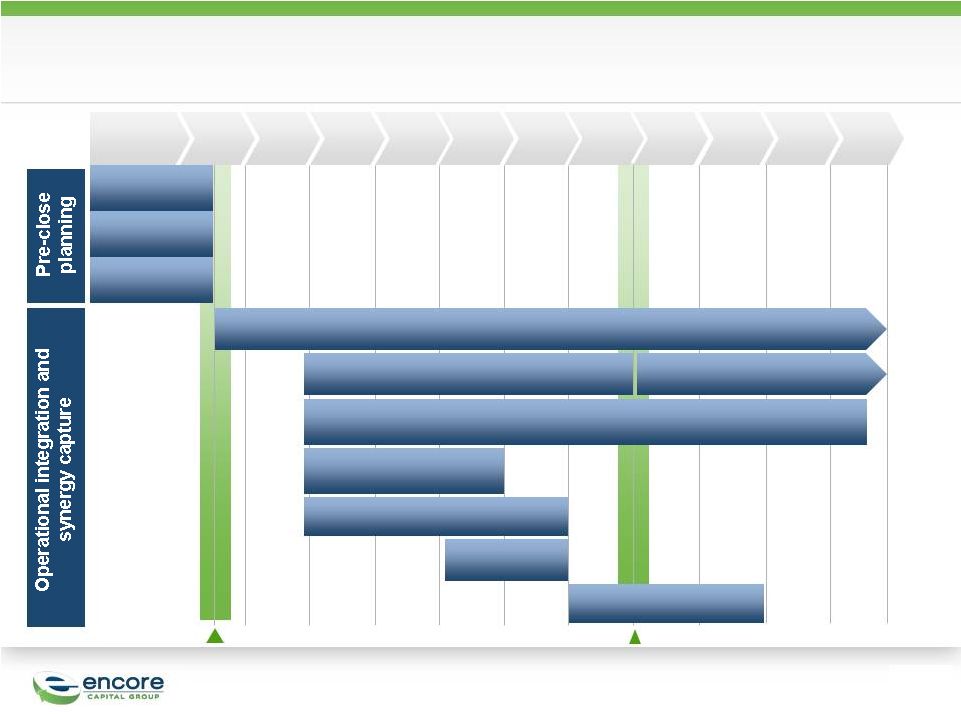
OUR INTEGRATION PLAN FOR AACC REMAINS ON TRACK
Jul
Aug
Sep
Oct
Nov
Dec
Jan
Pre-close
Jun
Feb
Mar
Apr
Support Function Rationalization
Law Firm Management
Internal Legal Platform Integration
Finance
Integration
HR Integration
IL Acct Placement and
conversion
Collection Agency
Rationalization
Call Center Rationalization
Close Of AACC Transaction
Internal Legal Launch
Retention
Agreements
Synergy
Identification
Integration
Planning |
 PROPRIETARY
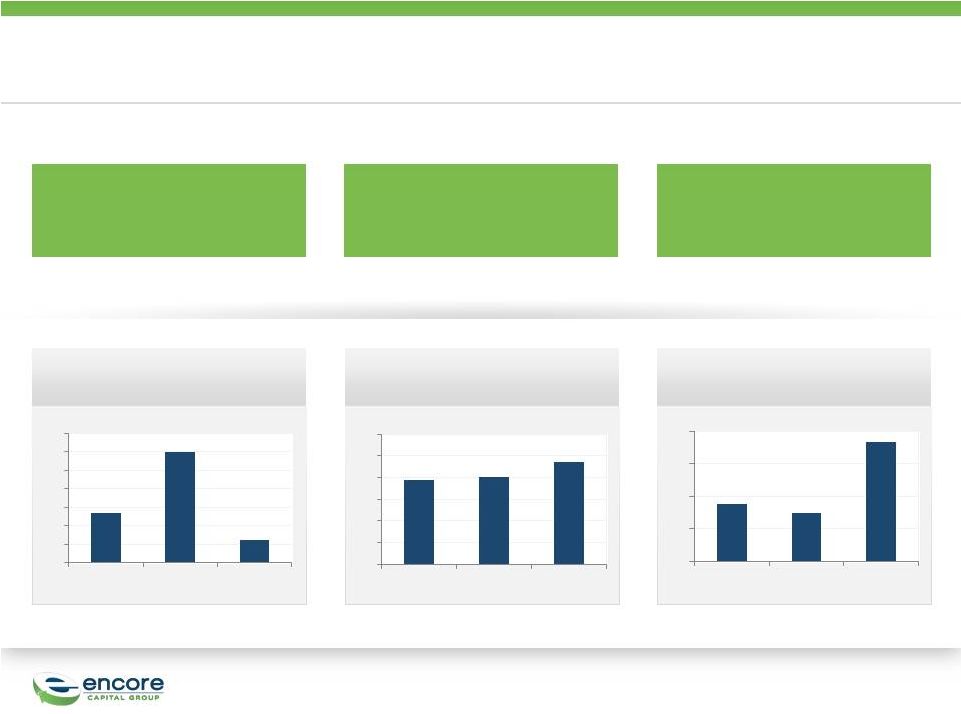
PROPEL CONTINUES TO GROW AND CONTRIBUTE TO
ENCORE
9
$100 million of
capital deployed YTD
Now operating in 9
states
Funded first tax lien
transfer in Nevada
Operating Income
Revenue
Capital Deployed
0
10
20
30
40
50
60
70
Q1
Q2
Q3
0.0
1.0
2.0
3.0
4.0
5.0
6.0
Q1
Q2
Q3
0.0
0.5
1.0
1.5
2.0
Q1
Q2
Q3 |
 10
CABOT’S Q3 RESULTS WERE STRONG AND IN LINE
WITH OUR INVESTMENT MODEL
Adjusted EBITDA*
$50.6
million
Collections
$67.4
Million
Revenue
$46.5
million
Portfolio purchases
$27.0
million
Cost to Collect**
27.2%
120-Month Estimated Remaining Collections of
$1.5 billion
*
Please
refer
to
Appendix
for
reconciliation
of
Adjusted
EBITDA
to
GAAP
** Cost to Collect is Adjusted Operating Cost / Dollar collected. See Appendix for
reconciliation of Adjusted Operating Cost to GAAP
PROPRIETARY |
 PROPRIETARY
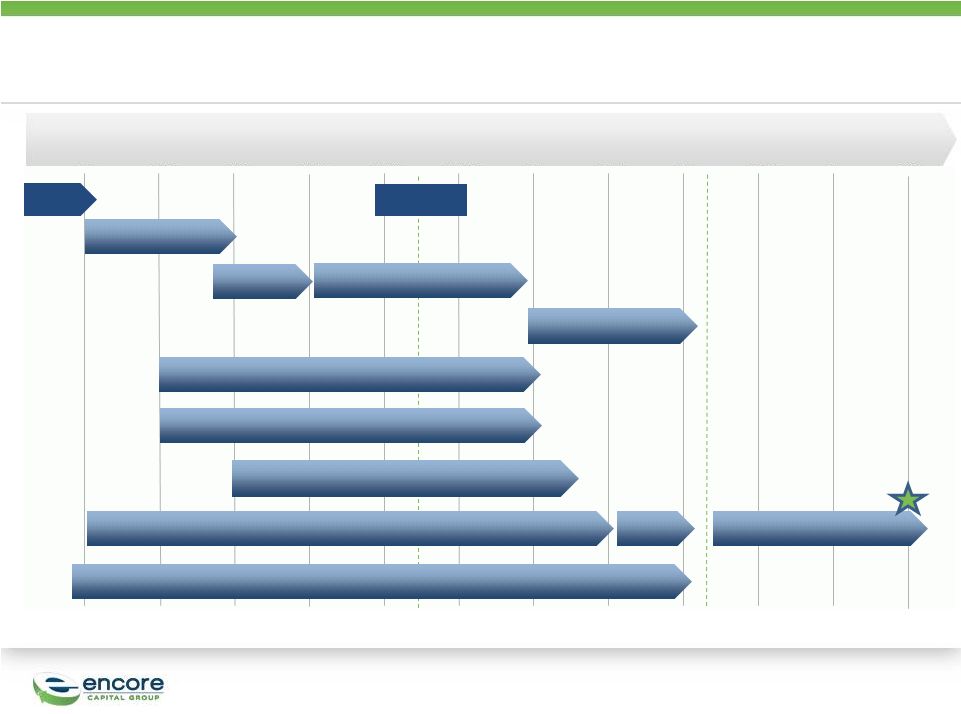
OUR FOCUS AT CABOT IS TO BEGIN LEVERAGING
OUR INDIA SITE DURING THE DAY HOURS IN Q1 2014
11
9/1
9/15
10/1
10/15
11/1
11/15
12/1
12/15
1/1
1/15
Where we
are today
Kick-off
2/1
2/15
Overall IT infrastructure readiness
People selection &
onboarding
Onshore class room training
Visa/ Travel
readiness
On the job training
UAT
Pilot team ‘Go-Live’
@ India
Inventory identification
Servicing/ Dialer strategy
Legal & statutory compliance
Cabot & Encore teams to develop pricing model
ROADMAP –
CABOT INDIA OPERATIONS LAUNCH |
 PROPRIETARY
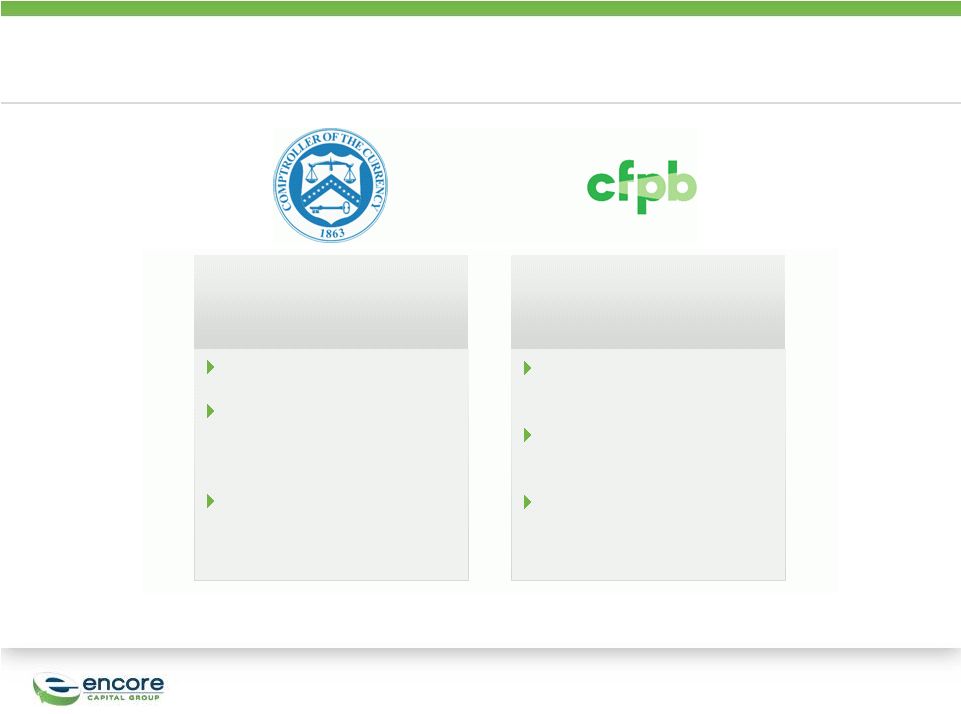
REGULATORY DEVELOPMENTS CONTINUE TO HAVE A
MEANINGFUL EFFECT ON THE INDUSTRY
12
Office of the
Comptroller of the
Currency (OCC)
Debt Sales Best Practices
Memo –
3Q13
Emphasizes importance of
vendor management and
procedures designed to
reduce issuer risk
Accelerated issuer audit
programs
Consumer Financial
Protection Bureau
(CFPB)
Advanced Notice of
Proposed Rulemaking
(ANPR)
–
4Q13
Notice of Proposed
Rulemaking (NPR) –
summer 2014
Final rulemaking late 2014 |
 PROPRIETARY
Regulators
Encore Initiatives
ENCORE HAS LONG SHARED REGULATORS’
VISION TO
RAISE INDUSTRY STANDARDS
13
Consumer Credit
Research Institute
Consumer Bill of
Rights
Consumer Experience
Council
Enterprise Risk
Management
Benefit to consumers
Regulatory clarity &
balance
Industry consolidation
Stronger collections
industry
OCC
CFPB
Outcomes |
 PROPRIETARY
14
ENCORE IS WELL POSITIONED TO MAINTAIN ITS
MOMENTUM & CONTINUE DELIVERING TOP QUARTILE TSR
Management Team •
Learning Organization •
Principled Intent
Growth, Margin Expansion, Free Cash Flow, PE Multiple Expansion
Top Quartile Total Shareholder Return
Specialized call
centers
Efficient international
operations
Internal legal
platform
Operational Scale
& Cost Leadership
2
Sustained success at
raising capital
•
Low cost of debt
•
Sustainable
borrowing capacity
and cash flow
generation
Prudent capital
deployment
Strong Capital
Stewardship
3
Consumer
intelligence
Data driven,
predictive modeling
Portfolio valuation at
consumer level
Consumer Credit
Research Institute
Superior
Analytics
1
Uniquely scalable
platform
Strategic investment
opportunities in near-
in geographic and
paper type
adjacencies
Extendable
Business Model
4 |
 15
Detailed Financial Discussion |
 PROPRIETARY
16
THE AACC AND CABOT ACQUISITIONS ACCELERATED Q3
COLLECTIONS
189
186
231
241
246
230
270
278
380
100
150
200
250
300
350
400
Q3
2011
Q4
2011
Q1
2012
Q2
2012
Q3
2012
Q4
2012
Q1
2013
Q2
2013
Q3
2013
$M
Core Collections
83
80
110
112
117
104
127
117
119
95
96
110
115
111
113
122
134
154
11
10
11
14
18
13
21
27
40
67
0
100
200
300
400
Q3
2011
Q4
2011
Q1
2012
Q2
2012
Q3
2012
Q4
2012
Q1
2013
Q2
2013
Q3
2013
-
Collection Sites
-
Legal Collections
-
Collection Agencies
-
Cabot
$M |
 PROPRIETARY
STRONG COLLECTIONS LED TO SOLID REVENUE
GROWTH
17
116
116
126
139
141
140
141
152
225
50
100
150
200
250
Q3 2011
Q4 2011
Q1 2012
Q2 2012
Q3 2012
Q4 2012
Q1 2013
Q2 2013
Q3 2013
$M
Revenue From Core Collections
- |
 PROPRIETARY
18
COLLECTION MULTIPLES CONTINUE TO INCREASE
OVER TIME
-
0.5
1.0
1.5
2.0
2.5
3.0
2009
2010
2011
2012
Expected Multiple at Purchase
Current Multiple |
 PROPRIETARY
ENCORE’S COST TO COLLECT FULLY REFLECTS AACC’S
AND CABOT’S OPERATIONS
19
* Cost to Collect is Adjusted Operating Cost / Dollar collected.
See Appendix for reconciliation of Adjusted Operating
Cost to GAAP.
Channel
Q3 2013
CTC
Q3 2012
CTC
Cabot
27.2%
24.5%
Legal
39.6%
41.5%
Core sites
8.4%
5.9%
44%
44%
38%
40%
41%
43%
37%
39%
41%
30%
40%
50%
Q3 2011
Q4 2011
Q1 2012
Q2 2012
Q3 2012
Q4 2012
Q1 2013
Q2 2013
Q3 2013
Overall Cost to Collect* |
 PROPRIETARY
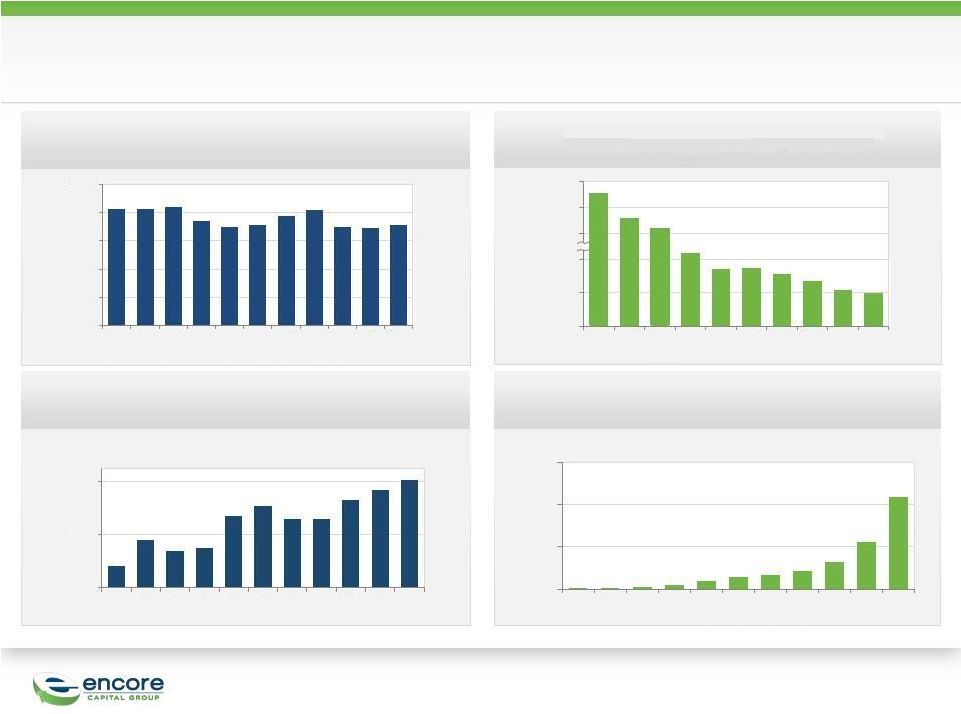
AFTER SEVERAL QUARTERS OF INVESTMENT, COST
TO COLLECT IN INTERNAL LEGAL IS DECLINING
20
0%
10%
20%
30%
40%
50%
Q1
2011
Q2
2011
Q3
2011
Q4
2011
Q1
2012
Q2
2012
Q3
2012
Q4
2012
Q1
2013
Q2
2013
Q3
2013
0%
50%
100%
Q2
2011
Q3
2011
Q4
2011
Q1
2012
Q2
2012
Q3
2012
Q4
2012
Q1
2013
Q2
2013
Q3
2013
150%
300%
450%
80
100
120
Q1
2011
Q2
2011
Q3
2011
Q4
2011
Q1
2012
Q2
2012
Q3
2012
Q4
2012
Q1
2013
Q2
2013
Q3
2013
-
15.0
30.0
45.0
Q1
2011
Q2
2011
Q3
2011
Q4
2011
Q1
2012
Q2
2012
Q3
2012
Q4
2012
Q1
2013
Q2
2013
Q3
2013
Legal Outsourcing Cost to Collect
Internal Legal Cost to Collect
Legal Outsourcing Collections
Internal Legal Collections
$M
$M |
 PROPRIETARY
COLLECTIONS GROWTH AND COST IMPROVEMENTS
LED TO IMPROVED CASH FLOWS
21
* Please refer to Appendix for reconciliation of Adjusted EBITDA
to GAAP
Adjusted EBITDA*
107
105
144
148
151
135
174
177
234
-
50
100
150
200
250
Q3 2011
Q4 2011
Q1 2012
Q2 2012
Q3 2012
Q4 2012
Q1 2013
Q2 2013
Q3 2013 |
 PROPRIETARY
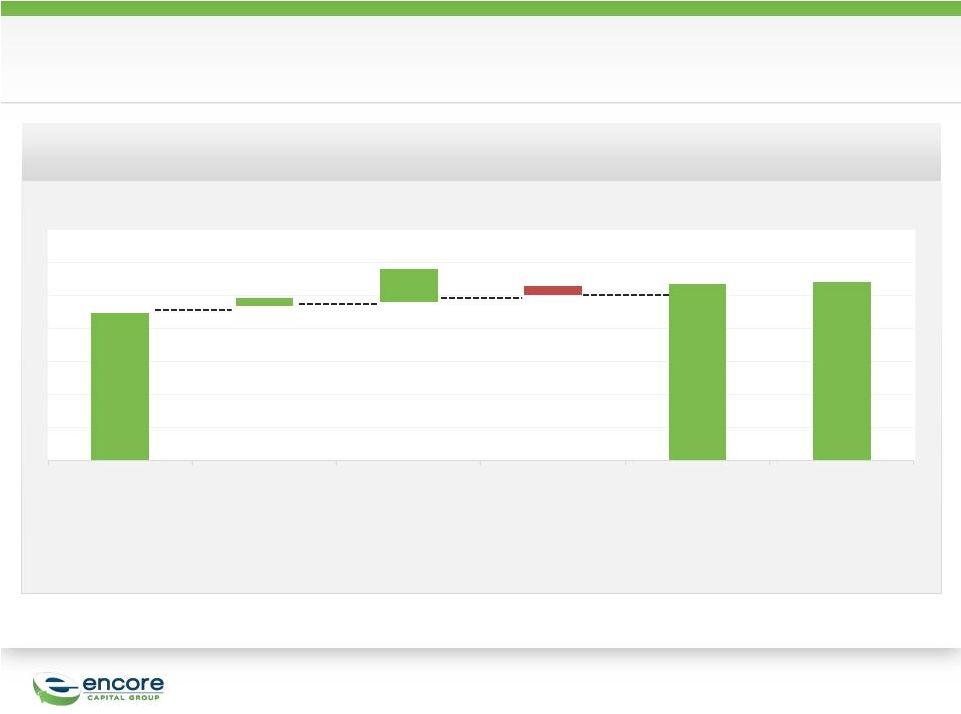
WE SAW IMPROVEMENT IN OUR EFFECTIVE TAX RATE
22
35.0%
5.2%
(4.0%)
1.8%
(4.8%)
1.1%
(1.8%)
0%
5%
10%
15%
20%
25%
30%
35%
40%
45%
Federal Provision
State Provision
State Benefit
Changes in State
Apportionment
Tax Reserves
International
Provision
Permanent Items
Q3 Effective
Rate
32.5% |
 PROPRIETARY
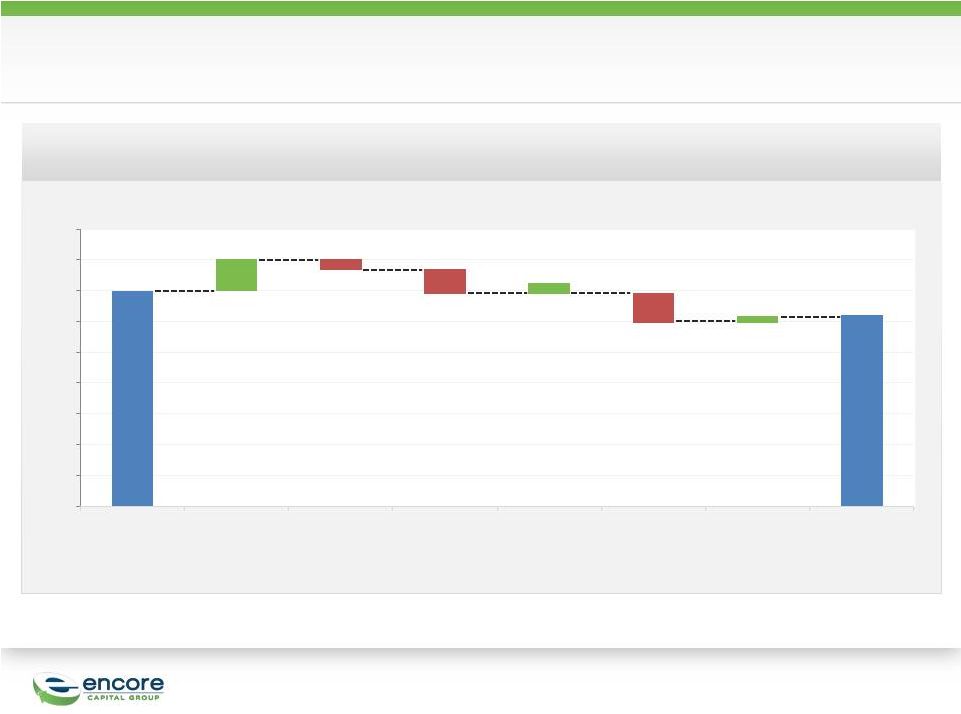
ENCORE’S Q3 ADJUSTED EPS SET A RECORD OF $1.02
PER FULLY DILUTED SHARE
23
$(0.05)
Net income per diluted
share from continuing
operations attributable
to Encore
Net non-cash interest
and issuance cost
amortization, net of tax
Acquisition related legal
and advisory fees, net
of tax
Effect of tax credits
applicable to prior
periods
Adjusted net income
from continuing
operations per diluted
share attributable to
Encore -
(Accounting)
Adjusted net income
from continuing
operations attributable
to Encore -
(Economic)*
$0.82
$0.04
$0.18
$0.99
$1.02
* Please refer to Appendix for reconciliation of Adjusted EPS measurements to
GAAP Note: the following slide contains additional detail
|
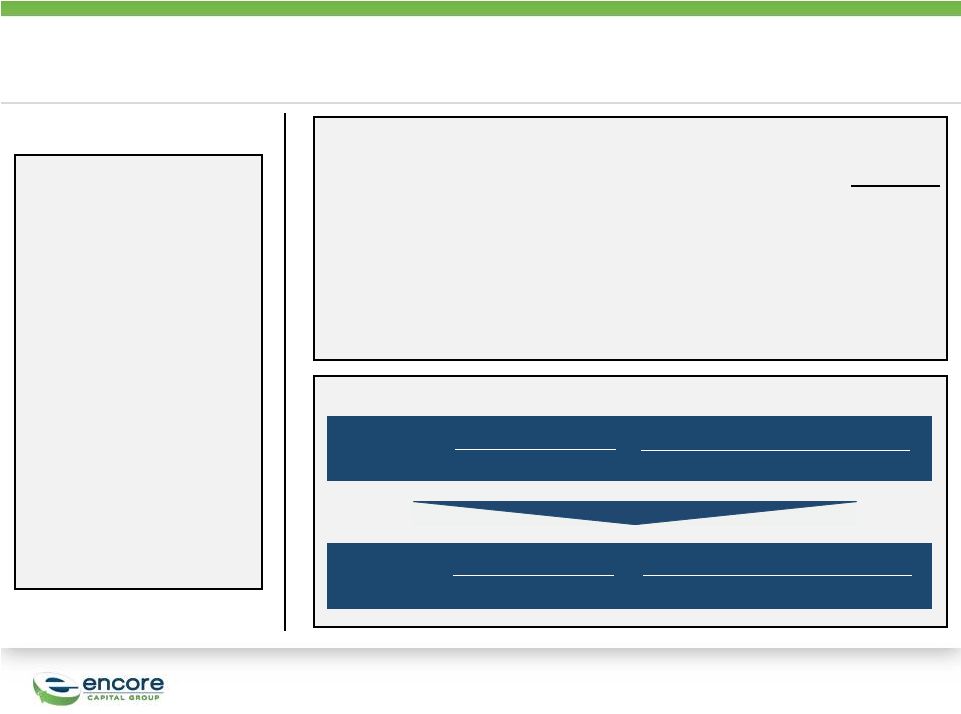 –
Issued $115 million of
convertible bonds, due in
2017
–
The bonds are
convertible at $31.5625
–
Purchased hedges to
increase the effective
conversion price to
$44.1875
–
The average price of
Encore stock during Q3
2013 was $40.52
–
Initial cost of warrants
$11.6 million
–
Protected from 1.04
million shares of dilution
Note:
Non-GAAP economic EPS also removes non-cash interest expense from EPS
numerator OUR CONVERTIBLE HEDGE HAS PROTECTED US FROM
SIGNIFICANT ECONOMIC DILUTION
24
Impact of 3.00% Convertible due 2017 on Diluted Share Count
Increase to
Diluted
Share Count
=
Q3
Applicable
Share
Price
–
Conversion
Price
Q3 Applicable Share Price
Principal Amt Outstanding
Conversion Price
×
~805
Thousand
Shares
=
$40.52 –
$31.56
$40.52
$115 million
$31.56
×
$1.02
Adjusted EPS
-
economic
Adjusted
EPS
-
accounting
$0.99
Q3 GAAP Fully Diluted Shares Outstanding
27.2 million
(-) Shares from 2017 Bond Hedge
0.8 million
Non-GAAP Economic Shares Outstanding
26.4 million
$26.8 million
Adjusted Income from Continuing Operations Attributable to Encore
|
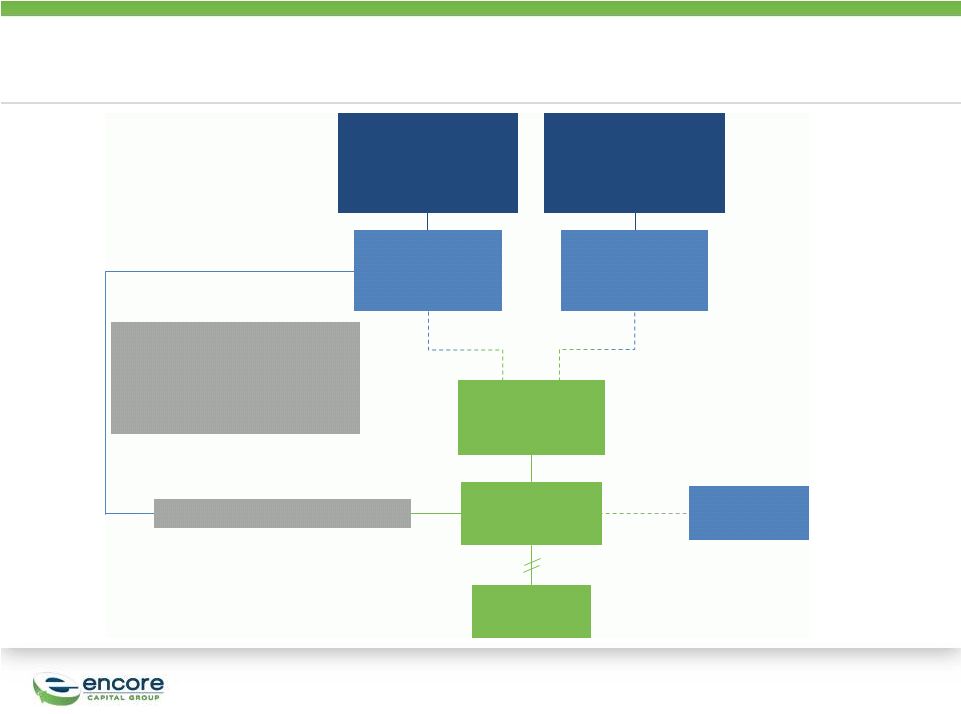 ENCORE’S OWNERSHIP OF CABOT REFLECTS THE MINORITY
INTERESTS OF J.C. FLOWERS AND MANAGEMENT
25
50.1%
49.9%
Not all entities depicted.
14.35%
Employee
Benefit Trust
(Management)
JFC III Europe
Holdings L.P.
(Cayman)
Encore
(US)
Encore Europe
Holdings s.a.r.l.
(Lux)
JFC III Europe
s.a.r.l.
(Lux)
Janus Holdings
s.a.r.l.
(Lux)
Cabot Holdings
s.a.r.l.
(Lux)
Cabot Credit
Management
(UK)
42.9% economic ownership
$177 million, consisting of:
$165 million -
PECs
$12 million -
shares
85.65% |
 PROPRIETARY
CABOT CONTRIBUTED $0.17 TO ENCORE’S Q3 RESULTS
26
In 000’s except per share amounts
Janus
Encore Europe Holdings
EEH Consolidated
Revenue / other income
$46,568
-
$46,568
Total Expenses
(22,179)
-
(22,179)
EBITDA
24,389
-
24,389
Depreciation and Amortization
(1,461)
-
(1,461)
Non-PEC Interest Expense
(12,319)
-
(12,319)
PEC Interest –
JCF / Mgmt
(5,877)
-
(5,877)
PEC Interest –
Encore
(4,998)
4,998
-
Total Interest
(23,194)
4,998
(18,196)
Earnings Before Income Tax
(266)
4,998
4,731
Income tax
(1,173)
-
(1,173)
Net (loss) / profit before minority
interest
(1,440)
4,998
3,558
JCF / Mgmt non-controlling interest
(822)
-
(822)
Net (loss) / profit attributable to Encore
(618)
4,998
4,380 |
 PROPRIETARY
27
ENCORE’S LONG-TERM PROSPECTS CONTINUE TO
BE FAVORABLE
Operating Results
& Deployment
A culture of constant
improvement drives
improved results
Liquidity &
Capital Access
Strong liquidity and
access to capital enhance
our ability to
take advantage
of consolidating markets
and new opportunities
Solid Cash Flows
Additional asset classes
and geographies continue
to enhance ERC and
collections
Geographic &
Asset Class
Diversification
We are an international
company in several asset
classes, positioned for
strong earnings growth
going forward |
 28
Appendix |
 PROPRIETARY
29
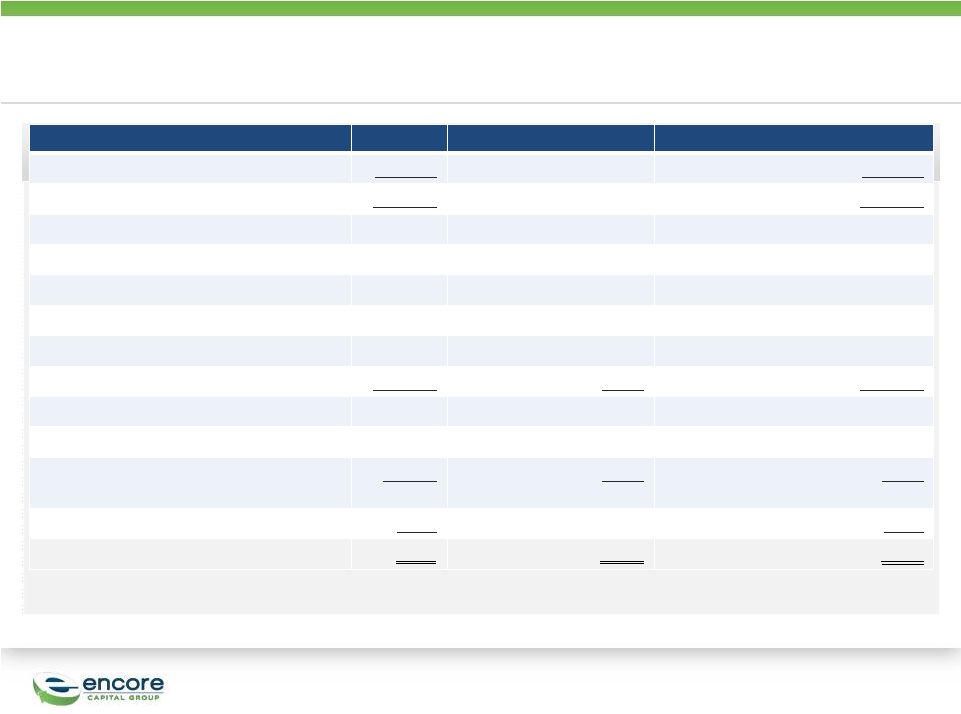
NON-GAAP FINANCIAL MEASURES
This presentation includes certain financial measures that exclude the impact of
certain items and therefore have not been calculated in accordance with U.S.
generally accepted accounting principles (“GAAP”). The Company has
included information concerning Adjusted EBITDA because management utilizes this
information, which is materially similar to a financial measure contained in
covenants used in the Company's revolving credit facility, in the evaluation
of its operations and believes that this measure is a useful indicator of
the Company’s ability to generate cash collections in excess of operating expenses
through the liquidation of its receivable portfolios. The Company has included
information concerning Adjusted Operating Expenses in order to facilitate a
comparison of approximate cash costs to cash collections for the portfolio
purchasing and recovery business in the periods presented. The Company has
included Adjusted Income from Continuing Operations per Share because management
believes that investors regularly rely on this measure to assess operating
performance, in order highlight trends in the Company’s business that
may not otherwise be apparent when relying on financial measures calculated in
accordance with GAAP. Adjusted EBITDA, Adjusted Operating Expenses and
Adjusted Income from Continuing Operations per Share have not been prepared
in accordance with GAAP. These non-GAAP financial measures should not be
considered as alternatives to, or more meaningful than, net income and total
operating expenses as indicators of the Company’s operating performance. Further, these non-GAAP
financial measures, as presented by the Company, may not be comparable to similarly
titled measures reported by other companies. The Company has attached to
this presentation a reconciliation of these non- GAAP financial measures
to their most directly comparable GAAP financial measures. |
 PROPRIETARY
September
30,
2013
2012
$
Per Diluted
Share –
Accounting
Per Diluted
Share –
Economic
$
Per Diluted
Share –
Accounting
Per Diluted
Share –
Economic
Net income from continuing operations
attributable to Encore
22,194
$0.82
0.84
21,308
$0.82
$0.82
Adjustments:
Net non-cash interest and issuance cost
amortization, net of tax
1,103
$0.04
0.04
-
-
-
Acquisition related legal and advisory fees,
net of tax
4,775
$0.18
0.18
-
-
-
Acquisition related integration and consulting
fees, net of tax
-
-
-
-
-
-
Effect
of
tax
credits
applicable
to
prior
periods
(1,236)
(0.05)
(0.05)
-
-
-
Adjusted net income from continuing
operations attributable to Encore
26,836
$0.99
$1.02
$21,308
$0.82
0.82
30
RECONCILIATION OF ADJUSTED EPS
Reconciliation of Adjusted EPS to GAAP EPS
(Unaudited, in thousands, except per share amounts), Three Months Ended
|
 PROPRIETARY
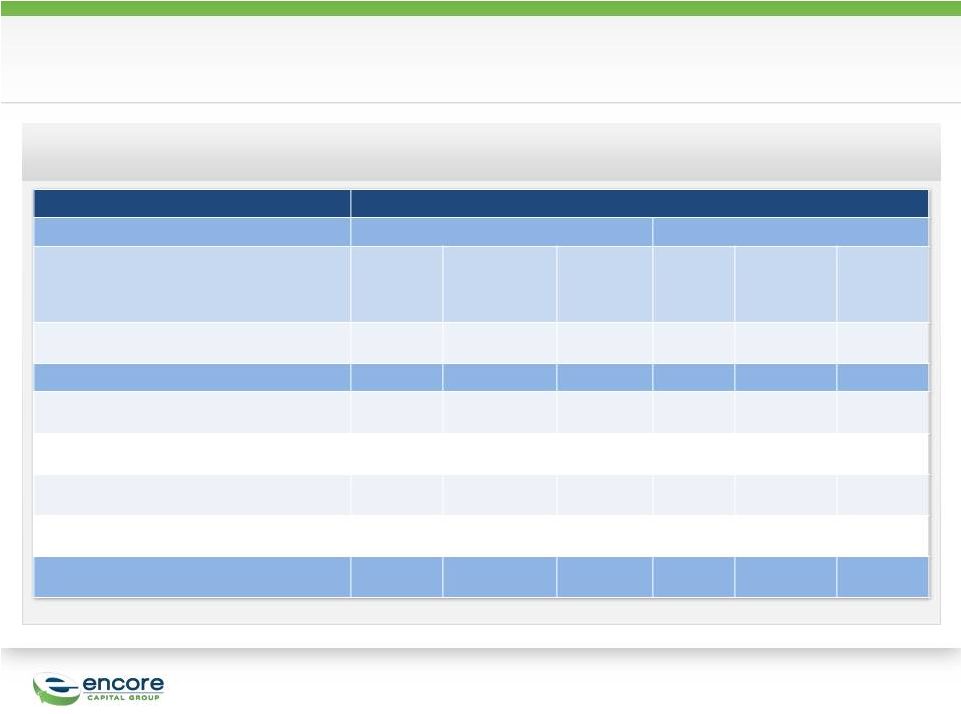
31
RECONCILIATION OF ADJUSTED EPS
Reconciliation of Adjusted EPS to GAAP EPS
(Unaudited, in thousands, except per share amounts), Nine Months
Ended
September 30,
2013
2012
$
Per Diluted
Share –
Accounting
Per Diluted
Share –
Economic
$
Per Diluted
Share –
Accounting
Per Diluted
Share –
Economic
Net income from continuing operations
attributable to Encore
52,654
$2.06
2.08
58,404
$2.25
$2.25
Adjustments:
Net non-cash interest and issuance cost
amortization, net of tax
2,103
0.08
0.08
-
-
-
Acquisition related legal and advisory fees,
net of tax
9,756
0.38
0.39
2,567
0.10
0.10
Acquisition related integration and consulting
fees, net of tax
5,502
0.22
0.22
-
-
-
Effect of tax credits applicable to prior periods
(712)
(0.03)
(0.03)
-
-
-
Adjusted net income from continuing
operations attributable to Encore
69,303
$2.71
$2.74
$60,971
$2.35
$2.35 |
 PROPRIETARY
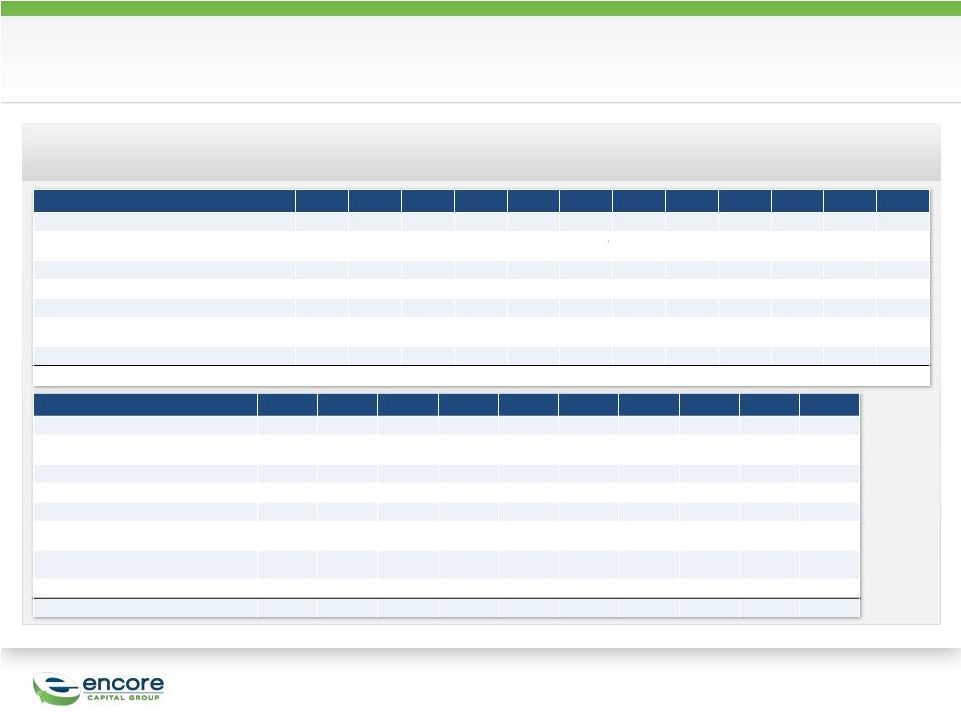
Note:
The
periods
6/30/08
through
12/31/08
have
been
adjusted
to
reflect
the
retrospective
application
of
ASC
470-20.
All
periods
have
been
adjusted
to
show
discontinued
ACG
operations.
6/30/08
9/30/08
12/31/08
3/31/09
6/30/09
9/30/09
12/31/09
3/31/10
6/30/10
9/30/10
12/31/10
3/31/11
GAAP net income, as
reported
6,162
3,028
(2,095)
8,997
6,641
9,004
8,405
10,861
11,730
12,290
14,171
13,679
(Gain) loss from discontinued operations, net of
tax
(89)
46
(483)
(457)
(365)
(410)
(901)
(687)
(684)
(315)
28
(397)
Interest expense
4,831
5,140
5,401
4,273
3,958
3,970
3,959
4,538
4,880
4,928
5,003
5,593
Provision for income taxes
4,161
2,429
(1,781)
5,670
3,936
5,676
4,078
6,080
6,356
6,474
9,057
8,349
Depreciation and amortization
482
396
391
410
402
443
516
522
591
650
789
904
Amount applied to principal on receivable
portfolios
35,785
35,140
46,364
42,851
48,851
49,188
47,384
58,265
64,901
63,507
53,427
85,709
Stock-based compensation
expense
1,288
860
382
1,080
994
1,261
1,049
1,761
1,446
1,549
1,254
1,765
Adjusted EBITDA
52,560
47,039
48,179
62,824
63,869
69,132
64,490
81,340
89,220
89,083
83,729
115,602
6/30/11
9/30/11
12/31/11
3/31/12
6/30/12
9/30/12
12/31/12
3/31/13
6/30/13
9/30/13
GAAP net income, as
reported
14,775
15,310
17,134
11,406
16,598
21,308
20,167
19,448
11,012
21,064
(Gain) loss from discontinued operations,
net of tax
(9)
(60)
101
6,702
2,392
-
-
-
-
308
Interest expense
5,369
5,175
4,979
5,515
6,497
7,012
6,540
6,854
7,482
29,186
Provision for income taxes
9,475
9,834
10,418
11,660
12,846
13,887
13,361
12,571
7,267
10,272
Depreciation and amortization
958
1,054
1,165
1,240
1,420
1,533
1,647
1,846
2,158
4,523
Amount applied to principal on receivable
portfolios
83,939
73,187
69,462
104,603
101,813
105,283
90,895
129,487
131,044
157,262
Severance and Stock-based
compensation
expense
1,810
2,405
1,729
2,266
2,539
1,905
2,084
3,001
5,455
3,983
Acquisition related expense
-
-
-
489
3,774
-
-
1,276
12,757
7,752
Adjusted EBITDA
116,317
106,905
104,988
143,881
147,877
150,928
134,694
174,483
177,175
234,350
Reconciliation of Adjusted EBITDA to GAAP Net Income
(Unaudited, In Thousands) Three Months Ended
32
RECONCILIATION OF ADJUSTED EBITDA |
 PROPRIETARY
Reconciliation of Adjusted EBITDA to GAAP net income
(Unaudited, In Thousands) Three Months Ended
33
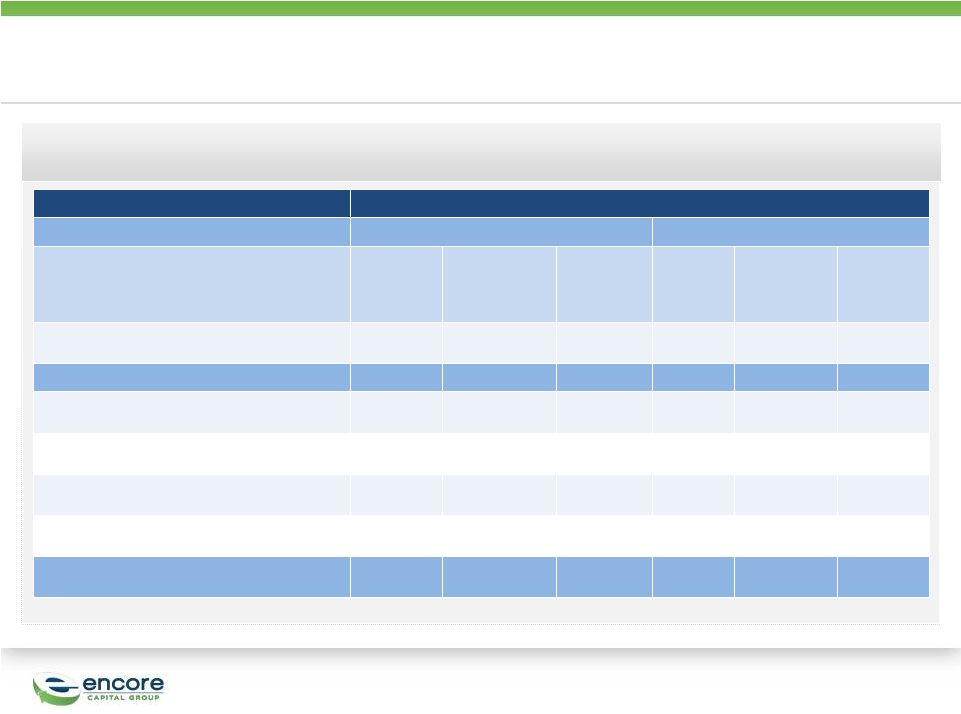
RECONCILIATION
OF
ADJUSTED
EBITDA
-
CABOT
September 30, 2013
GAAP net income attributable to Encore Europe Holdings s.a.r.l.
4,380
Loss from noncontrolling interest
(822)
GAAP net income
3,558
Adjustments:
Interest expense
18,196
Provision for income taxes
1,174
Depreciation and amortization
1,461
Amount applied to principal on receivable portfolios
26,235
Adjusted EBITDA
50,624 |
 PROPRIETARY
Reconciliation of Adjusted Operating Cost to GAAP Operating Cost
(Unaudited, In Thousands) Three Months Ended
34
RECONCILIATION OF ADJUSTED OPERATING COST
9/30/11
12/31/11
3/31/12
6/30/12
9/30/12
12/31/12
3/31/13
6/30/13
9/30/13
GAAP total operating expenses,
as reported
89,804
97,048
91,394
102,809
103,621
103,872
105,872
126,238
174,429
Adjustments:
Stock-based compensation expense
(2,405)
(1,729)
(2,266)
(2,539)
(1,905)
(2,084)
(3,001)
(2,179)
(3,983)
Operating expense related to other
operating segments
(4,622)
(13,409)
-
(1,513)
(2,055)
(2,113)
(3,022)
(3,504)
(8,008)
Acquisition related integration and
consulting fees and severance costs
-
-
-
-
-
-
-
(5,455)
-
Acquisition related legal and
advisory fees
-
-
(489)
(3,774)
-
-
(1,276)
(6,948)
(7,752)
Adjusted operating expenses for the
portfolio purchasing and recovery
business
82,777
81,910
88,639
94,983
99,661
99,675
98,573
108,152
154,686 |
 PROPRIETARY
Reconciliation of Adjusted Operating Cost to GAAP Operating Cost
(Unaudited, In Thousands) Three Months Ended
35
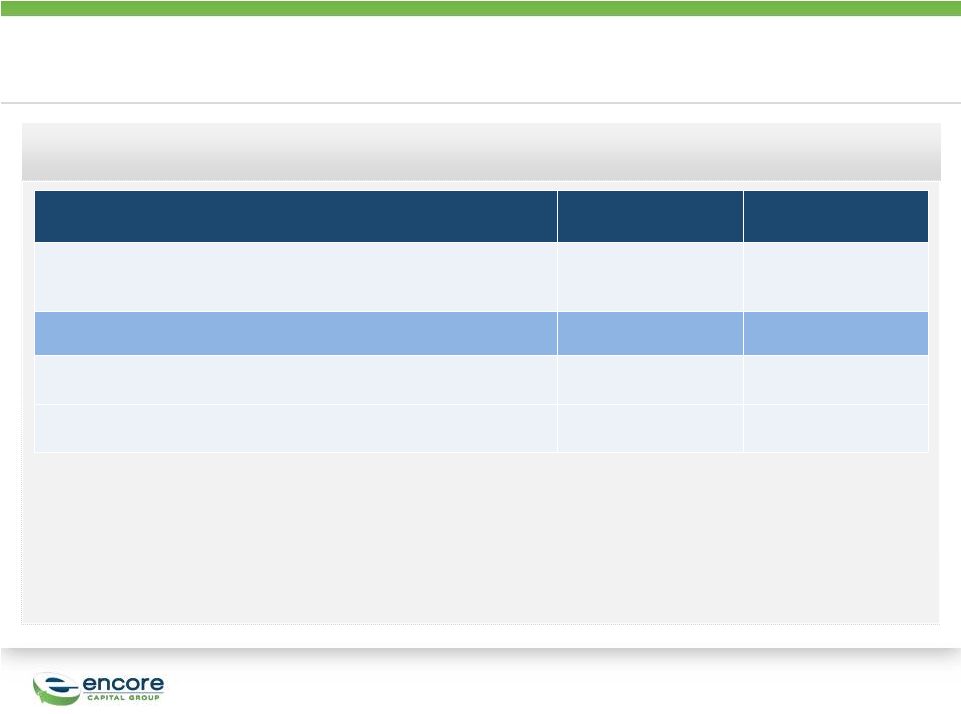
RECONCILIATION OF ADJUSTED OPERATING COST -
CABOT
September 30, 2012
September 30, 2013
GAAP total operating expenses, as reported
$17,735
$23,640
Adjustments:
Operating expense related to other operating segments
(4,301)
(5,280)
Adjusted operating expenses for the portfolio purchasing and recovery
business
$13,434
$18,360 |
 Encore Capital Group, Inc.
Q3 2013 EARNINGS CALL |