Attached files
| file | filename |
|---|---|
| 8-K - 8-K - ROSETTA STONE INC | a13-23662_18k.htm |
| EX-99.1 - EX-99.1 - ROSETTA STONE INC | a13-23662_1ex99d1.htm |
Exhibit 99.2
|
|
Third Quarter 2013 Results November 6, 2013 |
|
|
Certain information contained in this presentation and certain comments today constitute forward-looking statements for purposes of the safe harbor provisions of The Private Securities Litigation Reform Act of 1995. These forward-looking statements reflect the Company's current views with respect to future events and are subject to certain risks, uncertainties, and assumptions. A number of important factors could cause actual results or events to differ materially from those indicated by such forward-looking statements, including demand for our language learning solutions; the advantages of our products, services, technology, brand and business model as compared to others; our strategic focus; our ability to maintain effective internal controls or to remediate material weaknesses; our cash needs and expectations regarding cash flow from operations; our product development plans; the appeal and efficacy of our products and services; our expectations regarding capturing lifetime value and a broader range of market segments through such offerings; our plans regarding expansion of our marketing initiatives and sales force; our international operations and growth plans; our plans regarding our kiosks and retail relationships; our plans regarding our Enterprise and Education business; the impact of any revisions to our pricing strategy; our ability to manage and grow our business and execute our business strategy; our financial performance; our actions to realign our cost structure and revitalizing our go-to-market strategy; our plans to transition our distribution to more online in the consumer business; our mergers and acquisitions plans; our plans with respect to Lexia and Livemocha; our ability to successfully integrate Lexia and Livemocha into our business; adverse trends in general economic conditions and the other factors including the “Risk Factors” more fully described in the Company's filings with the U.S. Securities and Exchange Commission (SEC), including the Company’s annual report on Form 10-K for the year period ended December 31, 2012, which is on file with the SEC. We encourage you to review those factors before making any investment decision. You should not place undue reliance on forward-looking statements because they involve factors that are, in some cases, beyond our control and that could materially affect actual results, levels of activity, performance, or achievements. Today’s presentation and discussion also contains references to non-GAAP financial measures. The full definition and reconciliation of those measures is available in our Form 8-K filed with the SEC on November 6, 2013. Management uses these non-GAAP measures to compare the Company's performance to that of prior periods for trend analyses, for purposes of determining executive incentive compensation, and for budgeting and planning purposes. Management believes that the use of these non-GAAP financial measures provides an additional tool for investors to use in evaluating ongoing operating results and trends. Our definitions of non-GAAP measures may not be comparable to the definitions used by other companies, and we encourage you to review and understand all our financial reporting before making any investment decision. Safe Harbor 2 |
|
|
Steve Swad President & Chief Executive Officer 3Q13 Review |
|
|
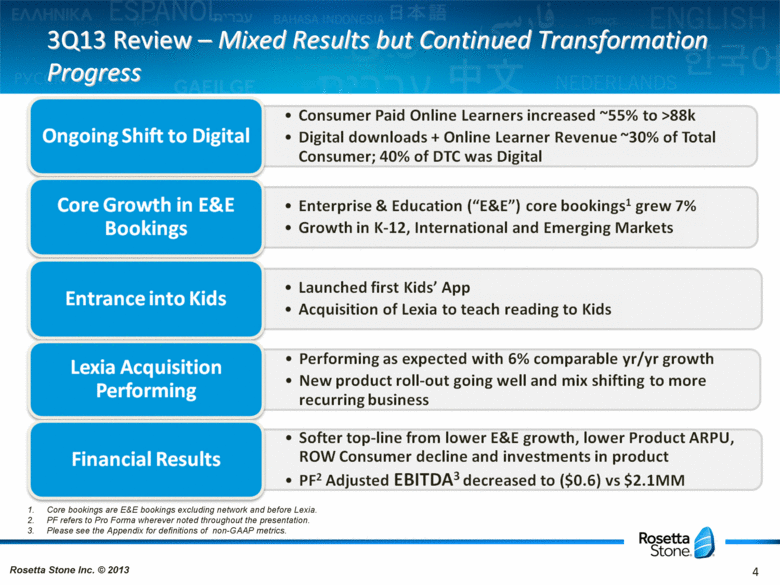
3Q13 Review – Mixed Results but Continued Transformation Progress Rosetta Stone Inc. © 2013 4 Core bookings are E&E bookings excluding network and before Lexia. PF refers to Pro Forma wherever noted throughout the presentation. Please see the Appendix for definitions of non-GAAP metrics. |
|
|
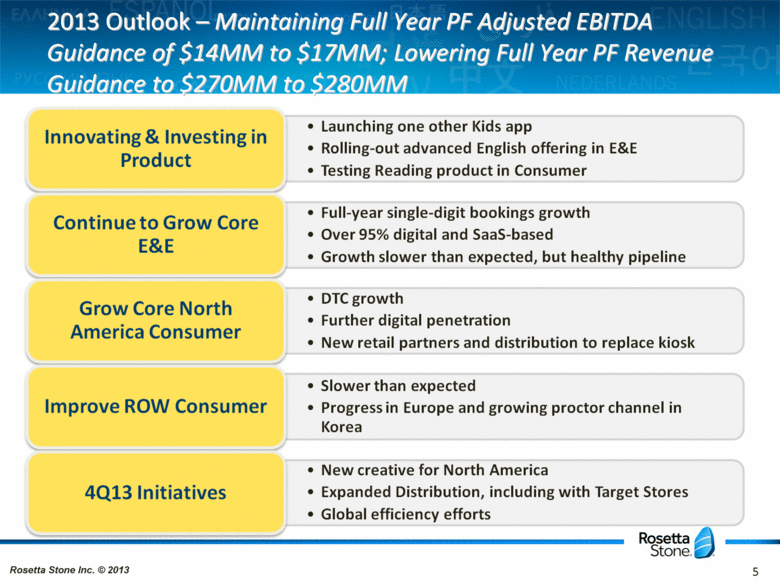
2013 Outlook – Maintaining Full Year PF Adjusted EBITDA Guidance of $14MM to $17MM; Lowering Full Year PF Revenue Guidance to $270MM to $280MM Rosetta Stone Inc. © 2013 5 |
|
|
3Q13 Financial Review 6 |
|
|
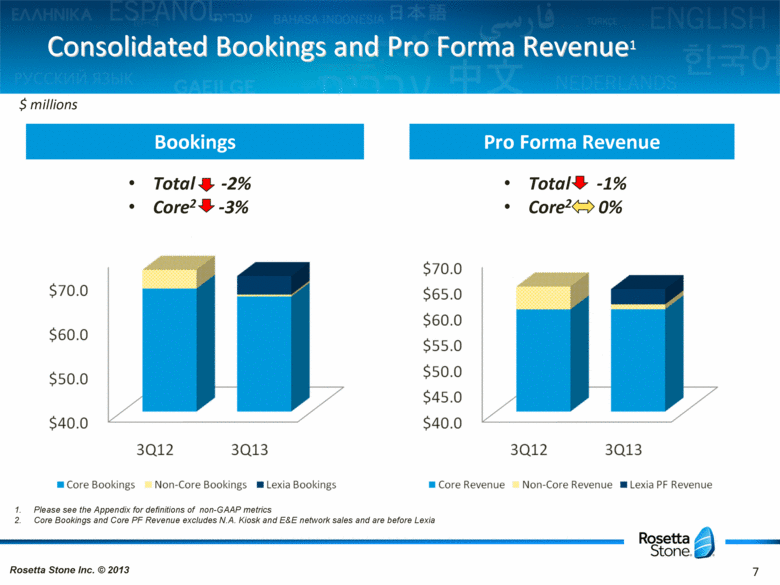
Total -1% Core2 0% Consolidated Bookings and Pro Forma Revenue1 Bookings Pro Forma Revenue Please see the Appendix for definitions of non-GAAP metrics Core Bookings and Core PF Revenue excludes N.A. Kiosk and E&E network sales and are before Lexia $ millions Rosetta Stone Inc. © 2013 7 Total -2% Core2 -3% |
|
|
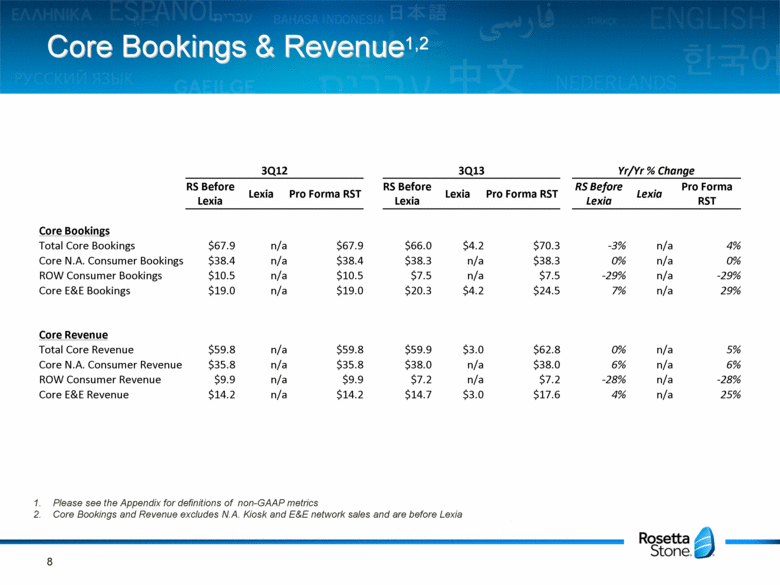
Core Bookings & Revenue1,2 8 3Q12 3Q13 Yr/Yr % Change RS Before Lexia Lexia Pro Forma RST RS Before Lexia Lexia Pro Forma RST RS Before Lexia Lexia Pro Forma RST Core Bookings Total Core Bookings $67.9 n/a $67.9 $66.0 $4.2 $70.3 -3% n/a 4% Core N.A. Consumer Bookings $38.4 n/a $38.4 $38.3 n/a $38.3 0% n/a 0% ROW Consumer Bookings $10.5 n/a $10.5 $7.5 n/a $7.5 -29% n/a -29% Core E&E Bookings $19.0 n/a $19.0 $20.3 $4.2 $24.5 7% n/a 29% Core Revenue Total Core Revenue $59.8 n/a $59.8 $59.9 $3.0 $62.8 0% n/a 5% Core N.A. Consumer Revenue $35.8 n/a $35.8 $38.0 n/a $38.0 6% n/a 6% ROW Consumer Revenue $9.9 n/a $9.9 $7.2 n/a $7.2 -28% n/a -28% Core E&E Revenue $14.2 n/a $14.2 $14.7 $3.0 $17.6 4% n/a 25% Please see the Appendix for definitions of non-GAAP metrics Core Bookings and Revenue excludes N.A. Kiosk and E&E network sales and are before Lexia |
|
|
Bookings1 by Segment $ millions North America Consumer Total -3% Core2 0% Total 27% Core3 7% Rest of World Consumer Enterprise & Education Total -29% Rosetta Stone Inc. © 2013 9 Please see the Appendix for definitions of non-GAAP metrics Core Bookings are North American Consumer excluding Kiosk bookings Core Bookings are E&E bookings excluding network bookings and before Lexia |
|
|
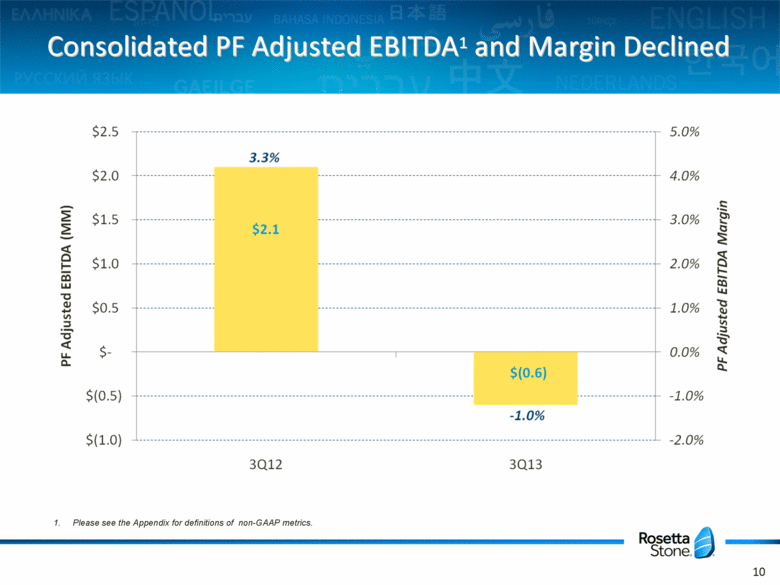
Consolidated PF Adjusted EBITDA1 and Margin Declined 10 Please see the Appendix for definitions of non-GAAP metrics. |
|
|
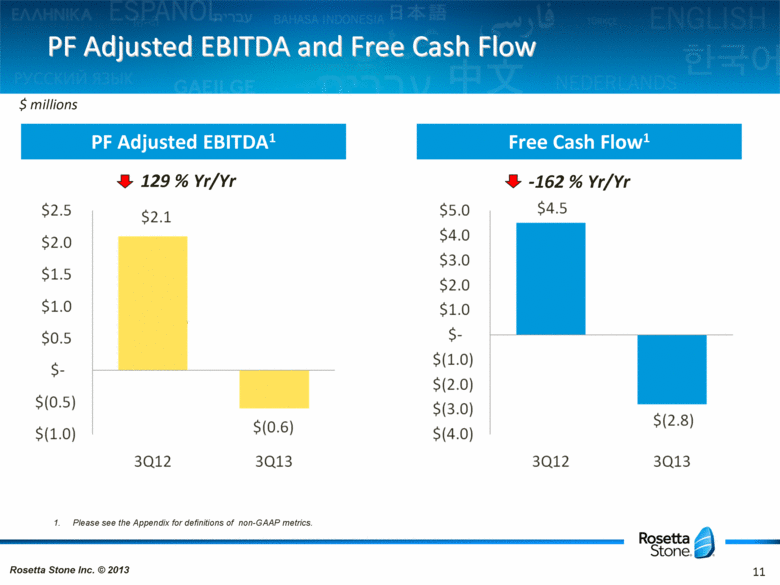
PF Adjusted EBITDA and Free Cash Flow PF Adjusted EBITDA1 Free Cash Flow1 $ millions Rosetta Stone Inc. © 2013 11 129 % Yr/Yr -162 % Yr/Yr Please see the Appendix for definitions of non-GAAP metrics. |
|
|
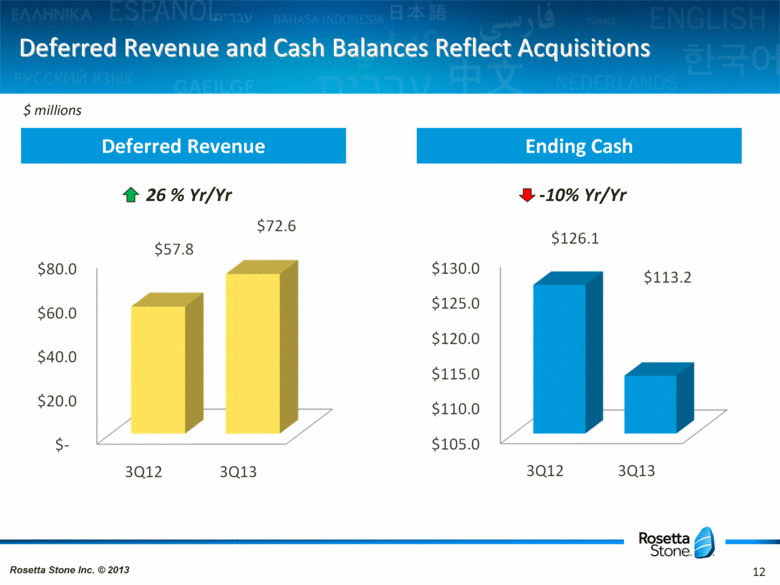
Deferred Revenue and Cash Balances Reflect Acquisitions $ millions Deferred Revenue Ending Cash 26 % Yr/Yr -10% Yr/Yr Rosetta Stone Inc. © 2013 12 |
|
|
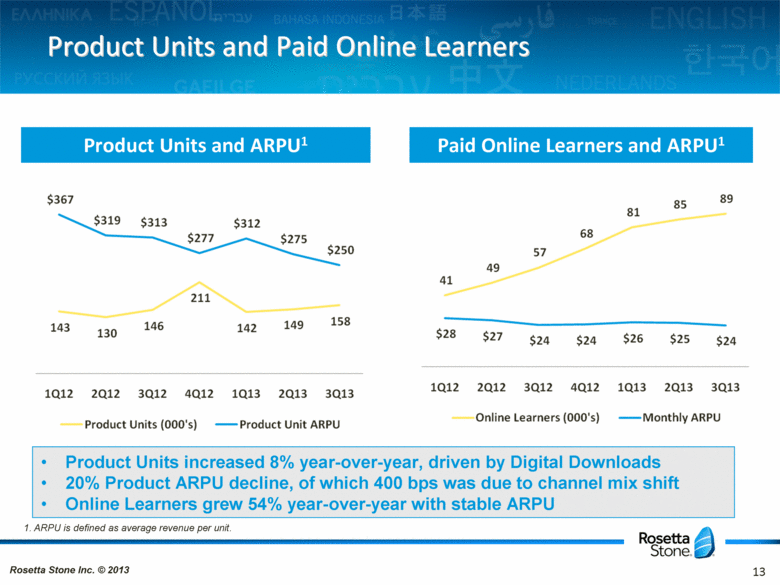
Product Units and Paid Online Learners Product Units and ARPU1 Paid Online Learners and ARPU1 Rosetta Stone Inc. © 2013 ARPU is defined as average revenue per unit. 13 Product Units increased 8% year-over-year, driven by Digital Downloads 20% Product ARPU decline, of which 400 bps was due to channel mix shift Online Learners grew 54% year-over-year with stable ARPU |
|
|
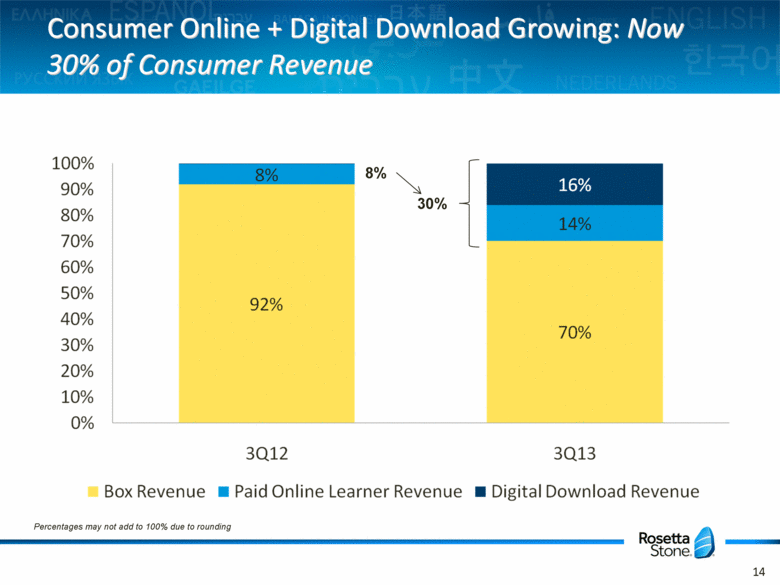
Consumer Online + Digital Download Growing: Now 30% of Consumer Revenue Percentages may not add to 100% due to rounding 14 8% 30% |
|
|
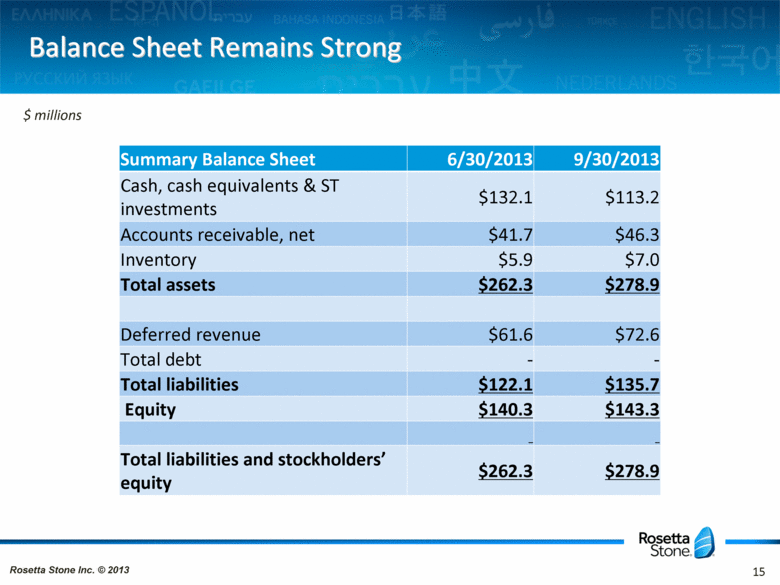
Summary Balance Sheet 6/30/2013 9/30/2013 Cash, cash equivalents & ST investments $132.1 $113.2 Accounts receivable, net $41.7 $46.3 Inventory $5.9 $7.0 Total assets $262.3 $278.9 Deferred revenue $61.6 $72.6 Total debt - - Total liabilities $122.1 $135.7 Equity $140.3 $143.3 Total liabilities and stockholders’ equity $262.3 $278.9 $ millions Balance Sheet Remains Strong Rosetta Stone Inc. © 2013 15 |
|
|
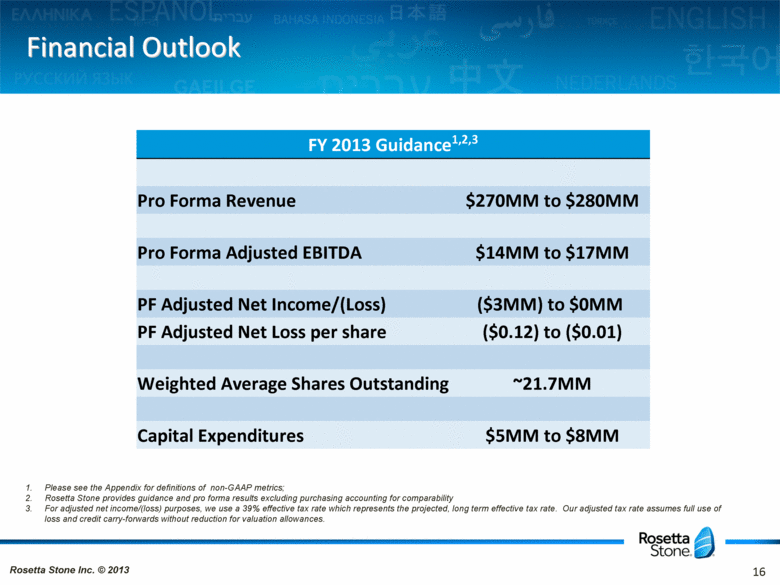
Financial Outlook Please see the Appendix for definitions of non-GAAP metrics; Rosetta Stone provides guidance and pro forma results excluding purchasing accounting for comparability For adjusted net income/(loss) purposes, we use a 39% effective tax rate which represents the projected, long term effective tax rate. Our adjusted tax rate assumes full use of loss and credit carry-forwards without reduction for valuation allowances. 16 FY 2013 Guidance1,2,3 Pro Forma Revenue $270MM to $280MM Pro Forma Adjusted EBITDA $14MM to $17MM PF Adjusted Net Income/(Loss) ($3MM) to $0MM PF Adjusted Net Loss per share ($0.12) to ($0.01) Weighted Average Shares Outstanding ~21.7MM Capital Expenditures $5MM to $8MM |
|
|
Appendix |
|
|
Non-GAAP Metric Definitions Adjusted EBITDA is GAAP net income or loss plus interest income and expense, income tax benefit and expense, depreciation, amortization and stock-based compensation expenses. Adjusted EBITDA excludes any items related to the litigation with Google Inc., restructuring costs and transaction and other costs associated with mergers and acquisitions. Adjusted net income/(loss) and adjusted net income/(loss) per share exclude the impact of items related to its litigation with Google Inc., restructuring costs and transaction and other costs associated with mergers and acquisitions as well as all adjustments related to recording the non-cash tax valuation allowance for deferred tax assets. Free cash flow is cash flow from operations less cash used in purchases of property and equipment. Bookings represent executed sales contracts received by the Company that are either recorded immediately as revenue or as deferred revenue. Pro Forma Revenue is GAAP revenue plus the purchase accounting impact on acquired deferred revenue. Pro Forma Adjusted EBITDA is Adjusted EBITDA (as defined above) plus the purchase accounting impact on acquired deferred revenue less the purchase accounting impact on acquired deferred commissions. Pro Forma Adjusted Net Income/(Loss) and Pro Forma Adjusted EPS are Adjusted Net Income/(Loss) and Adjusted Net Income/(Loss) per Share (as defined above) plus the purchase accounting impact on acquired deferred revenue less the purchase accounting impact on acquired deferred commissions. 18 |

