Attached files
| file | filename |
|---|---|
| 8-K - FORM 8-K - REDWOOD TRUST INC | d621509d8k.htm |
| EX-99.1 - EX-99.1 - REDWOOD TRUST INC | d621509dex991.htm |
Exhibit 99.2

|
|
||
|
TABLE OF CONTENTS
|

| Introduction |
4 | |||
| Shareholder Letter |
5 | |||
| Quarterly Overview |
8 | |||
| Financial Insights |
15 | |||
| u Balance Sheet |
15 | |||
| u GAAP Income |
22 | |||
| u Taxable Income and Dividends |
26 | |||
| Residential Investments |
28 | |||
| Residential Mortgage Banking Activities |
30 | |||
| Commercial Investments and Mortgage Banking Activities |
31 | |||
| Appendix |
35 | |||
| Redwood’s Business Strategy |
36 | |||
| Glossary |
39 | |||
| Financial Tables |
47 | |||
| THE REDWOOD REVIEW | 3RD QUARTER 2013 | 1 |
|
| ||
|
CAUTIONARY STATEMENT
|
This Redwood Review contains forward-looking statements within the meaning of the safe harbor provisions of the Private Securities Litigation Reform Act of 1995. Forward-looking statements involve numerous risks and uncertainties. Our actual results may differ from our expectations, estimates, and projections and, consequently, you should not rely on these forward-looking statements as predictions of future events. Forward-looking statements are not historical in nature and can be identified by words such as “anticipate,” “estimate,” “will,” “should,” “expect,” “believe,” “intend,” “seek,” “plan,” and similar expressions or their negative forms, or by references to strategy, plans, or intentions. These forward-looking statements are subject to risks and uncertainties, including, among other things, those described in our most recent Annual Report on Form 10-K under the caption “Risk Factors.” Other risks, uncertainties, and factors that could cause actual results to differ materially from those projected are described below and may be described from time to time in reports we file with the Securities and Exchange Commission, including reports on Forms 10-K, 10-Q, and 8-K. We undertake no obligation to update or revise forward-looking statements, whether as a result of new information, future events, or otherwise.
Statements regarding the following subjects, among others, are forward-looking by their nature: (i) statements we make regarding Redwood’s future business strategy and strategic focus, including statements relating to our confidence in our overall market position, strategy and long-term prospects, and our belief in the long-term efficiency and necessity of private label securitization as a form of U.S. mortgage financing; (ii) our expectations regarding movements in interest rates and their effect on the pace of refinance activity, including that we believe we have already seen the cyclical (and maybe even generational) lows in mortgage rates and that we expect a subdued level of refinance activity for an extended period of time, subject to periods of potential volatility as the Federal Reserve continues evaluating the winding down of its bond buying program; (iii) statements we make regarding other near-term challenges that we face, including price competition from banks for jumbo mortgages and the pace of activity in the securitization market; (iv) statements we make regarding growth opportunities for our residential business, including that we have the ability to grow organically by adding loan sellers and products to our residential platform, the expanding opportunities that we expect to see as a result of entering the conforming loan market and our positioning to be involved in risk-sharing opportunities at the originator level, to the extent those opportunities arise in the future; (v) statements we make regarding GSE reform legislation, including that the current direction of GSE reform legislation favors private capital credit providers with loan platforms, such as us, and statements we make regarding the potential size of the market opportunity that could emerge from these GSE reform efforts; (vi) statements we make regarding new loan product opportunities, including that we are exploring the acquisition and distribution (maybe through securitization) of mortgages that do not meet the technical definition of a “Qualified Mortgage” (QM) under the new Consumer Financial Protection Bureau (CFPB) rules that go into effect in early January 2014, and our expectation that this market segment will be underserved by lenders, as well as our cautionary statement not to expect any non-QM loan transactions in the near term; (vii) our assumptions and expectations related to a stabilizing interest rate environment, the reaction of investors in triple-A rated RMBS to securities backed by more recently originated, higher coupon mortgages, and the pace of RMBS issuance; (viii) our expectations regarding our loan sale distribution via whole loan sales and securitizations, our expectation to complete at least one securitization during the fourth quarter of 2013 and our outlook for residential loan sale profit margins, including our statement that we believe we can earn on average 25 to 50 basis points in loan sale profit margins, net of our hedges; (ix) our outlook and expectations relating to our commercial real estate
| 2 | THE REDWOOD REVIEW | 3RD QUARTER 2013 |
|
|
||
|
CAUTIONARY STATEMENT
|
platform, including statements regarding our expectations related to the total volume of senior commercial loans that we will originate in 2013, our expected loan sale margins and the expected timing of sales with respect to those loans, and the expected returns that our commercial mortgage banking activities will generate for shareholders in 2013; (x) statements relating to acquiring residential mortgage loans in the future that we have identified for purchase or plan to purchase, including the amount of such loans that we identified for purchase during the third quarter of 2013 and at September 30, 2013, and statements relating to the volume of residential mortgage loans expected to be available for purchase during the fourth quarter of 2013; (xi) statements relating to our estimate of our investment capacity (including that we estimate our investment capacity at September 30, 2013 to be approximately $150 million) and our statement that we believe this level of investment capacity and liquidity should be sufficient to fund our business and investment objectives for the remainder of 2013; (xii) statements relating to the amount of equity capital we are targeting to allocate to fund commercial investments, and statements relating to the possibility of funding growth in our commercial platform with dedicated capital; (xiii) statements relating to our competitive position and our ability to compete in the future; (xiv) statements relating to future market and economic conditions and the future volume of transactions in those markets, including, without limitation, future conditions in the residential and commercial real estate markets and related financing markets, and the related potential opportunities for our residential and commercial business activity; and (xv) statements regarding our expectations and estimates relating to the characterization for income tax purposes of our dividend distributions, our expectations and estimates relating to tax accounting, tax liabilities and tax savings, and GAAP tax provisions, our estimates of REIT taxable income and TRS taxable income, and our anticipation of additional credit losses for tax purposes in future periods (and, in particular, our statement that, for tax purposes, we expect an additional $69 million of tax credit losses on residential securities we currently own to be realized over an estimated three- to five-year period).
Important factors, among others, that may affect our actual results include: general economic trends, the performance of the housing, commercial real estate, mortgage, credit, and broader financial markets, and their effects on the prices of earning assets and the credit status of borrowers; federal and state legislative and regulatory developments, and the actions of governmental authorities, including those affecting the mortgage industry or our business; developments related to the fixed income and mortgage finance markets and the Federal Reserve’s statements regarding its future open market activity and monetary policy; our exposure to credit risk and the timing of credit losses within our portfolio; the concentration of the credit risks we are exposed to, including due to the structure of assets we hold and the geographical concentration of real estate underlying assets we own; our exposure to adjustable-rate and negative amortization mortgage loans; the efficacy and expense of our efforts to manage or hedge credit risk, interest rate risk, and other financial and operational risks; changes in credit ratings on assets we own and changes in the rating agencies’ credit rating methodologies; changes in interest rates; changes in mortgage prepayment rates; the availability of assets for purchase at attractive prices and our ability to reinvest cash we hold; changes in the values of assets we own; changes in liquidity in the market for real estate securities and loans; our ability to finance the acquisition of real estate-related assets with short-term debt; the ability of counterparties to satisfy their obligations to us; our involvement in securitization transactions, the profitability of those transactions, and the risks we are exposed to in engaging in securitization transactions; exposure to claims and litigation, including litigation arising from our involvement in securitization transactions; whether we have sufficient liquid assets to meet short-term needs; our ability to successfully compete and retain or attract key personnel; our ability to adapt our business model and strategies to changing circumstances; changes in our investment, financing, and hedging strategies and new risks we may be exposed to if we expand our business activities; exposure to environmental liabilities and the effects of global climate change; failure to comply with applicable laws and regulations; our failure to maintain appropriate internal controls over financial reporting and disclosure controls and procedures; the impact on our reputation that could result from our actions or omissions or from those of others; changes in accounting principles and tax rules; our ability to maintain our status as a REIT for tax purposes; limitations imposed on our business due to our REIT status and our status as exempt from registration under the Investment Company Act of 1940; decisions about raising, managing, and distributing capital; and other factors not presently identified.
This Redwood Review may contain statistics and other data that in some cases have been obtained from or compiled from information made available by servicers and other third-party service providers.
| THE REDWOOD REVIEW | 3RD QUARTER 2013 | 3 |
|
| ||
|
INTRODUCTION
|
Note to Readers:
We file annual reports (on Form 10-K) and quarterly reports (on Form 10-Q) with the Securities and Exchange Commission. These filings and our earnings press releases provide information about Redwood and our financial results in accordance with generally accepted accounting principles (GAAP). We urge you to review these documents, which are available through our website, www.redwoodtrust.com.
This document, called The Redwood Review, is an additional format for providing information about Redwood through a discussion of our GAAP financial results, as well as other metrics, such as taxable income. Supplemental information is also provided in the Financial Tables in this Review to facilitate more detailed understanding and analysis of Redwood. We may also provide non-GAAP financial measures in this Review. When we use non-GAAP financial measures it is because we believe that these figures provide additional insight into Redwood’s business. In each case in which we discuss a non-GAAP financial measure you will find an explanation of how it has been calculated, why we think the figure is important, and a reconciliation between the GAAP and non-GAAP figures.
References herein to “Redwood,” the “company,” “we,” “us,” and “our” include Redwood Trust, Inc. and its consolidated subsidiaries. References to “at Redwood” exclude all consolidated securitization entities (with the exception of the residential resecuritization we completed in the third quarter of 2011 and the commercial securitization we completed in the fourth quarter of 2012) in order to present our operations in the way management analyzes them. Note that because we round numbers in the tables to millions, except per share amounts, some numbers may not foot due to rounding. References to the “third quarter” refer to the quarter ending September 30, 2013, and references to the “second quarter” refer to the quarter ending June 30, 2013, unless otherwise specified.
We hope you find this Review helpful to your understanding of our business. We thank you for your input and suggestions, which have resulted in our changing the form and content of The Redwood Review over time.
|
Selected Financial Highlights
| ||||||||||
| Quarter: Year | GAAP Income (Loss) per Share |
REIT Taxable Income per Share(1) |
Annualized GAAP Return on Equity |
GAAP Book Value per Share |
Dividends per Share | |||||
| Q311 | $0.01 | $0.09 | 1% | $12.22 | $0.25 | |||||
| Q411 | ($0.03) | $0.04 | (1%) | $11.36 | $0.25 | |||||
| Q112 | $0.37 | $0.13 | 13% | $12.22 | $0.25 | |||||
| Q212 | $0.24 | $0.22 | 8% | $12.00 | $0.25 | |||||
| Q312 | $0.48 | $0.19 | 16% | $12.88 | $0.25 | |||||
| Q412 | $0.50 | $0.21 | 15% | $13.95 | $0.25 | |||||
| Q113 | $0.69 | $0.20 | 21% | $14.54 | $0.28 | |||||
| Q213 | $0.71 | $0.25 | 22% | $14.69 | $0.28 | |||||
| Q313 | $0.25 | $0.24 | 7% | $14.65 | $0.28 | |||||
| (1) REIT taxable income per share for 2013 are estimates until we file tax returns. | ||||||||||||
| 4 | THE REDWOOD REVIEW | 3RD QUARTER 2013 |
|
|
||
|
SHAREHOLDER LETTER
|
Dear Fellow Shareholders:
Over the past six months, we have profitably steered through a tumultuous time in the residential mortgage market, as participants throughout the mortgage chain at first recoiled and then began adjusting to a steep increase in mortgage rates. During these volatile six months, our book value increased to $14.65 per share at September 30, 2013 from $14.54 per share at March 31, 2013, while paying $0.56 per share in dividends, reflecting the strength of our portfolio management and mortgage pipeline hedging strategies.
As we look ahead, we believe our residential business has significant growth opportunities. We do face near-term challenges – slowing refinance activity, aggressive price competition from banks for jumbo mortgages, and a slowdown in the securitization market that will likely continue to impact our financial results for the remainder of 2013 and into early 2014. We remain bullish, however, on our overall market position, strategy, and long-term prospects. We have the ability to grow organically by adding loan sellers and products to our well-established residential platform. Furthermore, the current direction of Government-Sponsored Enterprise (GSE) reform legislation favors private capital credit providers with loan platforms, such as Redwood. The potential market opportunity that could emerge from these GSE reform efforts is many times the size of the opportunity in our traditional jumbo business.
So let’s review these opportunities and challenges.
Plain and simple, the mortgage business is cyclical. The primary driver of this cyclicality is movements in mortgage interest rates, which in turn drives refinance activity. We believe we have already seen the cyclical (and maybe even generational) lows in mortgage rates and we expect a subdued level of refinance activity for an extended period of time. That said, there might be some modest pickup in refinance activity here and there as the Federal Reserve’s bond buying “taper movie” plays out.
We have re-directed some of our resources from jumbo loan acquisition toward our new Fannie Mae and Freddie Mac (Agency) initiative and other potential new loan product opportunities. One big cost advantage of our loan acquisition model is that our loan sellers absorb the cost of brick and mortar branches, loan officers and other direct origination overhead, not Redwood. Avoiding this cost burden helps reduce the impact on us when cyclical slowdowns occur.
Our goal in building a residential loan platform was to have a proprietary source of fee income and to create attractive portfolio investments. We consciously built the platform to have the flexibility and operating leverage to handle multiple sellers, loan products, and sources of distribution. What we do is hard to replicate. One of the ways we bring value is through the combination and complexity of the tactical elements necessary to execute our strategy. These elements include the Redwood brand, a team with tenured mortgage banking and capital markets experience, the right systems, deep relationships with investors, lenders and Wall Street, and a strong balance sheet.
Over the past year, we have worked diligently to add scalability to our Denver support operations and systems, to ready ourselves to add Agency loans to our product menu. We also put considerable effort into expanding our direct whole loan distribution capabilities to supplement our securitization distribution. This effort paid off handsomely when the securitization market recently slowed.
We began acquiring Agency residential loans in mid-October 2013, a meaningful development in the evolution of our residential platform. Entering the market for Agency loans also enables us to create our own investments in mortgage servicing rights and positions us to be involved in risk-sharing opportunities at the originator level to the extent those opportunities arise in the future, consistent with the concept envisioned by the Federal Housing Finance Agency.
| THE REDWOOD REVIEW | 3RD QUARTER 2013 | 5 |
|
| ||
|
SHAREHOLDER LETTER
|
Another product idea we are exploring is to acquire and distribute (maybe through securitization) safe, well-underwritten mortgages made to good borrowers that do not meet the technical definition of a “Qualified Mortgage” (QM) under the new Consumer Financial Protection Bureau rules that go into effect in early January 2014. We expect this market segment to be underserved by lenders. We would caution not to expect any non-QM loan transactions in the near term, as various participants in the mortgage chain (lenders, rating agencies, and senior residential mortgage-backed securities (RMBS) investors) need to work through and get comfortable with the regulatory and compliance risks associated with these types of loans.
Let’s move to the discussion of the loan price competition we face from large banks as they aggressively seek to add residential mortgages to their portfolios. How aggressive have they been? During the third quarter of 2013, some banks were offering 30-year fixed-rate jumbo mortgages more than 25 basis points below GSE conforming rates. As a historical point of context, jumbo loans are generally offered 25 basis points higher than conforming rates.
In our many years of experience, we have never witnessed jumbo loan pricing quite like this. It is a bit of a head-scratcher as to why banks would so aggressively put potentially very long duration assets on their balance sheets at this point in the interest rate cycle. Our guess is that excess liquidity in the banking system, together with a desire for loan and interest income growth, trumps the potential consequences from the asset/liability mismatch down the road. It is difficult to estimate how long this condition might persist.
In terms of what is going on with securitization, let’s begin with the big picture. Over the long term, we firmly believe that private label securitization is a very efficient and necessary form of U.S. mortgage financing, sitting alongside government supported mortgage financing and banks’ balance sheets. Through the securitization process, cash flows and the risks (duration, interest rate, credit) associated with a pool of loans can be tailored to create securities that cater to the specific risk-return preference of investors. Furthermore, it is the only way for institutional investors to easily make a residential mortgage investment by simply buying mortgage-backed securities.
Private securitization is our preferred source of loan distribution as it allows us to create attractive, “home-cooked” credit and interest-only investments for our portfolio. Through the 20 securitization transactions we have completed since 2010, we created over $500 million of investments for our portfolio.
We have all likely read or heard how private securitization is suddenly dead or barely has a pulse. We beg to differ. What happened? In our opinion, the spark was the recent rapid and steep rise in mortgage interest rates that gave investors in Agency securities issued and private label securities an “OMG” moment in pricing securities backed by lower coupon mortgages. Why? Now that prevailing mortgage interest rates are much higher, the new expectation for the duration of securities backed by lower coupon mortgages is much longer than previous expectations. For instance, an initial expectation of a 5-7 year investment period may now be an 8-10 year investment period. Investors are demanding more yield (lower prices) to compensate for additional duration risk. The Agency securities market is well established, deep and liquid; the private label securities market currently is nascent, thin, and relatively illiquid. As a consequence, as bad as the sell-off was in the Agency market, the negative impact on new issue private label securities was more severe.
| 6 | THE REDWOOD REVIEW | 3RD QUARTER 2013 |
|
|
||
|
SHAREHOLDER LETTER
|
Despite the difficult market conditions, we completed three securitizations in the third quarter. These securitizations, together with our direct whole loan sales, enabled us to substantially reduce our exposure to lower coupon residential mortgages in our conduit pipeline.
Assuming interest rates remain relatively stable, we expect investors in triple-A rated RMBS to view securities backed by more recently originated, higher coupon mortgages more favorably from a pricing standpoint. This should help revive RMBS issuance. In the near-term, we expect our loan sale distribution to be a combination of direct whole loan sales and securitizations. We expect to complete at least one securitization transaction in the fourth quarter of 2013. We believe that based on these distribution outlets and our ability to adjust loan pricing to our sellers, we can earn on average 25 to 50 basis points in loan sale profit margins, net of our hedges.
Turning to our strategy for our commercial platform, we have successfully shifted our focus to originating senior commercial loans, while continuing to originate mezzanine loans. While we will likely fall short of our full year goal to originate $1 billion of senior loans, our overall commercial loan sale margins have exceeded our expectations. Given this strength, we are confident that our commercial mortgage banking activities will generate attractive returns for shareholders in 2013.
As we have noted in the past, we have generally capped Redwood’s investment in our commercial platform at $300 million. We are currently considering alternatives to fund its continued growth and success with dedicated capital, which could take on a variety of different forms. How we ultimately move forward with our commercial platform will be based on what we believe is in the best long-term interests of our shareholders.
Heading into 2014, we feel very good about Redwood’s strategic positioning. We are in the right businesses and we have an excellent team of professionals to capitalize on opportunities. We feel that near-term headwinds are starting to subside as mortgage rates stabilize, and we are enthusiastic about the expanding opportunities we expect to see as a result of entering the conforming loan market. We expect to provide some metrics around our goals for 2014 in our next quarterly Shareholder Letter.
We hope you will join us for our third quarter earnings call, scheduled for the morning of November 7, 2013, when we will speak in more detail about our business. As always, we appreciate your continued support.

|

| |
| Martin S. Hughes | Brett D. Nicholas | |
| CEO | President |
| THE REDWOOD REVIEW | 3RD QUARTER 2013 | 7 |
|
| ||
|
QUARTERLY OVERVIEW
|
Third Quarter 2013 Results
Overview
Redwood generated positive results for the third quarter of 2013 despite continuing headwinds driven by interest rate volatility and related investor uncertainty. Our focus remained on managing the liquidity of our residential loan pipeline during the quarter while also making tangible progress on a few key operating initiatives. All told, we ended the third quarter profitably, with significantly reduced exposure to lower coupon residential mortgages in our pipeline, as well as excess capital to invest.
Here is a summary of Redwood’s third quarter 2013 results:
| • | We earned $0.25 per share for the third quarter of 2013. As noted in our second quarter Redwood Review, our third quarter GAAP earnings include approximately $0.17 per share of negative market valuation adjustments related to residential loans in our pipeline at June 30, 2013. We were successful in distributing nearly all of these loans in the third quarter of 2013, resulting in a small economic profit after factoring in our hedges. |
| • | Our GAAP book value at September 30, 2013 was $14.65 per share, down $0.04 per share from June 30, 2013. The reduction in book value reflects the adverse impact of $0.17 per share of negative market valuation adjustments for loans we had identified but not yet purchased at June 30, 2013, which we anticipated and described in our second quarter Redwood Review. |
| • | We completed three residential securitizations totaling $1.2 billion, and created $80 million of securities and $13 million of investments in mortgage servicing rights for our investment portfolio. Additionally, we completed whole loan sales totaling $600 million. |
| • | For the residential loans we identified for purchase in the third quarter of 2013, we expect to realize loan sale profit margins of 25 to 50 basis points, consistent with our long-term expectation for the profitability of our loan sale activities. |
| • | We acquired $1.3 billion of loans in the third quarter of 2013, as compared to $2.6 billion in the second quarter of 2013. In total, we have purchased $6.5 billion of loans through the first three quarters of 2013. At September 30, 2013, we owned $728 million of residential loans held-for-sale and had identified an additional $595 million for purchase. |
| • | We added 11 residential loan sellers to our platform in the third quarter of 2013, increasing the total number of active sellers to 112 at September 30, 2013. |
| • | We originated 12 senior commercial loans totaling $113 million and we sold 18 senior commercial loans totaling $238 million in the third quarter of 2013. We also originated two mezzanine loans for $9 million in the third quarter of 2013. |
| • | We declared and distributed a $0.28 per share dividend to shareholders for the third quarter of 2013. |
| 8 | THE REDWOOD REVIEW | 3RD QUARTER 2013 |
|
|
||
|
QUARTERLY OVERVIEW
|
Financial Results
In the third quarter of 2013, we earned $0.25 per share, down from $0.71 per share for the second quarter of 2013. The decline in earnings primarily reflects a combination of lower loan acquisition volume in the third quarter and the realization of approximately $0.17 per share of negative market valuation adjustments on our June 30, 2013 residential loan pipeline. As we disclosed in our second quarter Redwood Review, these negative market valuation adjustments were more than offset by hedging gains recognized in the second quarter of 2013, resulting in a small overall economic profit associated with our distribution of these loans. See the Residential Mortgage Banking Activities section of this Quarterly Review for additional details.
The following table sets forth the components of GAAP income for the third and second quarters of 2013.
|
GAAP Income |
| |||||||
| ($ in millions, except per share data)
|
| |||||||
| Three Months Ended | ||||||||
| 9/30/13 | 6/30/13 | |||||||
| Interest income | $ | 58 | $ | 58 | ||||
| Interest expense | (22 | ) | (21 | ) | ||||
| Net interest income | 36 | 36 | ||||||
| (Provision for) reversal of provision for loan losses | (2 | ) | 3 | |||||
| Other market valuation adjustments, net | - | (6 | ) | |||||
| Net interest income after provision and other market valuation adjustments | 34 | 33 | ||||||
| Mortgage banking activities, net | (6 | ) | 59 | |||||
| Operating expenses | (22 | ) | (24 | ) | ||||
| Realized gains, net | 10 | 1 | ||||||
| Benefit (provision) for income taxes | 5 | (3 | ) | |||||
| GAAP income | $ | 22 | $ | 66 | ||||
| GAAP income per share | $ | 0.25 | $ | 0.71 | ||||
Net interest income for the third quarter of 2013 was $36 million, consistent with the second quarter of 2013. Our average interest earning assets were down slightly to $4.6 billion during the third quarter, resulting from lower balances of residential loans held for sale on our balance sheet relative to the second quarter of 2013, offset by the acquisition of $223 million of Sequoia and third-party securities during the third quarter of 2013.
Our provision for loan losses at legacy Sequoia entities was $1 million for the third quarter of 2013, as compared to the $4 million release of provision for the second quarter of 2013. The $5 million quarter-over-quarter change is primarily due to a $4 million recovery of previous provisions for loan losses we recognized in the second quarter of 2013.
| THE REDWOOD REVIEW | 3RD QUARTER 2013 | 9 |
|
| ||
|
QUARTERLY OVERVIEW
|
Financial Results (continued)
Our reported loss from mortgage banking activities, net, of $6 million for the third quarter of 2013 largely reflects the recognition of $15 million ($0.17 per share) of negative market valuation adjustments associated with our residential loan pipeline at June 30, 2013. Income from mortgage banking activities, net, of $59 million for the second quarter of 2013 included hedging gains associated with these loans.
Our loan sale profit margins are measured over the period from which we identify a loan for purchase and subsequently sell or securitize the loan. These profit margins may encompass positive or negative market valuation adjustments on loans, hedging gains or losses associated with our loan pipeline, and any other related transactional expenses, and may be realized over the course of one or more quarters for financial reporting purposes.
For loans we have identified for purchase since June 30, 2013, we expect to earn, on average, profit margins of 25 to 50 basis points as we accumulate and distribute them through whole loan sales or securitization transactions.
In the third quarter of 2013, we recognized $10 million of net gains from the sale of $182 million of primarily senior residential securities, which had been funded with a combination of equity capital and short-term debt.
During the third quarter of 2013, we recognized a $5 million benefit for income taxes that primarily related to the release of a valuation allowance for capital loss carryforward deferred tax assets that were accumulated during past periods. We now expect to realize tax savings associated with this deferred tax asset based on our current expectation for realizing net capital gains on sales of appreciated securities. See the Taxable Income and Dividends section on page 28 for further information.
The following table presents a summary of GAAP book value for the third and second quarters of 2013.
|
Changes in GAAP Book Value Per Share |
| |||||||||||
| ($ in per share)
|
| |||||||||||
| Q3 2013 | Q2 2013 | Variance | ||||||||||
| Beginning book value |
$ | 14.69 | $ | 14.54 | $ | 0.15 | ||||||
| Net income |
0.25 | 0.71 | (0.46 | ) | ||||||||
| Changes in unrealized gains/losses, net |
(0.09 | ) | (0.46 | ) | 0.37 | |||||||
| Unrealized gains on hedges, net |
0.05 | 0.17 | (0.12 | ) | ||||||||
| Equity issuance, net |
- | 0.06 | (0.06 | ) | ||||||||
| Other, net |
0.03 | (0.05 | ) | 0.08 | ||||||||
| Dividends |
(0.28 | ) | (0.28 | ) | - | |||||||
|
Ending book value |
$ | 14.65 | $ | 14.69 | $ | (0.04 | ) | |||||
| 10 | THE REDWOOD REVIEW | 3RD QUARTER 2013 |
|
|
||
|
QUARTERLY OVERVIEW
|
Financial Results (continued)
Portfolio Investment Activity
We deployed $146 million of capital into new investments in the third quarter of 2013, down from $159 million in the second quarter of 2013, as summarized in the following table.
|
Quarterly Investment Activity |
| |||||||
| ($ in millions)
|
| |||||||
| Q3 2013 | Q2 2013 | |||||||
| Sequoia RMBS |
$ | 80 | $ | 124 | ||||
| Third-party RMBS |
143 | - | ||||||
| Less: Short-term debt |
(101 | ) | - | |||||
| MSR investments |
17 | 16 | ||||||
| Total residential |
139 | 140 | ||||||
| Commercial loans |
9 | 19 | ||||||
| Less: Borrowings |
(2 | ) | - | |||||
| Total commercial
|
|
7
|
|
|
19
|
| ||
|
Equity capital invested |
$ | 146 | $ | 159 | ||||
Residential Investments
At September 30, 2013, our residential securities portfolio had a market value of $1.3 billion, consistent with the market value of this portfolio at June 30, 2013. We acquired $223 million of securities in the third quarter, which was largely offset by sales of $182 million and principal payments of $38 million. Negative valuation adjustments for the third quarter of 2013 were $3 million.
Our securities acquisitions in the third quarter of 2013 included $80 million of residential securities retained from the $1.2 billion of Sequoia securitizations we completed during the third quarter. These retained securities included $72 million of subordinate securities (AA, A, BBB, BB and non-rated securities) and $9 million of interest-only securities. We also acquired $143 million of third-party RMBS in the third quarter of 2013, consisting of $100 million of seasoned senior securities and $42 million of new issue subordinate securities from three issuers.
Following the end of the third quarter of 2013 through November 1st, we deployed $35 million of capital, net of financing, into investments in residential securities. This included $17 million invested in newly issued third party subordinate securities as well as $190 million invested in seasoned senior securities which we financed with a combination of $172 million of short-term debt and $18 million of equity capital.
| THE REDWOOD REVIEW | 3RD QUARTER 2013 | 11 |
|
| ||
|
QUARTERLY OVERVIEW
|
Financial Results (continued)
Residential Investments (continued)
At September 30, 2013, the market value of our mortgage servicing rights (MSRs) portfolio was $60 million, or 1.08% of the $5.6 billion principal amount of the associated mortgage loans. This included $13 million of MSRs associated with $1.6 billion of loans we acquired in the third quarter of 2013 through our conduit operations and $3 million of MSRs acquired in the third quarter of 2013 associated with a $300 million pool of conforming loans.
Residential Mortgage Banking Activities
Recent Market Conditions
Interest rate volatility in recent months resulted in a setback for the new-issue RMBS market. Industry-wide, there was $3.5 billion of new issuance in the third quarter of 2013, down from $4.4 billion in the second quarter of 2013. There were five securitizations completed in July, two securitizations completed in August, and only one securitization completed in September. Redwood sponsored three of these eight securitizations. With the fixed income market expecting an eventual tapering of the Federal Reserve’s demand for Agency MBS, and fixed income funds continuing to experience outflows, it is likely to be a quiet fourth quarter for new-issuance RMBS.
Despite the slowdown in the securitization market, there has been a strong demand among large banks for originating and acquiring prime quality jumbo mortgages.
As a result of this demand, the whole loan distribution component of our conduit platform has been very active in recent quarters. We sold over $900 million in whole loans through the first three quarters of 2013, and we expect to remain an active participant in the whole loan market to take advantage of the best loan sale execution opportunities available to us going forward.
Quarterly Update
We completed three Sequoia securitizations totaling $1.2 billion in the third quarter of 2013, as compared to four securitizations totaling $1.8 billion in the second quarter of 2013. We also completed $600 million of whole loan sales in the third quarter, as compared to $286 million in the second quarter. In October 2013, we settled $325 million in whole loan sales and we expect to close an approximate $325 million securitization in November 2013.
With mortgage rates increasing, we began acquiring additional 15-year fixed-rate and hybrid loans. Of the $1 billion of loans we identified for purchase in the third quarter of 2013, 55% were 30-year fixed rate mortgage loans, down from 83% in the second quarter of 2013, and 95% from the third quarter of 2012. Additionally, of the $1 billion of loans we identified for purchase in the third quarter of 2013, 46% were refinance-related, down from 53% in the second quarter of 2013.
Our third quarter of 2013 loan acquisition volume was $1.3 billion, as compared to $2.6 billion in the second quarter of 2013. The decline resulted from the approximate 100 basis point increase in mortgage rates that led to an overall decline in industry loan originations, particularly for refinance-related loans. We currently expect to acquire between $500 million and $1 billion of jumbo residential loans in the
| 12 | THE REDWOOD REVIEW | 3RD QUARTER 2013 |
|
|
||
|
QUARTERLY OVERVIEW
|
Financial Results (continued)
Residential Mortgage Banking Activities (continued)
fourth quarter of 2013. Given the volatility observed in the market, it is still not clear whether we will reach $8 billion of jumbo residential loan purchases – one of the goals we established earlier in the year for 2013. The table below illustrates the number of active sellers, the volume of jumbo loans identified for purchase, and jumbo loans purchased through our flow-based platform over the past five quarters.*
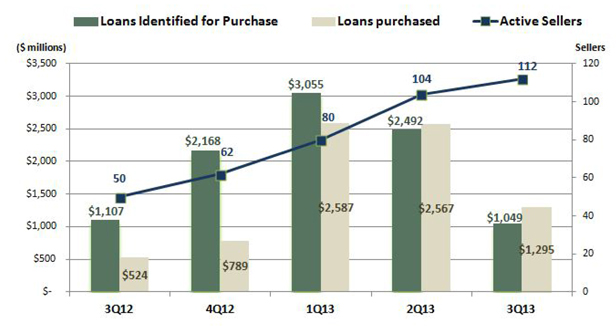
As described in the Recent Market Conditions section above, the volume of loans we have identified for purchase and our acquisitions in recent months have been impacted by highly aggressive pricing of jumbo mortgage loans by large banks. Despite the competitive environment, we have continued to acquire loans, at a slower pace, from a growing number of sellers. At September 30, 2013, our 112 sellers consisted of 53 regional banks (or their subsidiaries) and 59 mortgage companies, located throughout the U.S.
* Does not include loans identified for purchase in bulk transactions.
| THE REDWOOD REVIEW | 3RD QUARTER 2013 | 13 |
|
| ||
|
QUARTERLY OVERVIEW
|
Financial Results (continued)
Commercial Investments and Mortgage Banking Activities
Our third quarter of 2013 commercial loan origination volume was also impacted by the volatility in interest rates during the quarter. We funded 12 senior commercial loans totaling $113 million in the third quarter, as compared to the second quarter of 2013 when we funded ten loans totaling $150 million. We sold 18 senior loans totaling $238 million in the third quarter of 2013, as compared to six senior loans totaling $74 million in the second quarter of 2013.
Our commercial mortgage banking activities generated income of $3 million in the third quarter of 2013, as compared to $6 million in the second quarter of 2013. At September 30, 2013, we had $27 million of senior commercial loans held for sale, all of which we expect to sell by mid-November 2013. For the first nine months ended September 30, 2013, we originated $562 million of senior commercial loans, including those that were table-funded by third parties. While we expect to originate approximately $200 to $300 million of senior loans in the fourth quarter of 2013, we are likely to fall short of our full-year goal of originating $1 billion of senior commercial loans in 2013.
Commercial mezzanine loan originations in the third quarter of 2013 totaled two loans for $9 million, as compared to six loans for $19 million in the second quarter of 2013. This brought our portfolio of non-securitized mezzanine loans to 21 for $84 million at September 30, 2013. Our securitized mezzanine portfolio totaled $270 million at September 30, 2013 and June 30, 2013. Redwood’s investment in this securitized portfolio totaled $115 million at the end of the third quarter of 2013.
Cash, Debt, and Capital
At September 30, 2013, our cash amounted to $205 million and our current investment capacity (defined as the approximate amount of capital we have readily available for long-term investments) was estimated to be approximately $150 million. Our equity capital was $1.2 billion at September 30, 2013. Our sources of capital at September 30, 2013 also included $427 million of long-term debt.
We ended the third quarter of 2013 with short-term warehouse debt of $467 million, which was used to finance residential and commercial loans, and had additional uncommitted borrowing capacity of $1.3 billion under existing warehouse lines of credit to finance additional residential and commercial loans. Our short-term debt used to finance securities at September 30, 2013 was $371 million, an increase from the $363 million of short-term debt used to fund securities at June 30, 2013.
We believe that our available capital and liquidity is sufficient to fund our business and investment objectives for the remainder of 2013. To the extent we need additional incremental capital to fund our operations and investment activities, our approach to raising capital will continue to be based on what we believe to be in the best long-term interests of shareholders. Any future capital-raising transaction could include the issuance of debt or equity securities under the shelf registration statement we currently have on file with the SEC, or the issuance of similar or other types of securities in public or private offerings, including, as noted in the preceding Shareholder Letter, the possibility of raising dedicated capital for our commercial platform.
| 14 | THE REDWOOD REVIEW | 3RD QUARTER 2013 |
|
|
||
|
FINANCIAL INSIGHTS
|
Balance Sheet
The following table shows the components of our balance sheet at September 30, 2013.
|
Consolidating Balance Sheet (1) |
| |||||||||||
|
September 30, 2013 ($ in millions)
|
| |||||||||||
| At Redwood (2) |
Consolidated Sequoia Entities (3) |
Redwood Consolidated |
||||||||||
| Residential loans |
$ | 728 | $ | 1,865 | $ | 2,593 | ||||||
| Commercial loans |
380 | - | 380 | |||||||||
| Real estate securities - Third party |
821 | - | 821 | |||||||||
| Real estate securities - Sequoia (4) |
504 | - | 504 | |||||||||
| Mortgage servicing rights |
60 | - | 60 | |||||||||
| Cash and cash equivalents |
205 | - | 205 | |||||||||
| Total earning assets |
2,697 | 1,865 | 4,562 | |||||||||
| Other assets
|
|
89
|
|
|
9
|
|
|
98
|
| |||
| Total assets |
$ | 2,786 | $ | 1,874 | $ | 4,660 | ||||||
| Short-term debt |
||||||||||||
| Mortgage loan warehouse debt |
$ | 467 | $ | - | $ | 467 | ||||||
| Security repurchase facilities |
371 | - | 371 | |||||||||
| Other liabilities |
79 | 1 | 81 | |||||||||
| Asset-backed securities issued |
271 | 1,791 | 2,062 | |||||||||
| Long-term debt |
472 | - | 472 | |||||||||
| Total liabilities |
1,660 | 1,792 | 3,452 | |||||||||
| Stockholders’ equity
|
|
1,126
|
|
|
82
|
|
|
1,207
|
| |||
| Total liabilities and equity |
$ | 2,786 | $ | 1,874 | $ | 4,660 | ||||||
(1) We are required under GAAP to consolidate the assets and liabilities of certain securitization entities we have sponsored for financial reporting purposes. However, the securitized assets of these entities are not legally ours and we own only the securities and interests that we acquired from these securitization entities. Similarly, the liabilities of these entities are obligations payable only from the cash flow generated by their securitized assets and are not obligations of Redwood.
(2) Included in the “At Redwood” column are the assets and liabilities of the Residential Resecuritization and Commercial Securitization transactions we completed in 2011 and 2012, respectively. These transactions are treated as secured borrowings under GAAP. At September 30, 2013, the Residential Resecuritization accounted for $276 million of assets ($275 million of available-for-sale securities at fair value and $1 million of other assets) and $112 million of asset-backed securities issued (at historical cost). Our $165 million investment in this resecuritization, as estimated for GAAP, equals the difference between these assets and liabilities. At September 30, 2013, the Commercial Securitization accounted for $271 million of assets ($269 million of commercial real estate loans at historical cost and $2 million of other assets) and $159 million of asset-backed securities issued (at historical cost). Our $115 million investment in this securitization, as estimated for GAAP, equals the difference between these assets and liabilities.
(3) Consolidated Sequoia Entities includes certain Sequoia securitizations completed prior to 2012 that we are required to consolidate under GAAP. Our estimated GAAP investment in these entities was $82 million at September 30, 2013, representing the difference in the aggregate assets and liabilities at these entities.
(4) Sequoia securitizations completed between January 2012 and September 2013 are treated as sales for GAAP, and the $504 million of securities we have retained from these transactions are reflected in the “At Redwood” column above as part of “Real Estate Securities — Sequoia.”
| THE REDWOOD REVIEW | 3RD QUARTER 2013 | 15 |
|
| ||
|
FINANCIAL INSIGHTS
|
Balance Sheet (continued)
Residential Loans
At September 30, 2013, we owned $728 million of unsecuritized residential real estate loans, as compared to $1.2 billion at June 30, 2013. The table below details residential loan activity at Redwood during the third and second quarters of 2013.
|
Residential Loans at Redwood |
| |||||||
|
($ in millions)
|
| |||||||
| Three Months Ended | ||||||||
| 9/30/13 | 6/30/13 | |||||||
| Beginning fair value |
$ | 1,221 | $ | 832 | ||||
| Acquisitions |
1,295 | 2,567 | ||||||
| Sales |
(1,772 | ) | (2,135 | ) | ||||
| Principal Payments |
(4 | ) | (2 | ) | ||||
| Change in fair value, net |
(12 | ) | (41 | ) | ||||
| Ending fair value |
$ | 728 | $ | 1,221 | ||||
At September 30, 2013, we owned $728 million of prime residential loans, of which $472 million were 30-year fixed rate loans, $66 million were 15-year and 20-year fixed rate loans, and $190 million were hybrid loans. Our pipeline of loans identified for purchase was $595 million at September 30, 2013.
See the Residential Mortgage Banking Activities section on page 30 for more information.
Commercial Loans
At September 30, 2013, we had $380 million of commercial loans, as compared to $495 million of commercial loans at June 30, 2013. The following table details commercial loan activity at Redwood during the third quarter of 2013.
|
Commercial Loans |
| |||||||||||||||
| Three Months Ended September 30, 2013 | ||||||||||||||||
| ($ in millions)
|
| |||||||||||||||
|
Securitized Mezzanine |
Unsecuritized Mezzanine |
Senior | Total | |||||||||||||
| Beginning carrying value |
$ | 270 | $ | 75 | $ | 150 | $ | 495 | ||||||||
| Originations |
- | 9 | 113 | 122 | ||||||||||||
| Sales |
- | - | (238 | ) | (238 | ) | ||||||||||
| Principal payments/amortization |
(1 | ) | (0 | ) | (0 | ) | (1 | ) | ||||||||
| Change in fair value/reserves |
(0 | ) | (0 | ) | 3 | 3 | ||||||||||
|
Ending carrying value |
$ | 269 | $ | 83 | $ | 27 | $ | 380 | ||||||||
During the third quarter of 2013, we originated two mezzanine loans and 12 senior loans and sold 18 senior loans. See the Commercial Mortgage Banking Activities section on page 31 for more information.
| 16 | THE REDWOOD REVIEW | 3RD QUARTER 2013 |
|
|
||
|
FINANCIAL INSIGHTS
|
Balance Sheet (continued)
Residential Real Estate Securities
The following table presents the fair value of real estate securities at Redwood at September 30, 2013. We categorize our Sequoia and third-party securities by portfolio vintage (the year(s) the securities were issued), priority of cash flow (senior, re-REMIC, and subordinate), and by the underwriting characteristics of underlying loans (prime and non-prime).
|
Real Estate Securities(1) September 30, 2013 ($ in millions) |
| |||||||||||||||||||||||
| Sequoia Securities 2012-2013 |
Third-party securities |
Total Securities |
% of Total Securities |
|||||||||||||||||||||
| <=2005 | 2006-2008 | 2012-2013 | ||||||||||||||||||||||
| Seniors |
||||||||||||||||||||||||
| Prime |
$ | 120 | $ | 269 | $ | 92 | $ | - | $ | 481 | 36 | % | ||||||||||||
| Non-prime (2) |
- | 199 | 5 | - | 204 | 16 | % | |||||||||||||||||
| Total Seniors |
120 | 468 | 97 | - | 685 | 52 | % | |||||||||||||||||
| Total Re-REMIC |
- | 64 | 93 | - | 156 | 12 | % | |||||||||||||||||
| Subordinates |
||||||||||||||||||||||||
| Prime |
384 | 57 | 1 | 41 | 483 | 36 | % | |||||||||||||||||
| Total Subordinates
|
|
384
|
|
|
57
|
|
|
1
|
|
|
41
|
|
|
483
|
|
|
36
|
%
| ||||||
| Total real estate securities |
$ | 504 | $ | 589 | $ | 191 | $ | 41 | $ | 1,325 | 100 | % | ||||||||||||
(1) Included in the real estate securities table above are $276 million of senior securities that are included in the Residential Resecuritization that we completed in July 2011. Under GAAP accounting, we account for the resecuritization as a financing even though these securities are owned by the resecuritization entity and are legally not ours. We own only the securities and interests that we acquired from the resecuritization entity, which amounted to $148 million at September 30, 2013. As a result, to adjust at September 30, 2013 for the legal and economic interests that resulted from the resecuritization, Total Residential Senior Securities would be decreased by $276 million to $409 million, Total Re-REMIC Residential Securities would be increased by $148 million to $304 million, and Total Residential Securities would be reduced by $128 million to $1.2 billion.
(2) Non-prime residential securities consist of $204 million of Alt-A senior securities.
| THE REDWOOD REVIEW | 3RD QUARTER 2013 | 17 |
|
| ||
|
FINANCIAL INSIGHTS
|
Balance Sheet (continued)
Residential Real Estate Securities (continued)
The table below details the change in fair value of real estate securities at Redwood during the third and second quarters of 2013.
|
Real Estate Securities |
| |||||||
| ($ in millions)
|
| |||||||
| Three Months Ended | ||||||||
| 9/30/13 | 6/30/13 | |||||||
| Beginning fair value |
$ | 1,314 | $ | 1,231 | ||||
| Acquisitions |
||||||||
| Sequoia securities |
80 | 133 | ||||||
| Third-party securities |
143 | - | ||||||
| Sales |
||||||||
| Sequoia securities |
(14 | ) | (9 | ) | ||||
| Third-party securities |
(168 | ) | - | |||||
| Gain on sale |
10 | 1 | ||||||
| Effect of principal payments |
(38 | ) | (37 | ) | ||||
| Change in fair value, net |
(3 | ) | (4 | ) | ||||
| Ending fair value |
$ | 1,325 | $ | 1,314 | ||||
Mortgage Servicing Rights
At September 30, 2013, we owned mortgage servicing rights (MSRs) associated with $5.6 billion of residential loans acquired through our residential loan platform. We earn fees from these MSRs, but outsource the actual servicing of these loans to a nationally recognized third-party servicer. The table below details the change in fair value of MSRs during the third and second quarters of 2013.
|
MSRs |
| |||||||
| ($ in millions)
|
| |||||||
| Three Months Ended | ||||||||
| 9/30/13 | 6/30/13 | |||||||
| Beginning Fair Value |
$ | 43 | $ | 18 | ||||
| Additions |
17 | 16 | ||||||
| Change in fair value, net |
- | 9 | ||||||
| Ending Fair Value |
$ | 60 | $ | 43 | ||||
Redwood’s investment in MSRs increased to $60 million in the third quarter of 2013 as we added $17 million of MSRs, increasing the portfolio of loans associated with Redwood’s investment in MSRs to $5.6 billion. These additions included $13 million of MSRs associated with $1.6 billion of loans we acquired in the third quarter of 2013 through our conduit operations and $3 million of MSRs acquired in the third quarter of 2013 associated with a $300 million pool of conforming loans. The GAAP carrying value of our MSRs at September 30, 2013 is equal to 1.08% of the principal balance of the associated residential loans.
| 18 | THE REDWOOD REVIEW | 3RD QUARTER 2013 |
|
|
|
FINANCIAL INSIGHTS
|
Balance Sheet (continued)
Derivatives
The following table presents the fair value and notional value of derivative financial instruments held by Redwood at September 30, 2013 and June 30, 2013.
|
Derivatives |
| |||||||||||||||
| ($ in millions)
|
| |||||||||||||||
| 9/30/13 | 6/30/13 | |||||||||||||||
| Fair Value | Notional | Fair Value | Notional | |||||||||||||
| Risk management derivatives, net | ||||||||||||||||
| Residential |
$ | (3 | ) | $ | 1,233 | $ | 41 | $ | 2,398 | |||||||
| Commercial |
(1 | ) | 26 | - | - | |||||||||||
| Cash flow hedges on TruPS | (24 | ) | 140 | (28 | ) | 140 | ||||||||||
| Total derivative financial instruments, net | $ | (28 | ) | $ | 1,399 | $ | 14 | $ | 2,537 | |||||||
The decrease in fair value of risk management derivatives during the third quarter of 2013 primarily resulted from a $1.1 billion reduction in our notional exposure outstanding since June 30, 2013. Benchmark interest rates fluctuated somewhat during the third quarter of 2013, resulting in a net $4 million liability for risk management derivatives associated with our residential and commercial mortgage banking activities. Net changes in the fair value of risk management derivatives are reflected in our income statement in Mortgage Banking Activities, net.
Rising benchmark interest rates also resulted in a $4 million reduction to our derivative liability related to cash flow hedges on our long-term debt. Changes in the fair value of our cash flow hedges were recorded in shareholders’ equity through accumulated other comprehensive income.
Investments in Consolidated Sequoia Entities
Our investments in Consolidated Sequoia Entities, as estimated for GAAP, totaled $82 million at September 30, 2013. This amount reflects the book value of our retained investments in consolidated Sequoia entities and is based on the difference between the consolidated assets and liabilities of the entities in the aggregate according to their GAAP carrying amounts.
| THE REDWOOD REVIEW | 3RD QUARTER 2013 | 19 |
|
| ||
|
FINANCIAL INSIGHTS
|
Balance Sheet (continued)
Short-Term Debt
At September 30, 2013, we had short-term mortgage warehouse debt outstanding of $467 million, which was used to finance a portion of the $728 million inventory of residential mortgage loans held for sale and the $27 million inventory of commercial loans held for sale.
At September 30, 2013, we had five uncommitted residential mortgage warehouse facilities with an aggregate borrowing capacity of $1.65 billion, and one uncommitted commercial mortgage warehouse facility for senior loans with a borrowing capacity of $100 million.
At September 30, 2013, we had short-term debt incurred through securities repurchase facilities of $371 million, which was secured by $500 million of residential securities, resulting in a debt-to-equity leverage ratio for these residential securities of 2.9x (excluding the additional risk capital we hold related to these short-term borrowings).
The table below details the short-term debt activity at Redwood during the third and second quarters of 2013.
|
Short-Term Debt by Collateral Type |
| |||||||||||||||||||||||
| ($ in millions)
|
| |||||||||||||||||||||||
| Senior Commerical Loans | Residential Loans | Residential Securities | ||||||||||||||||||||||
| Q3 2013 | Q2 2013 | Q3 2013 | Q2 2013 | Q3 2013 | Q2 2013 | |||||||||||||||||||
| Beginning fair value |
$ | - | $ | - | $ | 1,083 | $ | 351 | $ | 363 | $ | 370 | ||||||||||||
| Borrowings |
60 | - | 980 | 2,344 | 716 | 9 | ||||||||||||||||||
| Repayments |
(55 | ) | - | (1,602 | ) | (1,612 | ) | (708 | ) | (16 | ) | |||||||||||||
| Ending fair value |
$ | 5 | $ | - | $ | 462 | $ | 1,083 | $ | 371 | $ | 363 | ||||||||||||
Long-Term Debt and ABS Issued
At September 30, 2013, we had $288 million of convertible senior notes outstanding at a stated interest rate of 4.625% (excluding deferred issuance costs) that are convertible into 41.1320 shares of common stock per $1,000 principal amount (subject to certain adjustments) on or before their maturity in April 2018.
At September 30, 2013, we had $140 million of other long-term debt outstanding due in 2037 with a stated interest rate of three-month LIBOR plus 225 basis points. In 2010, we effectively fixed the interest rate on this long-term debt at approximately 6.75% (excluding deferred issuance costs) through interest rate swaps.
At September 30, 2013, we had $45 million of borrowings outstanding under a $150 million commercial warehouse facility for mezzanine loans, which is classified as long-term debt on our consolidated balance sheet, due to the 24 month term of this facility.
At September 30, 2013, we had $112 million outstanding of non-recourse, asset-backed debt issued at a stated interest rate of one-month LIBOR plus 200 basis points related to our Residential Resecuritization. We also had $159 million outstanding of non-recourse, asset-backed debt issued at a stated interest rate of 5.62% (excluding deferred issuance costs) related to our Commercial Securitization.
| 20 | THE REDWOOD REVIEW | 3RD QUARTER 2013 |
|
|
|
FINANCIAL INSIGHTS
|
Balance Sheet (continued)
Capital and Cash
At September 30, 2013, our total capital was $1.6 billion, including $1.2 billion of shareholders’ equity, and $427 million of long-term debt. We use capital to invest in earning assets, meet lender capital requirements, and fund our operations and working capital needs. Our cash balance was $205 million at September 30, 2013.
| THE REDWOOD REVIEW | 3RD QUARTER 2013 | 21 |
|
| ||
|
FINANCIAL INSIGHTS
|
GAAP Income
Our consolidated GAAP net income for the third quarter of 2013 was $22 million, or $0.25 per share, as compared to $66 million, or $0.71 per share, for the second quarter of 2013. The $44 million decrease primarily resulted from lower mortgage banking income. The decrease was partially offset by an increase in realized gains and an adjustment to reduce our full year 2013 tax provision estimate.
The following tables present the results at Redwood and consolidated Sequoia entities and their estimated effect on GAAP income for the third and second quarters of 2013.
|
Consolidating Income Statement |
| |||||||||||
| Three Months Ended September 30, 2013 | ||||||||||||
| ($ in millions, except per share data)
|
| |||||||||||
| At Redwood |
Consolidated Entities |
Redwood Consolidated |
||||||||||
| Interest income | $ | 41 | $ | 10 | $ | 51 | ||||||
| Net discount (premium) amortization | 9 | (2 | ) | 7 | ||||||||
| Total interest income | 50 | 8 | 58 | |||||||||
| Interest expense | (16 | ) | (6 | ) | (22 | ) | ||||||
| Net interest income | 34 | 2 | 36 | |||||||||
| Provision for for loan losses | (1 | ) | (1 | ) | (2 | ) | ||||||
| Other market valuation adjustments, net | 1 | - | | |||||||||
| Net interest income after provision and other market valuation adjustments | 34 | 1 | 34 | |||||||||
| Mortgage banking activities, net | (6 | ) | - | (6 | ) | |||||||
| Operating expenses | (22 | ) | - | (22 | ) | |||||||
| Realized gains, net | 10 | - | 10 | |||||||||
| Benefit from income taxes | 5 | | 5 | |||||||||
| Net income | $ | 21 | $ | 1 | $ | 22 | ||||||
| Net income per share | $ | 0.25 | ||||||||||
|
Consolidating Income Statement |
| |||||||||||
| Three Months Ended June 30, 2013 | ||||||||||||
| ($ in millions, except per share data)
|
| |||||||||||
| At Redwood |
Consolidated Sequoia Entities |
Redwood Consolidated |
||||||||||
| Interest income | $ | 40 | $ | 11 | $ | 51 | ||||||
| Net discount (premium) amortization | 9 | (2 | ) | 7 | ||||||||
| Total interest income | 49 | 9 | 58 | |||||||||
| Interest expense | (15 | ) | (7 | ) | (21 | ) | ||||||
| Net interest income | 34 | 2 | 36 | |||||||||
| (Provision for) reversal of provision for loan losses | (1 | ) | 4 | 3 | ||||||||
| Other market valuation adjustments, net | (6 | ) | (1 | ) | (6 | ) | ||||||
| Net interest income after provision and other market valuation adjustments | 28 | 6 | 33 | |||||||||
| Mortgage banking activities, net | 59 | - | 59 | |||||||||
| Operating expenses | (24 | ) | - | (24 | ) | |||||||
| Realized gains, net | 1 | - | 1 | |||||||||
| Provision for income taxes | (3 | ) | - | (3 | ) | |||||||
| Net income | $ | 60 | $ | 6 | $ | 66 | ||||||
| Net income per share | $ | 0.71 | ||||||||||
| 22 | THE REDWOOD REVIEW | 3RD QUARTER 2013 |
|
|
|
FINANCIAL INSIGHTS
|
Net Interest Income at Redwood
Total interest income from our securities portfolio and our residential and commercial loans was $50 million in the third quarter of 2013, an increase of $1 million from the second quarter of 2013.
Interest income from our securities portfolio was $30 million for the third quarter of 2013, an increase of $1 million from the second quarter of 2013, as the average balance of our securities portfolio increased 6% to $1.2 billion, primarily from the acquisition of $223 million of Sequoia and third-party securities during the quarter.
Interest income from residential loans held-for-sale was $9 million during the third quarter of 2013, a decrease of $1 million from the second quarter of 2013, as the average balance of residential loans held-for-sale on our balance sheet decreased 19% to $861 million, reflecting lower acquisition volume during the third quarter of 2013. These loans are financed using a combination of short-term debt and equity capital prior to either being securitized through our Sequoia platform or sold as whole loans. The amount of interest earned from these loans is dependent upon prevailing mortgage rates and the amount of time they are held on our balance sheet prior to sale.
Commercial loans generated $11 million of interest income in the third quarter of 2013, an increase of $1 million from the second quarter of 2013, as the average balance of loans increased 9% to $416 million. New commercial mezzanine loan investments totaled $9 million in the third quarter of 2013, increasing the portfolio to $352 million at September 30, 2013. We also originated senior commercial loans totaling $113 million during the third quarter of 2013 and sold $238 million of senior commercial loans, some of which were originated in the second quarter of 2013.
Interest expense was $16 million in the third quarter of 2013, an increase of $1 million from the second quarter of 2013, primarily resulting from an increase in the average balance of short-term debt used to finance residential and commercial loan acquisitions.
Other Market Valuation Adjustments at Redwood
Other market valuation adjustments, net, were less than $1 million in the third quarter of 2013, an improvement of $6 million from the second quarter of 2013. Valuations for our trading securities remained stable in the current quarter, compared to a decrease of $4 million in the second quarter of 2013. Additionally, impairments of $2 million were taken on available-for-sale securities in the second quarter of 2013.
| THE REDWOOD REVIEW | 3RD QUARTER 2013 | 23 |
|
| ||
|
FINANCIAL INSIGHTS
|
Mortgage Banking Activities
The following table presents the components of mortgage banking activities for the third and second quarters of 2013.
|
Mortgage Banking Activities |
| |||||||
| ($ in millions)
|
| |||||||
| Three Months Ended | ||||||||
| 9/30/13 | 6/30/13 | |||||||
| Net market valuation adjustments on: | ||||||||
| Residential loans |
$ | (11 | ) | $ | (41 | ) | ||
| Commercial loans |
3 | | ||||||
| MSRs |
- | 9 | ||||||
| Sequoia IO securities |
(2 | ) | 36 | |||||
| Risk management derivatives |
1 | 50 | ||||||
| Net gains on commercial mortgage loan sales | - | 4 | ||||||
| Income from MSRs, net
|
|
3
|
|
|
2
|
| ||
| Total mortgage banking activities, net | $ | (6 | ) | $ | 59 | |||
Income from mortgage banking activities, net, was negative $6 million for the third quarter of 2013, primarily reflecting losses realized on loans we had identified at June 30, 2013, but purchased in the third quarter of 2013. As previously discussed, our results for the second quarter of 2013 included hedging gains associated with these loans, but did not reflect the corresponding negative market valuation adjustments for the loans themselves. At September 30, 2013, over 85% of these loans were sold or securitized with nearly all of the remainder having been purchased and marked-to-market through our income statement. In aggregate, market valuation adjustments recorded in the third quarter of 2013 associated with our residential loan pipeline at June 30, 2013 were negative $15 million or $0.17 per share, down from our August 1, 2013 estimate of negative $21 million or $0.22 per share.
The impact of risk management derivatives used to offset risks associated with our mortgage banking activities, as well as changes in the value of Sequoia IO securities, were more muted during the third quarter of 2013 as interest rates stabilized. This resulted in an aggregate negative market valuation adjustment of $1 million for the third quarter of 2013, as compared to positive $86 million during the second quarter of 2013, when interest rates rose sharply.
Income from mortgage banking activities in the third quarter of 2013 also included $3 million in positive market valuation gains on senior commercial loans and related derivatives, as compared to $6 million in the second quarter of 2013.
| 24 | THE REDWOOD REVIEW | 3RD QUARTER 2013 |
|
|
|
FINANCIAL INSIGHTS
|
Operating Expenses
Operating expenses were $22 million for the third quarter of 2013, as compared to $24 million for the second quarter of 2013, with the difference primarily due to severance expenses incurred in the second quarter.
Realized Gaines, Net
In the third quarter of 2013, we recognized $10 million of gains from the sale of $182 million of residential securities.
Provisions for Income Taxes
During the third quarter of 2013, we recognized a $5 million benefit that reflects a reduction in our full year 2013 tax provision estimate. See the Taxable Income and Dividends section on page 26 for further information.
Consolidated Sequoia Entities
We recognized net income of $1 million for the third quarter of 2013 related to our investments in consolidated Sequoia entities, as compared to net income of $6 million for the second quarter of 2013. This decrease is primarily attributable to a $4 million recovery of previous provisions for loan losses we recognized in the second quarter of 2013.
The allowance for loan losses at consolidated Sequoia entities was $23 million at September 30, 2013 and June 30, 2013. During the third quarter we observed an increase in delinquencies in our portfolio that we believe is the result of servicer changes on a large portion of our portfolio and not necessarily indicative of overall credit performance. The impact from increased delinquencies was offset by a decrease in observed loss severities, resulting in no material change in the allowance for loan losses at September 30, 2013. Charge-offs of $1 million during the third quarter of 2013 were largely offset by a loan loss provision of less than million. The charge-offs relate to existing delinquent loans that have transitioned to short-sale or have been foreclosed upon.
| THE REDWOOD REVIEW | 3RD QUARTER 2013 | 25 |
|
| ||
|
FINANCIAL INSIGHTS
|
Taxable Income and Dividends
Summary
As a REIT, Redwood is required to distribute to shareholders at least 90% of its REIT taxable income. REIT taxable income is defined as taxable income earned at Redwood and its qualified REIT subsidiaries. To the extent Redwood retains taxable income at the REIT, it is taxed at corporate tax rates. Redwood also earns taxable income at its taxable REIT subsidiaries (TRS), which it is not required to distribute.
Dividend Policy Overview
Our Board of Directors has maintained a policy of paying regular quarterly dividends, despite the fact that we have not been required to distribute dividends in recent years under the provisions of the Internal Revenue Code applicable to REITs. In November 2012, our Board announced its intention to distribute a regular quarterly dividend of $0.28 per share for 2013, an increase from the $0.25 per share regular quarterly dividend we distributed during 2012. On August 6, 2013, the Board of Directors declared a regular dividend of $0.28 per share for the third quarter, which was paid on September 30, 2013, to shareholders of record on September 13, 2013.
Dividend Distribution Requirement
Our estimated REIT taxable income was $20 million, or $0.24 per share, for the third quarter and $20 million, or $0.25 per share, for the second quarter of 2013. Under normal circumstances, our minimum REIT dividend requirement would be 90% of our annual REIT taxable income. However, we currently maintain a $70 million REIT net operating loss carryforward (NOL) that affords us the option of retaining REIT taxable income up to the NOL amount, tax free, rather than distributing it as dividends. Federal income tax rules require the dividends paid deduction to be applied to reduce taxable income before the applicability of NOLs is considered. Therefore, the NOL will not be reduced until REIT taxable income exceeds our dividend distributions. We do not expect this to occur in 2013, and, consequently, we do not expect to distribute dividends during 2013 in excess of our regular quarterly dividend.
Income Tax Characterization of Dividend for Shareholders
Irrespective of our minimum distribution requirement, federal income tax rules require that the actual dividends we distribute in 2013 be taxed at the shareholder level based on our full year 2013 taxable income plus net capital gains before application of any loss carryforwards. Based on this requirement, we expect most of the dividends we distribute in 2013 to be taxable as ordinary income to shareholders. Factors that can significantly affect the taxation of our 2013 dividends to shareholders include but are not limited to: (i) the timing of realized credit losses on legacy investments and (ii) capital gains on sales of securities.
(i) Our estimated REIT taxable income for the nine months ended September 30, 2013 included $9 million of realized credit losses on legacy investments that were taken in previous periods for GAAP reporting purposes. We anticipate an additional $69 million of tax credit losses to be realized over an estimated three- to five-year period based on the
| 26 | THE REDWOOD REVIEW | 3RD QUARTER 2013 |
|
|
|
FINANCIAL INSIGHTS
|
Income Tax Characterization of Dividend for Shareholders (continued)
securities we currently own. This is a decrease from $111 million at December 31, 2012 and $138 million at December 31, 2011. Even though the impact of realized losses on our current period taxable income is declining, our GAAP earnings, which have provisioned for these losses in prior periods, will likely continue to exceed our REIT taxable income and will be more reflective of our current operating performance.
(ii) For the nine months ended September 30, 2013, we realized net capital gains of $6 million at the REIT for tax purposes. We may sell additional securities in 2013 that could generate additional capital gains or losses. Net capital gains generated by the REIT for the entire year could increase the portion of our 2013 dividends that are characterized as ordinary income to our shareholders. However, if the REIT were to realize net capital losses for 2013, those losses would have no effect on the taxability of our 2013 dividends.
GAAP Provision for Income Tax at Taxable REIT Subsidiaries
To the extent we expect to pay tax at the corporate level (generally as a result of activity at our taxable REIT subsidiaries) we are required to record a tax provision for GAAP reporting purposes. We recorded a $5 million tax benefit for the third quarter of 2013, compared to a $3 million tax provision for the second quarter of 2013. The reduction quarter-over-quarter was primarily driven by a reduction in our estimated annual effective tax rate (ETR) due to a reduction of a valuation allowance. During the third quarter, we reduced the valuation allowance related to our capital loss carryforward deferred tax asset that was accumulated during past periods. We now expect to utilize this deferred tax asset within the carryforward period based on our revised expectation for realizing net capital gains on sales of appreciated securities. The provision is derived by multiplying our ETR by our pre-tax GAAP net income (not by our taxable income that we track separately). Our total tax provision of $9 million through the first nine months of 2013 is not intended to reflect the actual amount of tax we expect to pay for the year. This is due to favorable timing differences primarily related to income from our mortgage banking activities, and to a lesser extent, NOL and capital loss carryovers we maintain at our TRS. A reconciliation of GAAP and taxable income is set forth in Table 2 of the Financial Tables of this Redwood Review.
We do not expect to generate excess inclusion income in 2013, but in the event we do, it is our intention that it will be retained at our TRS and will not be passed through to our shareholders.
| THE REDWOOD REVIEW | 3RD QUARTER 2013 | 27 |
|
| ||
|
RESIDENTIAL INVESTMENTS
|
Summary
Redwood invests in securities that are backed by pools of residential loans. These residential investments consist of senior prime and non-prime securities as well as re-REMIC and subordinated securities (see definitions in the Glossary). Currently, the majority of the securities we own were purchased in the secondary securities market and were issued by third parties. However, a growing percentage of the securities we own were created through our Sequoia securitization platform.
This discussion includes all securities presented in our consolidated balance sheet, as well as our investments in Sequoia securitizations issued prior to 2012 that we are currently required to consolidate for financial reporting purposes under GAAP.
Information on the residential securities we own and underlying loan characteristics is set forth in Tables 5 through 8B in the Appendix. Information about the underlying loan characteristics of consolidated Sequoia securitizations and loans held for sale is set forth in Table 9 in the Appendix.
| u | Interest income generated by residential securities we own was $30 million in the third quarter of 2013, resulting in an annualized unlevered yield of 10% on the $1.2 billion of average amortized cost of these securities. |
| u | At September 30, 2013, the fair value of the residential securities we owned totaled $1.3 billion, consisting of $481 million in prime senior securities, $204 million in non-prime senior securities, $156 million in re-REMIC securities, and $483 million in subordinate securities. The amortized cost of our available-for-sale securities, which accounts for all but $131 million of securities held as trading securities, was 71% of face value and the fair value was 81% of face value at September 30, 2013. |
| u | We financed our holdings of residential securities with a combination of short-term debt secured by securities, the Residential Resecuritization, long-term debt and equity capital. During the third quarter of 2013, average short-term debt secured by securities was $350 million and the average asset-backed securities outstanding in the Residential Resecuritization was $118 million. |
| u | At September 30, 2013, residential securities we own (as a percentage of current market value) consisted of fixed-rate assets (52%), adjustable-rate assets (21%), hybrid assets that reset within the next year (19%), and hybrid assets that reset between 12 and 36 months (8%). |
| 28 | THE REDWOOD REVIEW | 3RD QUARTER 2013 |
|
|
|
RESIDENTIAL INVESTMENTS
|
Residential Investments (continued)
The following table presents information on residential securities at September 30, 2013. For GAAP, we account for the large majority of these securities as available-for-sale (AFS) and others as trading securities, and in both cases the securities are reported at their fair value at the report date.
|
Residential Securities at Redwood |
||||||||||||||||||||
| September 30, 2013 | ||||||||||||||||||||
| ($ in millions)
|
| |||||||||||||||||||
| Senior | ||||||||||||||||||||
| Prime | Non-prime | Re-REMIC | Subordinate | Total | ||||||||||||||||
| Available-for-sale securities | ||||||||||||||||||||
| Current face |
$ | 380 | $ | 226 | $ | 215 | $ | 661 | $ | 1,481 | ||||||||||
| Credit reserve |
(13 | ) | (13 | ) | (34 | ) | (77 | ) | (136 | ) | ||||||||||
| Net unamortized discount |
(47 | ) | (40 | ) | (79 | ) | (123 | ) | (289 | ) | ||||||||||
| Amortized cost |
320 | 173 | 102 | 462 | 1,056 | |||||||||||||||
| Unrealized gains |
45 | 23 | 54 | 34 | 156 | |||||||||||||||
| Unrealized losses |
(1 | ) | (1 | ) | 0 | (17 | ) | (18 | ) | |||||||||||
| Trading securities
|
|
117
|
|
|
9
|
|
|
0
|
|
|
5
|
|
|
131
|
| |||||
| Fair value of residential securities | $ | 481 | $ | 204 | $ | 156 | $ | 483 | $ | 1,325 | ||||||||||
Investments in Consolidated Sequoia Entities
| u | We recognized net income of $1 million in the third quarter of 2013 from our investments in consolidated Sequoia entities, compared to net income of $6 million in the second quarter of 2013. This decrease is primarily attributable to $4 million of recovery of previous provision for loan losses recorded in the second quarter of 2013. |
| u | Serious delinquencies on loans held at consolidated Sequoia entities (90+ days delinquent) were $69 million (or 3.70% of outstanding loan balances) at September 30, 2013, compared to $65 million (or 3.27% of outstanding loan balances) at June 30, 2013. Net charge-offs decreased to $1 million in the third quarter from $2 million in the second quarter of 2013, and were related to existing delinquent loans that have transitioned to short sale or been foreclosed upon at September 30, 2013. |
| THE REDWOOD REVIEW | 3RD QUARTER 2013 | 29 |
|
|
|
RESIDENTIAL MORTGAGE BANKING ACTIVITIES
|
Summary
We purchase newly originated residential loans that meet our collateral criteria from third-party originators (which we refer to as “sellers”) on a flow or bulk basis. Loans acquired through this process (our “conduit”) are expected to be securitized through Sequoia securitization entities, which acquire residential mortgage loans from our conduit and issue RMBS backed by these loans, or sold as whole loans. Most of the senior or AAA rated RMBS issued by Sequoia entities are sold to third-party investors. Redwood generally acquires the AA, A, and BBB rated RMBS issued by Sequoia entities as well as non-investment grade securities issued by Sequoia entities (those rated BB or lower and those that are unrated). Redwood has also acquired interest-only securities issued by Sequoia entities. We also earn fees from MSRs we acquire directly or retain from residential loans that we acquire and subsequently transfer to third parties. These fees are reported net of fees paid to a licensed sub-servicer that performs servicing functions on our behalf. MSRs are initially recognized and carried at their estimated fair values, and changes in the fair value of MSRs are reported in mortgage banking activities, net.
| u | During the third quarter of 2013, we identified $1.0 billion of loans for purchase and we acquired $1.3 billion of loans, compared to the second quarter of 2013, when we identified $2.5 billion of loans for purchase and we acquired $2.6 billion of loans. |
| u | During the third quarter of 2013, we completed three prime jumbo securitizations totaling $1.2 billion and 17 whole loan sales transactions totaling $600 million, compared to the second quarter of 2013 when we completed four prime jumbo securitizations totaling $1.8 billion and six whole loan sales transaction totaling $286 million. |
| u | In the third quarter of 2013, industry-wide private-label RMBS issuance totaled $3.5 billion, compared to $4.4 billion in the second quarter of 2013. For the first nine months of 2013, industry-wide private- label RMBS issuance was $12.2 billion, compared to $2.5 billion for the first nine months of 2012 and $3.5 billion for all of 2012. Redwood has sponsored, through its Sequoia platform, $7.2 billion, or 46%, of the $15.7 billion of total private-label RMBS issuance since the start of 2012. |
| u | During the third quarter of 2013, we acquired $80 million of investments from Sequoia securitizations we sponsored, compared to $124 million of investments we acquired from Sequoia securitizations in the second quarter of 2013. At September 30, 2013, retained investments acquired from Sequoia securitizations totaled $504 million. |
| u | In the third quarter of 2013, Redwood’s investment in MSRs increased to $60 million, as we added $17 million of MSRs associated with $1.6 billion of residential loans, which increased the portfolio of loans associated with Redwood’s investment in MSRs to $5.6 billion. Included in this amount is $3 million of MSRs acquired in the third quarter of 2013, associated with a $300 million pool of conforming loans. The GAAP carrying value of these MSRs is equal to 1.08% of the principal balance of the associated residential loans. |
| u | At September 30, 2013, the fair value of our residential loans held for sale was $728 million, down from $1.2 billion at June 30, 2013. At September 30, 2013, our pipeline of residential loans identified for purchase was $595 million. |
| u | Active sellers increased to 112 at September 30, 2013, from 104 at June 30, 2013. |
| 30 | THE REDWOOD REVIEW | 3RD QUARTER 2013 |
|
|
|
COMMERCIAL INVESTMENTS AND MORTGAGE BANKING ACTIVITIES
|
Summary
Our commercial platform provides debt solutions for borrowers on stabilized commercial properties nationwide. Redwood originates senior mortgages, mezzanine loans, and preferred equity investments. We originate and structure commercial mortgages, distribute senior loans via securitization and/or sales, and transfer subordinate debt investments to be retained in our REIT investment portfolio. We also collaborate with major lending institutions (including commercial banks, life insurance companies, CMBS issuers, and the GSEs) to originate subordinate debt investments for our REIT investment portfolio.
| u | Income from commercial mortgage banking activities was $3 million in the third quarter of 2013, compared to $6 million in the second quarter of 2013. |
| u | During the third quarter of 2013, we originated and funded 12 senior commercial loans for $113 million, and sold 18 senior loans totaling $238 million. This compares to the second quarter of 2013 when we originated and funded 10 senior loans of $150 million, and sold six senior loans totaling $74 million. |
| u | For the first nine months of 2013, we originated a total of $562 million of senior commercial loans. |
| u | At September 30, 2013, there were four senior commercial loans held-for-sale with a carrying value of $27 million, including those that were table funded by third parties. |
| u | During the third quarter of 2013, we originated two commercial mezzanine loans for $9 million, compared to six mezzanine loans for $19 million in the second quarter of 2013. At September 30, 2013, our unsecuritized and securitized portfolio of commercial mezzanine loans held-for-investment were $83 million and $270 million, respectively. |
| u | At September 30, 2013, our commercial mezzanine loans held-for-investment had an outstanding principal balance of $362 million, an allowance for loan losses of $7 million, and a carrying value of $352 million. |
| u | On average, our commercial held-for-investment mezzanine loans have a maturity of more than five years, an unlevered yield in excess of 10% per annum before credit costs, a loan-to-value ratio of 73% at origination, and a debt service coverage ratio at origination of 1.30x based on our cashflows at origination. |
| THE REDWOOD REVIEW | 3RD QUARTER 2013 | 31 |
|
|
|
COMMERCIAL INVESTMENTS AND MORTGAGE BANKING ACTIVITIES
|
Commercial Mortgage Banking Activities (continued)
The following table and charts provide information on our commercial mezzanine loan portfolio as of September 30, 2013.
|
Commercial Mezzanine Loans at Redwood | ||||||||
| September 30, 2013
| ||||||||
| Property Type | Number of Loans | Original Weighted Average DSCR (1) |
Original Weighted Average |
Average Loan Size ($ millions) | ||||
|
Multifamily
|
22 | 1.26x | 79% | $5 | ||||
|
Office
|
8 | 1.35x | 72% | 10 | ||||
|
Hospitality
|
9 | 1.38x | 62% | 9 | ||||
|
Retail
|
5 | 1.16x | 76% | 10 | ||||
|
Self Storage
|
4 | 1.34x | 77% | 6 | ||||
|
Industrial
|
2 | 1.37x | 70% | 2 | ||||
|
Total Portfolio
|
50 | 1.30x | 73% | $7 | ||||
| (1) | The debt service coverage ratio (DSCR) is defined as the property’s annual net operating income divided by the annual principal and interest payments. A DSCR of less than 1.00x would mean there was insufficient property cash flow available to the borrower to make principal and interest payments, while a DSCR of more than 1.00x would mean there was positive cash flow after payment of principal and interest. The weighted average DSCRs in this table are based on the ratios at the time the loans were originated and are not based on subsequent time periods during which there may have been increases or decreases in each property’s operating income. |
| (2) | The loan-to-value (“LTV”) calculation is defined as the sum of the senior and all subordinate loan amounts divided by the value of the property. The weighted average LTV ratios in this table are based on the ratios at the time the loans were originated and are not based on subsequent time periods during which there may have been increases or decreases in each property’s value. |
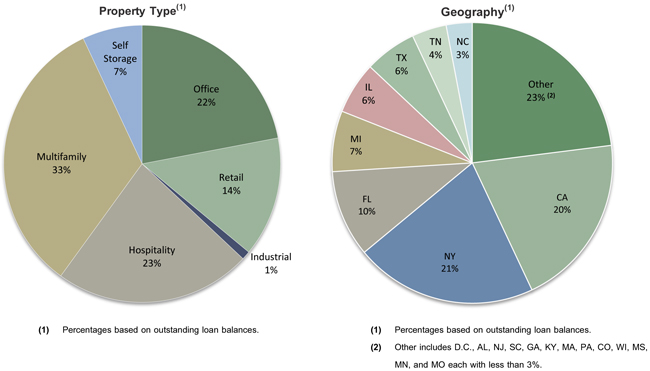
| 32 | THE REDWOOD REVIEW | 3RD QUARTER 2013 |
This Page Intentionally Left Blank
| 33 |
This Page Intentionally Left Blank
| 34 |

|
|
|
REDWOOD’S BUSINESS STRATEGY
|
Redwood’s Business Strategy
This section of the Redwood Review provides insight into Redwood’s strategic focus and our business model.
Strategic Focus
As the financial world engaged in significant deleveraging at the onset of the financial crisis, and later became awash with liquidity, we made a strategic decision in late 2009 to invest in and build out our residential and commercial loan platforms. We did this in order to create our own steady sources of attractive investments and fee-generating opportunities as we assumed that large bank originators, flush with excess liquidity, would be more likely to retain their originations for their own investment portfolios than sell them into the secondary market to aggregators such as Redwood.
There is commonality between our residential and commercial business activities. In both cases, we have established ourselves as an intermediary between borrowers and senior investors in the capital markets. This strategy works well with the structure of our balance sheet and the talents and extensive relationships of the professionals who make up our residential and commercial teams.
On the residential side, our focus since mid-2010 has been to acquire prime, jumbo mortgages for sale through private-label securitization, and bulk sales. While the initial market opportunity appeared small, our confidence was driven by three big business assumptions: that the government would eventually reduce its outsized role in the mortgage market; that new bank regulation, Basel III, and legacy portfolio issues would open up an opportunity for independent mortgage companies; and that traditional private triple-A institutional investors would return to the market to provide attractive financing for prime residential loans through their investment in private-label securities (PLS). We are now seeing our business assumptions play out, although Federal Reserve monetary policy, competitive factors, and market conditions will affect the extent to which these will positively impact our business over the near-term.
On the commercial side, we set our sights on an inevitable wave of commercial loan refinancing demand, brought about by the pre-crisis era of high-leverage lending. An immediate need was identified for mezzanine capital that could bridge the gap between commercial borrowers’ funding needs and what traditional senior lenders would provide in a deleveraged world. We also assumed that we would eventually position our platform to become an originator of senior commercial loans, offering value through greater flexibility and certainty of execution for borrowers. We have made progress in both areas, as we have originated more than $300 million of mezzanine loans since late 2010, and have originated more than $600 million of senior commercial loans since mid-2012.
| 36 | THE REDWOOD REVIEW | 3RD QUARTER 2013 |
|
|
|
REDWOOD’S BUSINESS STRATEGY
|
Redwood’s Business Model
Our operating model has evolved substantially since the financial crisis began in 2007. This evolution has, in part, been driven by our desire to build a franchise value-producing business model positioned to capitalize on the expected eventual reform of Fannie Mae and Freddie Mac (the Agencies) and to be competitive in the post-crisis era of greater regulatory and capital requirements for all mortgage market participants, particularly for the more heavily regulated banks.
Today, Redwood is an internally-managed specialty finance company focused on residential and commercial mortgage banking and mortgage-related investments. While we are structured as a REIT for tax purposes, we operate more like a mortgage banking company than most other publicly-traded mortgage REITs.
Below is an illustration of our three primary revenue sources: our residential and commercial mortgage banking activities, which are generally carried out through taxable REIT subsidiaries, and our tax-advantaged investment portfolio, which is housed at our REIT, as shown in the chart below.
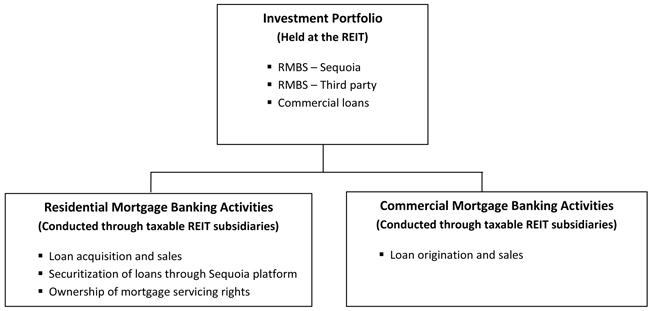
| THE REDWOOD REVIEW | 3RD QUARTER 2013 | 37 |
|
|
|
REDWOOD’S BUSINESS STRATEGY
|
Residential Mortgage Banking Activities
We conduct our residential mortgage banking activities through taxable REIT subsidiaries that pay taxes and can generally retain earnings and reinvest the cash flows generated therein. Earnings and cash flow from these activities can also be up-streamed to Redwood Trust, Inc. to be passed through to shareholders, if desired.
Our residential mortgage banking activities primarily consist of operating a jumbo prime mortgage loan conduit, which acquires jumbo residential mortgages and the associated mortgage servicing rights from third-party originators and subsequently sells those loans through securitization transactions and bulk sales. In carrying out this aspect of our business, we buy individual closed loans one-by-one (on a “flow” basis) from commercial banks and mortgage companies located throughout the U.S. We periodically augment our flow loan acquisitions with bulk portfolio acquisitions. Although we do not originate or directly service residential loans, we have a complete mortgage banking team with a skill set in underwriting, compliance, quality control, secondary marketing, and warehousing. Our current loan acquisition strategy differs from the pre-credit crisis period when we were more focused on acquiring loans in bulk through a competitive bidding process. (Aside from the lack of any material bulk sale activity of newly originated jumbo mortgage loans, we believe the bulk model has lower barriers to entry.) After accumulating a sufficient aggregate principal amount of loans, we typically securitize them through our Sequoia securitization platform and sell the senior securities to a broker/dealer for redistribution to triple-A investors. The subordinate securities are generally retained and held for investment by Redwood Trust, Inc., our tax-advantaged REIT parent company. Most of the loans acquired have been securitized, but we also sell whole loans to banks and other buyers.
In the fourth quarter of 2013, we expanded our product set by entering into the conforming segment of the residential mortgage banking business and began to acquire loans (and the related mortgage servicing rights) that conform to the standards of Fannie Mae and Freddie Mac. We expect to acquire the conforming loans from our existing jumbo loan seller base, sell these loans to Fannie Mae and Freddie Mac, and to use our existing platform (systems and personnel) for this conforming loan business.
Commercial Mortgage Banking Activities
We conduct our commercial mortgage banking activities through taxable REIT subsidiaries that pay taxes but have the ability to retain earnings and cash flow for reinvestment. In summary, we operate as a commercial mortgage lender by originating loans directly to borrowers and through a correspondent network. We may split originated commercial loans into senior and mezzanine tranches. We typically sell the senior tranches into the capital markets (such as to CMBS conduits, banks, and insurance companies) on a “best execution basis,” and retain the mezzanine tranches for our REIT investment portfolio held at Redwood Trust, Inc.
Investment Portfolio
Our investment portfolio is primarily held within our REIT, and includes investments in RMBS issued in Sequoia securitization transactions that result from our residential mortgage banking activities as well as RMBS issued by third parties, and commercial mezzanine loans from our commercial mortgage banking activities. Other investments such as mortgage servicing rights, residential and commercial loans held for sale, and certain other mortgage-related investments that are not considered REIT qualifying assets are held at taxable REIT subsidiaries but are managed as part of our investment portfolio. As a REIT, we must distribute a minimum of 90% of pretax earnings from our investment portfolio to shareholders to avoid corporate income tax liability on those earnings.
| 38 | THE REDWOOD REVIEW | 3RD QUARTER 2013 |
|
|
|
GLOSSARY
|
ADJUSTABLE-RATE MORTGAGES (ARM)
Adjustable-rate mortgages (“ARMs”) are loans that have coupons that adjust at least once per year. We make a distinction between ARMs (loans with a rate adjustment at least annually) and hybrids (loans that have a fixed-rate period of 2-10 years and then become adjustable-rate).
AGENCY
Agency refers to government-sponsored enterprises (“GSEs”), including Federal National Mortgage Association (“Fannie Mae”), Federal Home Loan Mortgage Corporation (“Freddie Mac”), and Government National Mortgage Association (“Ginnie Mae”).
ALT-A SECURITIES and ALT-A LOANS
Alt-A securities are residential mortgage-backed securities backed by loans that have higher credit quality than subprime and lower credit quality than prime. Alt-A originally represented loans with alternative documentation, but the definition has shifted over time to include loans with additional risk characteristics and in some cases investor loans. In an Alt-A loan, the borrower’s income may not be verified, and in some cases, may not be disclosed on the loan application. Alt-A loans may also have expanded criteria that allow for higher debt-to-income ratios with higher accompanying loan-to-value ratios than would otherwise be permissible for prime loans.
AMORTIZED COST
Amortized cost is the initial acquisition cost of an available-for-sale (“AFS”) security, minus principal repayments or principal reductions through credit losses, plus or minus premium or discount amortization. At the point in time an AFS security is deemed other-than-temporarily impaired, the amortized cost is adjusted (by changing the amount of unamortized premium or discount) by the amount of other-than temporary impairment taken through the income statement.
ASSET-BACKED SECURITIES (ABS)
Asset-backed securities (“ABS”) are securities backed by financial assets that generate cash flows. Each ABS issued from a securitization entity has a unique priority with respect to receiving principal and interest cash flows and absorbing any credit losses from the assets owned by the entity.
AVAILABLE-FOR-SALE (AFS)
An accounting method for debt and equity securities in which the securities are reported at their fair value. Positive changes in the fair value are accounted for as increases to stockholders’ equity and do not flow through the income statement. Negative changes in fair value may be recognized through the income statement or balance sheet.
B-NOTES
B-Notes are subordinate interests in commercial mortgage debt which are either (i) evidenced by a subordinated promissory note secured by the same mortgage that also secures the senior debt relating to the same property or (ii) junior participation interests in mortgage debt that are subordinate to senior participation interests in the same mortgage debt. B-Notes typically provide the holder with certain rights to approve modifications to related lending agreements and to trigger foreclosure under the mortgage following an event of default. B-Notes also typically provide the holder certain limited rights to cure a borrower default under senior debt secured by the same mortgage in order to keep the senior debt current and avoid foreclosure.
| THE REDWOOD REVIEW | 3RD QUARTER 2013 | 39 |
|
|
|
GLOSSARY
|
BOOK VALUE (GAAP)
Book value is the value of our common equity in accordance with GAAP.
COLLATERALIZED DEBT OBLIGATION (CDO) SECURITIZATIONS
The securitization of a diverse pool of assets.
COMMERCIAL MORTGAGE-BACKED SECURITIES (CMBS)
A type of mortgage-backed security that is secured by one or more loans on commercial properties.
CONSTANT (or CONDITIONAL) PREPAYMENT RATE (CPR)
Constant (or conditional) prepayment rate (“CPR”) is an industry-standard measure of the speed at which mortgage loans prepay. It approximates the annual percentage rate at which a pool of loans is paying down due to unscheduled principal prepayments.
CORE EQUITY
Core equity is not a measure calculated in accordance with GAAP. GAAP equity includes mark-to-market adjustments for some of our assets and interest rate agreements in “accumulated other comprehensive income (loss).” Core equity excludes accumulated other comprehensive income (loss). Core equity in some ways approximates what our equity value would be if we used historical amortized cost accounting exclusively. A reconciliation of core equity to GAAP appears in the Table 3 in the Financial Tables in this Review.
CREDIT SUPPORT
Credit support is the face amount of securities subordinate (or junior) to the applicable security that protects the security from credit losses and is generally expressed as a percentage of the securitization’s underlying pool balance.
DEBT
Debt is an obligation of Redwood. See Long-term debt and Short-term debt.
FALLOUT
The percentage of loans that an originator plans or commits to sell to a buyer that ultimately do not close and are not delivered to the buyer.
FASB
Financial Accounting Standards Board.
FHFA
The FHFA refers to the Federal Housing Finance Authority.
GAAP
Generally Accepted Accounting Principles in the United States.
GOVERNMENT SPONSORED ENTERPRISE (GSE)
A government sponsored enterprise is a financial services corporation created by the United States Congress to enhance the flow of credit to targeted sectors of the economy. Among the GSEs charted by Congress are Fannie Mae, Freddie Mac, and Ginnie Mae.
| 40 | THE REDWOOD REVIEW | 3RD QUARTER 2013 |
|
|
|
GLOSSARY
|
INTEREST-ONLY SECURITIES (IOs)
Interest-only securities (“IOs”) are specialized securities created by securitization entities where the projected cash flows generated by the underlying assets exceed the cash flows projected to be paid to the securities that are issued with principal balances. Typically, IOs do not have a principal balance and they will not receive principal payments. Interest payments to IOs usually equal an interest rate formula multiplied by a “notional” principal balance. The notional principal balances for IOs are typically reduced over time as the actual principal balance of the underlying pool of assets pays down, thus reducing the cash flows to the IOs over time. Cash flows on IOs are typically reduced more quickly when asset prepayments increase.
INVESTMENT CAPACITY
The amount of capacity we estimate that we have to invest in new assets. Our estimate of our investment capacity takes into account, among other things, cash on hand, cash we estimate we could raise by prudently increasing short-term borrowings, and cash needed to cover short-term operations, working capital, and a liquidity cushion.
JUMBO LOAN
A jumbo loan is a mortgage loan that generally conforms to the underwriting standards of Fannie Mae and Freddie Mac except that the dollar amount of the loan exceeds the maximum limit set by the two GSEs for loans salable to the two companies.
LEVERAGE RATIOS
When determining Redwood’s financial leverage, traditional leverage ratios may be misleading in some respects if consolidated ABS issued from securitization entities are included as part of Redwood’s obligations when calculating this or similar ratios. Because of the requirement to consolidate the independent securitization entities for GAAP accounting purposes, it appears that Redwood is highly leveraged, with total consolidated liabilities significantly greater than equity. The obligations of these securitization entities are not obligations of Redwood.
LONG-TERM DEBT
Long-term debt is debt that is an obligation of Redwood that is not payable within a year and includes convertible debt, junior subordinated notes and trust preferred securities. We generally treat long-term debt as part of our capital base when it is not payable in the near future.
MARK-TO-MARKET (MTM) ACCOUNTING
Mark-to-market (“MTM”) accounting uses estimated fair values of assets, liabilities, and hedges. Many assets on our consolidated balance sheet are carried at their fair value rather than amortized cost. Taxable income is generally not affected by market valuation adjustments.
MARKET VALUATION ADJUSTMENTS (MVAs)
Market valuation adjustments (“MVAs”) are changes in market values for certain assets and liabilities that are reported through our GAAP income statement. They include all changes in market values for assets and liabilities accounted for at fair value, such as trading securities and derivatives. They also include the credit portion of other-than-temporary impairments on securities available-for-sale, as well as impairments of loans held-for-sale and REO properties.
| THE REDWOOD REVIEW | 3RD QUARTER 2013 | 41 |
|
|
|
GLOSSARY
|
MEZZANINE LOAN
A mezzanine loan is a loan secured by the membership interests, partnership interests, and/or stock in a single purpose entity formed to own a commercial property, for example. If the mezzanine borrower fails to make its payments or otherwise defaults under the mezzanine loan documents, the mezzanine lender may pursue its remedies, including taking control of the single purpose entity that owns the property.
MORTGAGE SERVICING RIGHT (MSR)
A mortgage servicing right (“MSR”) gives the holder the contractual right to service a mortgage loan. MSRs typically include the right to collect monthly mortgage principal and interest payments, as well as related tax and insurance payments, from borrowers, disburse funds to the mortgage debt holders and remit related insurance and tax payments, collect late payments, and process modifications and foreclosures. MSRs are created when mortgage loans are sold in a transaction in which the seller retains the right to service the loans. The holder of an MSR receives a monthly servicing fee (which generally ranges from 0.25% to 0.375% per annum of the outstanding principal balance of the related mortgage loan), which is deducted from the borrower’s monthly interest payments. For accounting purposes, MSRs are capitalized at the net present value of the servicing fee less the servicing cost. When Redwood holds MSRs relating to residential mortgage loans, it retains a sub-servicer to carry out actual servicing functions, as Redwood does not directly service residential mortgage loans.
NON-PRIME SECURITIES
Non-prime securities are Alt-A, option ARM, and subprime securities. See definitions of Alt-A, option ARM, and subprime securities.
OPTION ARM LOAN
An option ARM loan is a residential mortgage loan that generally offers a borrower monthly payment options such as: 1) a minimum payment that results in negative amortization; 2) an interest-only payment; 3) a payment that would fully amortize the loan over an original 31-year amortization schedule; and, 4) a payment that would fully amortize the loan over a 15-year amortization schedule. To the extent the borrower has chosen an option that is not fully amortizing the loan (or negatively amortizing the loan), after a period — usually five years or once the negatively amortized loan balance reaches a certain level (generally 15% to 25% higher than the original balance) — the loan payments are recast. This recast provision resets the payment at a level that fully amortizes the loan over its remaining life and the new payment may be materially different than under the borrowers’ previous option.
PREFERRED EQUITY
A preferred equity investment is an investment in preferred equity of a special purpose entity that directly or indirectly owns a commercial property. An investor in preferred equity is typically entitled to a preferred return (relative to a holder of common equity of the same entity) and has the right, if the preferred return is not paid, to take control of the entity (and thereby control the underlying commercial property).
PRIME RESIDENTIAL REAL ESTATE LOANS
Prime loans are residential loans with higher quality credit characteristics, such as borrowers with higher FICO credit scores, lower loan-to-value ratios, lower debt-to-income ratios, greater levels of other assets, and more documentation.
| 42 | THE REDWOOD REVIEW | 3RD QUARTER 2013 |
|
|
|
GLOSSARY
|
PRIME SECURITIES
Prime securities are residential mortgage-backed securities backed by prime loans, generally with balances greater than conforming loan limits. Prime securities are typically backed by loans that have relatively high weighted average FICO scores (e.g., 700 or higher at origination), low weighted average LTVs (e.g., 75% or less at origination), limited concentrations of investor properties, and low percentages of loans with low FICO scores or high loan-to-value ratios.
PROFITABILITY RATIOS
Many financial institution analysts use asset-based profitability ratios such as interest rate spread and interest rate margin when analyzing financial institutions. These are asset-based measures. Since we consolidate the assets and liabilities of securitization entities for GAAP purposes, our total GAAP assets and liabilities may vary over time, and may not be comparable to assets typically used in profitability calculations for other financial institutions. As a result, we believe equity-based profitability ratios may be more appropriate than asset-based measures for analyzing Redwood’s operations and results. We believe, for example, that net interest income as a percentage of equity is a useful measure of profitability. For operating expenses, we believe useful measures are operating efficiency ratio (operating expenses as a percentage of net interest income) and operating expenses as a percentage of equity. We provide various profitability ratios in Table 4 in the Financial Tables in this Review.
REAL ESTATE INVESTMENT TRUST (REIT)
A real estate investment trust (“REIT”) is an entity that makes a tax election to be taxed as a REIT, invests in real estate assets, and meets other REIT qualifications, including the distribution as dividends of at least 90% of its REIT taxable income. A REIT’s profits are not taxed at the corporate level to the extent that these profits are distributed as dividends to stockholders, providing an operating cost savings. On the other hand, the requirement to pay out as dividends most of the REIT’s taxable profits means it can be harder for a REIT to grow using only internally-generated funds (as opposed to raising new capital).
REAL ESTATE OWNED (REO)
Real estate owned (“REO”) refers to real property owned by the lender or loan owner that has been acquired through foreclosure.
REIT SUBSIDIARY
A REIT subsidiary is a subsidiary of a REIT that is taxed as a REIT.
REIT TAXABLE INCOME
REIT taxable income is not a measure calculated in accordance with GAAP. REIT taxable income is pretax income calculated for tax purposes at Redwood including only its qualifying REIT subsidiaries (i.e., excluding its taxable subsidiaries, with certain adjustments). REIT taxable income is an important measure as it is the basis of our dividend distribution requirements. We must annually distribute at least 90% of REIT taxable income as dividends to shareholders. As a REIT, we are not subject to corporate income taxes on the REIT taxable income we distribute. We pay corporate income tax on the REIT taxable income we retain, if any (and we are permitted to retain up to 10% of total REIT taxable income). A reconciliation of REIT taxable income to GAAP income appears in Table 2 in the Financial Tables in this Review.
| THE REDWOOD REVIEW | 3RD QUARTER 2013 | 43 |
|
|
|
GLOSSARY
|
REMIC
A real estate mortgage investment conduit (“REMIC”) is a special purpose vehicle used to pool real estate mortgages and issue mortgage-backed securities. REMICs are typically exempt from tax at the entity level. REMICs may invest only in qualified mortgages and permitted investments, including single family or multifamily mortgages, commercial mortgages, second mortgages, mortgage participations, and federal agency pass-through securities.
RE-REMIC SECURITY
A re-REMIC is a re-securitization of asset-backed securities. The cash flows from and any credit losses absorbed by the underlying assets can be redirected to the resulting re-REMIC securities in a variety of ways.
RESECURITIZATION
A resecuritization is a securitization of two or more mortgage-backed securities into a new mortgage-backed security.
RESIDENTIAL MORTGAGE-BACKED SECURITIES (RMBS)
A type of mortgage-backed security that is backed by a pool of mortgages on residential properties.
RETURN ON EQUITY (ROE) and ADJUSTED RETURN ON EQUITY
ROE is the amount of profit we generate each year per dollar of equity capital and equals GAAP income divided by GAAP equity. Adjusted ROE is not a measure calculated in accordance with GAAP — it is GAAP income divided by core equity.
SENIOR SECURITIES
Generally, senior securities have the least credit risk in a securitization transaction because they are generally the last securities to absorb credit losses. In addition, the senior securities have the highest claim on the principal and interest payments (after the fees to servicers and trustees are paid). To further reduce credit risk, most if not all, principal collected from the underlying asset pool is used to pay down the senior securities until certain performance tests are satisfied. If certain performance tests are satisfied, principal payments are shared between the senior securities and the subordinate securities, generally on a pro rata basis. At issuance, senior securities are generally triple A-rated.
SEQUOIA
Sequoia is the brand name for securitizations of residential real estate loans Redwood sponsors. Sequoia entities are independent securitization entities that acquire residential mortgage loans and create and issue asset-backed securities (“ABS”) backed by these loans. Most of the loans that Sequoia entities acquire are prime-quality loans. Most of the senior ABS created by Sequoia are sold to third-party investors. Redwood usually acquires most of the subordinated ABS and occasionally acquires the interest-only securities (“IOs”).
SHORT-TERM DEBT
Short-term debt is debt that is an obligation of Redwood and payable within a year. We may obtain this debt from a variety of Wall Street firms, banks, and other institutions. We may issue these or other forms of short term debt in the future. We may use short-term debt to finance the accumulation of assets prior to sale to a securitization entity and to finance investments in loans and securities.
SUBORDINATE DEBT INVESTMENTS
Subordinate Debt Investments mean Mezzanine Loans, Preferred Equity, and B-Notes.
| 44 | THE REDWOOD REVIEW | 3RD QUARTER 2013 |
|
|
|
GLOSSARY
|
SUBORDINATE SECURITIES (JUNIOR SECURITIES or NON-SENIOR SECURITIES)
Subordinate securities absorb the initial credit losses from a securitization structure, thus protecting the senior securities. Subordinate securities have a lower priority to receive principal and interest payments than the senior securities. Subordinate securities receive little, if any, principal payments until certain performance tests are satisfied. If certain performance tests are satisfied, principal payments are shared between the senior securities and the subordinate securities, generally on a pro rata basis. Subordinate securities generally receive interest payments even if they do not receive principal payments. At issuance, subordinate securities are generally rated double-A or below.
SUBPRIME SECURITIES
Subprime securities are residential mortgage-backed securities backed by loans to borrowers who typically have lower credit scores and/or other credit deficiencies that prevent them from qualifying for prime or Alt-A mortgages and may have experienced credit problems in the past, such as late payments or bankruptcies. To compensate for the greater risks and higher costs to service the loans, subprime borrowers pay higher interest rates, points, and origination fees.
TAXABLE INCOME
Taxable income is not a measure calculated in accordance with GAAP. Taxable income is pre-tax income for Redwood and all its subsidiaries as calculated for tax purposes. Taxable income calculations differ significantly from GAAP income calculations. A reconciliation of taxable income to GAAP income appears in Table 2 in the Financial Tables in this Review.
TAXABLE SUBSIDIARY
A taxable subsidiary is a subsidiary of a REIT that is not taxed as a REIT and thus pays taxes on its income. A taxable subsidiary is not limited to investing in real estate and it can choose to retain all of its after-tax profits.
TO BE ANNOUNCED (TBA)
A term used to describe a forward Agency mortgage-backed securities trade. Pass-through securities issued by Freddie Mac, Fannie Mae and Ginnie Mae trade in the TBA market. The term TBA is derived from the fact that the actual mortgage-backed security that will be delivered to fulfill a TBA trade is not designated at the time the trade is made. The securities are “to be announced” 48 hours prior to the established trade settlement date.
| THE REDWOOD REVIEW | 3RD QUARTER 2013 | 45 |
|
|
|
GLOSSARY
|
| 46 | THE REDWOOD REVIEW | 3RD QUARTER 2013 |


|
Table 1: GAAP Earnings ($ in thousands, except per share data) | 48
| ||
| 2013 Q3 |
2013 Q2 |
2013 Q1 |
2012 Q4 |
2012 Q3 |
2012 Q2 |
2012 Q1 |
2011 Q4 |
2011 Q3 |
Nine Months 2013 |
Nine Months 2012 |
||||||||||||||||||||||||||||||||||
| Interest income |
$ | 50,139 | $ | 51,195 | $ | 47,361 | $ | 48,025 | $ | 54,001 | $ | 52,629 | $ | 51,356 | $ | 48,512 | $ | 45,096 | $ | 148,695 | $ | 157,986 | ||||||||||||||||||||||
| Discount amortization on securities, net |
8,785 | 8,153 | 7,672 | 7,103 | 7,317 | 8,318 | 8,258 | 9,339 | 10,179 | 24,610 | 23,893 | |||||||||||||||||||||||||||||||||
| Premium amortization expense on loans |
(1,504 | ) | (1,629 | ) | (1,508 | ) | (1,731 | ) | (1,595 | ) | (1,424 | ) | (872 | ) | (1,356 | ) | (1,879 | ) | (4,641 | ) | (3,891 | ) | ||||||||||||||||||||||
| Total interest income |
57,420 | 57,719 | 53,525 | 53,397 | 59,723 | 59,523 | 58,742 | 56,495 | 53,396 | 168,664 | 177,988 | |||||||||||||||||||||||||||||||||
| Interest expense on short-term debt |
(5,227 | ) | (4,686 | ) | (3,808 | ) | (2,526 | ) | (2,737 | ) | (2,299 | ) | (1,827 | ) | (764 | ) | (78 | ) | (13,721 | ) | (6,863 | ) | ||||||||||||||||||||||
| Interest expense on ABS |
(8,291 | ) | (8,771 | ) | (9,399 | ) | (15,106 | ) | (21,379 | ) | (22,350 | ) | (24,565 | ) | (24,030 | ) | (19,907 | ) | (26,461 | ) | (68,294 | ) | ||||||||||||||||||||||
| ABS issuance expense amortization |
(811 | ) | (882 | ) | (985 | ) | (915 | ) | (552 | ) | (602 | ) | (569 | ) | (630 | ) | (545 | ) | (2,678 | ) | (1,723 | ) | ||||||||||||||||||||||
| ABS interest rate agreement expense |
(62 | ) | (68 | ) | (87 | ) | (11,561 | ) | (1,127 | ) | (1,136 | ) | (1,204 | ) | (1,171 | ) | (1,233 | ) | (217 | ) | (3,467 | ) | ||||||||||||||||||||||
| ABS issuance premium amortization (expense) income |
(548 | ) | (576 | ) | (542 | ) | (412 | ) | (113 | ) | (115 | ) | (115 | ) | (136 | ) | (170 | ) | (1,666 | ) | (343 | ) | ||||||||||||||||||||||
| Total ABS expense consolidated from trusts (1) |
(9,712 | ) | (10,297 | ) | (11,013 | ) | (27,994 | ) | (23,171 | ) | (24,203 | ) | (26,453 | ) | (25,967 | ) | (21,855 | ) | (31,022 | ) | (73,827 | ) | ||||||||||||||||||||||
| Interest expense on long-term debt |
(6,894 | ) | (6,480 | ) | (3,534 | ) | (2,451 | ) | (2,377 | ) | (2,379 | ) | (2,376 | ) | (2,384 | ) | (2,384 | ) | (16,908 | ) | (7,132 | ) | ||||||||||||||||||||||
| Net interest income |
35,587 | 36,256 | 35,170 | 20,426 | 31,438 | 30,642 | 28,086 | 27,380 | 29,079 | 107,013 | 90,166 | |||||||||||||||||||||||||||||||||
| (Provision for) reversal of provision for loan losses |
(1,727 | ) | 3,272 | (2,038 | ) | (3,394 | ) | (1,319 | ) | 1,340 | (275 | ) | (7,784 | ) | (3,978 | ) | (493 | ) | (254 | ) | ||||||||||||||||||||||||
| Other market valuation adjustments, net |
462 | (6,258 | ) | (303 | ) | 1,941 | 957 | (86 | ) | (1,273 | ) | (9,682 | ) | (13,448 | ) | (6,099 | ) | (402 | ) | |||||||||||||||||||||||||
| Net interest income after provision and other market valuation adjustments |
34,322 | 33,270 | 32,829 | 18,973 | 31,076 | 31,896 | 26,538 | 9,914 | 11,653 | 100,421 | 89,510 | |||||||||||||||||||||||||||||||||
| Mortgage banking activities, net |
(5,944 | ) | 58,531 | 46,021 | 21,286 | 12,303 | (3,607 | ) | 4,946 | - | - | 98,608 | 13,642 | |||||||||||||||||||||||||||||||
| Fixed compensation expense |
(5,808 | ) | (6,067 | ) | (5,624 | ) | (4,275 | ) | (4,412 | ) | (4,373 | ) | (4,835 | ) | (3,799 | ) | (3,702 | ) | (17,499 | ) | (13,620 | ) | ||||||||||||||||||||||
| Variable compensation expense |
(5,621 | ) | (3,960 | ) | (4,837 | ) | (5,465 | ) | (5,593 | ) | (3,024 | ) | (2,594 | ) | (721 | ) | (863 | ) | (14,418 | ) | (11,211 | ) | ||||||||||||||||||||||
| Equity compensation expense |
(1,997 | ) | (3,396 | ) | (2,487 | ) | (2,499 | ) | (2,151 | ) | (2,958 | ) | (2,176 | ) | (2,371 | ) | (1,929 | ) | (7,880 | ) | (7,285 | ) | ||||||||||||||||||||||
| Severance expense |
(445 | ) | (3,366 | ) | (68 | ) | - | - | - | (200 | ) | - | - | (3,879 | ) | (200 | ) | |||||||||||||||||||||||||||
| Other operating expense |
(7,982 | ) | (6,855 | ) | (6,582 | ) | (6,131 | ) | (4,946 | ) | (4,810 | ) | (4,828 | ) | (5,683 | ) | (5,013 | ) | (21,419 | ) | (14,584 | ) | ||||||||||||||||||||||
| Total operating expenses |
(21,853 | ) | (23,644 | ) | (19,598 | ) | (18,370 | ) | (17,102 | ) | (15,165 | ) | (14,633 | ) | (12,574 | ) | (11,507 | ) | (65,095 | ) | (46,900 | ) | ||||||||||||||||||||||
| Realized gains on sales, net (2) |
10,469 | 223 | 12,266 | 20,336 | 13,940 | 6,995 | 13,507 | - | 313 | 22,958 | 34,442 | |||||||||||||||||||||||||||||||||
| Realized gains on calls, net |
- | 333 | - | 29 | - | - | 113 | 102 | 832 | 333 | 113 | |||||||||||||||||||||||||||||||||
| Realized gains, net |
10,469 | 556 | 12,266 | 20,365 | 13,940 | 6,995 | 13,620 | 102 | 1,145 | 23,291 | 34,555 | |||||||||||||||||||||||||||||||||
| Noncontrolling interest |
- | - | - | - | - | - | - | - | 20 | - | - | |||||||||||||||||||||||||||||||||
| Benefit from (provision for) income taxes |
4,935 | (3,140 | ) | (10,908 | ) | (176 | ) | (516 | ) | (592 | ) | (8 | ) | - | (14 | ) | (9,113 | ) | (1,116 | ) | ||||||||||||||||||||||||
| Net income (loss) |
$ | 21,929 | $ | 65,573 | $ | 60,610 | $ | 42,078 | $ | 39,701 | $ | 19,527 | $ | 30,463 | $ | (2,558 | ) | $ | 1,297 | $ | 148,112 | $ | 89,691 | |||||||||||||||||||||
| Diluted average shares |
84,422 | 96,172 | 87,345 | 82,498 | 80,764 | 78,815 | 79,892 | 78,370 | 78,471 | 93,234 | 80,176 | |||||||||||||||||||||||||||||||||
| Net income (loss) per share |
$ | 0.25 | $ | 0.71 | $ | 0.69 | $ | 0.50 | $ | 0.48 | $ | 0.24 | $ | 0.37 | $ | (0.03 | ) | $ | 0.01 | $ | 1.65 | $ | 1.09 | |||||||||||||||||||||
(1) Interest expense on ABS issued for the fourth quarter of 2012 includes accelerated recognition of $11 million of deferred hedging costs relating to Acacia entities upon deconsolidation of these entities.
(2) Realized gains on sales, net includes $15 million of gains related to the deconsolidation of certain Sequoia and Acacia entities during the fourth quarter of 2012.
| THE REDWOOD REVIEW 3RD QUARTER 2013
|
||||
|
|
Table 2: Taxable and GAAP Income(1) Differences and Dividends (in thousands, except per share data) | |||
| Estimated Nine Months 2013 (2) | Actual Twelve Months 2012 | Actual Twelve Months 2011 | ||||||||||||||||||||||||||||||||||
| Taxable Income |
GAAP Income |
Differences | Taxable Income |
GAAP Income |
Differences | Taxable Income |
GAAP Income |
Differences | ||||||||||||||||||||||||||||
| Taxable and GAAP Income Differences |
||||||||||||||||||||||||||||||||||||
| Interest income |
$ | 158,456 | $ | 168,664 | $ | (10,208 | ) | $ | 160,737 | $ | 231,384 | $ | (70,647 | ) | $ | 128,334 | $ | 217,179 | $ | (88,845 | ) | |||||||||||||||
| Interest expense |
(42,129 | ) | (61,651 | ) | 19,522 | (26,187 | ) | (120,794 | ) | 94,607 | (15,804 | ) | (99,037 | ) | 83,233 | |||||||||||||||||||||
| Net interest income |
116,327 | 107,013 | 9,314 | 134,550 | 110,590 | 23,960 | 112,530 | 118,142 | (5,612 | ) | ||||||||||||||||||||||||||
| Provision for loan losses |
- | (493 | ) | 493 | - | (3,648 | ) | 3,648 | - | (16,151 | ) | 16,151 | ||||||||||||||||||||||||
| Realized credit losses |
(9,452 | ) | - | (9,452 | ) | (25,609 | ) | - | (25,609 | ) | (57,526 | ) | - | (57,526 | ) | |||||||||||||||||||||
| Other market valuation adjustments, net |
- | (6,099 | ) | 6,099 | - | (10,163 | ) | 10,163 | - | (40,017 | ) | 40,017 | ||||||||||||||||||||||||
| Mortgage banking activities, net |
25,205 | 98,608 | (73,403 | ) | 222 | 46,630 | (46,408 | ) | - | - | - | |||||||||||||||||||||||||
| Operating expenses |
(56,521 | ) | (65,095 | ) | 8,574 | (56,156 | ) | (65,270 | ) | 9,114 | (45,166 | ) | (47,682 | ) | 2,516 | |||||||||||||||||||||
| Realized gains, net |
- | 23,291 | (23,291 | ) | - | 54,921 | (54,921 | ) | - | 10,946 | (10,946 | ) | ||||||||||||||||||||||||
| Provision for income taxes |
(244 | ) | (9,113 | ) | 8,869 | (93 | ) | (1,291 | ) | 1,198 | (16 | ) | (42 | ) | 26 | |||||||||||||||||||||
| Less: Net loss attributable to noncontrolling interest
|
- | - | - | - | - | - | - | (1,147 | ) | 1,147 | ||||||||||||||||||||||||||
| Income |
$ | 75,315 | $ | 148,112 | $ | (72,797 | ) | $ | 52,914 | $ | 131,769 | $ | (78,855 | ) | $ | 9,822 | $ | 26,343 | $ | (16,521 | ) | |||||||||||||||
| REIT taxable income |
$ | 56,299 | $ | 60,541 | $ | 19,543 | ||||||||||||||||||||||||||||||
| Taxable loss at taxable subsidiaries |
19,016 | (7,627 | ) | (9,721 | ) | |||||||||||||||||||||||||||||||
| Taxable income |
$ | 75,315 | $ | 52,914 | $ | 9,822 | ||||||||||||||||||||||||||||||
| Shares used for taxable EPS calculation |
82,389 | 81,716 | 78,556 | |||||||||||||||||||||||||||||||||
| REIT taxable income per share (3) |
$ | 0.69 | $ | 0.75 | $ | 0.24 | ||||||||||||||||||||||||||||||
| Taxable income (loss) per share at taxable subsidiaries |
$ | 0.23 | $ | (0.09 | ) | $ | (0.12 | ) | ||||||||||||||||||||||||||||
| Taxable income per share (3) |
$ | 0.92 | $ | 0.66 | $ | 0.12 | ||||||||||||||||||||||||||||||
| Dividends |
||||||||||||||||||||||||||||||||||||
| Dividends declared |
$ | 68,922 | $ | 80,134 | $ | 78,382 | ||||||||||||||||||||||||||||||
| Regular dividend per share (4) |
$ | 0.84 | $ | 1.00 | $ | 1.00 | ||||||||||||||||||||||||||||||
(1) Taxable income for 2013 is an estimate until we file our tax returns.
(2) Reconciliation of GAAP income to taxable income (loss) for prior quarters is provided in the respective Redwood Reviews for those quarters.
(3) REIT taxable income per share and taxable income (loss) per share are based on the number of shares outstanding at the end of each quarter. The annual REIT taxable income per share and taxable income (loss) per share are the sum of the four quarterly per share estimates.
(4) The characterization of our 2013 dividend will be determined after the completion of our 2013 tax year. Dividends in 2012 were characterized as 77% ordinary income, or $62 million, and 23% return of capital, or $18 million. Dividends in 2011 were characterized as 25% ordinary income, or $19 million, and 75% return of capital, or $59 million. The portion of Redwood’s dividends characterized as a return of capital is not taxable to a shareholder and reduces a shareholder’s basis for shares held at each quarterly distribution date, but not to below $0.
| THE REDWOOD REVIEW 3RD QUARTER 2013
|
Table 2: Taxable and GAAP Income Differences and Dividends |
49
| ||
|
|
Table 3: Book Value and Financial Ratios ($ in millions, except per share data) | 50
| ||
| 2013 Q3 |
2013 Q2 |
2013 Q1 |
2012 Q4 |
2012 Q3 |
2012 Q2 |
2012 Q1 |
2011 Q4 |
2011 Q3 |
||||||||||||||||||||||||||||
| Short-term debt |
$ | 838 | $ | 1,446 | $ | 721 | $ | 552 | $ | 522 | $ | 455 | $ | 441 | $ | 428 | $ | - | ||||||||||||||||||
| Long-term debt |
472 | 444 | 444 | 140 | 140 | 140 | 140 | 140 | 140 | |||||||||||||||||||||||||||
| Redwood debt (1) |
$ | 1,310 | $ | 1,890 | $ | 1,165 | $ | 692 | $ | 662 | $ | 595 | $ | 581 | $ | 568 | $ | 140 | ||||||||||||||||||
| ABS obligations of consolidated securitization entities (including the Residential Resecuritization and Commercial Securitization) |
2,062 | 2,214 | 2,365 | 2,530 | 3,429 | 3,564 | 3,704 | 4,139 | 4,293 | |||||||||||||||||||||||||||
| Consolidated GAAP Debt |
$ | 3,372 | $ | 4,104 | $ | 3,529 | $ | 3,222 | $ | 4,091 | $ | 4,159 | $ | 4,285 | $ | 4,707 | $ | 4,433 | ||||||||||||||||||
| GAAP stockholders’ equity |
$ | 1,207 | $ | 1,209 | $ | 1,188 | $ | 1,140 | $ | 1,050 | $ | 951 | $ | 962 | $ | 893 | $ | 959 | ||||||||||||||||||
| Redwood debt to equity |
1.1x | 1.6x | 1.0x | 0.6x | 0.6x | 0.6x | 0.6x | 0.6x | 0.1x | |||||||||||||||||||||||||||
| Redwood debt to (equity + Redwood debt) |
52% | 61% | 50% | 38% | 39% | 38% | 38% | 39% | 13% | |||||||||||||||||||||||||||
| Consolidated GAAP Debt to equity |
2.8x | 3.4x | 3.0x | 2.8x | 3.9x | 4.4x | 4.5x | 5.3x | 4.6x | |||||||||||||||||||||||||||
| Consolidated GAAP Debt to (equity + GAAP debt) |
74% | 77% | 75% | 74% | 80% | 81% | 82% | 84% | 82% | |||||||||||||||||||||||||||
| GAAP stockholders’ equity |
$ | 1,207 | $ | 1,209 | $ | 1,188 | $ | 1,140 | $ | 1,050 | $ | 951 | $ | 962 | $ | 893 | $ | 959 | ||||||||||||||||||
| Balance sheet mark-to-market adjustments |
115 | 118 | 143 | 138 | 74 | 28 | 42 | (13 | ) | 32 | ||||||||||||||||||||||||||
| Core equity (non-GAAP) |
$ | 1,092 | $ | 1,091 | $ | 1,045 | $ | 1,002 | $ | 976 | $ | 923 | $ | 920 | $ | 906 | $ | 927 | ||||||||||||||||||
| Shares outstanding at period end (in thousands) |
82,389 | 82,332 | 81,706 | 81,716 | 81,526 | 79,263 | 78,756 | 78,556 | 78,495 | |||||||||||||||||||||||||||
| GAAP equity per share |
$ | 14.65 | $ | 14.69 | $ | 14.54 | $ | 13.95 | $ | 12.88 | $ | 12.00 | $ | 12.22 | $ | 11.36 | $ | 12.22 | ||||||||||||||||||
(1) Excludes obligations of consolidated securitization entities, the residential resecuritization we engaged in during the third quarter of 2011, and the commercial securitization we engaged in during the fourth quarter of 2012.
| THE REDWOOD REVIEW 3RD QUARTER 2013
|
Table 3: Book Value and Financial Ratios |
|||
|
|
Table 4: Yields and Profitability Ratios1 ($ in thousands) | |||
| 2013 Q3 |
2013 Q2 |
2013 Q1 |
2012 Q4 (2) |
2012 Q3 |
2012 Q2 |
2012 Q1 |
2011 Q4 |
2011 Q3 |
Nine Months 2013 |
Nine Months 2012 |
||||||||||||||||||||||||||||||||||
| Interest income |
$ | 57,420 | $ | 57,719 | $ | 53,525 | $ | 53,397 | $ | 59,723 | $ | 59,523 | $ | 58,742 | $ | 56,495 | $ | 53,396 | $ | 168,664 | $ | 177,988 | ||||||||||||||||||||||
| Average consolidated earning assets |
$ | 4,808,815 | $ | 4,858,695 | $ | 4,569,121 | $ | 4,856,538 | $ | 5,178,913 | $ | 5,146,111 | $ | 5,351,918 | $ | 5,419,721 | $ | 5,143,814 | $ | 4,746,421 | $ | 5,224,191 | ||||||||||||||||||||||
| Asset yield |
4.78% | 4.75% | 4.69% | 4.40% | 4.61% | 4.63% | 4.39% | 4.17% | 4.15% | 4.74% | 4.54% | |||||||||||||||||||||||||||||||||
| Interest expense |
$ | (21,833 | ) | $ | (21,463 | ) | $ | (18,355 | ) | $ | (32,971 | ) | $ | (28,285 | ) | $ | (28,881 | ) | $ | (30,656 | ) | $ | (29,115 | ) | $ | (24,317 | ) | $ | (61,651 | ) | $ | (87,822 | ) | |||||||||||
| Average consolidated interest-bearing liabilities |
$ | 3,710,613 | $ | 3,747,078 | $ | 3,494,668 | $ | 3,727,576 | $ | 4,166,828 | $ | 4,207,316 | $ | 4,423,167 | $ | 4,481,303 | $ | 4,105,088 | $ | 3,651,577 | $ | 4,266,382 | ||||||||||||||||||||||
| Cost of funds |
2.35% | 2.29% | 2.10% | 3.54% | 2.72% | 2.75% | 2.77% | 2.60% | 2.37% | 2.25% | 2.74% | |||||||||||||||||||||||||||||||||
| Asset yield |
4.78% | 4.75% | 4.69% | 4.40% | 4.61% | 4.63% | 4.39% | 4.17% | 4.15% | 4.74% | 4.54% | |||||||||||||||||||||||||||||||||
| Cost of funds |
(2.35% | ) | (2.29% | ) | (2.10% | ) | (3.54% | ) | (2.72% | ) | (2.75% | ) | (2.77% | ) | (2.60% | ) | (2.37% | ) | (2.25% | ) | (2.74% | ) | ||||||||||||||||||||||
| Interest rate spread |
2.42% | 2.46% | 2.58% | 0.86% | 1.90% | 1.88% | 1.62% | 1.57% | 1.78% | 2.49% | 1.80% | |||||||||||||||||||||||||||||||||
| Net interest income |
$ | 35,587 | $ | 36,256 | $ | 35,170 | $ | 20,426 | $ | 31,438 | $ | 30,642 | $ | 28,086 | $ | 27,380 | $ | 29,079 | $ | 107,013 | $ | 90,166 | ||||||||||||||||||||||
| Average consolidated earning assets |
$ | 4,808,815 | $ | 4,858,695 | $ | 4,569,121 | $ | 4,856,538 | $ | 5,178,913 | $ | 5,146,111 | $ | 5,351,918 | $ | 5,419,721 | $ | 5,143,814 | $ | 4,746,421 | $ | 5,224,191 | ||||||||||||||||||||||
| Net interest margin |
2.96% | 2.98% | 3.08% | 1.68% | 2.43% | 2.38% | 2.10% | 2.02% | 2.26% | 3.01% | 2.30% | |||||||||||||||||||||||||||||||||
| Net interest income |
$ | 35,587 | $ | 36,256 | $ | 35,170 | $ | 20,426 | $ | 31,438 | $ | 30,642 | $ | 28,086 | $ | 27,380 | $ | 29,079 | $ | 107,013 | $ | 90,166 | ||||||||||||||||||||||
| Net interest income / average core equity |
12.97% | 13.62% | 13.80% | 8.26% | 13.34% | 13.30% | 12.29% | 12.05% | 12.63% | 13.45% | 12.98% | |||||||||||||||||||||||||||||||||
| Operating expenses |
$ | (21,853 | ) | $ | (23,644 | ) | $ | (19,598 | ) | $ | (18,370 | ) | $ | (17,102 | ) | $ | (15,165 | ) | $ | (14,633 | ) | $ | (12,574 | ) | $ | (11,507 | ) | $ | (65,095 | ) | $ | (46,900 | ) | |||||||||||
| Average total assets |
$ | 5,010,779 | $ | 5,103,812 | $ | 4,823,321 | $ | 5,090,253 | $ | 5,371,679 | $ | 5,307,961 | $ | 5,505,797 | $ | 5,577,206 | $ | 5,303,614 | $ | 4,979,990 | $ | 5,395,061 | ||||||||||||||||||||||
| Average total equity |
$ | 1,217,418 | $ | 1,204,807 | $ | 1,161,546 | $ | 1,088,565 | $ | 987,692 | $ | 945,805 | $ | 926,138 | $ | 912,051 | $ | 976,676 | $ | 1,194,795 | $ | 953,338 | ||||||||||||||||||||||
| Operating expenses / net interest income |
61.41% | 65.21% | 55.72% | 89.93% | 54.40% | 49.49% | 52.10% | 45.92% | 39.57% | 60.83% | 52.02% | |||||||||||||||||||||||||||||||||
| Operating expenses / average total assets |
1.74% | 1.85% | 1.63% | 1.44% | 1.27% | 1.14% | 1.06% | 0.90% | 0.87% | 1.74% | 1.16% | |||||||||||||||||||||||||||||||||
| Operating expenses / average total equity |
7.18% | 7.85% | 6.75% | 6.75% | 6.93% | 6.41% | 6.32% | 5.51% | 4.71% | 7.26% | 6.56% | |||||||||||||||||||||||||||||||||
| GAAP net income (loss) |
$ | 21,929 | $ | 65,573 | $ | 60,610 | $ | 42,078 | $ | 39,701 | $ | 19,527 | $ | 30,463 | $ | (2,558 | ) | $ | 1,297 | $ | 148,112 | $ | 89,691 | |||||||||||||||||||||
| GAAP net income (loss) / average total assets |
1.75% | 5.14% | 5.03% | 3.31% | 2.96% | 1.47% | 2.21% | (0.18% | ) | 0.10% | 3.97% | 2.22% | ||||||||||||||||||||||||||||||||
| GAAP net income (loss) / average equity (GAAP ROE) |
7.21% | 21.77% | 20.87% | 15.46% | 16.08% | 8.26% | 13.16% | (1.12% | ) | 0.53% | 16.53% | 12.54% | ||||||||||||||||||||||||||||||||
| GAAP net income (loss) / average core equity (adjusted ROE) (2) |
7.99% | 24.63% | 23.79% | 17.03% | 16.84% | 8.47% | 13.33% | (1.13% | ) | 0.56% | 18.61% | 12.91% | ||||||||||||||||||||||||||||||||
| Average core equity (3) |
$ | 1,097,920 | $ | 1,064,964 | $ | 1,019,154 | $ | 988,564 | $ | 942,846 | $ | 921,663 | $ | 914,052 | $ | 908,915 | $ | 921,048 | $ | 1,060,968 | $ | 926,248 | ||||||||||||||||||||||
(1) All percentages in this table are shown on an annualized basis.
(2) Included in the net income for fourth quarter of 2012 is a net $4 million gain related to the deconsolidation of certain Acacia and Sequoia entities. Interest expense for the fourth quarter of 2012 includes accelerated recognition of $11 million of deferred hedging costs relating the Acacia entities upon the deconsolidation of these entities. Realized gains, net, includes $15 million of gains related to the deconsolidation of the certain Acacia and Sequoia entities.
(3) Core equity is a non-GAAP metric and is equal to GAAP equity excluding accumulated other comprehensive income (loss).
| THE REDWOOD REVIEW 3RD QUARTER 2013
|
Table 4: Yields and Profitability Ratios |
51
| ||
|
|
Table 5: Average Balance Sheet ($ in thousands) | 52
| ||
| 2013 Q3 |
2013 Q2 |
2013 Q1 |
2012 Q4 |
2012 Q3 |
2012 Q2 |
2012 Q1 |
2011 Q4 |
2011 Q3 |
Nine Months 2013 |
Nine Months 2012 |
||||||||||||||||||||||||||||||||||
| Real estate assets at Redwood |
|
|||||||||||||||||||||||||||||||||||||||||||
| Commercial loans |
$ | 347,633 | $ | 332,113 | $ | 319,760 | $ | 296,990 | $ | 267,032 | $ | 199,440 | $ | 169,432 | $ | 123,367 | $ | 79,445 | $ | 333,271 | $ | 212,169 | ||||||||||||||||||||||
| Commercial loans - HFS |
- | 11,351 | 49,061 | 6,886 | - | - | - | - | - | 19,957 | - | |||||||||||||||||||||||||||||||||
| Commercial loans - FV |
67,999 | 39,015 | - | - | - | - | - | - | - | 35,920 | - | |||||||||||||||||||||||||||||||||
| Residential loans |
860,923 | 1,060,347 | 818,950 | 418,722 | 466,246 | 363,882 | 319,353 | 306,869 | 313,763 | 913,560 | 383,464 | |||||||||||||||||||||||||||||||||
| Senior residential securities |
||||||||||||||||||||||||||||||||||||||||||||
| Prime |
440,616 | 453,230 | 416,774 | 427,149 | 447,994 | 457,549 | 325,619 | 248,211 | 244,502 | 436,961 | 416,490 | |||||||||||||||||||||||||||||||||
| Non-prime |
187,724 | 227,295 | 235,583 | 243,336 | 236,006 | 262,084 | 280,970 | 280,066 | 283,043 | 216,692 | 259,600 | |||||||||||||||||||||||||||||||||
| Total senior residential securities |
628,340 | 680,525 | 652,357 | 670,485 | 684,000 | 719,633 | 606,589 | 528,277 | 527,545 | 653,653 | 676,090 | |||||||||||||||||||||||||||||||||
| Residential Re-REMIC securities |
101,808 | 100,824 | 99,769 | 99,088 | 99,890 | 105,281 | 87,001 | 74,560 | 41,598 | 100,808 | 91,434 | |||||||||||||||||||||||||||||||||
| Subordinate residential securities |
||||||||||||||||||||||||||||||||||||||||||||
| Prime |
440,235 | 320,490 | 218,477 | 153,223 | 118,549 | 104,078 | 81,253 | 69,477 | 72,199 | 327,213 | 101,356 | |||||||||||||||||||||||||||||||||
| Non-prime |
1,286 | 2,051 | 2,064 | 3,783 | 6,669 | 8,325 | 9,721 | 11,433 | 10,885 | 1,797 | 8,233 | |||||||||||||||||||||||||||||||||
| Total subordinate residential securities |
441,521 | 322,541 | 220,541 | 157,006 | 125,218 | 112,403 | 90,974 | 80,910 | 83,084 | 329,010 | 109,589 | |||||||||||||||||||||||||||||||||
| Commercial subordinate securities |
- | - | 766 | 2,154 | 4,047 | 3,980 | 3,946 | 4,272 | 4,720 | 253 | 3,991 | |||||||||||||||||||||||||||||||||
| CDO |
- | - | - | 4 | 14 | 14 | 762 | 960 | 1,247 | - | 263 | |||||||||||||||||||||||||||||||||
| Mortgage Servicing Rights |
55,622 | 31,318 | 10,299 | 4,867 | 2,122 | 1,729 | 859 | - | - | 32,579 | - | |||||||||||||||||||||||||||||||||
| Total real estate assets at Redwood |
2,503,846 | 2,578,034 | 2,171,503 | 1,656,202 | 1,648,569 | 1,506,362 | 1,278,057 | 1,119,215 | 1,051,402 | 2,419,011 | 1,477,000 | |||||||||||||||||||||||||||||||||
| Earning assets at Acacia |
- | - | - | 171,650 | 270,891 | 262,959 | 252,907 | 255,801 | 285,985 | - | 262,284 | |||||||||||||||||||||||||||||||||
| Earning assets at Consolidated Sequoia |
1,910,814 | 2,043,820 | 2,177,315 | 2,751,130 | 3,128,076 | 3,258,137 | 3,597,081 | 3,838,327 | 3,600,122 | 2,043,007 | 3,327,036 | |||||||||||||||||||||||||||||||||
| Earning assets at the Fund (1) |
- | - | - | - | - | - | - | - | - | - | - | |||||||||||||||||||||||||||||||||
| Total earning assets at Other Consolidated Entities |
1,910,814 | 2,043,820 | 2,177,315 | 2,922,780 | 3,398,967 | 3,521,096 | 3,849,988 | 4,094,128 | 3,886,107 | 2,043,007 | 3,589,320 | |||||||||||||||||||||||||||||||||
| Cash and cash equivalents |
274,657 | 96,998 | 77,911 | 177,555 | 86,531 | 94,511 | 211,786 | 203,242 | 150,677 | 150,576 | 130,781 | |||||||||||||||||||||||||||||||||
| Earning assets |
4,689,317 | 4,718,852 | 4,426,729 | 4,756,537 | 5,134,067 | 5,121,969 | 5,339,831 | 5,416,585 | 5,088,186 | 4,612,594 | 5,197,101 | |||||||||||||||||||||||||||||||||
| Balance sheet mark-to-market adjustments |
119,498 | 139,843 | 142,392 | 100,001 | 44,846 | 24,142 | 12,087 | 3,136 | 55,628 | 133,827 | 27,090 | |||||||||||||||||||||||||||||||||
| Earning assets - reported value |
4,808,815 | 4,858,695 | 4,569,121 | 4,856,538 | 5,178,913 | 5,146,111 | 5,351,918 | 5,419,721 | 5,143,814 | 4,746,421 | 5,224,191 | |||||||||||||||||||||||||||||||||
| Other assets |
201,964 | 245,117 | 254,200 | 233,715 | 192,766 | 161,850 | 153,020 | 157,485 | 159,800 | 233,569 | 170,870 | |||||||||||||||||||||||||||||||||
| Total assets |
$ | 5,010,779 | $ | 5,103,812 | $ | 4,823,321 | $ | 5,090,253 | $ | 5,371,679 | $ | 5,307,961 | $ | 5,505,797 | $ | 5,577,206 | $ | 5,303,614 | $ | 4,979,990 | $ | 5,395,061 | ||||||||||||||||||||||
| Short-term debt |
$ | 1,150,917 | $ | 1,053,610 | $ | 854,238 | $ | 539,579 | $ | 570,775 | $ | 474,053 | $ | 362,107 | $ | 157,992 | $ | 18,116 | $ | 1,020,675 | $ | 469,350 | ||||||||||||||||||||||
| Secured borrowings |
32,729 | 16,593 | 5,734 | 3,052 | - | - | - | - | - | 18,451 | - | |||||||||||||||||||||||||||||||||
| Consolidated Sequoia ABS issued |
1,835,401 | 1,965,149 | 2,099,041 | 2,661,564 | 3,039,273 | 3,166,476 | 3,504,155 | 3,738,132 | 3,510,089 | 1,965,565 | 3,235,915 | |||||||||||||||||||||||||||||||||
| Residential Resecuritization ABS issued |
118,338 | 138,817 | 153,487 | 168,634 | 182,702 | 196,837 | 210,360 | 222,652 | 180,769 | 136,752 | 197,554 | |||||||||||||||||||||||||||||||||
| Commercial Securitization ABS issued |
155,661 | 155,812 | 163,409 | 61,830 | - | - | - | - | - | 158,265 | - | |||||||||||||||||||||||||||||||||
| Acacia ABS issued |
- | - | - | 154,617 | 235,789 | 231,673 | 208,281 | 224,273 | 257,872 | - | 225,286 | |||||||||||||||||||||||||||||||||
| Other liabilities |
82,748 | 151,927 | 167,107 | 274,112 | 217,159 | 154,840 | 156,492 | 183,852 | 221,592 | 133,618 | 175,341 | |||||||||||||||||||||||||||||||||
| Convertible notes |
279,232 | 278,774 | 80,447 | - | - | - | - | - | - | 213,546 | - | |||||||||||||||||||||||||||||||||
| Long-term debt |
138,335 | 138,323 | 138,312 | 138,300 | 138,289 | 138,277 | 138,264 | 138,254 | 138,242 | 138,323 | 138,277 | |||||||||||||||||||||||||||||||||
| Total liabilities |
3,793,361 | 3,899,005 | 3,661,775 | 4,001,688 | 4,383,987 | 4,362,156 | 4,579,659 | 4,665,155 | 4,326,680 | 3,785,195 | 4,441,723 | |||||||||||||||||||||||||||||||||
| Noncontrolling interest |
- | - | - | - | - | - | - | - | 258 | - | - | |||||||||||||||||||||||||||||||||
| Core equity (2) |
1,097,920 | 1,064,964 | 1,019,154 | 988,564 | 942,846 | 921,663 | 914,052 | 908,915 | 921,048 | 1,060,968 | 926,248 | |||||||||||||||||||||||||||||||||
| Accumulated other comprehensive income |
119,498 | 139,843 | 142,392 | 100,001 | 44,846 | 24,142 | 12,086 | 3,136 | 55,628 | 133,827 | 27,090 | |||||||||||||||||||||||||||||||||
| Total equity
|
1,217,418 | 1,204,807 | 1,161,546 | 1,088,565 | 987,692 | 945,805 | 926,138 | 912,051 | 976,676 | 1,194,795 | 953,338 | |||||||||||||||||||||||||||||||||
| Total liabilities and equity |
$ | 5,010,779 | $ | 5,103,812 | $ | 4,823,321 | $ | 5,090,253 | $ | 5,371,679 | $ | 5,307,961 | $ | 5,505,797 | $ | 5,577,206 | $ | 5,303,614 | $ | 4,979,990 | $ | 5,395,061 | ||||||||||||||||||||||
(1) Refers to the Redwood Opportunity Fund, which liquidated in the third quarter of 2011.
(2) Core equity is a non-GAAP metric and is equal to GAAP equity excluding accumulated other comprehensive income.
| THE REDWOOD REVIEW 3RD QUARTER 2013
|
Table 5: Average Balance Sheet | |||
|
|
Table 6: Balances & Yields by Securities Portfolio at Redwood1 ($ in thousands) | |||
|
2013 Q3 |
2013 Q2 |
2013 Q1 |
2012 Q4 |
2012 Q3 |
2012 Q2 |
2013 Q3 |
2013 Q2 |
2013 Q1 |
2012 Q4 |
2012 Q3 |
2012 Q2 |
|||||||||||||||||||||||||||||||||||||||||
| Residential Prime Senior |
|
Residential Non-Prime Subordinate |
|
|||||||||||||||||||||||||||||||||||||||||||||||||
| Principal balance |
$ | 379,598 | $ | 435,536 | $ | 460,273 | $ | 485,033 | $ | 517,737 | $ | 540,032 | Principal balance |
$ | 12,054 | $ | 19,294 | $ | 19,869 | $ | 20,194 | $ | 30,221 | $ | 33,194 | |||||||||||||||||||||||||||
| Unamortized discount |
(47,000 | ) | (42,520 | ) | (48,893 | ) | (53,601 | ) | (59,832 | ) | (52,686 | ) | Unamortized discount |
(11,240 | ) | (11,982 | ) | (11,993 | ) | (15,666 | ) | (19,309 | ) | (19,650 | ) | |||||||||||||||||||||||||||
| Credit reserve |
(12,964 | ) | (32,068 | ) | (28,326 | ) | (26,100 | ) | (22,657 | ) | (34,990 | ) | Credit reserve |
(814 | ) | (5,270 | ) | (5,829 | ) | (2,433 | ) | (4,582 | ) | (5,299 | ) | |||||||||||||||||||||||||||
| Unrealized gains, net |
44,188 | 49,211 | 64,260 | 61,191 | 55,161 | 38,446 | Unrealized (losses) gains, net |
133 | 149 | 394 | 226 | 225 | (275 | ) | ||||||||||||||||||||||||||||||||||||||
| Interest-only securities |
117,443 | 123,591 | 55,289 | 10,409 | 6,301 | 16,301 | ||||||||||||||||||||||||||||||||||||||||||||||
| Fair value |
$ | 481,265 | $ | 533,750 | $ | 502,603 | $ | 476,932 | $ | 496,710 | $ | 507,103 | Fair value |
$ | 133 | $ | 2,191 | $ | 2,441 | $ | 2,321 | $ | 6,555 | $ | 7,970 | |||||||||||||||||||||||||||
| Average amortized cost |
$ | 440,616 | $ | 453,230 | $ | 416,775 | $ | 427,149 | $ | 447,994 | $ | 457,550 | Average amortized cost |
$ | 1,286 | $ | 2,051 | $ | 2,064 | $ | 3,783 | $ | 6,669 | $ | 8,325 | |||||||||||||||||||||||||||
| Interest income |
$ | 12,639 | $ | 12,341 | $ | 9,723 | $ | 9,113 | $ | 9,620 | $ | 10,180 | Interest income |
$ | 124 | $ | 165 | $ | 155 | $ | 266 | $ | 446 | $ | 426 | |||||||||||||||||||||||||||
| Annualized yield |
11.47% | 10.89% | 9.33% | 8.53% | 8.59% | 8.90% | Annualized yield |
38.57% | 32.18% | 30.04% | 28.13% | 26.75% | 20.47% | |||||||||||||||||||||||||||||||||||||||
| Residential Non-Prime Senior |
|
Commercial Subordinate |
|
|||||||||||||||||||||||||||||||||||||||||||||||||
| Principal balance |
$ | 225,649 | $ | 259,524 | $ | 268,926 | $ | 278,229 | $ | 287,877 | $ | 312,897 | Principal balance |
$ | - | $ | - | $ | - | $ | 29,331 | $ | 40,342 | $ | 42,602 | |||||||||||||||||||||||||||
| Unamortized discount |
(40,243 | ) | (39,030 | ) | (40,541 | ) | (42,842 | ) | (46,330 | ) | (60,341 | ) | Unamortized discount |
- | - | - | (3,362 | ) | (3,509 | ) | (5,532 | ) | ||||||||||||||||||||||||||||||
| Credit reserve |
(12,813 | ) | (18,078 | ) | (18,079 | ) | (18,104 | ) | (17,046 | ) | (18,891 | ) | Credit reserve |
- | - | - | (23,916 | ) | (33,206 | ) | (33,013 | ) | ||||||||||||||||||||||||||||||
| Unrealized gains, net |
22,561 | 22,271 | 30,118 | 27,983 | 15,370 | 8,342 | Unrealized gains, net |
- | - | - | 12,016 | 3,992 | 1,704 | |||||||||||||||||||||||||||||||||||||||
| Interest-only securities |
8,864 | 17,525 | 21,582 | 22,134 | 22,941 | 22,963 | ||||||||||||||||||||||||||||||||||||||||||||||
| Fair value |
$ | 204,018 | $ | 242,212 | $ | 262,006 | $ | 267,400 | $ | 262,812 | $ | 264,970 | Fair value |
$ | - | $ | - | $ | - | $ | 14,069 | $ | 7,619 | $ | 5,761 | |||||||||||||||||||||||||||
| Average amortized cost |
$ | 187,724 | $ | 227,296 | $ | 235,583 | $ | 243,336 | $ | 236,006 | $ | 262,084 | Average amortized cost |
$ | - | $ | - | $ | 766 | $ | 2,154 | $ | 4,047 | $ | 3,980 | |||||||||||||||||||||||||||
| Interest income |
$ | 4,789 | $ | 5,825 | $ | 6,011 | $ | 6,248 | $ | 6,286 | $ | 7,264 | Interest income |
$ | - | $ | - | $ | 625 | $ | 230 | $ | 643 | $ | 605 | |||||||||||||||||||||||||||
| Annualized yield |
10.20% | 10.25% | 10.21% | 10.27% | 10.65% | 11.09% | Annualized yield |
N/A | N/A | 326.37% | 42.71% | 63.55% | 60.80% | |||||||||||||||||||||||||||||||||||||||
| Residential Re-REMIC |
|
CDO Subordinate |
|
|||||||||||||||||||||||||||||||||||||||||||||||||
| Principal balance |
$ | 214,660 | $ | 215,169 | $ | 215,235 | $ | 215,863 | $ | 216,159 | $ | 236,470 | Principal balance |
$ | - | $ | - | $ | - | $ | - | $ | 10,778 | $ | 10,750 | |||||||||||||||||||||||||||
| Unamortized discount |
(78,789 | ) | (69,590 | ) | (64,547 | ) | (69,310 | ) | (61,123 | ) | (73,438 | ) | Unamortized discount |
- | - | - | - | (3,461 | ) | (3,461 | ) | |||||||||||||||||||||||||||||||
| Credit reserve |
(33,621 | ) | (44,195 | ) | (50,406 | ) | (47,235 | ) | (56,158 | ) | (58,618 | ) | Credit reserve |
- | - | - | - | (7,303 | ) | (7,275 | ) | |||||||||||||||||||||||||||||||
| Unrealized gains, net |
54,096 | 52,783 | 63,155 | 63,717 | 51,095 | 43,023 | Unrealized gains, net |
- | - | - | - | 50 | 50 | |||||||||||||||||||||||||||||||||||||||
| Fair value |
$ | 156,346 | $ | 154,167 | $ | 163,437 | $ | 163,035 | $ | 149,973 | $ | 147,437 | Fair value |
$ | - | $ | - | $ | - | $ | - | $ | 64 | $ | 64 | |||||||||||||||||||||||||||
| Average amortized cost |
$ | 101,808 | $ | 100,824 | $ | 99,769 | $ | 99,088 | $ | 99,890 | $ | 105,281 | Average amortized cost |
$ | - | $ | - | $ | - | $ | 4 | $ | 14 | $ | 14 | |||||||||||||||||||||||||||
| Interest income |
$ | 3,574 | $ | 3,835 | $ | 3,758 | $ | 3,385 | $ | 3,282 | $ | 3,184 | Interest income |
$ | - | $ | - | $ | - | $ | - | $ | 4 | $ | 4 | |||||||||||||||||||||||||||
| Annualized yield |
14.04% | 15.21% | 15.07% | 13.66% | 13.14% | 12.10% | Annualized yield |
N/A | N/A | N/A | N/A | 114.29% | 114.29% | |||||||||||||||||||||||||||||||||||||||
| Residential Prime Subordinate |
|
|||||||||||||||||||||||||||||||||||||||||||||||||||
| Principal balance |
$ | 664,597 | $ | 536,235 | $ | 428,588 | $ | 290,276 | $ | 259,124 | $ | 252,372 | ||||||||||||||||||||||||||||||||||||||||
| Unamortized discount |
(122,631 | ) | (84,645 | ) | (71,412 | ) | (33,930 | ) | (27,407 | ) | (30,757 | ) | ||||||||||||||||||||||||||||||||||||||||
| Credit reserve |
(76,080 | ) | (90,799 | ) | (83,148 | ) | (93,160 | ) | (99,209 | ) | (103,628 | ) | ||||||||||||||||||||||||||||||||||||||||
| Unrealized gains, net |
16,778 | 20,936 | 25,676 | 21,447 | 12,688 | 5,103 | ||||||||||||||||||||||||||||||||||||||||||||||
| Interest-only securities |
252 | 258 | 337 | 363 | 346 | 382 | ||||||||||||||||||||||||||||||||||||||||||||||
| Fair value |
$ | 482,916 | $ | 381,985 | $ | 300,041 | $ | 184,996 | $ | 145,542 | $ | 123,472 | ||||||||||||||||||||||||||||||||||||||||
| Average amortized cost |
$ | 440,235 | $ | 320,490 | $ | 218,477 | $ | 153,224 | $ | 118,549 | $ | 104,078 | ||||||||||||||||||||||||||||||||||||||||
| Interest income |
$ | 8,523 | $ | 6,948 | $ | 5,446 | $ | 4,562 | $ | 4,443 | $ | 4,158 | ||||||||||||||||||||||||||||||||||||||||
| Annualized yield |
7.74% | 8.67% | 9.97% | 11.91% | 14.99% | 15.98% | ||||||||||||||||||||||||||||||||||||||||||||||
(1) Annualized yields for AFS portfolios are based on average amortized cost. Cash flows from many of our subordinate securities can be volatile and in certain cases (e.g., when the fair value of certain securities are close to zero) any interest income earned can result in unusually high reported yields that are not sustainable and not necessarily meaningful.
| THE REDWOOD REVIEW 3RD QUARTER 2013
|
Table 6: Balances & Yields by Securities at Redwood |
53
| ||
|
|
Table 7: Securities and Loans Portfolio Activity at Redwood ($ in thousands) | 54
| ||
| 2013 Q3 |
2013 Q2 |
2013 Q1 |
2012 Q4 |
2012 Q3 |
2012 Q2 |
2013 Q3 |
2013 Q2 |
2013 Q1 |
2012 Q4 |
2012 Q3 |
2012 Q2 |
|||||||||||||||||||||||||||||||||||||||||
| Residential Prime Senior |
|
Commercial Subordinate |
|
|||||||||||||||||||||||||||||||||||||||||||||||||
| Beginning fair value |
$ | 533,750 | $ | 502,603 | $ | 476,932 | $ | 496,710 | $ | 507,103 | $ | 458,648 | Beginning fair value |
$ | - | $ | - | $ | 14,069 | $ | 7,619 | $ | 5,761 | $ | 5,838 | |||||||||||||||||||||||||||
| Acquisitions |
112,644 | 40,642 | 51,208 | 6,708 | 16,913 | 94,702 | Acquisitions |
- | - | - | - | - | - | |||||||||||||||||||||||||||||||||||||||
| Sales |
(137,807 | ) | (8,677 | ) | (8,257 | ) | (9,285 | ) | (18,160 | ) | (24,775 | ) | Sales |
- | - | (2,031 | ) | (1,484 | ) | - | - | |||||||||||||||||||||||||||||||
| Effect of principal payments |
(24,159 | ) | (24,019 | ) | (23,840 | ) | (22,102 | ) | (21,983 | ) | (20,623 | ) | Effect of principal payments |
- | - | - | - | - | - | |||||||||||||||||||||||||||||||||
| Change in fair value, net |
(3,163 | ) | 23,201 | 6,560 | 4,901 | 12,837 | (849 | ) | Change in fair value, net (1) |
- | - | (12,038 | ) | 7,934 | 1,858 | (77 | ) | |||||||||||||||||||||||||||||||||||
| Ending fair value |
$ | 481,265 | $ | 533,750 | $ | 502,603 | $ | 476,932 | $ | 496,710 | $ | 507,103 | Ending fair value |
$ | - | $ | - | $ | - | $ | 14,069 | $ | 7,619 | $ | 5,761 | |||||||||||||||||||||||||||
| Residential Non-Prime Senior |
|
CDO Subordinate |
|
|||||||||||||||||||||||||||||||||||||||||||||||||
| Beginning fair value |
$ | 242,212 | $ | 262,006 | $ | 267,400 | $ | 262,812 | $ | 264,970 | $ | 274,954 | Beginning fair value |
$ | - | $ | - | $ | - | $ | 64 | $ | 64 | $ | 64 | |||||||||||||||||||||||||||
| Acquisitions |
- | - | - | (188 | ) | 20,850 | 13,783 | Acquisitions |
- | - | - | - | - | - | ||||||||||||||||||||||||||||||||||||||
| Sales |
(31,725 | ) | - | - | - | (23,004 | ) | (14,018 | ) | Sales |
- | - | - | (259 | ) | - | - | |||||||||||||||||||||||||||||||||||
| Effect of principal payments |
(7,969 | ) | (8,397 | ) | (8,110 | ) | (7,797 | ) | (7,505 | ) | (8,607 | ) | Effect of principal payments |
- | - | - | - | - | - | |||||||||||||||||||||||||||||||||
| Change in fair value, net |
1,500 | (11,397 | ) | 2,716 | 12,573 | 7,501 | (1,142 | ) | Change in fair value, net |
- | - | - | 195 | - | - | |||||||||||||||||||||||||||||||||||||
| Ending fair value |
$ | 204,018 | $ | 242,212 | $ | 262,006 | $ | 267,400 | $ | 262,812 | $ | 264,970 | Ending fair value |
$ | - | $ | - | $ | - | $ | - | $ | 64 | $ | 64 | |||||||||||||||||||||||||||
| Residential Re-REMIC |
|
Residential Loans |
|
|||||||||||||||||||||||||||||||||||||||||||||||||
| Beginning fair value |
$ | 154,167 | $ | 163,437 | $ | 163,035 | $ | 149,973 | $ | 147,437 | $ | 154,661 | Beginning carrying value |
$ | 1,221,098 | $ | 831,953 | $ | 562,658 | $ | 417,982 | $ | 256,077 | $ | 303,106 | |||||||||||||||||||||||||||
| Acquisitions |
- | - | - | - | - | - | Acquisitions |
1,294,372 | 2,567,426 | 2,586,899 | 789,416 | 524,043 | 338,898 | |||||||||||||||||||||||||||||||||||||||
| Sales |
- | - | - | - | (5,376 | ) | (2,983 | ) | Sales |
(1,771,726 | ) | (2,135,166 | ) | (2,349,089 | ) | (665,078 | ) | (372,362 | ) | (381,808 | ) | |||||||||||||||||||||||||||||||
| Effect of principal payments |
- | - | - | - | - | - | Principal repayments |
(4,190 | ) | (1,768 | ) | (3,286 | ) | (2,483 | ) | (4,842 | ) | (4,524 | ) | |||||||||||||||||||||||||||||||||
| Change in fair value, net |
2,179 | (9,270 | ) | 402 | 13,062 | 7,912 | (4,241 | ) | Changes in fair value, net |
(11,675 | ) | (41,347 | ) | 34,771 | 22,821 | 15,066 | 405 | |||||||||||||||||||||||||||||||||||
| Ending fair value |
$ | 156,346 | $ | 154,167 | $ | 163,437 | $ | 163,035 | $ | 149,973 | $ | 147,437 | Ending carrying value |
$ | 727,879 | $ | 1,221,098 | $ | 831,953 | $ | 562,658 | $ | 417,982 | $ | 256,077 | |||||||||||||||||||||||||||
| Residential Prime Subordinate |
|
Commercial Loans |
|
|||||||||||||||||||||||||||||||||||||||||||||||||
| Beginning fair value |
$ | 381,985 | $ | 300,041 | $ | 184,996 | $ | 145,542 | $ | 123,472 | $ | 106,189 | Beginning carrying value |
$ | 494,823 | $ | 401,438 | $ | 313,010 | $ | 286,070 | $ | 246,783 | $ | 178,415 | |||||||||||||||||||||||||||
| Acquisitions |
110,213 | 92,368 | 114,728 | 35,097 | 18,576 | 17,267 | Originations |
121,523 | 168,365 | 189,407 | 44,182 | 40,154 | 68,620 | |||||||||||||||||||||||||||||||||||||||
| Sales |
- | - | - | - | - | - | Sales |
(238,102 | ) | (73,780 | ) | (88,212 | ) | (15,000 | ) | - | - | |||||||||||||||||||||||||||||||||||
| Effect of principal payments |
(5,481 | ) | (4,549 | ) | (4,002 | ) | (3,394 | ) | (3,072 | ) | (3,211 | ) | Principal repayments |
(848 | ) | (100 | ) | (12,272 | ) | (95 | ) | (491 | ) | (87 | ) | |||||||||||||||||||||||||||
| Change in fair value, net |
(3,801 | ) | (5,875 | ) | 4,319 | 7,751 | 6,566 | 3,227 | Provision for loan losses |
(844 | ) | (891 | ) | (685 | ) | (2,320 | ) | (506 | ) | (376 | ) | |||||||||||||||||||||||||||||||
| Ending fair value |
$ | 482,916 | $ | 381,985 | $ | 300,041 | $ | 184,996 | $ | 145,542 | $ | 123,472 | Discount/fee amortization |
138 | 136 | 190 | 173 | 130 | 211 | |||||||||||||||||||||||||||||||||
| Changes in fair value, net |
3,163 | (345 | ) | - | - | - | - | |||||||||||||||||||||||||||||||||||||||||||||
| Residential Non-Prime Subordinate |
|
Ending carrying value |
$ | 379,853 | $ | 494,823 | $ | 401,438 | $ | 313,010 | $ | 286,070 | $ | 246,783 | ||||||||||||||||||||||||||||||||||||||
| Beginning fair value |
$ | 2,191 | $ | 2,441 | $ | 2,321 | $ | 6,555 | $ | 7,970 | $ | 8,229 | ||||||||||||||||||||||||||||||||||||||||
| Acquisitions |
- | - | - | - | - | - | ||||||||||||||||||||||||||||||||||||||||||||||
| Sales |
(2,185 | ) | - | - | (4,193 | ) | (1,868 | ) | - | |||||||||||||||||||||||||||||||||||||||||||
| Effect of principal payments |
(16 | ) | (14 | ) | (66 | ) | (75 | ) | (143 | ) | (260 | ) | ||||||||||||||||||||||||||||||||||||||||
| Change in fair value, net |
143 | (236 | ) | 186 | 34 | 596 | 1 | |||||||||||||||||||||||||||||||||||||||||||||
| Ending fair value |
$ | 133 | $ | 2,191 | $ | 2,441 | $ | 2,321 | $ | 6,555 | $ | 7,970 | ||||||||||||||||||||||||||||||||||||||||
(1) The change in fair value, net reflects the liquidation of our remaining commercial securities, resulting in an ending fair value of zero for this portfolio.
| THE REDWOOD REVIEW 3RD QUARTER 2013
|
Table 7: Securities and Loans Portfolio Activity at Redwood |
|||
|
|
Table 8A: Residential Prime Securities at Redwood and Underlying Loan Characteristics1 ($ in thousands) | |||
| 2013 Q3 |
2013 Q2 |
2013 Q1 |
2012 Q4 |
2012 Q3 |
2012 Q2 |
2012 Q1 |
2011 Q4 |
|||||||||||||||||||||||||
| Senior AFS |
$ | 363,822 | $ | 410,159 | $ | 447,314 | $ | 466,523 | $ | 490,409 | $ | 490,802 | $ | 436,783 | $ | 278,240 | ||||||||||||||||
| Subordinate AFS |
478,369 | 381,631 | 299,600 | 184,528 | 145,096 | 123,005 | 105,788 | 58,717 | ||||||||||||||||||||||||
| Fair value |
121,990 | 123,945 | 55,730 | 10,877 | 6,747 | 16,768 | 22,266 | 343 | ||||||||||||||||||||||||
| Total Residential Prime Securities |
$ | 964,181 | $ | 915,735 | $ | 802,644 | $ | 661,928 | $ | 642,252 | $ | 630,575 | $ | 564,837 | $ | 337,300 | ||||||||||||||||
| Number of loans |
68,022 | 56,088 | 56,047 | 60,883 | 60,584 | 63,986 | 81,085 | 85,702 | ||||||||||||||||||||||||
| Total loan face |
$ | 31,511,730 | $ | 26,269,089 | $ | 26,754,040 | $ | 26,968,619 | $ | 26,183,495 | $ | 27,988,787 | $ | 30,222,071 | $ | 31,848,071 | ||||||||||||||||
| Average loan size |
$ | 463 | $ | 468 | $ | 477 | $ | 443 | $ | 432 | $ | 437 | $ | 373 | $ | 372 | ||||||||||||||||
| Year 2013 origination |
13% | 9% | 2% | 0% | 0% | 0% | 0% | 0% | ||||||||||||||||||||||||
| Year 2012 origination |
9% | 10% | 11% | 4% | 1% | 1% | 0% | 0% | ||||||||||||||||||||||||
| Year 2011 origination |
1% | 2% | 2% | 2% | 2% | 2% | 2% | 0% | ||||||||||||||||||||||||
| Year 2010 origination |
0% | 0% | 0% | 0% | 0% | 0% | 0% | 0% | ||||||||||||||||||||||||
| Year 2009 origination |
0% | 0% | 0% | 0% | 0% | 0% | 0% | 0% | ||||||||||||||||||||||||
| Year 2008 origination |
0% | 0% | 0% | 0% | 0% | 0% | 0% | 0% | ||||||||||||||||||||||||
| Year 2007 origination |
15% | 15% | 16% | 18% | 12% | 12% | 11% | 10% | ||||||||||||||||||||||||
| Year 2006 origination |
2% | 3% | 4% | 4% | 3% | 3% | 3% | 1% | ||||||||||||||||||||||||
| Year 2005 origination |
14% | 17% | 17% | 18% | 17% | 17% | 17% | 19% | ||||||||||||||||||||||||
| Year 2004 origination and earlier |
46% | 44% | 48% | 54% | 65% | 65% | 67% | 70% | ||||||||||||||||||||||||
| Geographic concentration |
||||||||||||||||||||||||||||||||
| Southern CA |
21% | 22% | 22% | 23% | 23% | 23% | 23% | 23% | ||||||||||||||||||||||||
| Northern CA |
22% | 21% | 21% | 21% | 21% | 21% | 21% | 21% | ||||||||||||||||||||||||
| New York |
7% | 6% | 7% | 7% | 7% | 7% | 7% | 6% | ||||||||||||||||||||||||
| Florida |
5% | 5% | 6% | 6% | 6% | 6% | 6% | 6% | ||||||||||||||||||||||||
| Virginia |
3% | 4% | 3% | 3% | 3% | 3% | 3% | 4% | ||||||||||||||||||||||||
| New Jersey |
3% | 3% | 3% | 3% | 3% | 3% | 3% | 3% | ||||||||||||||||||||||||
| Illinois |
3% | 3% | 3% | 3% | 3% | 3% | 3% | 3% | ||||||||||||||||||||||||
| Other states |
36% | 36% | 35% | 34% | 34% | 34% | 34% | 34% | ||||||||||||||||||||||||
| Wtd Avg Original LTV |
69% | 69% | 69% | 69% | 69% | 69% | 68% | 68% | ||||||||||||||||||||||||
| Original LTV: 0 - 50 |
10% | 10% | 11% | 10% | 11% | 11% | 12% | 12% | ||||||||||||||||||||||||
| Original LTV: 50.01 - 60 |
12% | 12% | 11% | 11% | 11% | 11% | 11% | 11% | ||||||||||||||||||||||||
| Original LTV: 60.01 - 70 |
23% | 23% | 22% | 22% | 23% | 23% | 23% | 23% | ||||||||||||||||||||||||
| Original LTV: 70.01 - 80 |
51% | 52% | 53% | 53% | 51% | 51% | 50% | 49% | ||||||||||||||||||||||||
| Original LTV: 80.01 - 90 |
3% | 2% | 2% | 3% | 3% | 3% | 3% | 3% | ||||||||||||||||||||||||
| Original LTV: 90.01 - 100 |
1% | 1% | 1% | 1% | 1% | 1% | 1% | 2% | ||||||||||||||||||||||||
| Unknown |
0% | 0% | 0% | 0% | 0% | 0% | 0% | 0% | ||||||||||||||||||||||||
| Wtd Avg Original FICO |
735 | 737 | 732 | 729 | 735 | 735 | 735 | 735 | ||||||||||||||||||||||||
| Original FICO: < = 680 |
10% | 10% | 10% | 11% | 11% | 11% | 11% | 11% | ||||||||||||||||||||||||
| Original FICO: 681 - 700 |
9% | 9% | 10% | 10% | 11% | 11% | 10% | 10% | ||||||||||||||||||||||||
| Original FICO: 701 - 720 |
12% | 12% | 13% | 14% | 14% | 14% | 14% | 14% | ||||||||||||||||||||||||
| Original FICO: 721 - 740 |
14% | 14% | 14% | 15% | 15% | 15% | 15% | 15% | ||||||||||||||||||||||||
| Original FICO: 741 - 760 |
15% | 15% | 15% | 16% | 16% | 16% | 16% | 16% | ||||||||||||||||||||||||
| Original FICO: 761 - 780 |
18% | 18% | 18% | 17% | 17% | 17% | 17% | 17% | ||||||||||||||||||||||||
| Original FICO: 781 - 800 |
16% | 16% | 15% | 13% | 12% | 12% | 12% | 12% | ||||||||||||||||||||||||
| Original FICO: > = 801 |
5% | 5% | 4% | 3% | 3% | 3% | 3% | 3% | ||||||||||||||||||||||||
| Original Unknown |
1% | 1% | 1% | 1% | 1% | 1% | 2% | 2% | ||||||||||||||||||||||||
| Conforming balance % (2) |
44% | 44% | 47% | 50% | 53% | 52% | 54% | 55% | ||||||||||||||||||||||||
| > $1 MM % |
10% | 11% | 11% | 10% | 9% | 9% | 9% | 8% | ||||||||||||||||||||||||
| 2nd Home % |
6% | 7% | 7% | 7% | 7% | 7% | 7% | 7% | ||||||||||||||||||||||||
| Investment Home % |
2% | 2% | 2% | 2% | 2% | 2% | 2% | 2% | ||||||||||||||||||||||||
| Purchase |
40% | 41% | 42% | 43% | 41% | 41% | 40% | 40% | ||||||||||||||||||||||||
| Cash Out Refi |
21% | 22% | 22% | 23% | 23% | 23% | 23% | 23% | ||||||||||||||||||||||||
| Rate-Term Refi |
39% | 37% | 36% | 34% | 36% | 36% | 36% | 36% | ||||||||||||||||||||||||
| Other |
0% | 0% | 0% | 0% | 0% | 0% | 1% | 1% | ||||||||||||||||||||||||
| Full Doc |
63% | 63% | 60% | 56% | 55% | 55% | 53% | 51% | ||||||||||||||||||||||||
| No Doc |
5% | 4% | 4% | 5% | 4% | 4% | 6% | 6% | ||||||||||||||||||||||||
| Other Doc (Lim, Red, Stated, etc) |
31% | 32% | 34% | 37% | 38% | 38% | 38% | 40% | ||||||||||||||||||||||||
| Unknown/Not Categorized |
1% | 1% | 2% | 2% | 3% | 3% | 3% | 3% | ||||||||||||||||||||||||
| Single Family |
89% | 89% | 88% | 88% | 88% | 88% | 88% | 89% | ||||||||||||||||||||||||
| Condo |
8% | 8% | 9% | 9% | 9% | 9% | 9% | 9% | ||||||||||||||||||||||||
| 2-4 Family |
2% | 2% | 2% | 2% | 2% | 2% | 2% | 1% | ||||||||||||||||||||||||
| Other
|
1% | 1% | 1% | 1% | 1% | 1% | 1% | 1% | ||||||||||||||||||||||||
(1) Only the loan groups providing direct cash flow to securities we own are included.
(2) The definition of a conforming loan has significantly changed over time. For Q3 2011 and subsequent periods, the conforming balance definition that went into effect on October 1, 2011 was used (which had a maximum loan balance of $625,500). For all periods prior to Q3 2011, the conforming balance definition available in June 2011 was used (which had a maximum loan balance of $729,750).
| THE REDWOOD REVIEW 3RD QUARTER 2013
|
Table 8A: Residential Prime Securities at Redwood and Underlying Loan Characteristics |
55
| ||
|
|
Table 8B: Residential Non-Prime Securities at Redwood and Underlying Loan Characteristics1 ($ in thousands) | 56
| ||
| 2013 Q3 |
2013 Q2 |
2013 Q1 |
2012 Q4 |
2012 Q3 |
2012 Q2 |
2012 Q1 |
2011 Q4 |
|||||||||||||||||||||||||
| Senior AFS |
$ | 195,154 | $ | 224,687 | $ | 240,424 | $ | 245,266 | $ | 239,871 | $ | 242,007 | $ | 255,279 | $ | 255,724 | ||||||||||||||||
| Subordinate AFS |
133 | 2,046 | 2,284 | 2,160 | 6,404 | 7,867 | 8,142 | 11,153 | ||||||||||||||||||||||||
| Fair value |
8,864 | 17,670 | 21,739 | 22,295 | 23,092 | 23,066 | 19,762 | 20,738 | ||||||||||||||||||||||||
| Total Residential Non-prime Securities |
$ | 204,151 | $ | 244,403 | $ | 264,447 | $ | 269,721 | $ | 269,367 | $ | 272,940 | $ | 283,183 | $ | 287,615 | ||||||||||||||||
| Number of loans |
23,206 | 29,986 | 31,362 | 32,542 | 33,775 | 34,815 | 35,452 | 54,717 | ||||||||||||||||||||||||
| Total loan face |
$ | 4,481,710 | $ | 6,149,038 | $ | 6,520,375 | $ | 6,837,832 | $ | 6,760,747 | $ | 7,019,443 | $ | 7,241,685 | $ | 11,730,410 | ||||||||||||||||
| Average loan size |
$ | 193 | $ | 205 | $ | 208 | $ | 210 | $ | 200 | $ | 202 | $ | 204 | $ | 214 | ||||||||||||||||
| Year 2008 origination |
0% | 0% | 0% | 0% | 0% | 0% | 0% | 0% | ||||||||||||||||||||||||
| Year 2007 origination |
0% | 0% | 0% | 0% | 0% | 0% | 0% | 0% | ||||||||||||||||||||||||
| Year 2006 origination |
13% | 20% | 20% | 20% | 1% | 1% | 1% | 14% | ||||||||||||||||||||||||
| Year 2005 origination |
59% | 50% | 50% | 49% | 54% | 54% | 54% | 50% | ||||||||||||||||||||||||
| Year 2004 origination and earlier |
28% | 30% | 30% | 31% | 45% | 45% | 45% | 36% | ||||||||||||||||||||||||
| Geographic concentration |
||||||||||||||||||||||||||||||||
| Southern CA |
23% | 23% | 23% | 23% | 22% | 22% | 22% | 21% | ||||||||||||||||||||||||
| Northern CA |
14% | 15% | 15% | 15% | 16% | 16% | 16% | 15% | ||||||||||||||||||||||||
| Florida |
8% | 8% | 8% | 8% | 8% | 8% | 9% | 9% | ||||||||||||||||||||||||
| New York |
5% | 5% | 5% | 5% | 6% | 6% | 5% | 5% | ||||||||||||||||||||||||
| Virginia |
2% | 3% | 3% | 3% | 2% | 2% | 2% | 3% | ||||||||||||||||||||||||
| New Jersey |
3% | 3% | 3% | 3% | 3% | 3% | 3% | 3% | ||||||||||||||||||||||||
| Illinois |
3% | 3% | 3% | 3% | 3% | 3% | 3% | 3% | ||||||||||||||||||||||||
| Other states |
42% | 40% | 40% | 40% | 40% | 40% | 40% | 41% | ||||||||||||||||||||||||
| Wtd Avg Original LTV |
73% | 73% | 73% | 73% | 73% | 72% | 72% | 73% | ||||||||||||||||||||||||
| Original LTV: 0 - 50 |
6% | 6% | 6% | 6% | 7% | 7% | 7% | 6% | ||||||||||||||||||||||||
| Original LTV: 50.01 - 60 |
9% | 8% | 8% | 8% | 9% | 9% | 9% | 8% | ||||||||||||||||||||||||
| Original LTV: 60.01 - 70 |
19% | 19% | 19% | 19% | 19% | 19% | 19% | 18% | ||||||||||||||||||||||||
| Original LTV: 70.01 - 80 |
58% | 57% | 57% | 57% | 57% | 57% | 57% | 58% | ||||||||||||||||||||||||
| Original LTV: 80.01 - 90 |
6% | 7% | 7% | 7% | 6% | 6% | 6% | 7% | ||||||||||||||||||||||||
| Original LTV: 90.01 - 100 |
2% | 3% | 3% | 3% | 2% | 2% | 2% | 3% | ||||||||||||||||||||||||
| Unknown |
0% | 0% | 0% | 0% | 0% | 0% | 0% | 0% | ||||||||||||||||||||||||
| Wtd Avg Original FICO |
692 | 691 | 692 | 693 | 713 | 713 | 714 | 710 | ||||||||||||||||||||||||
| Original FICO: < = 680 |
25% | 28% | 28% | 28% | 25% | 25% | 25% | 27% | ||||||||||||||||||||||||
| Original FICO: 681 - 700 |
14% | 13% | 13% | 13% | 14% | 14% | 14% | 14% | ||||||||||||||||||||||||
| Original FICO: 701 - 720 |
16% | 14% | 14% | 15% | 15% | 15% | 15% | 14% | ||||||||||||||||||||||||
| Original FICO: 721 - 740 |
13% | 12% | 12% | 12% | 12% | 12% | 12% | 12% | ||||||||||||||||||||||||
| Original FICO: 741 - 760 |
12% | 12% | 12% | 11% | 12% | 12% | 12% | 12% | ||||||||||||||||||||||||
| Original FICO: 761 - 780 |
10% | 10% | 10% | 10% | 10% | 10% | 10% | 10% | ||||||||||||||||||||||||
| Original FICO: 781 - 800 |
7% | 7% | 7% | 7% | 7% | 7% | 7% | 7% | ||||||||||||||||||||||||
| Original FICO: > = 801 |
2% | 2% | 2% | 2% | 2% | 2% | 2% | 2% | ||||||||||||||||||||||||
| Original Unknown |
1% | 2% | 2% | 2% | 3% | 3% | 3% | 2% | ||||||||||||||||||||||||
| Conforming balance % (2) |
88% | 85% | 84% | 84% | 86% | 86% | 86% | 83% | ||||||||||||||||||||||||
| > $1 MM % |
2% | 3% | 3% | 3% | 2% | 2% | 3% | 3% | ||||||||||||||||||||||||
| 2nd Home % |
3% | 3% | 3% | 3% | 4% | 4% | 4% | 4% | ||||||||||||||||||||||||
| Investment Home % |
16% | 15% | 15% | 14% | 15% | 15% | 15% | 14% | ||||||||||||||||||||||||
| Purchase |
41% | 39% | 39% | 40% | 41% | 42% | 41% | 41% | ||||||||||||||||||||||||
| Cash Out Refi |
43% | 45% | 45% | 44% | 43% | 42% | 42% | 42% | ||||||||||||||||||||||||
| Rate-Term Refi |
15% | 15% | 15% | 15% | 15% | 15% | 16% | 16% | ||||||||||||||||||||||||
| Other |
1% | 1% | 1% | 1% | 1% | 1% | 1% | 1% | ||||||||||||||||||||||||
| Full Doc |
39% | 37% | 37% | 36% | 39% | 39% | 38% | 38% | ||||||||||||||||||||||||
| No Doc |
7% | 5% | 5% | 5% | 6% | 6% | 6% | 5% | ||||||||||||||||||||||||
| Other Doc (Lim, Red, Stated, etc) |
53% | 57% | 57% | 57% | 53% | 53% | 54% | 56% | ||||||||||||||||||||||||
| Unknown/Not Categorized |
1% | 1% | 1% | 2% | 2% | 2% | 2% | 1% | ||||||||||||||||||||||||
| Single Family |
83% | 83% | 84% | 84% | 84% | 84% | 84% | 84% | ||||||||||||||||||||||||
| 2-4 Family |
9% | 9% | 8% | 8% | 8% | 8% | 8% | 8% | ||||||||||||||||||||||||
| Condo |
8% | 8% | 8% | 8% | 8% | 8% | 8% | 8% | ||||||||||||||||||||||||
| Other
|
0% | 0% | 0% | 0% | 0% | 0% | 0% | 0% | ||||||||||||||||||||||||
(1) Only the loan groups providing direct cash flow to securities we own are included.
(2) The definition of a conforming loan has significantly changed over time. For Q3 2011 and subsequent periods, the conforming balance definition that went into effect on October 1, 2011 was used (which had a maximum loan balance of $625,500). For all periods prior to Q3 2011, the conforming balance definition available in June 2011 was used (which had a maximum loan balance of $729,750).
| THE REDWOOD REVIEW 3RD QUARTER 2013
|
Table 8B: Residential Non-Prime Securities at Redwood and Underlying Loan Characteristics | |||
|
|
Table 9: Residential Real Estate Loan Characteristics1 ($ in thousands) | |||
| 2013 Q3 |
2013 Q2 |
2013 Q1 |
2012 Q4 |
2012 Q3 |
2012 Q2 |
2012 Q1 |
2011 Q4 |
|||||||||||||||||||||||||
| Residential loans principal balance |
$ | 2,597,822 | $ | 3,266,104 | $ | 2,959,037 | $ | 2,820,885 | $ | 3,502,775 | $ | 3,493,755 | $ | 3,682,379 | $ | 4,231,324 | ||||||||||||||||
| Number of loans |
7,446 | 8,540 | 8,253 | 8,223 | 10,697 | 10,773 | 11,079 | 12,490 | ||||||||||||||||||||||||
| Average loan balance |
$ | 349 | $ | 382 | $ | 359 | $ | 343 | $ | 327 | $ | 324 | $ | 332 | $ | 339 | ||||||||||||||||
| Adjustable % |
63% | 53% | 62% | 66% | 73% | 75% | 73% | 72% | ||||||||||||||||||||||||
| Hybrid % |
10% | 4% | 3% | 5% | 6% | 8% | 9% | 9% | ||||||||||||||||||||||||
| Fixed % |
27% | 43% | 35% | 29% | 21% | 18% | 18% | 19% | ||||||||||||||||||||||||
| Amortizing % |
36% | 46% | 38% | 32% | 23% | 20% | 21% | 22% | ||||||||||||||||||||||||
| Interest-only % |
64% | 54% | 62% | 68% | 77% | 80% | 79% | 78% | ||||||||||||||||||||||||
| Northern California |
13% | 13% | 14% | 14% | 15% | 15% | 16% | 14% | ||||||||||||||||||||||||
| Florida |
10% | 9% | 9% | 10% | 11% | 12% | 11% | 11% | ||||||||||||||||||||||||
| Southern California |
11% | 15% | 14% | 12% | 11% | 11% | 12% | 12% | ||||||||||||||||||||||||
| New York |
8% | 7% | 7% | 8% | 7% | 7% | 7% | 7% | ||||||||||||||||||||||||
| Texas |
6% | 6% | 5% | 5% | 6% | 5% | 5% | 6% | ||||||||||||||||||||||||
| Georgia |
4% | 4% | 4% | 4% | 5% | 4% | 4% | 4% | ||||||||||||||||||||||||
| New Jersey |
3% | 3% | 3% | 3% | 4% | 4% | 4% | 4% | ||||||||||||||||||||||||
| Colorado |
4% | 3% | 3% | 4% | 4% | 3% | 3% | 3% | ||||||||||||||||||||||||
| Virginia |
4% | 4% | 3% | 3% | 3% | 3% | 3% | 3% | ||||||||||||||||||||||||
| Arizona |
2% | 2% | 2% | 2% | 2% | 2% | 2% | 2% | ||||||||||||||||||||||||
| Illinois |
3% | 3% | 3% | 3% | 2% | 2% | 2% | 3% | ||||||||||||||||||||||||
| Other states |
32% | 31% | 33% | 33% | 30% | 30% | 31% | 31% | ||||||||||||||||||||||||
| Year 2013 origination |
28% | 38% | 27% | 0% | 0% | 0% | 0% | 0% | ||||||||||||||||||||||||
| Year 2012 origination |
0% | 1% | 1% | 19% | 11% | 6% | 4% | 0% | ||||||||||||||||||||||||
| Year 2011 origination |
3% | 2% | 3% | 4% | 4% | 5% | 9% | 13% | ||||||||||||||||||||||||
| Year 2010 origination |
4% | 4% | 5% | 7% | 7% | 8% | 8% | 9% | ||||||||||||||||||||||||
| Year 2009 origination |
1% | 1% | 2% | 2% | 2% | 3% | 3% | 3% | ||||||||||||||||||||||||
| Year 2008 origination |
0% | 0% | 0% | 0% | 0% | 0% | 0% | 0% | ||||||||||||||||||||||||
| Year 2007 origination |
0% | 0% | 0% | < 1% | 2% | 2% | 2% | 2% | ||||||||||||||||||||||||
| Year 2006 origination |
6% | 5% | 5% | 6% | 5% | 5% | 5% | 4% | ||||||||||||||||||||||||
| Year 2005 origination |
3% | 2% | 2% | 3% | 4% | 4% | 3% | 3% | ||||||||||||||||||||||||
| Year 2004 origination or earlier |
55% | 47% | 55% | 59% | 65% | 68% | 66% | 66% | ||||||||||||||||||||||||
| Wtd Avg Original LTV |
66% | 66% | 65% | 65% | 66% | 66% | 66% | 66% | ||||||||||||||||||||||||
| Original LTV: 0 - 50 |
19% | 18% | 19% | 20% | 18% | 19% | 19% | 19% | ||||||||||||||||||||||||
| Original LTV: 50.01 - 60 |
13% | 13% | 15% | 14% | 12% | 13% | 13% | 13% | ||||||||||||||||||||||||
| Original LTV: 60.01 - 70 |
22% | 22% | 23% | 22% | 22% | 22% | 22% | 22% | ||||||||||||||||||||||||
| Original LTV: 70.01 - 80 |
41% | 43% | 38% | 38% | 42% | 41% | 41% | 40% | ||||||||||||||||||||||||
| Original LTV: 80.01 - 90 |
2% | 1% | 2% | 2% | 2% | 2% | 2% | 2% | ||||||||||||||||||||||||
| Original LTV: 90.01 - 100 |
3% | 3% | 3% | 4% | 4% | 4% | 4% | 4% | ||||||||||||||||||||||||
| Wtd Avg FICO |
743 | 749 | 746 | 744 | 740 | 739 | 740 | 740 | ||||||||||||||||||||||||
| FICO: < = 680 |
10% | 9% | 10% | 11% | 12% | 11% | 12% | 11% | ||||||||||||||||||||||||
| FICO: 681 - 700 |
7% | 6% | 7% | 8% | 9% | 10% | 9% | 9% | ||||||||||||||||||||||||
| FICO: 701 - 720 |
11% | 9% | 10% | 10% | 12% | 12% | 12% | 12% | ||||||||||||||||||||||||
| FICO: 721 - 740 |
13% | 12% | 12% | 12% | 12% | 13% | 12% | 12% | ||||||||||||||||||||||||
| FICO: 741 - 760 |
14% | 14% | 14% | 14% | 14% | 14% | 14% | 14% | ||||||||||||||||||||||||
| FICO: 761 - 780 |
20% | 22% | 21% | 19% | 18% | 18% | 18% | 19% | ||||||||||||||||||||||||
| FICO: 781 - 800 |
19% | 21% | 20% | 20% | 18% | 17% | 17% | 18% | ||||||||||||||||||||||||
| FICO: > = 801 |
6% | 7% | 6% | 6% | 5% | 5% | 6% | 5% | ||||||||||||||||||||||||
| Conforming balance % (2) |
42% | 31% | 35% | 37% | 42% | 43% | 42% | 41% | ||||||||||||||||||||||||
| % balance in loans > $1mm per loan |
20% | 18% | 19% | 20% | 19% | 20% | 22% | 22% | ||||||||||||||||||||||||
| 2nd home % |
11% | 9% | 9% | 10% | 10% | 11% | 10% | 11% | ||||||||||||||||||||||||
| Investment home % |
3% | 2% | 3% | 3% | 3% | 3% | 3% | 3% | ||||||||||||||||||||||||
| Purchase |
36% | 36% | 28% | 30% | 34% | 33% | 33% | 33% | ||||||||||||||||||||||||
| Cash out refinance |
26% | 22% | 25% | 26% | 28% | 28% | 28% | 28% | ||||||||||||||||||||||||
| Rate-term refinance |
37% | 41% | 45% | 42% | 37% | 37% | 38% | 38% | ||||||||||||||||||||||||
| Other
|
1% | 1% | 2% | 2% | 1% | 1% | 1% | 1% | ||||||||||||||||||||||||
(1) This table presents characteristics of residential loans held by consolidated Sequoia entities and residential loans held by Redwood and intended to be securitized by future Sequoia entities or sold to third parties.
(2) The definition of a conforming loan has significantly changed over time. For Q3 2011 and subsequent periods, the conforming balance definition that went into effect on October 1, 2011 was used (which had a maximum loan balance of $625,500). For all periods prior to Q3 2011, the conforming balance definition available in June 2011 was used (which had a maximum loan balance of $729,750).
| THE REDWOOD REVIEW 3RD QUARTER 2013
|
Table 9: Residential Real Estate Loan Characteristics |
57
| ||
|
|
Table 10: Commercial Loan Characteristics1 ($ in thousands) | 58
| ||
| 2013 Q3 |
2013 Q2 |
2013 Q1 |
2012 Q4 |
2012 Q3 |
2012 Q2 |
2012 Q1 |
2011 Q4 |
|||||||||||||||||||||||||
| Commercial loans principal balance |
$ | 361,759 | $ | 353,898 | $ | 335,448 | $ | 312,401 | $ | 291,595 | $ | 251,686 | $ | 182,803 | $ | 158,847 | ||||||||||||||||
| Number of loans |
50 | 48 | 42 | 35 | 31 | 27 | 19 | 15 | ||||||||||||||||||||||||
| Average loan balance |
$ | 7,235 | $ | 7,373 | $ | 7,987 | $ | 8,926 | $ | 9,406 | $ | 9,322 | $ | 9,621 | $ | 9,928 | ||||||||||||||||
| Fixed % |
86% | 86% | 85% | 87% | 87% | 94% | 92% | 91% | ||||||||||||||||||||||||
| Hybrid % |
14% | 14% | 15% | 13% | 13% | 6% | 8% | 9% | ||||||||||||||||||||||||
| Amortizing % |
21% | 21% | 17% | 12% | 10% | 16% | 16% | 19% | ||||||||||||||||||||||||
| Interest-only % |
79% | 79% | 83% | 88% | 90% | 84% | 84% | 81% | ||||||||||||||||||||||||
| California |
21% | 28% | 29% | 20% | 22% | 18% | 20% | 21% | ||||||||||||||||||||||||
| New York |
19% | 21% | 20% | 22% | 24% | 25% | 17% | 16% | ||||||||||||||||||||||||
| Florida |
12% | 9% | 9% | 10% | 11% | 12% | 13% | 4% | ||||||||||||||||||||||||
| South Carolina |
1% | 8% | 8% | 6% | 1% | 1% | 0% | 0% | ||||||||||||||||||||||||
| Arizona |
1% | 6% | 6% | 11% | 0% | 0% | 0% | 0% | ||||||||||||||||||||||||
| Michigan |
7% | 4% | 4% | 5% | 6% | 7% | 7% | 8% | ||||||||||||||||||||||||
| Georgia |
1% | 3% | 3% | 3% | < 1% | < 1% | 0% | 0% | ||||||||||||||||||||||||
| Missouri |
1% | 3% | 3% | 3% | 0% | 0% | 0% | 0% | ||||||||||||||||||||||||
| Illinois |
6% | 3% | 3% | 4% | 11% | 13% | 18% | 21% | ||||||||||||||||||||||||
| Texas |
6% | 2% | 2% | 0% | 5% | 6% | 5% | 2% | ||||||||||||||||||||||||
| Tennessee |
4% | < 1% | 0% | < 1% | 4% | 4% | 0% | 0% | ||||||||||||||||||||||||
| Wisconsin |
1% | 0% | 0% | 0% | 0% | 0% | 0% | 0% | ||||||||||||||||||||||||
| Washington |
3% | 2% | 1% | < 1% | 3% | 0% | 0% | 0% | ||||||||||||||||||||||||
| North Carolina |
3% | < 1% | 0% | 0% | 4% | 4% | 0% | 0% | ||||||||||||||||||||||||
| Alabama |
2% | < 1% | 0% | 0% | 3% | 4% | 0% | 0% | ||||||||||||||||||||||||
| Other states |
12% | 9% | 12% | 15% | 6% | 6% | 20% | 28% | ||||||||||||||||||||||||
| Year 2013 origination |
17% | 15% | 11% | 0% | 0% | 0% | 0% | 0% | ||||||||||||||||||||||||
| Year 2012 origination |
44% | 46% | 48% | 51% | 48% | 38% | 15% | 0% | ||||||||||||||||||||||||
| Year 2011 origination |
34% | 34% | 35% | 39% | 42% | 50% | 68% | 81% | ||||||||||||||||||||||||
| Year 2010 origination |
5% | 5% | 6% | 10% | 10% | 12% | 17% | 19% | ||||||||||||||||||||||||
| Year 2004 origination |
0% | 0% | 0% | < 1% | < 1% | < 1% | < 1% | < 1% | ||||||||||||||||||||||||
| Office |
22% | 22% | 24% | 29% | 30% | 32% | 32% | 37% | ||||||||||||||||||||||||
| Multi-family |
33% | 33% | 32% | 29% | 28% | 22% | 23% | 14% | ||||||||||||||||||||||||
| Hospitality |
23% | 24% | 23% | 21% | 20% | 21% | 18% | 20% | ||||||||||||||||||||||||
| Retail |
14% | 14% | 15% | 15% | 16% | 18% | 25% | 29% | ||||||||||||||||||||||||
| Self-storage |
7% | 7% | 5% | 6% | 6% | 7% | 2% | 0% | ||||||||||||||||||||||||
|
Industrial
|
1% | < 1% | < 1% | 0% | 0% | 0% | 0% | 0% | ||||||||||||||||||||||||
(1) This table presents characteristics of commercial loans held-for-investment by Redwood.
| THE REDWOOD REVIEW 3RD QUARTER 2013
|
Table 10: Commercial Loan Characteristics |
|||
REDWOOD TRUST CORPORATE INFORMATION
For more information about Redwood Trust, please visit our website at: www.redwoodtrust.com
59