Attached files
| file | filename |
|---|---|
| 8-K - FORM 8-K - PTC INC. | form8k.htm |
| EX-99.1 - PRESS RELEASE - PTC INC. | pressrel.htm |
Q4 FISCAL 2013 PREPARED REMARKS
New long-term targets reinforce commitment to margin expansion; technology and market leadership
Consistent with our goal of enhancing value for our stakeholders by generating consistent improvement in profitability, we are introducing new FY’17 targets. We now expect to increase non-GAAP operating margin to 28% to 30% by FY’17. We anticipate achieving this goal through a mix of measures including: (1) improving services gross margin toward our longer-term goal of 20%; (2) further expanding our services partner ecosystem; (3) implementing solutions that require shorter sales cycles and less services; (4) enhancing sales force productivity and efficiency; and (5) continued vigilance on cost control.
Based on our robust sales pipeline and increasing customer adoption of our broader solution set, but uncertain timing of global economic recovery (with some signs of macroeconomic recovery in Europe offset by potential headwinds in the US), we believe it is appropriate to guide FY’14 revenues to approximately $1,325 to $1,340 million, up by a low single digit percentage year over year. However, we expect non-GAAP EPS to grow faster than revenues (up by a low to mid-teens percentage y/y to $2.00 to $2.10), reflecting our demonstrated commitment to profitability. Our current pipeline continues to expand and if the economic environment improves, we believe we are well positioned to accelerate revenue growth.

PTC Markets
PTC is focused on the following five markets: Computer Aided Design (CAD), Product Lifecycle Management (PLM), Application Lifecycle Management (ALM), Supply Chain Management (SCM), and Services Lifecycle Management (SLM). We characterize the markets in which we participate with a graphic on the next page depicting PTC’s
addressable market with market size and growth estimates. Industry analysts and our internal forecasts suggest that four of these five markets will grow at a 9-11% CAGR from 2010 to 2015, with the more mature CAD market growing approximately 6% over the same time frame.
Revenue from product families is mapped to the following areas:
|
·
|
CAD: PTC Creo® and PTC Mathcad®
|
|
·
|
Extended PLM: PTC Windchill® and PTC Integrity TM
|
|
·
|
SLM: PTC Arbortext® and PTC Servigistics®
|

Non-GAAP Supplemental Information
We provide non-GAAP supplemental information to our GAAP information. A reconciliation between GAAP results and non-GAAP information and PTC's reasons for providing this information are at the end of this document.
Q4 FY’13 - Key Points
|
1)
|
Our Q4 non-GAAP EPS of $0.59 was up 19% year over year (up 20% on a constant currency basis), above our guidance range due to better than planned revenues and services margins and continued focus on cost efficiency. There was no material impact to Q4 non-GAAP EPS from currency effects relative to guidance.
|
|
2)
|
Total non-GAAP revenue for Q4 of $345.1 million, up 6% year over year (also up 6% year over year on a constant currency basis) was above the high end of our guidance range. Non-GAAP revenue from acquired businesses was $27.1 million in Q4, in line with our expectations.
|
|
|
|
|
|
|
|
|
|
3)
|
License revenue of $105.4 million was slightly above our Q4 guidance range and was up 5% year over year. Total license revenue, including $7.9 million from acquisitions, was strong in Europe, Pac Rim, and Japan (despite currency headwinds from Yen depreciation). However, while our organic license growth was impacted by the soft macroeconomic environment and a comparison against a very strong Q4’12 in the Americas, we achieved a solid result with no mega deals (greater than $5 million in license revenue) in the quarter.
|
|
4)
|
We delivered non-GAAP support revenue of $167.4 million, above our guidance and up 8% year over year. Results included $9.2 million in non-GAAP support revenue from acquisitions.
|
|
5)
|
Services revenue of $72.3 million (up 5% year over year, 4% on a constant currency basis), came in above our guidance. Results included $10.0 million in revenue from acquisitions. We delivered non-GAAP services gross margin of 15.4% for the quarter, up from 15.1% in Q3 ’13 and 12.5% in Q4 ‘12.
|
|
6)
|
We had 45 large deals (greater than $1 million in license and services revenue recognized in the quarter) that contributed $83.2 million in revenue, a 12% increase year over year.
|
|
7)
|
We ended the quarter with 343 quota-carrying sales representatives. Given the growth in sales capacity we achieved in 2011 and continued concern about the global macroeconomic environment, our focus has been improving the productivity of our current capacity. Now with the increased tenure of current sales representatives, plans to improve productivity, and hire an additional 20 sales representatives in FY’14, we believe we have adequate capacity to address our current pipeline of opportunities and begin to position ourselves for FY’15.
|
|
8)
|
We generated $44 million in operating cash flow and used $25 million to complete the acquisitions of Enigma and NetIDEAS, $10 million for capital expenditures, $10 million to partially repay our credit facility and $20 million for stock repurchases, resulting in an ending cash balance of $242 million.
|
Q1 AND FY’14 OUTLOOK: Commitment to margin expansion, despite uncertain macro recovery
In providing guidance, we weigh company specific factors such as our pipeline of opportunities and our support and services base along with external considerations, including the macroeconomic environment, currency, and visibility into customer spending patterns. Based on our current sales pipeline and historic close rates, as well as the uncertain timing of global economic recovery, we are guiding FY’14 revenue of $1,325 to $1,340 million. We are guiding FY’14 non-GAAP EPS of $2.00 to $2.10, reflecting our commitment to increasing margins and enhancing profitability. For Q1, we anticipate generating revenue of $310 to $320 million and non-GAAP EPS of $0.41 to $0.46.

REVENUE TRENDS
Year-over-year changes in revenue on a constant currency (FX) basis in the tables that follow compare actual reported results converted into U.S. dollars based on the corresponding prior year’s foreign currency exchange rates to reported results for the comparable prior year period. Results of Servigistics (acquired on October 2, 2012), Enigma (acquired on July 11, 2013) and NetIDEAS (acquired on September 5, 2013) have been included in our results of operations since their respective acquisition dates. References to organic revenue in the discussion that follows exclude Servigistics, Enigma and NetIDEAS revenue.
LICENSE: Strength in Europe and Pac Rim offset by soft US
License sales generate the highest non-GAAP gross margins, which are approximately 96%. License revenue historically has tended to represent 25% to 31% of our total revenue in any given quarter, with Q4 generally being our strongest quarter.

Q4 License revenue of $105.4 million was up 5% year over year, slightly above our guidance range of $95 million to $105 million, reflecting growth in Europe, the Pac Rim and Japan, with year-over-year growth of 37%, 31%, and 27%, respectively, offset by soft results in the Americas with a decline of 23% compared to Q4 2012, which was a very strong quarter. Q4 license revenue from acquisitions was $7.9 million, in line with our expectations. Organic license revenue was down 3%.
Looking forward to Q1 we are expecting license revenue of $70 to $80 million; for FY’14, we are expecting total license revenue of $350 to $365 million, up 2% to 6% year over year.
LARGE DEAL ACTIVITY:
Large deals are a significant growth driver and have historically tended to generate 20% to 25% of our total revenue in any given quarter. We define “large deals” as more than $1 million of license and service revenue recognized from a customer during a quarter. License revenue has historically comprised approximately 50% of the total large deal revenue in any quarter.

In Q4 we had 45 large deals totaling $83.2 million. 17 of these customers were in the Americas, 18 were in Europe and 10 were in Asia. The mix of large deal revenue was skewed more heavily toward licenses at 56% of total in Q4’13, differing from the first three quarters of FY’13, which were 43-47%. We continue to have a strong pipeline of large deals that we are working on worldwide, though the timing of closing and the size of large deals may be affected by a delayed macroeconomic recovery. We have recently won competitive deals with large global companies and are actively engaged in a substantial number of competitive opportunities with other large global companies.
SALES CAPACITY TRENDS:
A key part of our long-term growth strategy had been to increase the number of quota-carrying sales reps as we penetrate adjacent market opportunities (i.e. ALM, SLM, and SCM) within our existing customer base and target new customers. We ended the quarter with 343 quota-carrying reps, a 4% decrease year over year. Given the growth in
sales capacity we achieved in 2011 and continued concern about the global macroeconomic environment, our focus has been improving the productivity of our current capacity. Now with the increased tenure of current sales representatives, plans to improve productivity, and hire an additional 20 sales representatives in FY’14, we believe we have adequate capacity to address our current pipeline of opportunities and begin to position ourselves for FY’15.

SERVICES: Margin improvement and partner ecosystem expansion
Our services business provides significant value to our customers, helping them re-engineer their global product development business processes and implement our solutions - and providing them with training on our software. Services revenue has historically tended to represent 20% to 25% of our total revenues in any given quarter.
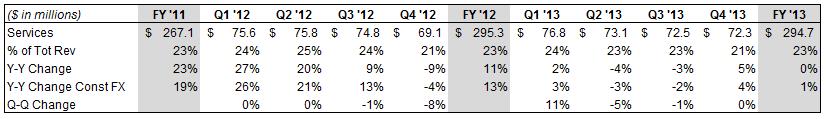
Q4 Services revenue of $72.3 million was up 5% year over year (up 4% on a constant currency basis), including $10.0 million in revenue from acquisitions. On an organic basis, services revenue was down 10%. Our consulting services revenue, which primarily supports PTC Windchill implementations, was up 9% year over year but down 8% on an organic basis, reflecting lower levels of large license transactions over the past year and the soft macro environment. Our training business, which typically represents about 15% of our total services revenue, was down 18% year over year (down 19% on an organic basis). A portion of the decrease in our services revenue is tied to our strategy to shift more business to services partners. We are having considerable success with our partner ecosystem, which had 71% year-over-year bookings growth for FY’13. We delivered improved non-GAAP services gross margin of 15.4% in Q4’13 (up 30 basis points from the Q3’13 non-GAAP services gross margin of 15.1%), exceeding our target of at least 14%.
Looking forward to Q1, we are expecting services revenue to be approximately $70 million, down 9% year over year. For FY’14 we anticipate generating services revenue of approximately $300 million, up approximately 2% year over year. We now expect to achieve non-GAAP services margins of at least 15% during FY’14, one year earlier than our previous expectation, through a combination of pricing discipline, cost control, and services partner ecosystem expansion.
SUPPORT: More than 1.9 million active seats
Our support business is an important barometer of customer satisfaction with our solutions. It is also a strong source of recurring revenue for PTC. Support gross margins are approximately 88% on a non-GAAP basis. Support
revenue has historically tended to represent 45% to 50% of our total revenues in any given quarter, with Q4 usually being at the low end as a percent of total revenue due to historically strong performance of license sales in that quarter.
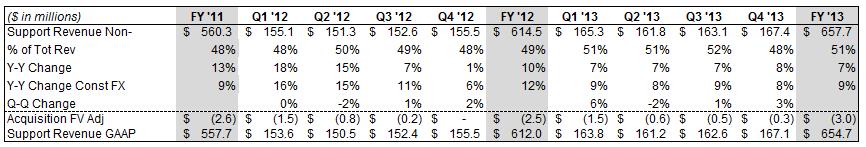
Q4 non-GAAP support revenue of $167.4 million was up 8% year over year, including 2% year-over-year organic growth and the contribution of $9.2 million from acquisitions.
Looking forward to Q1, we are expecting support revenue to increase to approximately $170 million, up 3% on a year-over-year basis. For FY’14 we are expecting approximately $675 million support revenue, up 3% on a year-over-year basis.
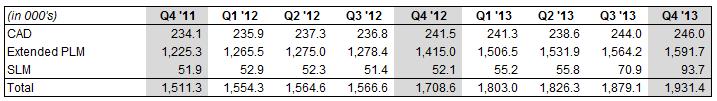
Active Support Seats
REVENUE BY SOLUTION AREA
We provide additional revenue disclosure that we believe provides valuable insight into how our business is performing within the markets we serve. Along with line of business, geographic and large deal metrics, we are reporting revenue in three solution areas: CAD, SLM and “Extended PLM”, which encompasses our PLM, ALM and SCM businesses. Each of these solution areas serves a market with unique secular and cyclical dynamics, growth rates, and “buyers” within our customer base.
The following tables provide license, services and support revenue for each of our solution areas. Results include combined revenue from direct sales and our channel.
CAD:

CAD revenue in Q4 was up 2% (up 3% on a constant currency basis) compared with the year-ago period primarily due to license revenue growth in Europe, Japan, and the Pac Rim, partially offset by lower license revenue in the Americas. CAD channel revenue, which represents approximately 40% of total CAD revenue, was up 2% year-over-year (up 3% on a constant currency basis).
Extended PLM:
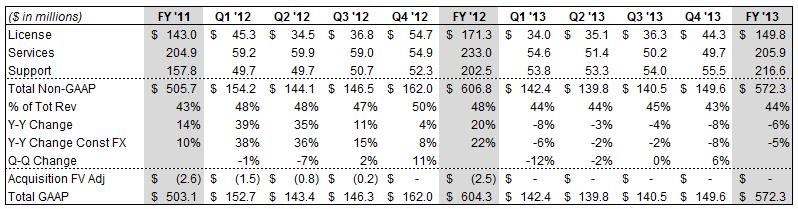
Q4 Extended PLM revenue, which includes our PLM, ALM and SCM solutions, was down 8% year over year and on a constant currency basis. Ongoing macroeconomic challenges led to year over year revenue declines in PLM, ALM, and SCM. By region, we experienced a double digit year-over-year decline in the Americas (against strong performance in the year-ago period), partially offset by growth in Japan, on a constant currency basis, Europe and the Pac Rim. We remain confident in our competitive positioning in Extended PLM and growth prospects as macroeconomic conditions improve.
SLM:

Q4 SLM license revenue included $7.9 million of license revenue from acquisitions and a 49% increase in organic license revenue. Including acquisitions, license revenue grew across all geographic regions.
REVENUE BY REGION
Americas:

Americas non-GAAP revenue in Q4 of $142.7 million was up 2% year over year. Organic revenue was down 13% year over year against strong performance in Q4’12, reflecting a decline in organic license revenue of 33% and services decline of 10%, partially offset by 4% growth in support revenue. While the macroeconomic environment remains challenged in the Americas, our pipeline continues to build and we are optimistic about the outlook for this region provided we begin to see economic recovery in FY’14.
Europe:

Europe non-GAAP revenue was $126.0 million in Q4, up 13% year over year (up 8% on a constant currency basis). Q4 license revenue in Europe was up 37% year over year. Total organic revenue was up 10% year over year while organic license revenue was up 28%. With economic indicators suggesting a recovery may be underway in Europe, we expect performance in this region to improve in FY’14 relative to FY’13.
Japan:

Japan non-GAAP revenue was $29.0 million in Q4, down 7% (up 15% on a constant currency basis) year over year. Q4 license revenue in Japan was up 27% (up 58% on a constant currency basis) compared with last year. Organic
license revenue and organic total revenue were up 17% and down 14%, respectively (up 46% and up 7% on a constant currency basis, respectively).
Pacific Rim:
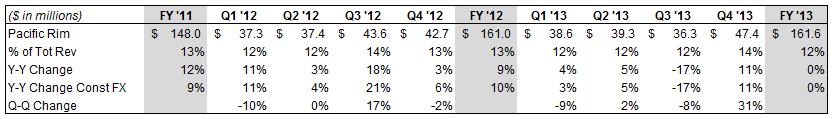
Pacific Rim non-GAAP revenue was $47.4 million in Q4, up 11% compared with last year. Q4 license revenue in the Pac Rim was up 31% compared with last year, aided in part by a large license transaction in the quarter. Organic license revenue and total revenue were up 31% and 10%, respectively.
CURRENCY IMPACT ON RESULTS COMPARED TO THE YEAR AGO PERIOD
We have a global business, with Europe and Asia historically representing approximately 60% to 65% of our revenue. We do not forecast currency movements; rather we provide detailed constant currency commentary. Currency can significantly impact our results. For example, in FY’13, currency was a headwind for PTC and negatively impacted non-GAAP revenue by $18 million and favorably impacted GAAP and non-GAAP expenses by $9 million. In FY’12 currency was also a headwind for us and negatively impacted non-GAAP revenue by $25 million while favorably impacting non-GAAP expenses by $19 million. In FY ’11 currency was a tailwind for us when compared to the prior year: non-GAAP revenue was positively impacted by $37 million, and non-GAAP expenses were negatively impacted by $21 million.
As a simple rule of thumb, based on current revenue and expense levels, a $0.10 move on the USD / EURO exchange rate will impact annualized revenue by approximately $35 to $40 million and EPS by approximately $0.08 to $0.10. Given recent fluctuation in the YEN / USD exchange rate, we also note that a 10 YEN move versus the USD will impact annualized revenue by approximately $13 to $17 million and expenses by approximately $6 to $8 million.
Looking forward, the guidance we are providing assumes exchange rates of approximately 1.35 USD / EURO and 98 YEN / USD. Our actual simple average Q4 ’13 Fx rate was $1.32 USD / EURO and 98 YEN / USD.
Q4 FY’13 EXPENSES COMMENTARY AND Q1 & FY’14 OUTLOOK
We implemented cost reduction actions in 2013 and recorded total restructuring charges of $52 million, primarily attributable to severance costs as part of our commitment to improve our operating efficiencies and to further our commitment to enhance long-term profitability. We paid $33 million of that amount in 2013. These restructuring actions were substantially completed in FY’13, with the full impact of the expense reductions expected to be realized
in the second fiscal quarter of 2014. The cumulative impact of these cost actions are a $16 million per quarter reduction of operating expenses, and are a component of our FY’14 non-GAAP EPS target of $2.00 to $2.10.
Q4 non-GAAP results exclude $13.9 million of stock-based compensation expense, $11.4 million of acquisition-related intangible asset amortization, $17.8 million of restructuring charges, $2.2 million of acquisition-related costs, and a $0.6 million non-operating gain. The Q4 non-GAAP results include a tax rate provision of 23% and 121.3 million diluted shares outstanding. The Q4 GAAP results include a tax rate benefit of 17% and 121.3 million diluted shares outstanding.
Q1’14 non-GAAP guidance excludes the following estimated expenses and their income tax effects, as well as any additional discrete tax items
|
·
|
Approximately $13 million of expense related to stock-based compensation
|
|
·
|
Approximately $12 million of acquisition-related intangible asset amortization expense
|
|
·
|
Approximately $0.5 million of restructuring charges
|
FY’14 non-GAAP guidance excludes the following full-year estimated expenses and their income tax effects, as well as any additional discrete tax items
|
·
|
Approximately $52 million of expense related to stock-based compensation
|
|
·
|
Approximately $49 million of acquisition-related intangible asset amortization expense
|
|
·
|
Approximately $0.5 million of restructuring charges
|
NON-GAAP GROSS MARGINS

NON-GAAP OPERATING MARGINS
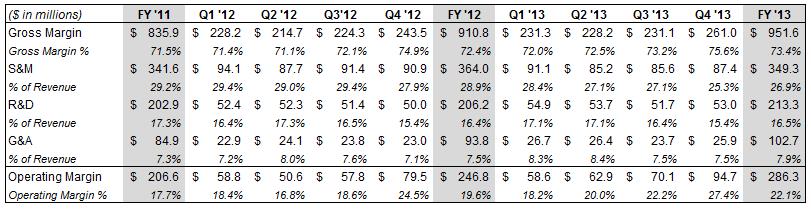
Our Q4’13 non-GAAP gross margin was $261 million, or 75.6%, compared to $243 million, or 74.9%, in the year ago period primarily due to improved services margins. Q4’13 GAAP gross margin was $253 million, or 73.5%, compared to $237 million, or 73.0%, in Q4’12.
Our Q4’13 non-GAAP operating expenses were $166 million ($204 million on a GAAP basis), compared to $164 million in Q4’12 ($180 million on a GAAP basis), reflecting cost reductions and continued discipline on operating expenses, partially offset by costs of acquired businesses.
From an operating performance perspective, we achieved 27.4% non-GAAP operating margin (27.6% on a constant currency basis) in Q4’13, compared to 24.5% in Q4’12. GAAP operating margin was 14.2% (14.6% on a constant currency basis) for Q4’13 compared to 17.7% in Q4’12.
Looking forward, we are expecting Q1‘14 non-GAAP gross margin of approximately 73%, GAAP gross margin of approximately 71%, non-GAAP operating margin of approximately 22.5% and GAAP operating margin of approximately 14%. For FY ‘14, we are expecting non-GAAP gross margin of approximately 73% to 74%, GAAP gross margin of 71% to 72%, non-GAAP operating margin of approximately 25%, and GAAP operating margin of approximately 18%.
Over the longer term we intend to increase our non-GAAP operating margin to the 28% to 30% range primarily through increased efficiency in our global sales organization and improved non-GAAP gross margin (74% to 76% range) due to improved non-GAAP services margin and more favorable revenue mix.
TAX RATE
Our Q4 non-GAAP tax rate was 23.5% and our GAAP tax rate was a benefit of 17%.
Looking forward, we expect our Q1 and FY’14 non-GAAP tax rate will increase to 25% given our current estimates for geographical mix of profits. Our FY’13 non-GAAP tax rate was favorably impacted by several discrete tax items that were realized in FY’13. Our guidance assumes a Q1 and FY’14 GAAP tax rate of 30%.
STOCK-BASED COMPENSATION
For FY’13, expenses related to stock-based compensation were 3.8% compared to 4.1% in FY’12. Over time, we expect that stock-based compensation as a percentage of non-GAAP revenue will trend down annually, ultimately reaching a sustainable long-term target of 3%.
SHARE COUNT / SHARE REPURCHASE
We had 121.3 million fully diluted weighted average shares outstanding for Q4. We repurchased $20 million worth of shares in Q4 and $75 million in FY’ 13.
Looking forward, we expect to have approximately 122 million fully diluted shares outstanding for Q1 ’14 and 122 million outstanding for the full fiscal year. Of the $100 million our board has authorized for share repurchases for FY’14, we intend to repurchase $75 million worth of shares in FY ’14. Our long-term philosophy is to repurchase shares to offset dilution.
BALANCE SHEET: Solid cash position
CASH / CASH FLOW FROM OPERATIONS
As of September 30, 2013 our cash balance was $242 million, down from $257 million at the end of Q3’13. During FY’13 we generated $225 million of cash from operations. Uses of cash in the year included $246 million for acquisitions, debt repayments of $112 million, share repurchases of $75 million and capital expenditures of $29 million.
DSO
We continue to have strong DSOs of 60 days in Q4’13 compared to 58 days in Q3’13 and 61 days in Q4’12.
OUTSTANDING DEBT
At the end of Q4’13, the balance outstanding under our $450 million credit facility was $258 million. We repaid $10 million of the balance outstanding under our credit facility in Q4 ’13, and we expect to repay approximately $100 million in FY’14.
MISCELLANEOUS COMMENTS
HEADCOUNT
Total headcount was 6,000 at the end of Q4, compared to 5,897 in Q4’12. It is worth noting that our headcount includes our three acquisitions completed in FY’13. Headcount at the end of Q3’13 was 5,987.
M&A
We view M&A primarily as a strategic vehicle to further enhance our product portfolio and growth opportunity. We intend to remain opportunistic as it relates to M&A. Recently we announced the acquisitions of Enigma, which closed on July 11 and NetIDEAS, which closed on September 5.
The Enigma acquisition was primarily a technology and domain expertise acquisition supporting PTC’s strategic SLM portfolio and will expand the existing capabilities of PTC’s Technical Information and Services Parts Information solutions. Enigma had approximately 50 employees located in the U.S., Israel, United Kingdom, and Sweden and generated mid-single digit millions in annual revenue. The purchase price of Enigma was less than $10 million.
NetIDEAS, a PTC partner since 2000, has been providing secure, reliable hosting environments for PTC Windchill. This acquisition gives our PLM customers multiple deployment paths to help maximize technology value. NetIDEAS had approximately 20 employees located in the U.S and generated mid-single digit millions in annual revenue. The purchase price for NetIDEAS was less than $20 million.
We continue to evaluate strategic acquisition opportunities of varying size as they arise, and have completed larger transactions such as MKS in Q3’11 and Servigistics in Q1’13. Our forecasted financial, cash and debt positions for FY’14 described above are exclusive of the effects of any acquisitions that we may complete.
Important Information About Non-GAAP References
PTC provides non-GAAP supplemental information to its financial results. Non-GAAP revenue, operating expenses, margin and EPS exclude the effect of purchase accounting on the fair value of acquired deferred revenue of Servigistics, Inc. and MKS, Inc., stock-based compensation expense, amortization of acquired intangible assets, restructuring charges, acquisition-related expenses and gains, certain foreign currency transaction losses, certain litigation gains, and the related tax effects of the preceding items and discrete tax items. We use these non-GAAP measures, and we believe that they assist our investors, to make period-to-period comparisons of our operational performance because they provide a view of our operating results without items that are not, in our view, indicative of our core operating results. We believe that these non-GAAP measures help illustrate underlying trends in our business, and we use the measures to establish budgets and operational goals, communicated internally and externally, for managing our business and evaluating our performance. We believe that providing non-GAAP measures affords investors a view of our operating results that may be more easily compared to the results of peer companies. In addition, compensation of our executives is based in part on the performance of our business based on these non-GAAP measures. However, non-GAAP information should not be construed as an alternative to GAAP information as the items excluded from the non-GAAP measures often have a material impact on PTC’s financial results. Management uses, and investors should consider, non-GAAP measures in conjunction with our GAAP results.
Forward-Looking Statements
Statements in these prepared remarks that are not historic facts, including statements about our first quarter and full fiscal 2014 and other future financial and growth expectations, anticipated tax rates, expected market growth rates and the long-term prospects for PTC, are forward-looking statements that involve risks and uncertainties that could cause actual results to differ materially from those projected. These risks include the possibility that the macroeconomic climate may not improve or may deteriorate, the possibility that customers may not purchase our solutions when or at the rates we expect, the possibility that our pipeline of opportunities may not convert or generate the revenue we expect, the possibility that we will be unable to achieve planned services margins and operating margin improvements, the possibility that foreign currency exchange rates may vary from our expectations and thereby affect our reported revenue and expense, the possibility that we may not achieve the license, services or support revenue that we expect, which could result in a different mix of revenue between license, service and support and could impact our EPS results, the possibility that our restructurings and cost containment measures may not generate the operating margin improvements we expect and could adversely affect our revenue, the possibility that we may be unable to achieve our profitability targets with lower license revenue or without additional restructuring or cost containment measures, the possibility that our expanded SLM solutions, including Servigistics and Enigma, may not generate the revenue we expect, the possibility that sales personnel productivity may not increase as we expect and generate the additional sales pipeline and revenue that we expect, the possibility that we may be unable to expand our services partner ecosystem or improve services margins as we expect, the possibility that we may be unable to attain or maintain a technology leadership position or that any such leadership position may not generate the revenue we expect, the possibility that the markets in which we operate may not grow at the
rates we expect, and the possibility that remedial actions relating to our previously announced investigation in China could adversely affect our revenue and that fines and penalties may be assessed against PTC in connection with the China matter. In addition, our assumptions concerning our future GAAP and non-GAAP effective income tax rates are based on estimates and other factors that could change, including the geographic mix of our revenue, expenses and profits and loans and cash repatriations from foreign subsidiaries. Other risks and uncertainties that could cause actual results to differ materially from those projected are detailed from time to time in reports we file with the Securities and Exchange Commission, including our Annual Report on Form 10-K and our Quarterly Reports on Form 10-Q.
|
PTC Inc.
|
|||||||||||||||||||||||||||||||||||
|
NON-GAAP FINANCIAL MEASURES AND RECONCILIATIONS (UNAUDITED)
|
|||||||||||||||||||||||||||||||||||
|
(in thousands)
|
|||||||||||||||||||||||||||||||||||
|
GAAP MARGINS
|
|||||||||||||||||||||||||||||||||||
|
FY '11
|
Q1 '12
|
Q2 '12
|
Q3 '12
|
Q4 '12
|
|||||||||||||||||||||||||||||||
|
Revenue
|
$ | 1,166,949 | $ | 318,276 | $ | 301,125 | $ | 310,983 | $ | 325,295 | |||||||||||||||||||||||||
|
Cost of license revenue
|
28,792 | 7,659 | 7,824 | 7,634 | 7,478 | ||||||||||||||||||||||||||||||
|
Cost of service revenue
|
260,650 | 71,450 | 66,366 | 65,689 | 61,977 | ||||||||||||||||||||||||||||||
|
Cost of support revenue
|
67,326 | 19,110 | 19,026 | 19,531 | 18,384 | ||||||||||||||||||||||||||||||
|
Gross Margin
|
$ | 810,181 | 69.4 | % | $ | 220,057 | 69.1 | % | $ | 207,909 | 69.0 | % | $ | 218,129 | 70.1 | % | $ | 237,456 | 73.0 | % | |||||||||||||||
|
Sales & marketing
|
$ | 353,051 | 30.3 | % | $ | 97,778 | 30.7 | % | $ | 90,962 | 30.2 | % | $ | 94,706 | 30.5 | % | $ | 94,350 | 29.0 | % | |||||||||||||||
|
Research & development
|
211,406 | 18.1 | % | 54,993 | 17.3 | % | 54,576 | 18.1 | % | 53,260 | 17.1 | % | 52,131 | 16.0 | % | ||||||||||||||||||||
|
General & administrative
|
110,291 | 9.5 | % | 29,572 | 9.3 | % | 29,534 | 9.8 | % | 29,851 | 9.6 | % | 28,511 | 8.8 | % | ||||||||||||||||||||
|
Amortization of acquired intangible assets
|
18,319 | 1.6 | % | 5,209 | 1.6 | % | 5,132 | 1.7 | % | 5,103 | 1.6 | % | 4,859 | 1.5 | % | ||||||||||||||||||||
|
Restructuring charge
|
- | 0.0 | % | - | 0.0 | % | 20,802 | 6.9 | % | 4,126 | 1.3 | % | - | 0.0 | % | ||||||||||||||||||||
|
Operating Expenses
|
$ | 693,067 | 59.4 | % | $ | 187,552 | 58.9 | % | $ | 201,006 | 66.8 | % | $ | 187,046 | 60.1 | % | $ | 179,851 | 55.3 | % | |||||||||||||||
|
GAAP Operating Margin
|
$ | 117,114 | 10.0 | % | $ | 32,505 | 10.2 | % | $ | 6,903 | 2.3 | % | $ | 31,083 | 10.0 | % | $ | 57,605 | 17.7 | % | |||||||||||||||
|
ADJUSTMENTS TO DERIVE NON-GAAP MEASURES
|
|||||||||||||||||||||||||||||||||||
|
FY '11
|
Q1 '12
|
Q2 '12
|
Q3 '12
|
Q4 '12
|
|||||||||||||||||||||||||||||||
|
Revenue:
|
|||||||||||||||||||||||||||||||||||
|
Fair value of deferred revenue
|
$ | 2,606 | 0.2 | % | $ | 1,522 | 0.5 | % | $ | 736 | 0.2 | % | $ | 227 | 0.1 | % | $ | - | 0.0 | % | |||||||||||||||
|
Cost of license revenue:
|
|||||||||||||||||||||||||||||||||||
|
Acquired intangible amortization
|
15,393 | 1.3 | % | 4,103 | 1.3 | % | 3,931 | 1.3 | % | 3,933 | 1.3 | % | 3,852 | 1.2 | % | ||||||||||||||||||||
|
Stock-based compensation
|
15 | 0.0 | % | 5 | 0.0 | % | 7 | 0.0 | % | 4 | 0.0 | % | 6 | 0.0 | % | ||||||||||||||||||||
|
Cost of service revenue:
|
|||||||||||||||||||||||||||||||||||
|
Acquired intangible amortization
|
- | 0.0 | % | - | 0.0 | % | - | 0.0 | % | - | 0.0 | % | - | 0.0 | % | ||||||||||||||||||||
|
Stock-based compensation
|
5,011 | 0.4 | % | 1,563 | 0.5 | % | 1,358 | 0.5 | % | 1,314 | 0.4 | % | 1,447 | 0.4 | % | ||||||||||||||||||||
|
Cost of support revenue:
|
|||||||||||||||||||||||||||||||||||
|
Stock-based compensation
|
2,721 | 0.2 | % | 950 | 0.3 | % | 813 | 0.3 | % | 736 | 0.2 | % | 735 | 0.2 | % | ||||||||||||||||||||
|
Sales & marketing:
|
|||||||||||||||||||||||||||||||||||
|
Stock-based compensation
|
11,428 | 1.0 | % | 3,728 | 1.2 | % | 3,306 | 1.1 | % | 3,334 | 1.1 | % | 3,441 | 1.1 | % | ||||||||||||||||||||
|
Research & development:
|
|||||||||||||||||||||||||||||||||||
|
Stock-based compensation
|
8,547 | 0.7 | % | 2,549 | 0.8 | % | 2,240 | 0.7 | % | 1,886 | 0.6 | % | 2,086 | 0.6 | % | ||||||||||||||||||||
|
General & administrative:
|
|||||||||||||||||||||||||||||||||||
|
Stock-based compensation
|
17,680 | 1.5 | % | 4,587 | 1.4 | % | 4,968 | 1.6 | % | 6,057 | 1.9 | % | 4,185 | 1.3 | % | ||||||||||||||||||||
|
Acquisition-related costs
|
7,761 | 0.7 | % | 2,068 | 0.6 | % | 444 | 0.1 | % | - | 0.0 | % | 1,321 | 0.4 | % | ||||||||||||||||||||
|
Amortization of acquired intangible assets
|
18,319 | 1.6 | % | 5,209 | 1.6 | % | 5,132 | 1.7 | % | 5,103 | 1.6 | % | 4,859 | 1.5 | % | ||||||||||||||||||||
|
Restructuring charge
|
- | 0.0 | % | - | 0.0 | % | 20,802 | 6.9 | % | 4,126 | 1.3 | % | - | 0.0 | % | ||||||||||||||||||||
|
Non-GAAP adjustments
|
$ | 89,481 | 7.7 | % | $ | 26,284 | 8.3 | % | $ | 43,737 | 14.5 | % | $ | 26,720 | 8.6 | % | $ | 21,932 | 6.7 | % | |||||||||||||||
|
NON-GAAP MARGINS
|
|||||||||||||||||||||||||||||||||||
|
FY '11
|
Q1 '12
|
Q2 '12
|
Q3 '12
|
Q4 '12
|
|||||||||||||||||||||||||||||||
|
Revenue
|
$ | 1,169,555 | $ | 319,798 | $ | 301,861 | $ | 311,210 | $ | 325,295 | |||||||||||||||||||||||||
|
Cost of license revenue
|
13,384 | 3,551 | 3,886 | 3,697 | 3,620 | ||||||||||||||||||||||||||||||
|
Cost of service revenue
|
255,639 | 69,887 | 65,008 | 64,375 | 60,530 | ||||||||||||||||||||||||||||||
|
Cost of support revenue
|
64,605 | 18,160 | 18,213 | 18,795 | 17,649 | ||||||||||||||||||||||||||||||
|
Gross Margin
|
$ | 835,927 | 71.5 | % | $ | 228,200 | 71.4 | % | $ | 214,754 | 71.1 | % | $ | 224,343 | 72.1 | % | $ | 243,496 | 74.9 | % | |||||||||||||||
|
Sales & marketing
|
$ | 341,623 | 29.2 | % | $ | 94,050 | 29.4 | % | $ | 87,656 | 29.0 | % | $ | 91,372 | 29.4 | % | $ | 90,909 | 27.9 | % | |||||||||||||||
|
Research & development
|
202,859 | 17.3 | % | 52,444 | 16.4 | % | 52,336 | 17.3 | % | 51,374 | 16.5 | % | 50,045 | 15.4 | % | ||||||||||||||||||||
|
General & administrative
|
84,850 | 7.3 | % | 22,917 | 7.2 | % | 24,122 | 8.0 | % | 23,794 | 7.6 | % | 23,005 | 7.1 | % | ||||||||||||||||||||
|
Amortization of acquired intangible assets
|
- | 0.0 | % | - | 0.0 | % | - | 0.0 | % | - | 0.0 | % | - | 0.0 | % | ||||||||||||||||||||
|
Restructuring charge
|
- | 0.0 | % | - | 0.0 | % | - | 0.0 | % | - | 0.0 | % | - | 0.0 | % | ||||||||||||||||||||
|
Operating Expenses
|
$ | 629,332 | 53.8 | % | $ | 169,411 | 53.0 | % | $ | 164,114 | 54.4 | % | $ | 166,540 | 53.5 | % | $ | 163,959 | 50.4 | % | |||||||||||||||
|
Non-GAAP Operating Margin
|
$ | 206,595 | 17.7 | % | $ | 58,789 | 18.4 | % | $ | 50,640 | 16.8 | % | $ | 57,803 | 18.6 | % | $ | 79,537 | 24.5 | % | |||||||||||||||
|
PTC Inc.
|
||||||||||||||||||||||||||||||||||||||||
|
NON-GAAP FINANCIAL MEASURES AND RECONCILIATIONS (UNAUDITED) - CONTINUED
|
||||||||||||||||||||||||||||||||||||||||
|
(in thousands)
|
||||||||||||||||||||||||||||||||||||||||
|
GAAP MARGINS
|
||||||||||||||||||||||||||||||||||||||||
|
FY '12
|
Q1 '13
|
Q2 '13
|
Q3 '13
|
Q4 '13
|
FY '13
|
|||||||||||||||||||||||||||||||||||
|
Revenue
|
$ | 1,255,679 | $ | 319,751 | $ | 313,949 | $ | 314,996 | $ | 344,845 | $ | 1,293,541 | ||||||||||||||||||||||||||||
|
Cost of license revenue
|
30,595 | 8,012 | 8,291 | 8,431 | 8,270 | 33,004 | ||||||||||||||||||||||||||||||||||
|
Cost of service revenue
|
265,482 | 68,592 | 64,550 | 62,941 | 62,871 | 258,954 | ||||||||||||||||||||||||||||||||||
|
Cost of support revenue
|
76,051 | 20,468 | 20,429 | 19,796 | 20,388 | 81,081 | ||||||||||||||||||||||||||||||||||
|
Gross Margin
|
$ | 883,551 | 70.4 | % | $ | 222,679 | 69.6 | % | $ | 220,679 | 70.3 | % | $ | 223,828 | 71.1 | % | $ | 253,316 | 73.5 | % | $ | 920,502 | 71.2 | % | ||||||||||||||||
|
Sales & marketing
|
$ | 377,796 | 30.1 | % | $ | 93,549 | 29.3 | % | $ | 88,059 | 28.0 | % | $ | 88,298 | 28.0 | % | $ | 90,734 | 26.3 | % | $ | 360,640 | 27.9 | % | ||||||||||||||||
|
Research & development
|
214,960 | 17.1 | % | 57,429 | 18.0 | % | 55,528 | 17.7 | % | 53,834 | 17.1 | % | 55,127 | 16.0 | % | 221,918 | 17.2 | % | ||||||||||||||||||||||
|
General & administrative
|
117,468 | 9.4 | % | 35,817 | 11.2 | % | 33,398 | 10.6 | % | 28,812 | 9.1 | % | 33,910 | 9.8 | % | 131,937 | 10.2 | % | ||||||||||||||||||||||
|
Amortization of acquired intangible assets
|
20,303 | 1.6 | % | 6,623 | 2.1 | % | 6,640 | 2.1 | % | 6,532 | 2.1 | % | 6,691 | 1.9 | % | 26,486 | 2.0 | % | ||||||||||||||||||||||
|
Restructuring charge
|
24,928 | 2.0 | % | 15,402 | 4.8 | % | 15,810 | 5.0 | % | 3,137 | 1.0 | % | 17,848 | 5.2 | % | 52,197 | 4.0 | % | ||||||||||||||||||||||
|
Operating Expenses
|
$ | 755,455 | 60.2 | % | $ | 208,820 | 65.3 | % | $ | 199,435 | 63.5 | % | $ | 180,613 | 57.3 | % | $ | 204,310 | 59.2 | % | $ | 793,178 | 61.3 | % | ||||||||||||||||
|
GAAP Operating Margin
|
$ | 128,096 | 10.2 | % | $ | 13,859 | 4.3 | % | $ | 21,244 | 6.8 | % | $ | 43,215 | 13.7 | % | $ | 49,006 | 14.2 | % | $ | 127,324 | 9.8 | % | ||||||||||||||||
|
ADJUSTMENTS TO DERIVE NON-GAAP MEASURES
|
||||||||||||||||||||||||||||||||||||||||
|
FY '12
|
Q1 '13
|
Q2 '13
|
Q3 '13
|
Q4 '13
|
FY '13
|
|||||||||||||||||||||||||||||||||||
|
Revenue:
|
||||||||||||||||||||||||||||||||||||||||
|
Fair value of deferred revenue
|
$ | 2,485 | 0.2 | % | $ | 1,554 | 0.5 | % | $ | 660 | 0.2 | % | $ | 534 | 0.2 | % | $ | 287 | 0.1 | % | $ | 3,035 | 0.2 | % | ||||||||||||||||
|
Cost of license revenue:
|
||||||||||||||||||||||||||||||||||||||||
|
Acquired intangible amortization
|
15,819 | 1.3 | % | 4,639 | 1.5 | % | 4,628 | 1.5 | % | 4,598 | 1.5 | % | 4,695 | 1.4 | % | 18,560 | 1.4 | % | ||||||||||||||||||||||
|
Stock-based compensation
|
22 | 0.0 | % | 5 | 0.0 | % | 8 | 0.0 | % | 4 | 0.0 | % | 4 | 0.0 | % | 21 | 0.0 | % | ||||||||||||||||||||||
|
Cost of service revenue:
|
||||||||||||||||||||||||||||||||||||||||
|
Acquired intangible amortization
|
- | 0.0 | % | - | 0.0 | % | - | 0.0 | % | - | 0.0 | % | 26 | 0.0 | % | 26 | 0.0 | % | ||||||||||||||||||||||
|
Stock-based compensation
|
5,682 | 0.5 | % | 1,612 | 0.5 | % | 1,420 | 0.5 | % | 1,372 | 0.4 | % | 1,730 | 0.5 | % | 6,134 | 0.5 | % | ||||||||||||||||||||||
|
Cost of support revenue:
|
||||||||||||||||||||||||||||||||||||||||
|
Stock-based compensation
|
3,234 | 0.3 | % | 826 | 0.3 | % | 835 | 0.3 | % | 722 | 0.2 | % | 941 | 0.3 | % | 3,324 | 0.3 | % | ||||||||||||||||||||||
|
Sales & marketing:
|
||||||||||||||||||||||||||||||||||||||||
|
Stock-based compensation
|
13,809 | 1.1 | % | 2,458 | 0.8 | % | 2,835 | 0.9 | % | 2,693 | 0.9 | % | 3,340 | 1.0 | % | 11,326 | 0.9 | % | ||||||||||||||||||||||
|
Research & development:
|
||||||||||||||||||||||||||||||||||||||||
|
Stock-based compensation
|
8,761 | 0.7 | % | 2,512 | 0.8 | % | 1,824 | 0.6 | % | 2,139 | 0.7 | % | 2,115 | 0.6 | % | 8,590 | 0.7 | % | ||||||||||||||||||||||
|
General & administrative:
|
||||||||||||||||||||||||||||||||||||||||
|
Stock-based compensation
|
19,797 | 1.6 | % | 4,480 | 1.4 | % | 4,888 | 1.6 | % | 4,247 | 1.3 | % | 5,777 | 1.7 | % | 19,392 | 1.5 | % | ||||||||||||||||||||||
|
Acquisition-related costs
|
3,833 | 0.3 | % | 4,599 | 1.4 | % | 2,110 | 0.7 | % | 900 | 0.3 | % | 2,246 | 0.7 | % | 9,855 | 0.8 | % | ||||||||||||||||||||||
|
Amortization of acquired intangible assets
|
20,303 | 1.6 | % | 6,623 | 2.1 | % | 6,640 | 2.1 | % | 6,532 | 2.1 | % | 6,691 | 1.9 | % | 26,486 | 2.0 | % | ||||||||||||||||||||||
|
Restructuring charge
|
24,928 | 2.0 | % | 15,402 | 4.8 | % | 15,810 | 5.0 | % | 3,137 | 1.0 | % | 17,848 | 5.2 | % | 52,197 | 4.0 | % | ||||||||||||||||||||||
|
Non-GAAP adjustments
|
$ | 118,673 | 9.5 | % | $ | 44,710 | 14.0 | % | $ | 41,658 | 13.3 | % | $ | 26,878 | 8.5 | % | $ | 45,700 | 13.3 | % | $ | 158,946 | 12.3 | % | ||||||||||||||||
|
NON-GAAP MARGINS
|
||||||||||||||||||||||||||||||||||||||||
|
FY '12
|
Q1 '13
|
Q2 '13
|
Q3 '13
|
Q4 '13
|
FY '13
|
|||||||||||||||||||||||||||||||||||
|
Revenue
|
$ | 1,258,164 | $ | 321,305 | $ | 314,609 | $ | 315,530 | $ | 345,132 | $ | 1,296,576 | ||||||||||||||||||||||||||||
|
Cost of license revenue
|
14,754 | 3,368 | 3,655 | 3,829 | 3,571 | 14,423 | ||||||||||||||||||||||||||||||||||
|
Cost of service revenue
|
259,800 | 66,980 | 63,130 | 61,569 | 61,115 | 252,794 | ||||||||||||||||||||||||||||||||||
|
Cost of support revenue
|
72,817 | 19,642 | 19,594 | 19,074 | 19,447 | 77,757 | ||||||||||||||||||||||||||||||||||
|
Gross Margin
|
$ | 910,793 | 72.4 | % | $ | 231,315 | 72.0 | % | $ | 228,230 | 72.5 | % | $ | 231,058 | 73.2 | % | $ | 260,999 | 75.6 | % | $ | 951,602 | 73.4 | % | ||||||||||||||||
|
Sales & marketing
|
$ | 363,987 | 28.9 | % | $ | 91,091 | 28.4 | % | $ | 85,224 | 27.1 | % | $ | 85,605 | 27.1 | % | $ | 87,394 | 25.3 | % | $ | 349,314 | 26.9 | % | ||||||||||||||||
|
Research & development
|
206,199 | 16.4 | % | 54,917 | 17.1 | % | 53,704 | 17.1 | % | 51,695 | 16.4 | % | 53,012 | 15.4 | % | 213,328 | 16.5 | % | ||||||||||||||||||||||
|
General & administrative
|
93,838 | 7.5 | % | 26,738 | 8.3 | % | 26,400 | 8.4 | % | 23,665 | 7.5 | % | 25,887 | 7.5 | % | 102,690 | 7.9 | % | ||||||||||||||||||||||
|
Amortization of acquired intangible assets
|
- | 0.0 | % | - | 0.0 | % | - | 0.0 | % | - | 0.0 | % | - | 0.0 | % | - | 0.0 | % | ||||||||||||||||||||||
|
Restructuring charge
|
- | 0.0 | % | - | 0.0 | % | - | 0.0 | % | - | 0.0 | % | - | 0.0 | % | - | 0.0 | % | ||||||||||||||||||||||
|
Operating Expenses
|
$ | 664,024 | 52.8 | % | $ | 172,746 | 53.8 | % | $ | 165,328 | 52.6 | % | $ | 160,965 | 51.0 | % | $ | 166,293 | 48.2 | % | $ | 665,332 | 51.3 | % | ||||||||||||||||
|
Non-GAAP Operating Margin
|
$ | 246,769 | 19.6 | % | $ | 58,569 | 18.2 | % | $ | 62,902 | 20.0 | % | $ | 70,093 | 22.2 | % | $ | 94,706 | 27.4 | % | $ | 286,270 | 22.1 | % | ||||||||||||||||
|
PTC Inc.
|
||||||||||||||||
|
NON-GAAP FINANCIAL MEASURES AND RECONCILIATIONS (UNAUDITED)
|
||||||||||||||||
|
(in thousands, except per share data)
|
||||||||||||||||
|
Three Months Ended
|
Twelve Months Ended
|
|||||||||||||||
|
September 30,
|
September 30,
|
September 30,
|
September 30,
|
|||||||||||||
|
2013
|
2012
|
2013
|
2012
|
|||||||||||||
|
GAAP revenue
|
$ | 344,845 | $ | 325,295 | $ | 1,293,541 | $ | 1,255,679 | ||||||||
|
Fair value of acquired company's
|
||||||||||||||||
|
deferred maintenance revenue
|
287 | - | 3,035 | 2,485 | ||||||||||||
|
Non-GAAP revenue
|
$ | 345,132 | $ | 325,295 | $ | 1,296,576 | $ | 1,258,164 | ||||||||
|
GAAP gross margin
|
$ | 253,316 | $ | 237,456 | $ | 920,502 | $ | 883,551 | ||||||||
|
Fair value of acquired company's
|
||||||||||||||||
|
deferred maintenance revenue
|
287 | - | 3,035 | 2,485 | ||||||||||||
|
Stock-based compensation
|
2,675 | 2,188 | 9,479 | 8,938 | ||||||||||||
|
Amortization of acquired intangible assets
|
||||||||||||||||
|
included in cost of revenue
|
4,721 | 3,852 | 18,586 | 15,819 | ||||||||||||
|
Non-GAAP gross margin
|
$ | 260,999 | $ | 243,496 | $ | 951,602 | $ | 910,793 | ||||||||
|
GAAP operating income
|
$ | 49,006 | $ | 57,605 | $ | 127,324 | $ | 128,096 | ||||||||
|
Fair value of acquired company's
|
||||||||||||||||
|
deferred maintenance revenue
|
287 | - | 3,035 | 2,485 | ||||||||||||
|
Stock-based compensation
|
13,907 | 11,900 | 48,787 | 51,305 | ||||||||||||
|
Amortization of acquired intangible assets
|
||||||||||||||||
|
included in cost of revenue
|
4,721 | 3,852 | 18,586 | 15,819 | ||||||||||||
|
Amortization of acquired intangible assets
|
6,691 | 4,859 | 26,486 | 20,303 | ||||||||||||
|
Acquisition-related charges included in
|
||||||||||||||||
|
general and administrative expenses
|
2,246 | 1,321 | 9,855 | 3,833 | ||||||||||||
|
Restructuring charges
|
17,848 | - | 52,197 | 24,928 | ||||||||||||
|
Non-GAAP operating income (1)
|
$ | 94,706 | $ | 79,537 | $ | 286,270 | $ | 246,769 | ||||||||
|
GAAP net income (loss)
|
$ | 56,466 | $ | (83,985 | ) | $ | 143,769 | $ | (35,398 | ) | ||||||
|
Fair value of acquired company's
|
||||||||||||||||
|
deferred maintenance revenue
|
287 | - | 3,035 | 2,485 | ||||||||||||
|
Stock-based compensation
|
13,907 | 11,900 | 48,787 | 51,305 | ||||||||||||
|
Amortization of acquired intangible assets
|
||||||||||||||||
|
included in cost of revenue
|
4,721 | 3,852 | 18,586 | 15,819 | ||||||||||||
|
Amortization of acquired intangible assets
|
6,691 | 4,859 | 26,486 | 20,303 | ||||||||||||
|
Acquisition-related charges included in
|
||||||||||||||||
|
general and administrative expenses
|
2,246 | 1,321 | 9,855 | 3,833 | ||||||||||||
|
Restructuring charges
|
17,848 | - | 52,197 | 24,928 | ||||||||||||
|
Non-operating one-time (gains) losses (2)
|
(594 | ) | - | (5,717 | ) | 761 | ||||||||||
|
Income tax adjustments (3)
|
(29,990 | ) | 122,255 | (77,834 | ) | 98,827 | ||||||||||
|
Non-GAAP net income
|
$ | 71,582 | $ | 60,202 | $ | 219,164 | $ | 182,863 | ||||||||
|
GAAP diluted earnings (loss) per share
|
$ | 0.47 | $ | (0.71 | ) | $ | 1.19 | $ | (0.30 | ) | ||||||
|
Fair value of deferred maintenance revenue
|
- | - | 0.03 | 0.02 | ||||||||||||
|
Stock-based compensation
|
0.11 | 0.10 | 0.40 | 0.42 | ||||||||||||
|
Amortization of acquired intangibles
|
0.09 | 0.07 | 0.37 | 0.30 | ||||||||||||
|
Acquisition-related charges
|
0.02 | 0.01 | 0.08 | 0.03 | ||||||||||||
|
Restructuring charges
|
0.15 | - | 0.43 | 0.21 | ||||||||||||
|
Non-operating one-time (gains) losses (2)
|
- | - | (0.05 | ) | 0.01 | |||||||||||
|
Income tax adjustments (3)
|
(0.25 | ) | 1.01 | (0.64 | ) | 0.82 | ||||||||||
|
Non-GAAP diluted earnings per share
|
$ | 0.59 | $ | 0.50 | $ | 1.81 | $ | 1.51 | ||||||||
|
GAAP diluted weighted average shares outstanding
|
121,267 | 119,048 | 121,240 | 118,705 | ||||||||||||
|
Dilutive effect of stock based compensation plans
|
- | 2,227 | - | 2,293 | ||||||||||||
|
Non-GAAP diluted weighted average shares outstanding
|
121,267 | 121,275 | 121,240 | 120,998 | ||||||||||||
|
PTC Inc.
|
|||||||||||||||||||
|
NON-GAAP FINANCIAL MEASURES AND RECONCILIATIONS (UNAUDITED) - CONTINUED
|
|||||||||||||||||||
|
(in thousands, except per share data)
|
|||||||||||||||||||
| (1 | ) |
Operating margin impact of non-GAAP adjustments:
|
|||||||||||||||||
|
Three Months Ended
|
Twelve Months Ended
|
||||||||||||||||||
|
September 30,
|
September 30,
|
September 30,
|
September 30,
|
||||||||||||||||
| 2013 | 2012 | 2013 | 2012 | ||||||||||||||||
|
GAAP operating margin
|
14.2 | % | 17.7 | % | 9.8 | % | 10.2 | % | |||||||||||
|
Fair value of deferred maintenance revenue
|
0.1 | % | 0.0 | % | 0.2 | % | 0.2 | % | |||||||||||
|
Stock-based compensation
|
4.0 | % | 3.7 | % | 3.8 | % | 4.1 | % | |||||||||||
|
Amortization of acquired intangibles
|
3.3 | % | 2.7 | % | 3.5 | % | 2.9 | % | |||||||||||
|
Acquisition-related charges
|
0.7 | % | 0.4 | % | 0.8 | % | 0.3 | % | |||||||||||
|
Restructuring charges
|
5.2 | % | 0.0 | % | 4.0 | % | 2.0 | % | |||||||||||
|
Non-GAAP operating margin
|
27.4 | % | 24.5 | % | 22.1 | % | 19.6 | % | |||||||||||
| (2 | ) |
The fourth quarter of 2013 includes a gain on investment of $0.6 million, and the third quarter of 2013 includes a legal settlement gain of $5.1 million, which are both excluded from non-GAAP net income. In the first quarter of 2012 we recorded $0.8 million of foreign currency transaction losses related to legal entity mergers completed during the quarter, which is excluded from non-GAAP net income.
|
|||||||||||||||||
| (3 | ) |
Reflects the tax effects of non-GAAP adjustments for the three and twelve months ended September 30, 2013 and September 30, 2012, which are calculated by applying the applicable tax rate by jurisdiction to the non-GAAP adjustments listed above, as well as any discrete tax items. In the fourth quarter of 2012, a valuation allowance was established against our U.S. net deferred tax assets. As the U.S. is profitable on a non-GAAP basis, the 2013 non-GAAP tax provision is being calculated assuming there is no U.S. valuation allowance and, as a result, an income tax (charge)/benefit of ($1.0) million and $18.9 million is included for the three and twelve months ended September 30, 2013, respectively. In the three and twelve months ended September 30, 2013, the non-GAAP tax provision excludes the non-cash benefit related to the reversal of a portion of the valuation allowance in the U.S. of $7.8 million relating to the release of a valuation allowance as a result of the pension gain (decrease in unrecognized actuarial loss) recorded in accumulated other comprehensive income, a $4.1 million benefit related to the release of a portion of the valuation allowance as a result of deferred tax liabilities established in accounting for acquisitions completed in the fourth quarter and a $2.6 million benefit relating to a tax audit in a foreign jurisdiction of an acquired company. The twelve months ended September 30, 2013 non-GAAP tax provision also excludes a non-cash tax benefit of $32.6 million related to the release of deferred tax liabilities established for the Servigistics acquisition recorded in the first quarter and tax benefits of $3.2 million relating to the final resolution of a long standing tax litigation and completion of an international jurisdiction tax audit recorded in the second quarter. The three and twelve months ended September 30, 2012 non-GAAP tax provision excludes a non-cash charge, net, of $124.5 million to establish a valuation allowance against our U.S. net deferred tax assets and $5.4 million, net primarily related to foreign tax credits which would be fully realized on a non-GAAP basis recorded in the fourth quarter of 2012; $3.3 million primarily related to acquired legal entity integration activities recorded in the third quarter of 2012; and $1.4 million related to the impact from a reduction in the statutory tax rate in Japan on deferred tax assets from a litigation settlement recorded in the first quarter of 2012.
|
|||||||||||||||||