Attached files
| file | filename |
|---|---|
| EXCEL - IDEA: XBRL DOCUMENT - Invesco DB Commodity Index Tracking Fund | Financial_Report.xls |
| EX-31.1 - EX-31.1 - Invesco DB Commodity Index Tracking Fund | d590518dex311.htm |
| EX-32.1 - EX-32.1 - Invesco DB Commodity Index Tracking Fund | d590518dex321.htm |
| EX-31.2 - EX-31.2 - Invesco DB Commodity Index Tracking Fund | d590518dex312.htm |
| EX-32.2 - EX-32.2 - Invesco DB Commodity Index Tracking Fund | d590518dex322.htm |
Table of Contents
UNITED STATES
SECURITIES AND EXCHANGE COMMISSION
Washington D.C. 20549
FORM 10-Q
(Mark One)
| x | QUARTERLY REPORT PURSUANT TO SECTION 13 OR 15(d) OF THE SECURITIES EXCHANGE ACT OF 1934 |
For the quarterly period ended September 30, 2013
OR
| ¨ | TRANSITION REPORT PURSUANT TO SECTION 13 OR 15(d) OF THE SECURITIES EXCHANGE ACT OF 1934 |
For the transition period from to
Commission File Number: 001-32726
POWERSHARES DB COMMODITY INDEX TRACKING FUND
(Exact name of Registrant as specified in its charter)
| Delaware | 32-6042243 | |
| (State or Other Jurisdiction of Incorporation or Organization) |
(I.R.S. Employer Identification No.) | |
| c/o DB Commodity Services LLC 60 Wall Street New York, New York |
10005 | |
| (Address of Principal Executive Offices) | (Zip Code) | |
Registrant’s telephone number, including area code: (212) 250-5883
Indicate by check mark whether the Registrant (1) has filed all reports required to be filed by Section 13 or 15(d) of the Securities Exchange Act of 1934 during the preceding 12 months (or for such shorter period that the Registrant was required to file such reports), and (2) has been subject to such filing requirements for the past 90 days. Yes þ No ¨
Indicate by check mark whether the Registrant has submitted electronically and posted on its corporate Web site, if any, an Interactive Data File required to be submitted and posted pursuant to Rule 405 of Regulation S-T (§232.405 of this chapter) during the preceding 12 months (or for such shorter period that the Registrant was required to submit and post such files). Yes þ No ¨
Indicate by check mark whether the registrant is a large accelerated filer, an accelerated filer, a non-accelerated filer, or a smaller reporting company. See definition of “accelerated filer,” “large accelerated filer,” and “smaller reporting company” in Rule 12b-2 of the Exchange Act. (Check one):
| Large Accelerated Filer | x | Accelerated Filer | ¨ | |||
| Non-Accelerated Filer | ¨ (Do not check if a smaller reporting company) | Smaller reporting company | ¨ | |||
Indicate by check mark whether the registrant is a shell company (as defined in Rule 12b-2 of the Exchange Act). Yes ¨ No þ
Indicate the number of outstanding Shares as of September 30, 2013: 250,200,000 Shares.
Table of Contents
POWERSHARES DB COMMODITY INDEX TRACKING FUND
QUARTER ENDED SEPTEMBER 30, 2013
TABLE OF CONTENTS
| Page | ||||||
| PART I. |
1 | |||||
| ITEM 1. |
1 | |||||
| 10 | ||||||
| ITEM 2. |
MANAGEMENT’S DISCUSSION AND ANALYSIS OF FINANCIAL CONDITION AND RESULTS OF OPERATIONS |
18 | ||||
| ITEM 3. |
30 | |||||
| ITEM 4. |
33 | |||||
| PART II. |
34 | |||||
| Item 1. |
34 | |||||
| Item 1A. |
34 | |||||
| Item 2. |
34 | |||||
| Item 3. |
34 | |||||
| Item 4. |
34 | |||||
| Item 5. |
34 | |||||
| Item 6. |
37 | |||||
| 38 | ||||||
Table of Contents
| ITEM 1. | FINANCIAL STATEMENTS. |
PowerShares DB Commodity Index Tracking Fund
Unaudited Statements of Financial Condition
September 30, 2013 and December 31, 2012
| September 30, 2013 |
December 31, 2012 |
|||||||
| Assets |
||||||||
| Equity in broker trading accounts: |
||||||||
| United States Treasury Obligations, at fair value (cost $7,535,801,318 and $5,925,280,784 respectively) |
$ | 7,535,905,234 | $ | 5,925,630,311 | ||||
| Cash held by commodity broker (including restricted cash of $52,889,242 and $2,559,519, respectively) |
359,550,408 | 615,720,406 | ||||||
| Net unrealized appreciation (depreciation) on futures contracts |
(111,856,464 | ) | 73,453,658 | |||||
|
|
|
|
|
|||||
| Deposits with commodity broker |
7,783,599,178 | 6,614,804,375 | ||||||
|
|
|
|
|
|||||
| Receivable for securities sold |
9,999,917 | — | ||||||
|
|
|
|
|
|||||
| Total assets |
$ | 7,793,599,095 | $ | 6,614,804,375 | ||||
|
|
|
|
|
|||||
| Liabilities |
||||||||
| Payable for LME contracts |
$ | 52,889,242 | $ | 2,559,519 | ||||
| Payable for securities purchased |
1,266,967,973 | — | ||||||
| Payable for shares redeemed |
10,325,752 | — | ||||||
| Management fee payable |
4,646,950 | 4,705,227 | ||||||
| Brokerage fee payable |
9,019 | 205 | ||||||
|
|
|
|
|
|||||
| Total liabilities |
1,334,838,936 | 7,264,951 | ||||||
|
|
|
|
|
|||||
| Commitments and Contingencies (Note 9) |
||||||||
| Equity |
||||||||
| Shareholders’ equity—General Shares |
1,032 | 1,109 | ||||||
| Shareholders’ equity—Shares |
6,458,759,127 | 6,607,538,315 | ||||||
|
|
|
|
|
|||||
| Total shareholders’ equity |
6,458,760,159 | 6,607,539,424 | ||||||
|
|
|
|
|
|||||
| Total liabilities and equity |
$ | 7,793,599,095 | $ | 6,614,804,375 | ||||
|
|
|
|
|
|||||
| General Shares outstanding |
40 | 40 | ||||||
| Shares outstanding |
250,200,000 | 238,400,000 | ||||||
| Net asset value per share |
||||||||
| General Shares |
$ | 25.81 | $ | 27.72 | ||||
| Shares |
$ | 25.81 | $ | 27.72 | ||||
See accompanying notes to unaudited financial statements.
1
Table of Contents
PowerShares DB Commodity Index Tracking Fund
Unaudited Schedule of Investments
September 30, 2013
| Description |
Percentage of Net Assets |
Fair Value |
Face Value |
|||||||||
| United States Treasury Obligations |
||||||||||||
| U.S. Treasury Bills, 0.02% due October 3, 2013 |
19.62 | % | $ | 1,266,998,733 | $ | 1,267,000,000 | ||||||
| U.S. Treasury Bills, 0.04% due October 17, 2013 |
13.04 | 841,992,422 | 842,000,000 | |||||||||
| U.S. Treasury Bills, 0.015% due October 24, 2013 |
13.64 | 880,987,666 | 881,000,000 | |||||||||
| U.S. Treasury Bills, 0.12% due October 31, 2013 |
9.12 | 588,986,453 | 589,000,000 | |||||||||
| U.S. Treasury Bills, 0.04% due November 7, 2013 |
0.91 | 58,998,702 | 59,000,000 | |||||||||
| U.S. Treasury Bills, 0.055% due November 14, 2013 |
2.35 | 151,995,896 | 152,000,000 | |||||||||
| U.S. Treasury Bills, 0.05% due November 21, 2013 |
2.60 | 167,996,808 | 168,000,000 | |||||||||
| U.S. Treasury Bills, 0.04% due November 29, 2013 |
5.73 | 369,995,560 | 370,000,000 | |||||||||
| U.S. Treasury Bills, 0.03% due December 5, 2013 |
10.17 | 656,998,686 | 657,000,000 | |||||||||
| U.S. Treasury Bills, 0.02% due December 12, 2013 |
10.31 | 665,986,680 | 666,000,000 | |||||||||
| U.S. Treasury Bills, 0.01% due December 19, 2013 |
3.78 | 243,994,632 | 244,000,000 | |||||||||
| U.S. Treasury Bills, 0.02% due December 26, 2013 |
5.79 | 373,993,268 | 374,000,000 | |||||||||
| U.S. Treasury Bills, 0.01% due January 2, 2014 |
19.62 | 1,266,979,728 | 1,267,000,000 | |||||||||
|
|
|
|
|
|||||||||
| Total United States Treasury Obligations (cost $7,535,801,318) |
116.68 | % | $ | 7,535,905,234 | ||||||||
|
|
|
|
|
|||||||||
A portion of the above United States Treasury Obligations are held as initial margin against open futures contracts, as described in Note 4(e).
| Description |
Percentage of Net Assets |
Unrealized Appreciation/ (Depreciation) |
Notional Market Value |
|||||||||
| Futures Contracts |
||||||||||||
| LME Aluminum (5,428 contracts, settlement date October 13, 2014) |
0.07 | % | $ | 4,361,475 | $ | 264,411,450 | ||||||
| ICE-UK Brent Crude (8,728 contracts, settlement date March 14, 2014) |
0.23 | 14,781,800 | 912,076,000 | |||||||||
| LME Copper (1,515 contracts, settlement date March 17, 2014) |
(0.51 | ) | (33,206,225 | ) | 277,207,125 | |||||||
| CBOT Corn (12,391 contracts, settlement date December 13, 2013) |
(1.70 | ) | (109,969,625 | ) | 273,531,325 | |||||||
| COMEX Gold (3,220 contracts, settlement date April 28, 2014) |
0.39 | 25,300,960 | 427,809,200 | |||||||||
| NYMEX Natural Gas (9,067 contracts, settlement date September 26, 2014) |
(0.09 | ) | (5,632,560 | ) | 351,164,910 | |||||||
| NYMEX NY Harbor ULSD (7,071 contracts, settlement date March 31, 2014) |
(0.11 | ) | (6,973,630 | ) | 871,107,602 | |||||||
| NYMEX RBOB Gasoline (8,345 contracts, settlement date October 31, 2013) |
0.51 | 32,876,122 | 921,157,818 | |||||||||
| COMEX Silver (864 contracts, settlement date December 27, 2013) |
(0.62 | ) | (39,807,785 | ) | 93,778,560 | |||||||
| CBOT Soybeans (5,893 contracts, settlement date November 14, 2013) |
(0.19 | ) | (12,414,337 | ) | 377,962,288 | |||||||
| ICE-US Sugar (17,738 contracts, settlement date June 30, 2014) |
0.25 | 16,459,744 | 357,200,749 | |||||||||
| CBOT Wheat (8,172 contracts, settlement date July 14, 2014) |
(0.44 | ) | (28,589,763 | ) | 276,622,200 | |||||||
| NYMEX WTI Crude (10,188 contracts, settlement date June 20, 2014) |
0.65 | 42,022,060 | 974,176,560 | |||||||||
| LME Zinc (5,795 contracts, settlement date December 16, 2013) |
(0.17 | ) | (11,064,700 | ) | 277,399,406 | |||||||
|
|
|
|
|
|
|
|||||||
| Total Futures Contracts |
(1.73 | )% | $ | (111,856,464 | ) | $ | 6,655,605,193 | |||||
|
|
|
|
|
|
|
|||||||
Net unrealized depreciation is comprised of unrealized losses of $259,051,188 and unrealized gains of $147,194,724 .
See accompanying notes to unaudited financial statements.
2
Table of Contents
PowerShares DB Commodity Index Tracking Fund
Unaudited Schedule of Investments
December 31, 2012
| Description |
Percentage of Net Assets |
Fair Value |
Face Value |
|||||||||
| United States Treasury Obligations |
||||||||||||
| U.S. Treasury Bills, 0.06% due January 3, 2013 |
22.01 | % | $ | 1,454,000,000 | $ | 1,454,000,000 | ||||||
| U.S. Treasury Bills, 0.05% due January 10, 2013 |
2.35 | 155,499,067 | 155,500,000 | |||||||||
| U.S. Treasury Bills, 0.015% due January 17, 2013 |
4.62 | 304,997,865 | 305,000,000 | |||||||||
| U.S. Treasury Bills, 0.045% due January 24, 2013 |
12.63 | 834,290,823 | 834,300,000 | |||||||||
| U.S. Treasury Bills, 0.075% due January 31, 2013 |
8.67 | 572,988,540 | 573,000,000 | |||||||||
| U.S. Treasury Bills, 0.105% due February 7, 2013 |
1.66 | 109,996,920 | 110,000,000 | |||||||||
| U.S. Treasury Bills, 0.105% due February 14, 2013 |
1.70 | 111,996,304 | 112,000,000 | |||||||||
| U.S. Treasury Bills, 0.09% due February 21, 2013 |
5.10 | 336,987,194 | 337,000,000 | |||||||||
| U.S. Treasury Bills, 0.1% due February 28, 2013 |
4.10 | 270,989,160 | 271,000,000 | |||||||||
| U.S. Treasury Bills, 0.09% due March 7, 2013 |
7.26 | 479,974,560 | 480,000,000 | |||||||||
| U.S. Treasury Bills, 0.09% due March 14, 2013 |
8.64 | 570,963,456 | 571,000,000 | |||||||||
| U.S. Treasury Bills, 0.04% due March 21, 2013 |
4.52 | 298,979,070 | 299,000,000 | |||||||||
| U.S. Treasury Bills, 0.085% due March 28, 2013 |
6.42 | 423,967,352 | 424,000,000 | |||||||||
|
|
|
|
|
|||||||||
| Total United States Treasury Obligations (cost $5,925,280,784) |
89.68 | % | $ | 5,925,630,311 | ||||||||
|
|
|
|
|
|||||||||
A portion of the above United States Treasury Obligations are held as initial margin against open futures contracts, as described in Note 4(e).
| Description |
Percentage of Net Assets |
Unrealized Appreciation/ (Depreciation) |
Notional Market Value |
|||||||||
| Futures Contracts |
||||||||||||
| LME Aluminum (5,584 contracts, settlement date October 14, 2013) |
0.06 | % | $ | 4,274,457 | $ | 292,933,943 | ||||||
| ICE-UK Brent Crude (7,827 contracts, settlement date January 16, 2013) |
0.47 | 31,308,870 | 838,349,100 | |||||||||
| LME Copper (1,458 contracts, settlement date March 18, 2013) |
(0.27 | ) | (17,985,288 | ) | 307,042,900 | |||||||
| CBOT Corn (11,807 contracts, settlement date December 13, 2013) |
(0.33 | ) | (22,059,150 | ) | 376,121,563 | |||||||
| COMEX Gold (3,080 contracts, settlement date August 28, 2013) |
(0.14 | ) | (9,315,570 | ) | 527,371,570 | |||||||
| NYMEX Heating Oil (6,706 contracts, settlement date March 28, 2013) |
(0.16 | ) | (10,740,551 | ) | 854,457,282 | |||||||
| NYMEX Natural Gas (9,458 contracts, settlement date September 26, 2013) |
0.04 | 2,828,670 | 340,496,730 | |||||||||
| NYMEX RBOB Gasoline (7,897 contracts, settlement date October 31, 2013) |
0.27 | 18,136,285 | 833,536,213 | |||||||||
| NYMEX RBOB Gasoline (55 contracts, settlement date November 29, 2013) |
(0.00 | ) | 104,614 | 5,772,950 | ||||||||
| COMEX Silver (823 contracts, settlement date December 27, 2013) |
(0.09 | ) | (6,092,775 | ) | 131,254,615 | |||||||
| CBOT Soybeans (5,616 contracts, settlement date November 14, 2013) |
(0.11 | ) | (7,524,525 | ) | 373,336,725 | |||||||
| ICE-US Sugar (17,623 contracts, settlement date June 28, 2013) |
(0.19 | ) | (12,437,813 | ) | 402,061,195 | |||||||
| CBOT Wheat (8,389 contracts, settlement date July 12, 2013) |
0.36 | 24,084,450 | 308,853,988 | |||||||||
| ICE WTI Crude (786 contracts, settlement date June 19, 2013) |
0.06 | 3,744,270 | 69,903,930 | |||||||||
| NYMEX WTI Crude (8,546 contracts, settlement date June 20, 2013) |
0.82 | 54,023,470 | 746,736,730 | |||||||||
| LME Zinc (5,522 contracts, settlement date December 16, 2013) |
0.32 | 21,104,244 | 274,391,781 | |||||||||
|
|
|
|
|
|
|
|||||||
| Total Futures Contracts |
1.11 | % | $ | 73,453,658 | $ | 6,682,621,215 | ||||||
|
|
|
|
|
|
|
|||||||
Net unrealized appreciation is comprised of unrealized gains of $181,952,772 and unrealized losses of $108,499,114 .
See accompanying notes to unaudited financial statements.
3
Table of Contents
PowerShares DB Commodity Index Tracking Fund
Unaudited Statements of Income and Expenses
For the Three Months Ended September 30, 2013 and 2012 and Nine Months Ended September 30, 2013 and 2012
| Three Months Ended | Nine Months Ended | |||||||||||||||
| September 30, 2013 |
September 30, 2012 |
September 30, 2013 |
September 30, 2012 |
|||||||||||||
| Income |
||||||||||||||||
| Interest Income |
$ | 673,579 | $ | 1,244,368 | $ | 2,840,414 | $ | 2,686,045 | ||||||||
|
|
|
|
|
|
|
|
|
|||||||||
| Expenses |
||||||||||||||||
| Management Fee |
13,890,282 | 13,320,547 | 41,975,914 | 38,825,617 | ||||||||||||
| Brokerage Commissions and Fees |
297,320 | 303,699 | 1,003,674 | 988,074 | ||||||||||||
|
|
|
|
|
|
|
|
|
|||||||||
| Total Expenses |
14,187,602 | 13,624,246 | 42,979,588 | 39,813,691 | ||||||||||||
|
|
|
|
|
|
|
|
|
|||||||||
| Net investment income (loss) |
(13,514,023 | ) | (12,379,878 | ) | (40,139,174 | ) | (37,127,646 | ) | ||||||||
|
|
|
|
|
|
|
|
|
|||||||||
| Net Realized and Net Change in Unrealized Gain (Loss) on United States Treasury Obligations and Futures |
||||||||||||||||
| Net Realized Gain (Loss) on |
||||||||||||||||
| United States Treasury Obligations |
5,984 | 1,156 | 54,182 | 16,347 | ||||||||||||
| Futures |
(193,572,331 | ) | (189,683,137 | ) | (260,318,838 | ) | (448,136,094 | ) | ||||||||
|
|
|
|
|
|
|
|
|
|||||||||
| Net realized gain (loss) |
(193,566,347 | ) | (189,681,981 | ) | (260,264,656 | ) | (448,119,747 | ) | ||||||||
|
|
|
|
|
|
|
|
|
|||||||||
| Net Change in Unrealized Gain (Loss) on |
||||||||||||||||
| United States Treasury Obligations |
(64,069 | ) | 27,749 | (245,611 | ) | 156,670 | ||||||||||
| Futures |
370,155,771 | 857,601,282 | (185,310,122 | ) | 867,583,000 | |||||||||||
|
|
|
|
|
|
|
|
|
|||||||||
| Net change in unrealized gain (loss) |
370,091,702 | 857,629,031 | (185,555,733 | ) | 867,739,670 | |||||||||||
|
|
|
|
|
|
|
|
|
|||||||||
| Net realized and net change in unrealized gain (loss) on United States Treasury Obligations and Futures |
176,525,355 | 667,947,050 | (445,820,389 | ) | 419,619,923 | |||||||||||
|
|
|
|
|
|
|
|
|
|||||||||
| Net Income (Loss) |
$ | 163,011,332 | $ | 655,567,172 | $ | (485,959,563 | ) | $ | 382,492,277 | |||||||
|
|
|
|
|
|
|
|
|
|||||||||
See accompanying notes to unaudited financial statements.
4
Table of Contents
PowerShares DB Commodity Index Tracking Fund
Unaudited Statement of Changes in Shareholders’ Equity
For the Three Months Ended September 30, 2013
| General Shares | Shares | |||||||||||||||||||
| Shares | Total Equity |
Shares | Total Equity |
Total Shareholders’ Equity |
||||||||||||||||
| Balance at July 1, 2013 |
40 | $ | 1,004 | 241,600,000 | $ | 6,066,823,941 | $ | 6,066,824,945 | ||||||||||||
| Sale of Shares |
17,400,000 | 459,299,144 | 459,299,144 | |||||||||||||||||
| Redemption of Shares |
(8,800,000 | ) | (230,375,262 | ) | (230,375,262 | ) | ||||||||||||||
| Net Income (Loss) |
||||||||||||||||||||
| Net investment income (loss) |
(4 | ) | (13,514,019 | ) | (13,514,023 | ) | ||||||||||||||
| Net realized gain (loss) on United States Treasury Obligations and Futures |
(26 | ) | (193,566,321 | ) | (193,566,347 | ) | ||||||||||||||
| Net change in unrealized gain (loss) on United States Treasury Obligations and Futures |
58 | 370,091,644 | 370,091,702 | |||||||||||||||||
|
|
|
|
|
|
|
|
|
|
|
|||||||||||
| Net Income (Loss) |
28 | 163,011,304 | 163,011,332 | |||||||||||||||||
|
|
|
|
|
|
|
|
|
|
|
|||||||||||
| Balance at September 30, 2013 |
40 | $ | 1,032 | 250,200,000 | $ | 6,458,759,127 | $ | 6,458,760,159 | ||||||||||||
|
|
|
|
|
|
|
|
|
|
|
|||||||||||
See accompanying notes to unaudited financial statements.
5
Table of Contents
PowerShares DB Commodity Index Tracking Fund
Unaudited Statement of Changes in Shareholders’ Equity
For the Three Months Ended September 30, 2012
| General Shares | Shares | |||||||||||||||||||
| Shares | Total Equity |
Shares | Total Equity |
Total Shareholders’ Equity |
||||||||||||||||
| Balance at July 1, 2012 |
40 | $ | 1,030 | 215,200,000 | $ | 5,544,489,990 | $ | 5,544,491,020 | ||||||||||||
| Sale of Shares |
22,400,000 | 623,655,448 | 623,655,448 | |||||||||||||||||
| Redemption of Shares |
(4,200,000 | ) | (116,365,794 | ) | (116,365,794 | ) | ||||||||||||||
| Net Income (Loss) |
||||||||||||||||||||
| Net investment income (loss) |
(4 | ) | (12,379,874 | ) | (12,379,878 | ) | ||||||||||||||
| Net realized gain (loss) on United States Treasury Obligations and Futures |
(49 | ) | (189,681,932 | ) | (189,681,981 | ) | ||||||||||||||
| Net change in unrealized gain (loss) on United States Treasury Obligations and Futures |
173 | 857,628,858 | 857,629,031 | |||||||||||||||||
|
|
|
|
|
|
|
|
|
|
|
|||||||||||
| Net Income (Loss) |
120 | 655,567,052 | 655,567,172 | |||||||||||||||||
|
|
|
|
|
|
|
|
|
|
|
|||||||||||
| Balance at September 30, 2012 |
40 | $ | 1,150 | 233,400,000 | $ | 6,707,346,696 | $ | 6,707,347,846 | ||||||||||||
|
|
|
|
|
|
|
|
|
|
|
|||||||||||
See accompanying notes to unaudited financial statements.
6
Table of Contents
PowerShares DB Commodity Index Tracking Fund
Unaudited Statement of Changes in Shareholders’ Equity
For the Nine Months Ended September 30, 2013
| General Shares | Shares | |||||||||||||||||||
| Shares | Total Equity |
Shares | Total Equity |
Total Shareholders’ Equity |
||||||||||||||||
| Balance at January 1, 2013 |
40 | $ | 1,109 | 238,400,000 | $ | 6,607,538,315 | $ | 6,607,539,424 | ||||||||||||
| Sale of Shares |
41,800,000 | 1,125,179,534 | 1,125,179,534 | |||||||||||||||||
| Redemption of Shares |
(30,000,000 | ) | (787,999,236 | ) | (787,999,236 | ) | ||||||||||||||
| Net Income (Loss) |
||||||||||||||||||||
| Net investment income (loss) |
(6 | ) | (40,139,168 | ) | (40,139,174 | ) | ||||||||||||||
| Net realized gain (loss) on United States Treasury Obligations and Futures |
(42 | ) | (260,264,614 | ) | (260,264,656 | ) | ||||||||||||||
| Net change in unrealized gain (loss) on United States Treasury Obligations and Futures |
(29 | ) | (185,555,704 | ) | (185,555,733 | ) | ||||||||||||||
|
|
|
|
|
|
|
|
|
|
|
|||||||||||
| Net Income (Loss) |
(77 | ) | (485,959,486 | ) | (485,959,563 | ) | ||||||||||||||
|
|
|
|
|
|
|
|
|
|
|
|||||||||||
| Balance at September 30, 2013 |
40 | $ | 1,032 | 250,200,000 | $ | 6,458,759,127 | $ | 6,458,760,159 | ||||||||||||
|
|
|
|
|
|
|
|
|
|
|
|||||||||||
See accompanying notes to unaudited financial statements.
7
Table of Contents
PowerShares DB Commodity Index Tracking Fund
Unaudited Statement of Changes in Shareholders’ Equity
For the Nine Months Ended September 30, 2012
| General Shares | Shares | |||||||||||||||||||
| Shares | Total Equity |
Shares | Total Equity |
Total Shareholders’ Equity |
||||||||||||||||
| Balance at January 1, 2012 |
40 | $ | 1,073 | 203,800,000 | $ | 5,467,381,496 | $ | 5,467,382,569 | ||||||||||||
| Sale of Shares |
53,200,000 | 1,486,852,502 | 1,486,852,502 | |||||||||||||||||
| Redemption of Shares |
(23,600,000 | ) | (629,379,502 | ) | (629,379,502 | ) | ||||||||||||||
| Net Income (Loss) |
||||||||||||||||||||
| Net investment income (loss) |
(8 | ) | (37,127,638 | ) | (37,127,646 | ) | ||||||||||||||
| Net realized gain (loss) on United States Treasury Obligations and Futures |
(90 | ) | (448,119,657 | ) | (448,119,747 | ) | ||||||||||||||
| Net change in unrealized gain (loss) on United States Treasury Obligations and Futures |
175 | 867,739,495 | 867,739,670 | |||||||||||||||||
|
|
|
|
|
|
|
|
|
|
|
|||||||||||
| Net Income (Loss) |
77 | 382,492,200 | 382,492,277 | |||||||||||||||||
|
|
|
|
|
|
|
|
|
|
|
|||||||||||
| Balance at September 30, 2012 |
40 | $ | 1,150 | 233,400,000 | $ | 6,707,346,696 | $ | 6,707,347,846 | ||||||||||||
|
|
|
|
|
|
|
|
|
|
|
|||||||||||
See accompanying notes to unaudited financial statements.
8
Table of Contents
PowerShares DB Commodity Index Tracking Fund
Unaudited Statements of Cash Flows
For the Nine Months Ended September 30, 2013 and 2012
| Nine Months Ended | ||||||||
| September 30, 2013 |
September 30, 2012 |
|||||||
| Cash flows from operating activities: |
||||||||
| Net Income (Loss) |
$ | (485,959,563 | ) | $ | 382,492,277 | |||
| Adjustments to reconcile net income (loss) to net cash provided by (used for) operating activities: |
||||||||
| Cost of securities purchased |
(19,663,229,785 | ) | (17,711,121,495 | ) | ||||
| Proceeds from securities sold and matured |
19,312,770,955 | 17,239,366,177 | ||||||
| Net accretion of discount on United States Treasury Obligations |
(3,039,466 | ) | (2,708,200 | ) | ||||
| Net realized (gain) loss on United States Treasury Obligations |
(54,182 | ) | (16,347 | ) | ||||
| Net change in unrealized (gain) loss on United States Treasury Obligations and Futures |
185,555,733 | (867,739,670 | ) | |||||
| Change in operating receivables and liabilities: |
||||||||
| Receivable for LME contracts |
— | (14,688,448 | ) | |||||
| Payable for LME contracts |
50,329,723 | (17,231,831 | ) | |||||
| Management fee payable |
(58,277 | ) | 5,201,315 | |||||
| Brokerage fee payable |
8,814 | (1,430 | ) | |||||
|
|
|
|
|
|||||
| Net cash provided by (used for) operating activities |
(603,676,048 | ) | (986,447,652 | ) | ||||
|
|
|
|
|
|||||
| Cash flows from financing activities: |
||||||||
| Proceeds from sale of Shares |
1,125,179,534 | 1,497,583,378 | ||||||
| Redemption of Shares |
(777,673,484 | ) | (629,379,502 | ) | ||||
|
|
|
|
|
|||||
| Net cash provided by (used for) financing activities |
347,506,050 | 868,203,876 | ||||||
|
|
|
|
|
|||||
| Net change in cash held by broker |
(256,169,998 | ) | (118,243,776 | ) | ||||
| Cash held by broker at beginning of period |
615,720,406 | 542,289,641 | ||||||
|
|
|
|
|
|||||
| Cash held by broker at end of period |
$ | 359,550,408 | $ | 424,045,865 | ||||
|
|
|
|
|
|||||
See accompanying notes to unaudited financial statements.
9
Table of Contents
PowerShares DB Commodity Index Tracking Fund
Notes to Unaudited Financial Statements
September 30, 2013
(1) Organization
PowerShares DB Commodity Index Tracking Fund (the “Fund”) was formed as a Delaware statutory trust on May 23, 2005. DB Commodity Services LLC, a Delaware Limited Liability Company (“DBCS” or the “Managing Owner”), seeded the Fund with a capital contribution of $1,000 in exchange for 40 General Shares of the Fund. The Fund was originally named “DB Commodity Index Tracking Fund”. The Fund changed its name to “PowerShares DB Commodity Index Tracking Fund” effective August 10, 2006. The fiscal year end of the Fund is December 31st. The term of the Fund is perpetual (unless terminated earlier in certain circumstances) as provided in the Fourth Amended and Restated Declaration of Trust and Trust Agreement of the Fund (the “Trust Agreement”).
The Fund offers common units of beneficial interest (the “Shares”) only to certain eligible financial institutions (the “Authorized Participants”) in one or more blocks of 200,000 Shares, called a Basket. The Fund commenced investment operations on January 31, 2006. The Fund commenced trading on the American Stock Exchange (now known as the NYSE Alternext US LLC (the “NYSE Alternext”)) on February 3, 2006 and, as of November 25, 2008, is listed on the NYSE Arca, Inc. (the “NYSE Arca”).
This Report covers the three months ended September 30, 2013 and 2012 (hereinafter referred to as the “Three Months Ended September 30, 2013” and the “Three Months Ended September 30, 2012”, respectively) and the nine months ended September 30, 2013 and 2012 (hereinafter referred to as the “Nine Months Ended September 30, 2013” and the “Nine Months Ended September 30, 2012”, respectively).
The accompanying unaudited financial statements were prepared in accordance with accounting principles generally accepted in the United States of America (“U.S. GAAP”) for interim financial information and with the instructions for Form 10-Q and the rules and regulations of the U.S. Securities and Exchange Commission (the “SEC”). In the opinion of management, all material adjustments, consisting only of normal recurring adjustments, considered necessary for a fair statement of the interim period financial statements have been made. Interim period results are not necessarily indicative of results for a full-year period. These financial statements and the notes thereto should be read in conjunction with the Fund’s financial statements included in its Annual Report on Form 10-K for the year ended December 31, 2012 as filed with the SEC on February 22, 2013.
(2) Fund Investment Overview
The Fund invests with a view to tracking the changes, whether positive or negative, in the level of the DBIQ Optimum Yield Diversified Commodity Index Excess Return™ (the “Index”) over time, plus the excess, if any, of the Fund’s interest income from its holdings of United States Treasury Obligations and other high credit quality short-term fixed income securities over the expenses of the Fund.
The Index is intended to reflect the change in market value of the commodity sector. The commodities comprising the Index are Light Sweet Crude Oil, Heating Oil, Aluminum, Gold, Corn, Wheat, Brent Crude, Copper Grade A, Natural Gas, RBOB Gasoline, Silver, Soybeans, Sugar and Zinc (the “Index Commodities”).
The Commodity Futures Trading Commission (the “CFTC”) and/or commodity exchanges, as applicable, impose position limits on market participants trading in certain commodities futures contracts included in the Index. The Index is comprised of futures contracts on the Index Commodities that expire in a specific month and trade on a specific exchange (the “Index Contracts”). As disclosed in the Fund’s Prospectus, if the Managing Owner determines in its commercially reasonable judgment that it has become impracticable or inefficient for any reason for the Fund to gain full or partial exposure to any Index Commodity by investing in a specific Index Contract, the Fund may invest in a futures contract referencing the particular Index Commodity other than the Index Contract or, in the alternative, invest in other futures contracts not based on the particular Index Commodity if, in the commercially reasonable judgment of the Managing Owner, such futures contracts tend to exhibit trading prices that correlate with such Index Commodity. Because the Fund is approaching or has reached position limits with respect to certain futures contracts comprising the Index, the Fund has commenced investing in other futures contracts based on commodities that comprise the Fund’s Index and in futures contracts based on commodities other than commodities that comprise the Fund’s Index.
The Fund has been subject to accountability levels with respect to both light sweet crude oil (WTI) and RBOB Gasoline, each of which are index futures contracts that are listed on the NYMEX. As a result of reaching the accountability levels with respect to light sweet crude oil (WTI), the Fund invested in the ICE West Texas Intermediate Light Sweet Crude Oil futures contracts with comparable expirations during the period from January 2, 2013 to June 3, 2013. As a result of reaching the accountability levels with respect to RBOB Gasoline, the Fund invested in the next sequential expiring RBOB Gasoline futures contract also listed on the NYMEX during the period from January 2, 2013 and continued to maintain its positions in such contracts as of September 30, 2013.
10
Table of Contents
PowerShares DB Commodity Index Tracking Fund
Notes to Unaudited Financial Statements—(Continued)
September 30, 2013
During the period from December 12, 2012 to June 10, 2013, the Managing Owner was ordered by the Market Regulation Department of the NYMEX to no longer increase, on either an intraday or end of day basis, the Fund’s net positions in RBOB Gasoline futures contracts. Such order was retracted effective June 10, 2013.
During the period from November 30, 2012 to January 25, 2013, the Managing Owner was ordered by the Market Regulation Department of the NYMEX to no longer increase, on either an intraday or end of day basis, the Fund’s net positions in light sweet crude oil (WTI) futures contracts. Such order was retracted effective January 25, 2013.
The Fund also holds United States Treasury Obligations for deposit with the Fund’s commodity broker as margin. The Fund does not employ leverage. As of September 30, 2013 and December 31, 2012, the Fund had $7,783,599,178 (or 99.9%) and $6,614,804,375 (or 100%), respectively, of its holdings of cash, United States Treasury Obligations and unrealized appreciation/depreciation of futures contracts on deposit with its Commodity Broker. Of this, $355,635,088 (or 4.57%) and $381,122,419 (or 5.76%), respectively, of the Fund’s holdings of cash and United States Treasury Obligations are required to be deposited as margin in support of the Fund’s long futures positions as of September 30, 2013 and December 31, 2012. For additional information, please see the unaudited Schedule of Investments as of September 30, 2013 and the audited Schedule of Investments as of December 31, 2012 for details of the Fund’s portfolio holdings.
DBIQ™ is a trademark of Deutsche Bank AG London (the “Index Sponsor”). Trademark applications in the United States are pending with respect to both the Fund and aspects of the Index. The Fund and the Managing Owner have been licensed by the Index Sponsor to use the above noted trademark. Deutsche Bank AG London is an affiliate of the Fund and the Managing Owner.
(3) Service Providers and Related Party Agreements
The Trustee
Under the Trust Agreement, Wilmington Trust Company, the trustee of the Fund (the “Trustee”), has delegated to the Managing Owner the exclusive management and control of all aspects of the business of the Fund. The Trustee will have no duty or liability to supervise or monitor the performance of the Managing Owner, nor will the Trustee have any liability for the acts or omissions of the Managing Owner.
The Managing Owner
The Managing Owner serves as the Fund’s commodity pool operator, commodity trading advisor, and managing owner, and is an indirect wholly-owned subsidiary of Deutsche Bank AG. The Fund pays the Managing Owner a management fee (the “Management Fee”), monthly in arrears, in an amount equal to 0.85% per annum of the daily net asset value of the Fund. During the Three Months Ended September 30, 2013 and 2012, the Fund incurred Management Fees of $13,890,282 and $13,320,547, respectively. Management Fees incurred during the Nine Months Ended September 30, 2013 and 2012 by the Fund were $41,975,914 and $38,825,617, respectively. As of September 30, 2013 and December 31, 2012, Management Fees payable to the Managing Owner were $4,646,950 and $4,705,227, respectively.
The Commodity Broker
Deutsche Bank Securities Inc., a Delaware corporation, serves as the Fund’s futures clearing broker (the “Commodity Broker”). The Commodity Broker is also an indirect wholly-owned subsidiary of Deutsche Bank AG and is an affiliate of the Managing Owner. In its capacity as clearing broker, the Commodity Broker executes and clears the Fund’s futures transactions and performs certain administrative and custodial services for the Fund. As custodian of the Fund’s assets, the Commodity Broker is responsible, among other things, for providing periodic accountings of all dealings and actions taken by the Fund during the reporting period, together with an accounting of all securities, cash or other indebtedness or obligations held by it or its nominees for or on behalf of the Fund. During the Three Months Ended September 30, 2013 and 2012, the Fund incurred brokerage fees of $297,320 and $303,699 respectively. Brokerage fees incurred during the Nine Months Ended September 30, 2013 and 2012 by the Fund were $1,003,674 and $988,074, respectively. As of September 30, 2013 and December 31, 2012, brokerage fees payable were $9,019 and $205, respectively.
The Administrator, Custodian and Transfer Agent
The Bank of New York Mellon (the “Administrator”) has been appointed by the Managing Owner as the administrator, custodian and transfer agent of the Fund, and has entered into separate administrative, custodian, transfer agency and service agreements (collectively referred to as the “Administration Agreement”).
Pursuant to the Administration Agreement, the Administrator performs or supervises the performance of services necessary for the operation and administration of the Fund (other than making investment decisions), including receiving and processing orders from Authorized Participants to create and redeem Baskets, net asset value calculations, accounting and other fund administrative
11
Table of Contents
PowerShares DB Commodity Index Tracking Fund
Notes to Unaudited Financial Statements—(Continued)
September 30, 2013
services. The Administrator retains certain financial books and records, including: Basket creation and redemption books and records, fund accounting records, ledgers with respect to assets, liabilities, capital, income and expenses, the registrar, transfer journals and related details, and trading and related documents received from the Commodity Broker and other unaffiliated futures commission merchants. As of September 30, 2013 and December 31, 2012, there were no Fund assets held by the Administrator.
The Distributor
ALPS Distributors, Inc. (the “Distributor”) provides certain distribution services to the Fund. Pursuant to the Distribution Services Agreement among the Managing Owner in its capacity as managing owner of the Fund and the Distributor, the Distributor assists the Managing Owner and the Administrator with certain functions and duties relating to distribution and marketing services to the Fund including reviewing and approving marketing materials.
Invesco PowerShares Capital Management LLC
Under the License Agreement among Invesco PowerShares Capital Management LLC (the “Licensor”), and the Managing Owner in its own capacity and in its capacity as managing owner of the Fund (the Fund and the Managing Owner, collectively, the “Licensees”), the Licensor granted to each Licensee a non-exclusive license to use the “PowerShares®” trademark (the “Trademark”) anywhere in the world, solely in connection with the marketing and promotion of the Fund and to use or refer to the Trademark in connection with the issuance and trading of the Fund as necessary.
Invesco Distributors, Inc.
Through a marketing agreement between the Managing Owner and Invesco Distributors, Inc. (“Invesco Distributors”), an affiliate of Invesco PowerShares Capital Management LLC, the Managing Owner, on behalf of the Fund, has appointed Invesco Distributors as a marketing agent. Invesco Distributors assists the Managing Owner and the Administrator with certain functions and duties such as providing various educational and marketing activities regarding the Fund, primarily in the secondary trading market, which activities include, but are not limited to, communicating the Fund’s name, characteristics, uses, benefits, and risks, consistent with the prospectus. Invesco Distributors will not open or maintain customer accounts or handle orders for the Fund. Invesco Distributors engages in public seminars, road shows, conferences, media interviews, and distributes sales literature and other communications (including electronic media) regarding the Fund.
(4) Summary of Significant Accounting Policies
(a) Basis of Presentation
The financial statements of the Fund have been prepared using U.S. generally accepted accounting principles.
The presentation of Shareholders’ Equity in prior years has been updated to conform to the September 30, 2013 presentation. Total Shareholders’ Equity was not affected by these changes.
(b) Use of Estimates
The preparation of the financial statements in conformity with U.S. generally accepted accounting principles requires management to make estimates and assumptions that affect the reported amounts of assets and liabilities, revenues and expenses and related disclosure of contingent assets and liabilities during the reporting period of the financial statements and accompanying notes. Actual results could differ from those estimates. There were no significant estimates used in the preparation of these financial statements.
(c) Financial Instruments and Fair Value
United States Treasury Obligations and commodity futures contracts are recorded in the statements of financial condition on trade date at fair value with changes in fair value recognized in earnings in each period. The fair value of a financial instrument is the amount that would be received to sell an asset or paid to transfer a liability in an orderly transaction between market participants at the measurement date (the exit price).
Financial Accounting Standards Board (FASB) Accounting Standards Codification fair value measurement and disclosure guidance requires a fair value hierarchy that prioritizes the inputs to valuation techniques used to measure fair value. The hierarchy gives the highest priority to unadjusted quoted prices in active markets for identical assets and liabilities (Level 1 measurements) and the lowest priority to unobservable inputs (Level 3 measurements). The three levels of the fair value hierarchy are described below:
Basis of Fair Value Measurement
Level 1: Unadjusted quoted prices in active markets that are accessible at the measurement date for identical, unrestricted assets or liabilities;
12
Table of Contents
PowerShares DB Commodity Index Tracking Fund
Notes to Unaudited Financial Statements—(Continued)
September 30, 2013
Level 2: Quoted prices in markets that are not active or financial instruments for which all significant inputs are observable, either directly or indirectly;
Level 3: Prices or valuations that require inputs that are both significant to the fair value measurement and unobservable.
A financial instrument’s level within the fair value hierarchy is based on the lowest level of any input that is significant to the fair value measurement.
In determining fair value of United States Treasury Obligations and commodity futures contracts, the Fund uses unadjusted quoted market prices in active markets. United States Treasury Obligations and commodity futures contracts are classified within Level 1 of the fair value hierarchy. The Fund does not adjust the quoted prices for United States Treasury Obligations and commodity futures contracts.
Assets and Liabilities Measured at Fair Value were as follows:
| September 30, 2013 |
December 31, 2012 |
|||||||
| United States Treasury Obligations (Level 1) |
$ | 7,535,905,234 | $ | 5,925,630,311 | ||||
| Commodity Futures Contracts (Level 1) |
$ | (111,856,464 | ) | $ | 73,453,658 | |||
There were no Level 2 or Level 3 holdings as of September 30, 2013 and December 31, 2012.
(d) Deposits with Commodity Broker
The Fund deposits cash and United States Treasury Obligations with its Commodity Broker subject to CFTC regulations and various exchange and Commodity Broker requirements. The combination of the Fund’s deposits with its Commodity Broker of cash and United States Treasury Obligations and the unrealized profit or loss on open futures contracts (variation margin) represents the Fund’s overall equity in its Commodity Broker trading account. To meet the Fund’s initial margin requirements, the Fund holds United States Treasury Obligations. The Fund uses its cash held by the Commodity Broker to satisfy variation margin requirements. The Fund earns interest on its cash deposited with the Commodity Broker.
(e) United States Treasury Obligations
The Fund records purchases and sales of United States Treasury Obligations on trade date. These holdings are marked to market based on quoted closing prices. The Fund holds United States Treasury Obligations for deposit with the Fund’s Commodity Broker to meet margin requirements and for trading purposes. Interest income is recognized on an accrual basis when earned. Premiums and discounts are amortized or accreted over the life of the United States Treasury Obligations. Included in the United States Treasury Obligations as of September 30, 2013 and December 31, 2012 were holdings of $355,635,088 and $381,122,419, respectively, which were restricted and held as initial margin of the open futures contracts.
(f) Cash Held by Commodity Broker
The Fund’s arrangement with the Commodity Broker requires the Fund to meet its variation margin requirement related to the price movements, both positive and negative, on futures contracts held by the Fund by keeping cash on deposit with the Commodity Broker. The Fund defines cash and cash equivalents held by the Commodity Broker to be highly liquid investments, with original maturities of three months or less, when purchased. As of September 30, 2013 the Fund had $359,550,408 of cash held with the Commodity Broker, of which $111,856,464 was on deposit to satisfy the Fund’s negative variation margin on open futures contracts. As of December 31, 2012 the Fund had cash held by the Commodity Broker of $615,720,406. As of September 30, 2013 and December 31, 2012 there were no cash equivalents held by the Fund.
(g) Receivable/(Payable) for LME Contracts
The Fund trades aluminum, copper and zinc commodity future contracts on the London Metals Exchange (“LME”). For settlement of futures contracts traded on the LME, cash is not transferred until the settled futures contracts expire. As of September 30, 2013, the Fund had a payable to the Commodity Broker for contracts on the LME of $52,889,242 related to net realized losses on LME contracts. As of December 31, 2012, the Fund had a payable to the Commodity Broker for contracts on the LME of $2,599,519 related to net realized losses on LME contracts.
Certain amounts reported in prior years have been reclassified to conform to the September 30, 2013 presentation. Net income and Total Shareholders’ Equity were not affected by these reclassifications.
13
Table of Contents
PowerShares DB Commodity Index Tracking Fund
Notes to Unaudited Financial Statements—(Continued)
September 30, 2013
(h) Income Taxes
The Fund is classified as a partnership for U.S. federal income tax purposes. Accordingly, the Fund will not incur U.S. federal income taxes. No provision for federal, state, and local income taxes has been made in the accompanying financial statements, as investors are individually liable for income taxes, if any, on their allocable share of the Fund’s income, gain, loss, deductions and other items.
The major tax jurisdiction for the Fund and the earliest tax year subject to examination: United States, 2009.
(i) Futures Contracts
All commodity futures contracts are held and used for trading purposes. Commodity futures are recorded on trade date basis and open contracts are recorded in the statement of financial condition at fair value on the last business day of the period, which represents market value for those commodity futures contracts for which market quotes are readily available. However, when market closing prices are not available, the Managing Owner may value an asset of the Fund pursuant to policies the Managing Owner has adopted, which are consistent with normal industry standards. Realized gains (losses) and changes in unrealized appreciation (depreciation) on open positions are determined on a specific identification basis and recognized in the statement of income and expenses in the period in which the contract is closed or the changes occur, respectively. Futures Contracts held as of September 30, 2013 are indicative of the volume of derivative activity during the period.
The Fair Value of Derivative Instruments is as follows:
| Derivatives not Accounted for as Hedging Instruments |
Statements of Financial Condition Location |
Net Unrealized Appreciation / (Depreciation) at September 30, 2013 |
Net Unrealized Appreciation / (Depreciation) at December 31, 2012 |
|||||||
| Commodity Futures Contracts |
Net Unrealized Appreciation (Depreciation) on Futures Contracts |
$ | (111,856,464 | ) | $ | 73,453,658 | ||||
The Effect of Derivative Instruments on the Statements of Income and Expenses is as follows:
| Derivatives not Accounted for as |
Location of Gain or (Loss) on Derivatives Recognized in Income |
For the
Three Months Ended September 30, 2013 |
For the Three Months Ended September 30, 2012 |
|||||||||||||||
| Realized Gain or (Loss) on Derivatives Recognized in Income |
Change in Unrealized Gain or (Loss) on Derivatives Recognized in Income |
Realized Gain or (Loss) on Derivatives Recognized in Income |
Change in Unrealized Gain or (Loss) on Derivatives Recognized in Income |
|||||||||||||||
| Commodity Futures Contracts |
Net Realized Gain (Loss) on Futures |
$ | (193,572,331 | ) | — | $ | (189,683,137 | ) | — | |||||||||
| Net Change in Unrealized Gain (Loss) on Futures |
— | $ | 370,155,771 | — | $ | 857,601,282 | ||||||||||||
| Derivatives not Accounted for as |
Location of Gain or (Loss) on Derivatives Recognized in Income |
For the
Nine Months Ended September 30, 2013 |
For the Nine Months Ended September 30, 2012 |
|||||||||||||||
| Realized Gain or (Loss) on Derivatives Recognized in Income |
Change in Unrealized Gain or (Loss) on Derivatives Recognized in Income |
Realized Gain or (Loss) on Derivatives Recognized in Income |
Change in Unrealized Gain or (Loss) on Derivatives Recognized in Income |
|||||||||||||||
| Commodity Futures Contracts |
Net Realized Gain (Loss) on Futures |
$ | (260,318,838 | ) | — | $ | (448,136,094 | ) | — | |||||||||
| Net Change in Unrealized Gain (Loss) on Futures |
— | $ | (185,310,122 | ) | — | $ | 867,583,000 | |||||||||||
(j) Brokerage Commissions and Fees
The Fund incurs all brokerage commissions, including applicable exchange fees, National Futures Association (“NFA”) fees, give-up fees, pit brokerage fees and other transaction related fees and expenses charged in connection with trading activities by the Commodity Broker. These costs are recorded as brokerage commissions and fees in the statement of income and expenses as incurred. The Commodity Broker’s brokerage commissions and trading fees are determined on a contract-by-contract basis. On average, total charges paid to the Commodity Broker were less than $10.00 per round-turn trade for the Three Months Ended September 30, 2013 and 2012 and the Nine Months Ended September 30, 2013 and 2012.
14
Table of Contents
PowerShares DB Commodity Index Tracking Fund
Notes to Unaudited Financial Statements—(Continued)
September 30, 2013
(k) Routine Operational, Administrative and Other Ordinary Expenses
The Managing Owner assumes all routine operational, administrative and other ordinary expenses of the Fund, including, but not limited to, computer services, the fees and expenses of the Trustee, legal and accounting fees and expenses, tax preparation expenses, filing fees and printing, mailing and duplication costs. Accordingly, all such expenses are not reflected in the statement of income and expenses of the Fund.
(l) Organizational and Offering Costs
All organizational and offering expenses of the Fund are incurred and assumed by the Managing Owner. The Fund is not responsible to the Managing Owner for the reimbursement of organizational and offering costs. Expenses incurred in connection with the continuous offering of Shares are also paid by the Managing Owner.
(m) Non-Recurring and Unusual Fees and Expenses
The Fund pays all fees and expenses which are non-recurring and unusual in nature. Such expenses include legal claims and liabilities, litigation costs or indemnification or other unanticipated expenses. Such fees and expenses, by their nature, are unpredictable in terms of timing and amount. For the Three Months Ended September 30, 2013 and 2012 and the Nine Months Ended September 30, 2013 and 2012, the Fund did not incur such expenses.
(5) Financial Instrument Risk
In the normal course of its business, the Fund is a party to financial instruments with off-balance sheet risk. The term “off-balance sheet risk” refers to an unrecorded potential liability that, even though it does not appear on the balance sheet, may result in a future obligation or loss in excess of the amounts shown in the statement of financial condition. The financial instruments used by the Fund are exchange-listed commodity futures, whose values are based upon an underlying asset and generally represent future commitments that have a reasonable possibility of being settled in cash or through physical delivery. The financial instruments are traded on an exchange and are standardized contracts.
Market risk is the potential for changes in the value of the financial instruments traded by the Fund due to market changes, including fluctuations in commodity prices. In entering into these futures contracts, there exists a market risk that such futures contracts may be significantly influenced by adverse market conditions, resulting in such futures contracts being less valuable. If the markets should move against all of the futures contracts at the same time, the Fund could experience substantial losses.
Credit risk is the possibility that a loss may occur due to the failure of the Commodity Broker and/or clearinghouse to perform according to the terms of a futures contract. Credit risk with respect to exchange-traded instruments is reduced to the extent that an exchange or clearing organization acts as a counterparty to the transactions. The Commodity Broker, when acting as the Fund’s futures commission merchant in accepting orders for the purchase or sale of domestic futures contracts, is required by CFTC regulations to separately account for and segregate as belonging to the Fund all assets of the Fund relating to domestic futures trading and the Commodity Broker is not allowed to commingle such assets with other assets of the Commodity Broker. In addition, CFTC regulations also require the Commodity Broker to hold in a secure account assets of the Fund related to foreign futures trading. The Fund’s risk of loss in the event of counterparty default is typically limited to the amounts recognized in the statement of financial condition and not represented by the futures contract or notional amounts of the instruments.
The Fund has not utilized, nor does it expect to utilize in the future, special purpose entities to facilitate off-balance sheet financing arrangements and has no loan guarantee arrangements or off-balance sheet arrangements of any kind, other than agreements entered into in the normal course of business noted above.
(6) Share Purchases and Redemptions
(a) Purchases
Shares may be purchased directly from the Fund only by Authorized Participants in one or more blocks of 200,000 Shares, called a Basket. Upon submission of a creation order, the Authorized Participant may request that the Managing Owner agree to a creation order settlement date of up to 3 business days after the creation order date. Accordingly, the Fund issues Shares in Baskets to Authorized Participants within 3 business days immediately following the date on which a valid order to create a Basket is accepted by the Fund, at the net asset value of 200,000 Shares, which is determined as promptly as practicable following the publication of the Fund’s net asset value on the date that a valid order to create a Basket is accepted by the Fund.
(b) Redemptions
The redemption procedures allow only Authorized Participants to redeem Baskets. On any business day, an Authorized Participant may place an order with the Managing Owner to redeem one or more Baskets. Redemption orders must be placed by 10:00 a.m., Eastern Time. The day on which the Managing Owner receives a valid redemption order is the redemption order date. Redemption orders are irrevocable.
15
Table of Contents
PowerShares DB Commodity Index Tracking Fund
Notes to Unaudited Financial Statements—(Continued)
September 30, 2013
Redemption orders may be placed either (i) through the Continuous Net Settlement (“CNS”) clearing processes of the National Securities Clearing Corporation (the “NSCC”) or (ii) if outside the CNS Clearing Process, only through the facilities of The Depository Trust Company (“DTC” or the “Depository”) (the “DTC Process”), or a successor depository, and only in exchange for cash. By placing a redemption order, and prior to receipt of the redemption proceeds, an Authorized Participant’s DTC account is charged the non-refundable transaction fee due for the redemption order and such fee is not borne by the Fund.
The redemption proceeds from the Fund consist of the cash redemption amount. Upon submission of a redemption order, the Authorized Participant may request the Managing Owner to agree to a redemption order settlement date up to 3 business days after the redemption order date. The cash redemption amount is equal to the net asset value of the number of Basket(s) requested in the Authorized Participant’s redemption order on the redemption order date (the “Settlement Time”). As agreed to between the Authorized Participant and the Managing Owner, the Fund will distribute the cash redemption amount within 3 business days immediately following the redemption order date. The redemption proceeds from the Fund will be credited to the Authorized Participant at the Settlement Time through the CNS system, assuming timely delivery of redemption Baskets and the transaction fee through the CNS system in accordance with the terms, conditions and guarantees as set forth in the CNS agreements to which the Custodian and the Authorized Participant have entered into. Through the DTC process, the redemption proceeds from the Fund will be delivered through the DTC to the account of the Authorized Participant as recorded on the book entry system of the DTC at the Settlement Time. If the Fund’s account has not been credited with all of the Baskets to be redeemed by such time, the redemption proceeds are delivered to the extent of whole Baskets received and any outstanding amount of the redemption order will be canceled.
(c) Share Transactions
Summary of Share Transactions for the Three Months Ended September 30, 2013 and 2012
and the Nine Months Ended September 30, 2013 and 2012 (unaudited)
| Shares Three Months Ended |
Shareholders’ Equity Three Months Ended |
Shares Nine Months Ended |
Shareholders’ Equity Nine Months Ended |
|||||||||||||||||||||||||||||
| September 30, 2013 |
September 30, 2012 |
September 30, 2013 |
September 30, 2012 |
September 30, 2013 |
September 30, 2012 |
September 30, 2013 |
September 30, 2012 |
|||||||||||||||||||||||||
| Shares Sold |
17,400,000 | 22,400,000 | $ | 459,299,144 | $ | 623,655,448 | 41,800,000 | 53,200,000 | $ | 1,251,179,534 | $ | 1,486,852,502 | ||||||||||||||||||||
| Shares Redeemed |
(8,800,000 | ) | (4,200,000 | ) | (230,375,262 | ) | (116,365,794 | ) | (30,000,000 | ) | (23,600,000 | ) | (787,999,236 | ) | (629,379,502 | ) | ||||||||||||||||
|
|
|
|
|
|
|
|
|
|
|
|
|
|
|
|
|
|||||||||||||||||
| Net Increase/(Decrease) |
8,600,000 | 18,200,000 | $ | 228,923,882 | $ | 507,289,654 | 11,800,000 | 29,600,000 | $ | 463,180,298 | $ | 857,473,000 | ||||||||||||||||||||
|
|
|
|
|
|
|
|
|
|
|
|
|
|
|
|
|
|||||||||||||||||
(7) Profit and Loss Allocations and Distributions
Pursuant to the Trust Agreement, income and expenses are allocated pro rata to the Managing Owner as holder of the General Shares and to the Shareholders monthly based on their respective percentage interests as of the close of the last trading day of the preceding month. Any losses allocated to the Managing Owner (as the owner of the General Shares) which are in excess of the Managing Owner’s capital balance are allocated to the Shareholders in accordance with their respective interest in the Fund as a percentage of total shareholders’ equity. Distributions (other than redemption of units) may be made at the sole discretion of the Managing Owner on a pro rata basis in accordance with the respective capital balances of the shareholders.
No distributions were paid for the Nine Months Ended September 30, 2013 or 2012.
(8) Commitments and Contingencies
The Managing Owner, either in its own capacity or in its capacity as the Managing Owner and on behalf of the Fund, has entered into various service agreements that contain a variety of representations, or provide indemnification provisions related to certain risks service providers undertake in performing services which are in the best interests of the Fund. As of September 30, 2013, no claims had been received by the Fund and it was therefore not possible to estimate the Fund’s potential future exposure under such indemnification provisions.
(9) Net Asset Value and Financial Highlights
The Fund is presenting the following net asset value and financial highlights related to investment performance for a Share outstanding for the Three Months Ended September 30, 2013 and 2012 and for the Nine Months Ended September 30, 2013 and 2012. The net investment income and total expense ratios are calculated using average net asset value during the respective period. The net asset value presentation is calculated using daily Shares outstanding. The net investment income and total expense ratios have been annualized. The total return is based on the change in net asset value of the Shares during the period. An individual investor’s return and ratios may vary based on the timing of capital transactions.
Net asset value per Share is the net asset value of the Fund divided by the number of outstanding Shares at the date of each respective period presented.
16
Table of Contents
PowerShares DB Commodity Index Tracking Fund
Notes to Unaudited Financial Statements—(Continued)
September 30, 2013
| Three Months Ended | Nine Months Ended | |||||||||||||||
| September 30, 2013 |
September 30, 2012 |
September 30, 2013 |
September 30, 2012 |
|||||||||||||
| Net Asset Value |
||||||||||||||||
| Net asset value per Share, beginning of period |
$ | 25.11 | $ | 25.76 | $ | 27.72 | $ | 26.83 | ||||||||
|
|
|
|
|
|
|
|
|
|||||||||
| Net realized and change in unrealized gain (loss) on United States Treasury Obligations, Futures |
0.75 | 3.04 | (1.75 | ) | 2.08 | |||||||||||
| Net investment income (loss) |
(0.05 | ) | (0.06 | ) | (0.16 | ) | (0.17 | ) | ||||||||
|
|
|
|
|
|
|
|
|
|||||||||
| Net income (loss) |
0.70 | 2.98 | (1.91 | ) | 1.91 | |||||||||||
| Net asset value per Share, end of period |
$ | 25.81 | $ | 28.74 | $ | 25.81 | $ | 28.74 | ||||||||
|
|
|
|
|
|
|
|
|
|||||||||
| Market value per Share, beginning of period |
$ | 25.13 | $ | 25.75 | $ | 27.78 | $ | 26.84 | ||||||||
|
|
|
|
|
|
|
|
|
|||||||||
| Market value per Share, end of period |
$ | 25.76 | $ | 28.68 | $ | 25.76 | $ | 28.68 | ||||||||
|
|
|
|
|
|
|
|
|
|||||||||
| Ratio to average Net Assets* |
||||||||||||||||
| Net investment income (loss) |
(0.83 | )% | (0.79 | )% | (0.81 | )% | (0.81 | )% | ||||||||
|
|
|
|
|
|
|
|
|
|||||||||
| Total expenses |
0.87 | % | 0.87 | % | 0.87 | % | 0.87 | % | ||||||||
|
|
|
|
|
|
|
|
|
|||||||||
| Total Return, at net asset value ** |
2.79 | % | 11.57 | % | (6.89 | )% | 7.12 | % | ||||||||
|
|
|
|
|
|
|
|
|
|||||||||
| Total Return, at market value ** |
2.51 | % | 11.38 | % | (7.27 | )% | 6.86 | % | ||||||||
|
|
|
|
|
|
|
|
|
|||||||||
| * | Percentages are annualized. |
| ** | Percentages are not annualized. |
(10) Subsequent Events
The Fund evaluated the need for disclosures and/or adjustments resulting from subsequent events through the date the financial statements were issued. This evaluation did not result in any subsequent events that necessitated disclosures and/or adjustments.
17
Table of Contents
| ITEM 2. | MANAGEMENT’S DISCUSSION AND ANALYSIS OF FINANCIAL CONDITION AND RESULTS OF OPERATIONS. |
This information should be read in conjunction with the financial statements and notes included in Item 1 of Part I of this Quarterly Report (the “Report”). The discussion and analysis which follows may contain trend analysis and other forward-looking statements within the meaning of Section 21E of the Securities Exchange Act of 1934, as amended (the “Exchange Act”) which reflect our current views with respect to future events and financial results. Words such as “anticipate”, “expect”, “intend,” “plan,” “believe,” “seek,” “outlook” and “estimate”, as well as similar words and phrases, signify forward-looking statements. PowerShares DB Commodity Index Tracking Fund’s (the “Fund”) forward-looking statements are not guarantees of future results and conditions and important factors, risks and uncertainties may cause our actual results to differ materially from those expressed in our forward-looking statements.
You should not place undue reliance on any forward-looking statements. Except as expressly required by the Federal securities laws, DB Commodity Services LLC (the “Managing Owner”), undertakes no obligation to publicly update or revise any forward-looking statements or the risks, uncertainties or other factors described in this Report, as a result of new information, future events or changed circumstances or for any other reason after the date of this Report.
Overview/Introduction
The Fund seeks to track changes, whether positive or negative, in the level of the DBIQ Optimum Yield Diversified Commodity Index Excess Return™ (the “Index”) over time, plus the excess, if any, of the Fund’s interest income from its holdings of United States Treasury Obligations and other high credit quality short-term fixed income securities over the expenses of the Fund. The Index is intended to reflect the change in market value of certain commodities. The commodities comprising the Index are Light Sweet Crude Oil, Heating Oil, Aluminum, Gold, Corn, Wheat, Brent Crude, Copper Grade A, Natural Gas, RBOB Gasoline, Silver, Soybeans, Sugar and Zinc (the “Index Commodities”).
The Fund pursues its investment objective by investing in a portfolio of exchange-traded futures contracts in the Index Commodities. The notional amounts of each Index Commodity included in the Index are broadly in proportion to historic levels of the world’s production and stocks of the Index Commodities. The Fund also holds United States Treasury Obligations and other high credit quality short-term fixed income securities for deposit with the Fund’s Commodity Broker as margin.
As of the date of this Report, each of Deutsche Bank Securities Inc., Merrill Lynch Professional Clearing Corp., BNP Paribas Securities Corp, Cantor Fitzgerald & Co., Citigroup Global Markets Inc., Credit Suisse Securities USA LLC, Goldman Sachs Execution & Clearing, L.P., Goldman, Sachs & Co., J.P. Morgan Securities Inc., Knight Clearing Services LLC, Morgan Stanley & Co. Incorporated, Newedge USA LLC, Nomura Securities International, RBC Capital Markets, LLC, Jefferies LLC (f/k/a Jefferies & Company, Inc.), Timber Hill LLC, UBS Securities LLC and Virtu Financial BD LLC has executed a Participant Agreement.
The Commodity Futures Trading Commission (the “CFTC”) and/or commodity exchanges, as applicable, impose position limits on market participants trading in certain commodities included in the Index. If the Managing Owner determines in its commercially reasonable judgment that it has become impracticable or inefficient for any reason for the Fund to gain full or partial exposure to any Index Commodity by investing in a specific futures contract that is a part of the Index, the Fund may invest in a futures contract referencing the particular Index Commodity other than the specific contract that is a part of the Index or, in the alternative, invest in other futures contracts not based on the particular Index Commodity if, in the commercially reasonable judgment of the Managing Owner, such futures contracts tend to exhibit trading prices that correlate with a futures contract that is a part of the Index. Please see http://www.dbxus.com with respect to the most recently available weighted composition of the Fund and the composition of the Fund’s Index on the Base Date.
DBIQ™ is a trademark of Deutsche Bank AG London (the “Index Sponsor”). Trademark applications in the United States are pending with respect to both the Fund and aspects of the Index. The Fund and the Managing Owner have been licensed by the Index Sponsor to use the above noted trademark. Deutsche Bank AG London is an affiliate of the Fund and the Managing Owner.
The closing level of the Index is calculated on each business day by the Index Sponsor based on the closing price of the futures contracts for each of the Index Commodities and the notional amount of such Index Commodity.
18
Table of Contents
The Index is rebalanced annually in November to ensure that each of the Index Commodities is weighted in the same proportion that such Index Commodities were weighted on September 3, 1997 (the “Base Date”). The Index has been calculated back to the Base Date. On the Base Date, the closing level was 100. The following table reflects the index base weights of each Index Commodity on the Base Date (the “Index Base Weights”):
| Index Commodity |
Index Base Weight (%) | |||
| Light Sweet Crude Oil |
12.375 | |||
| Heating Oil |
12.375 | |||
| RBOB Gasoline |
12.375 | |||
| Natural Gas |
5.500 | |||
| Brent Crude |
12.375 | |||
| Gold |
8.000 | |||
| Silver |
2.000 | |||
| Aluminum |
4.166 | |||
| Zinc |
4.167 | |||
| Copper Grade A |
4.167 | |||
| Corn |
5.625 | |||
| Wheat |
5.625 | |||
| Soybeans |
5.625 | |||
| Sugar |
5.625 | |||
|
|
|
|||
| Closing Level on Base Date: |
100.000 | |||
|
|
|
|||
The following table reflects the Fund weights of each Index Commodity as of September 30, 2013:
| Index Commodity |
Fund Weight (%) | |||
| Light Sweet Crude Oil |
14.63 | |||
| Heating Oil |
13.09 | |||
| RBOB Gasoline |
13.84 | |||
| Natural Gas |
5.28 | |||
| Brent Crude |
13.70 | |||
| Gold |
6.43 | |||
| Silver |
1.41 | |||
| Aluminum |
3.97 | |||
| Zinc |
4.17 | |||
| Copper Grade A |
4.16 | |||
| Corn |
4.11 | |||
| Wheat |
4.16 | |||
| Soybeans |
5.68 | |||
| Sugar |
5.37 | |||
|
|
|
|||
| Closing Level as of September 30, 2013 |
100.00 | |||
|
|
|
|||
The Index Commodities are traded on the following futures exchanges: Light Sweet Crude Oil (WTI), Heating Oil, RBOB Gasoline and Natural Gas: New York Mercantile Exchange; Brent Crude: ICE Futures Europe; Gold and Silver: Commodity Exchange Inc., New York; Aluminum, Zinc and Copper Grade A: The London Metal Exchange Limited; Corn, Wheat and Soybeans: Board of Trade of the City of Chicago Inc.; and Sugar: ICE Futures U.S., Inc.
The composition of the Index may be adjusted in the event that the Index Sponsor is not able to calculate the closing prices of the Index Commodities.
The Index includes provisions for the replacement of futures contracts as they approach maturity. This replacement takes place over a period of time in order to lessen the impact on the market for the futures contracts being replaced. With respect to each Index Commodity, the Fund employs a rule-based approach when it “rolls” from one futures contract to another. Rather than select a new futures contract based on a predetermined schedule (e.g., monthly), each Index Commodity rolls to the futures contract which generates the best possible “implied roll yield.” The futures contract with a delivery month within the next thirteen months which generates the best possible implied roll yield will be included in the Index. As a result, each Index Commodity is able to potentially maximize the roll benefits in backwardated markets and minimize the losses from rolling in contangoed markets.
In general, as a futures contract approaches its expiration date, its price will move towards the spot price in a contangoed market. Assuming the spot price does not change, this would result in the futures contract price decreasing and a negative implied roll yield. The opposite is true in a backwardated market. Rolling in a contangoed market will tend to cause a drag on an Index Commodity’s contribution to the Fund’s return while rolling in a backwardated market will tend to cause a push on an Index Commodity’s contribution to the Fund’s return.
The DBIQ Optimum Yield Diversified Commodity Index Total Return™ and the Index are calculated in USD on both an excess return (unfunded) and total return (funded) basis.
19
Table of Contents
The futures contract price for each Index Commodity will be the exchange closing price for such Index Commodity on each weekday when banks in New York, New York are open (the “Index Business Days”). If a weekday is not an Exchange Business Day (as defined in the following sentence) but is an Index Business Day, the exchange closing price from the previous Index Business Day will be used for each Index Commodity. “Exchange Business Day” means, in respect of an Index Commodity, a day that is a trading day for such Index Commodity on the relevant exchange (unless either an Index disruption event or force majeure event has occurred).
On the first New York business day (the “Verification Date”) of each month, each Index Commodity futures contract will be tested in order to determine whether to continue including it in the Index. If the Index Commodity futures contract requires delivery of the underlying commodity in the next month, known as the Delivery Month, a new Index Commodity futures contract will be selected for inclusion in the Index. For example, if the first New York business day is October 1, 2013, and the Delivery Month of the Index Commodity futures contract currently in the Index is November 2013, a new Index Commodity futures contract with a later Delivery Month will be selected.
For each underlying Index Commodity in the Index, the new Index Commodity futures contract selected will be the Index Commodity futures contract with the best possible “implied roll yield” based on the closing price for each eligible Index Commodity futures contract. Eligible Index Commodity futures contracts are any Index Commodity futures contracts having a Delivery Month (i) no sooner than the month after the Delivery Month of the Index Commodity futures contract currently in the Index, and (ii) no later than the 13th month after the Verification Date. For example, if the first New York business day is October 1, 2013 and the Delivery Month of an Index Commodity futures contract currently in the Index is November 2013, the Delivery Month of an eligible new Index Commodity futures contract must be between December 2013 and October 2014. The implied roll yield is then calculated and the futures contract on the Index Commodity with the best possible implied roll yield is then selected. If two futures contracts have the same implied roll yield, the futures contract with the minimum number of months prior to the Delivery Month is selected.
After the futures contract selection, the monthly roll for each Index Commodity subject to a roll in that particular month unwinds the old futures contract and enters a position in the new futures contract. This takes place between the 2nd and 6th Index Business Day of the month.
On each day during the roll period, new notional holdings are calculated. The calculations for the old Index Commodities that are leaving the Index and the new Index Commodities are then calculated.
On all days that are not monthly index roll days, the notional holdings of each Index Commodity future remains constant.
The Index is re-weighted on an annual basis on the 6th Index Business Day of each November.
The calculation of the Index is expressed as the weighted average return of the Index Commodities.
Under the Fourth Amended and Restated Declaration of Trust and Trust Agreement of the Fund (the “Trust Agreement”), Wilmington Trust Company, the Trustee of the Fund, has delegated to the Managing Owner the exclusive management and control of all aspects of the business of the Fund. The Trustee will have no duty or liability to supervise or monitor the performance of the Managing Owner, nor will the Trustee have any liability for the acts or omissions of the Managing Owner.
The Index Sponsor obtains information for inclusion in, or for use in the calculation of, the Index from sources the Index Sponsor considers reliable. None of the Index Sponsor, the Managing Owner, the Fund or any of their respective affiliates accepts responsibility for or guarantees the accuracy and/or completeness of the Index or any data included in the Index.
The Shares are intended to provide investment results that generally correspond to the changes, positive or negative, in the levels of the Index over time. The value of the Shares is expected to fluctuate in relation to changes in the value of the Fund’s portfolio. The market price of the Shares may not be identical to the net asset value per Share, but these two valuations are expected to be very close.
Margin Calls
Like other futures and derivatives traders, the Fund will be subject to margin calls from time-to-time. The term “margin” has a different meaning in the context of futures contracts and other derivatives than it does in the context of securities. In particular, “margin” on a futures position does not constitute a borrowing of money or the collateralization of a loan. The Fund does not borrow money.
To establish a position in an exchange-traded futures contract, the Fund makes a deposit of “initial margin.” The amount of initial margin required to be deposited in order to establish a position in an exchange-traded futures contract varies from instrument to instrument depending, generally, on the historical volatility of the futures contract in question. Determination of the amount of the required initial margin deposit in respect of a particular contract is made by the exchange on which the contract is listed. To establish a long position in an over-the-counter instrument, the counterparty may require an analogous deposit of collateral, depending upon the
20
Table of Contents
anticipated volatility of the instrument and the creditworthiness of the person seeking to establish the position. The deposit of initial margin provides assurance to futures commission merchants and clearing brokers involved in the settlement process that sufficient resources are likely to be on deposit to enable a client’s position to be closed by recourse to the initial margin deposit should the client fail to meet a demand for variation margin, even if changes in the value of the contract in question, which are marked to market from day to day, continue to reflect the contract’s historical volatility. Collateral deposited in support of an over-the-counter instrument serves a similar purpose.
Once a position has been established on a futures exchange, “variation margin” generally is credited or assessed at least daily to reflect changes in the value of the position. In contrast to “initial margin,” “variation margin” represents a system of marking to market the futures contract’s value. Thus, traders in exchange-traded futures contracts are assessed daily in an amount equal to that day’s accumulated losses in respect of any open position (or are credited daily with accumulated gains in respect of such position). Collateral may move between the parties to an over-the-counter instrument in a similar manner as gains or losses accumulate in the instrument. As with initial margin, variation margin serves to secure the obligations of the investor under the contract and to protect those involved in the settlement process against the possibility that a client will have insufficient resources to meet its contractual obligations. Collateral deposited in support of an over-the-counter instrument serves a similar purpose. Like initial margin (or an equivalent deposit of collateral), variation margin (or an equivalent deposit of collateral) does not constitute a borrowing of money, is not considered to be part of the contract purchase price and is returned upon the contract’s termination unless it is used to cover a loss in the contract position. United States Treasury Obligations are used routinely to collateralize OTC derivative positions, and are deposited routinely as margin to collateralize futures positions. The Fund may liquidate United States Treasury Obligations to meet an initial or variation margin requirement.
Position Limits and/or Accountability Levels
The Fund has been subject to accountability levels with respect to both light sweet crude oil (WTI) and RBOB Gasoline, each of which are index futures contracts that are listed on the NYMEX. As a result of reaching the accountability levels with respect to light sweet crude oil (WTI), the Fund invested in the ICE West Texas Intermediate Light Sweet Crude Oil futures contracts with comparable expirations during the period from January 2, 2013 to June 3, 2013. As a result of reaching the accountability levels with respect to RBOB Gasoline, the Fund invested in the next sequential expiring RBOB Gasoline futures contracts also listed on the NYMEX during the period from January 2, 2013 and continued to maintain its positions in such contracts as of September 30, 2013.
During the period from December 12, 2012 to June 10, 2013, the Managing Owner was ordered by the Market Regulation Department of the NYMEX to no longer increase, on either an intraday or end of day basis, the Fund’s net positions in RBOB Gasoline futures contracts. Such order was retracted effective June 10, 2013.
During the period from November 30, 2012 to January 25, 2013, the Managing Owner was ordered by the Market Regulation Department of the NYMEX to no longer increase, on either an intraday or end of day basis, the Fund’s net positions in light sweet crude oil (WTI) futures contracts. Such order was retracted effective January 25, 2013.
Performance Summary
This Report covers the three months ended September 30, 2013 and 2012 (hereinafter referred to as the “Three Months Ended September 30, 2013” and the “Three Months Ended September 30, 2012”, respectively) and the nine months ended September 30, 2013 and 2012 (hereinafter referred to as the “Nine Months Ended September 30, 2013” and the “Nine Months Ended September 30, 2012”, respectively). The Fund commenced trading on the American Stock Exchange (now known as the NYSE Alternext US LLC (the “NYSE Alternext”)) on February 3, 2006, and, as of November 25, 2008, is listed on the NYSE Arca, Inc. (the “NYSE Arca”).
Performance of the Fund and the exchange traded Shares are detailed below in “Results of Operations”. Past performance of the Fund and the exchange traded Shares are not necessarily indicative of future performance.
The Index is intended to reflect the change in market value of the Index Commodities. In turn, the notional amounts of each Index Commodity are broadly in proportion to historic levels of the world’s production and stocks of such Index Commodities. The DBIQ Optimum Yield Diversified Commodity Index Total Return™ (“DBIQ-OY Diversified TR™”) consists of the Index plus 3-month United States Treasury Obligations returns. Past Index results are not necessarily indicative of future changes, positive or negative, in the Index closing levels.
The section “Summary of DBIQ-OY Diversified TR™ and Underlying Index Commodity Returns for the Three Months Ended September 30, 2013 and the Nine Months Ended September 30, 2013 and the Three Months Ended September 30, 2012 and the Nine Months Ended September 30, 2012” below provides an overview of the changes in the closing levels of DBIQ-OY Diversified TR™ by disclosing the change in market value of each underlying component Index Commodity through a “surrogate” (and analogous) index plus 3-month United States Treasury Obligations returns. Please note also that the Fund’s objective is to track the Index (not the DBIQ-OY Diversified TR™), and the Fund does not attempt to outperform or underperform the Index. The Index employs the optimum yield roll method with the objective of mitigating the negative effects of contango, the condition in which distant delivery prices for futures exceed spot prices, and maximizing the positive effects of backwardation, a condition opposite of contango.
21
Table of Contents
Summary of DBIQ-OY Diversified TR™ and Underlying Index Commodity
Returns for the Three Months Ended September 30, 2013
and the Nine Months Ended September 30, 2013
and for the Three Months Ended September 30, 2012
and the Nine Months Ended September 30, 2012
| AGGREGATE RETURNS FOR INDICES IN THE DBIQ-OY DIVERSIFIED TR™ |
||||||||||||||||
| Underlying Index |
Three Months Ended September 30, 2013 |
Three Months Ended September 30, 2012 |
Nine Months Ended September 30, 2013 |
Nine Months Ended September 30, 2012 |
||||||||||||
| DB Light Crude Oil Indices |
5.43 | % | 15.13 | % | (0.04 | )% | 8.93 | % | ||||||||
| DB Heating Oil Indices |
2.91 | % | 12.51 | % | (1.58 | )% | 6.41 | % | ||||||||
| DB Aluminum Indices |
1.32 | % | 8.49 | % | (15.20 | )% | 0.03 | % | ||||||||
| DB Gold Indices |
8.18 | % | 10.30 | % | (21.27 | )% | 12.41 | % | ||||||||
| DB Corn Indices |
(13.59 | )% | 19.17 | % | (26.36 | )% | 29.08 | % | ||||||||
| DB Wheat Indices |
(3.00 | )% | 8.71 | % | (20.80 | )% | 11.01 | % | ||||||||
| DB RBOB Gasoline Indices |
2.73 | % | 18.63 | % | 2.39 | % | 12.59 | % | ||||||||
| DB Natural Gas Indices |
(0.95 | )% | 7.68 | % | (2.50 | )% | (6.71 | )% | ||||||||
| DB Silver Indices |
11.22 | % | 24.90 | % | (28.60 | )% | 23.29 | % | ||||||||
| DB Zinc Indices |
2.10 | % | 10.55 | % | (10.51 | )% | 11.10 | % | ||||||||
| DB Copper Grade A Indices |
7.97 | % | 6.89 | % | (8.57 | )% | 7.60 | % | ||||||||
| DB Soybeans Indices |
2.46 | % | 12.16 | % | (1.50 | )% | 33.03 | % | ||||||||
| DB Sugar Indices |
3.99 | % | (3.37 | )% | (12.61 | )% | (14.97 | )% | ||||||||
| DB Brent Crude Indices |
5.95 | % | 6.03 | % | 6.20 | % | (7.78 | )% | ||||||||
|
|
|
|
|
|
|
|
|
|||||||||
| AGGREGATE RETURNS |
2.94 | % | 11.51 | % | (6.09 | )% | 7.59 | % | ||||||||
|
|
|
|
|
|
|
|
|
|||||||||
If the Fund’s interest income from its holdings of fixed income securities were to exceed the Fund’s fees and expenses, the aggregate return on an investment in the Fund is expected to outperform the DBIQ-OY Diversified ER™ and underperform the DBIQ-OY Diversified TR™. The only difference between (i) the Index (the “Excess Return Index”) and (ii) the DBIQ-OY Diversified TR™ (the “Total Return Index”) is that the Excess Return Index does not include interest income from a hypothetical basket of fixed income securities while the Total Return Index does include such a component. Thus, the difference between the Excess Return Index and the Total Return Index is attributable entirely to the hypothetical interest income from this hypothetical basket of fixed income securities. If the Fund’s interest income from its holdings of fixed-income securities exceeds the Fund’s fees and expenses, then the amount of such excess is expected to be distributed periodically. The market price of the Shares is expected to closely track the Index. The aggregate return on an investment in the Fund over any period is the sum of the capital appreciation or depreciation of the Shares over the period plus the amount of any distributions during the period. Consequently, the Fund’s aggregate return is expected to outperform the Excess Return Index by the amount of the excess, if any, of its interest income over its fees and expenses but, as a result of the Fund’s fees and expenses, the aggregate return on the Fund is expected to underperform the Total Return Index. If the Fund’s fees and expenses were to exceed the Fund’s interest income from its holdings of fixed income securities, the aggregate return on an investment in the Fund is expected to underperform the Excess Return Index.
Net Asset Value
Net asset value means the total assets of the Fund, including, but not limited to, all futures, cash and investments less total liabilities of the Fund, each determined on the basis of U.S. generally accepted accounting principles, consistently applied under the accrual method of accounting. In particular, net asset value includes any unrealized appreciation or depreciation on open commodity futures contracts, and any other credit or debit accruing to the Fund but unpaid or not received by the Fund. All open commodity futures contracts will be calculated at their then current market value, which will be based upon the settlement price for that particular commodity futures contract traded on the applicable exchange on the date with respect to which net asset value is being determined; provided, that if a commodity futures contract could not be liquidated on such day, due to the operation of daily limits or other rules of the exchange upon which that position is traded or otherwise, the Managing Owner may value such futures contract pursuant to policies the Managing Owner has adopted, which are consistent with normal industry standards. The Managing Owner may in its discretion (and under circumstances, including, but not limited to, periods during which a settlement price of a futures contract is not available due to exchange limit orders or force majeure type events such as systems failure, natural or man-made disaster, act of God, armed conflict, act of terrorism, riot or labor disruption or any similar intervening circumstance) value any asset of the Fund pursuant to such other principles as the Managing Owner deems fair and equitable so long as such principles are consistent with normal industry standards. Interest earned on the Fund’s brokerage account is accrued monthly. The amount of any distribution is a liability of the Fund from the day when the distribution is declared until it is paid.
22
Table of Contents
Critical Accounting Policies
The Fund’s critical accounting policies are as follows:
Preparation of the financial statements and related disclosures in conformity with U.S. generally accepted accounting principles requires the application of appropriate accounting rules and guidance, as well as the use of estimates, and requires management to make estimates and assumptions that affect the reported amounts of assets and liabilities, revenue and expense and related disclosure of contingent assets and liabilities during the reporting period of the financial statements and accompanying notes. The Fund’s application of these policies involves judgments and actual results may differ from the estimates used.
The Fund holds a significant portion of its assets in futures contracts and United States Treasury Obligations, both of which are recorded on trade date at fair value in the financial statements, with changes in fair value reported in the statement of income and expenses.
The use of fair value to measure financial instruments, with related unrealized gains or losses recognized in earnings in each period, is fundamental to the Fund’s financial statements. The fair value of a financial instrument is the amount that would be received to sell an asset or paid to transfer a liability in an orderly transaction between market participants at the measurement date (the exit price).
In determining fair value of United States Treasury Obligations and commodity futures contracts, the Fund uses unadjusted quoted market prices in active markets. Financial Accounting Standards Board (FASB) Accounting Standards Codification for fair value measurement and disclosure guidance requires a fair value hierarchy that prioritizes the inputs to valuation techniques used to measure fair value. The objective of a fair value measurement is to determine the price that would be received to sell an asset or paid to transfer a liability in an orderly transaction between market participants at the measurement date (an exit price). The hierarchy gives the highest priority to unadjusted quoted prices for identical assets or liabilities (Level 1 measurements) and the lowest priority to unobservable inputs (Level 3 measurements). Assets and liabilities are classified in their entirety based on the lowest level of input that is significant to the fair value measurement. See Note 4(c) within the financial statements in Item 1 for further information.
When market closing prices are not available, the Managing Owner may value an asset of the Fund pursuant to policies the Managing Owner has adopted, which are consistent with normal industry standards.
Realized gains (losses) and changes in unrealized gain (loss) on open positions are determined on a specific identification basis and recognized in the statement of income and expenses in the period in which the contract is closed or the changes occur, respectively.
Interest income on United States Treasury Obligations is recognized on an accrual basis when earned. Premiums and discounts are amortized or accreted over the life of the United States Treasury Obligations.
Market Risk
Trading in futures contracts involves the Fund entering into contractual commitments to purchase a particular commodity at a specified date and price. The market risk associated with the Fund’s commitments to purchase commodities is limited to the gross or face amount of the contracts held.
The Fund’s exposure to market risk is also influenced by a number of factors including the volatility of interest rates and foreign currency exchange rates, as applicable, the liquidity of the markets in which the contracts are traded and the relationships among the contracts held. The inherent uncertainty of the Fund’s trading as well as the development of drastic market occurrences could ultimately lead to a loss of all or substantially all of the investors’ capital.
Credit Risk
When the Fund enters into futures contracts, the Fund is exposed to credit risk that the counterparty to the contract will not meet its obligations. The counterparty for futures contracts traded on United States and on most foreign futures exchanges is the clearing house associated with the particular exchange. In general, clearing houses are backed by their corporate members who may be required to share in the financial burden resulting from the nonperformance by one of their members and, as such, should significantly reduce this credit risk. In cases where the clearing house is not backed by the clearing members (i.e., some foreign exchanges), it may be backed by a consortium of banks or other financial institutions. There can be no assurance that any counterparty, clearing member or clearinghouse will meet its obligations to the Fund.
23
Table of Contents
The Commodity Broker, when acting as the Fund’s futures commission merchant in accepting orders for the purchase or sale of domestic futures contracts, is required by CFTC regulations to separately account for and segregate as belonging to the Fund all assets of the Fund relating to domestic futures trading and the Commodity Broker is not allowed to commingle such assets with other assets of the Commodity Broker. In addition, CFTC regulations also require the Commodity Broker to hold in a secure account assets of the Fund related to foreign futures trading.
Liquidity
The Fund’s entire source of capital is derived from the Fund’s offering of Shares to Authorized Participants. The Fund in turn allocates its net assets to commodities trading. A significant portion of the net asset value is held in United States Treasury Obligations and cash, which are used as margin for the Fund’s trading in commodities. The percentage that United States Treasury Obligations bear to the total net assets will vary from period to period as the market values of the Fund’s commodity interests change. The balance of the net assets is held in the Fund’s commodity trading account. Interest earned on the Fund’s interest-bearing funds is paid to the Fund.
The Fund’s commodity contracts may be subject to periods of illiquidity because of market conditions, regulatory considerations or for other reasons. For example, commodity exchanges generally have the ability to limit fluctuations in certain commodity futures contract prices during a single day by regulations referred to as “daily limits.” During a single day, no trades may be executed at prices beyond the daily limit. Once the price of a particular futures contract for a particular commodity has increased or decreased by an amount equal to the daily limit, positions in the commodity futures contract can neither be taken nor liquidated unless the traders are willing to effect trades at or within the limit. Commodity futures prices have occasionally moved the daily limit for several consecutive days with little or no trading. Such market conditions could prevent the Fund from promptly liquidating its commodity futures positions.
Because the Fund trades futures contracts, its capital is at risk due to changes in the value of futures contracts (market risk) or the inability of counterparties (including the Commodity Broker and/or exchange clearinghouses) to perform under the terms of the contracts (credit risk).
Authorized Participants may also redeem their Baskets of Shares. On any business day, an Authorized Participant may place an order with the Managing Owner to redeem one or more Baskets. Redemption orders must be placed by 10:00 a.m., Eastern Time. The day on which the Managing Owner receives a valid redemption order is the redemption order date. Redemption orders are irrevocable. The redemption procedures allow only Authorized Participants to redeem Baskets. Individual Shareholders may not redeem directly from the Fund. Redemption orders may be placed either (i) through the Continuous Net Settlement (“CNS”) clearing processes of the National Securities Clearing Corporation (the “NSCC”) or (ii) if outside the CNS Clearing Process, only through the facilities of The Depository Trust Company (“DTC” or the “Depository”) (the “DTC Process”), or a successor depository, and only in exchange for cash. By placing a redemption order, and prior to receipt of the redemption proceeds, an Authorized Participant’s DTC account is charged the non-refundable transaction fee due for the redemption order and such fee is not borne by the Fund.
Cash Flows
The primary cash flow activity of the Fund is to raise capital from Authorized Participants through the issuance of Shares. This cash is used to invest in United States Treasury Obligations and to meet margin requirements as a result of the positions taken in futures contracts to match the fluctuations of the Index the Fund is tracking.
Operating Activities
Net cash flow used for operating activities was $593.7 million and $986.4 million for the Nine Months Ended September 30, 2013 and 2012, respectively. This amount primarily includes net purchases and sales of United States Treasury Obligations which are held at fair value on the statement of financial condition.
During the Nine Months Ended September 30, 2013, $20,930.2 million was paid to purchase United States Treasury Obligations and $19,322.8 million was received from sales and maturing contracts. During the Nine Months Ended September 30, 2012, $17,711.1 million was paid to purchase United States Treasury Obligations and $17,239.4 million was received from sales and maturing contracts. Unrealized appreciation on United States Treasury Obligations and futures collectively increased by $185.6 million and futures decreased by $867.7 million during the Nine Months Ended September 30, 2013 and 2012, respectively.
Financing Activities
The Fund’s net cash flow provided by financing activities was $337.5 million and $868.2 million during the Nine Months Ended September 30, 2013 and 2012, respectively. This included $1,125.2 million and $1,497.6 million from the sale of Shares to Authorized Participants during the Nine Months Ended September 30, 2013 and 2012, respectively.
24
Table of Contents
Results of Operations
FOR THE THREE MONTHS ENDED SEPTEMBER 30, 2013 AND 2012 AND THE NINE MONTHS ENDED SEPTEMBER 30, 2013 AND 2012
The Fund was launched on January 31, 2006 at $25.00 per Share. The Shares traded on the NYSE Alternext from February 3, 2006 to November 25, 2008 and have been trading on the NYSE Arca since November 25, 2008.
The Fund seeks to track changes in the closing levels of the DBIQ Optimum Yield Diversified Commodity Index Excess Return™ (the “Index”) over time, plus the excess, if any, of the Fund’s interest income from its holdings of United States Treasury Obligations and other high credit quality short-term fixed income securities over the expenses of the Fund. The following graphs illustrate changes in (i) the price of the Shares (as reflected by the graph “DBC”), (ii) the Fund’s NAV (as reflected by the graph “DBCNAV”), and (iii) the closing levels of the Index (as reflected by the graph “DBLCIX”). Whenever the interest income earned by the Fund exceeds Fund expenses, the price of the Shares generally has exceeded the levels of the Index primarily because the Share price reflects interest income from the Fund’s collateral holdings whereas the Index does not consider such interest income. There can be no assurances that the price of the Shares will exceed the Index levels.
The Index is a set of rules applied to a body of data and does not represent the results of actual investment or trading. The Index is frictionless, in that it does not take into account fees or expenses associated with investing in the Fund. Also, because it does not represent actual futures positions, the Index is not subject to, and does not take into account the impact of, speculative position limits or certain other similar limitations on the ability of the Fund to trade the Index Commodities. The “TR” version of the Index includes an assumed amount of interest income based on prevailing rates that is adjusted from time to time. The Fund, by contrast, invests actual money and trades actual futures contracts. As a result, the performance of the Fund involves friction, in that fees and expenses impose a drag on performance. The Fund may be subject to speculative position limits and certain other limitations on its ability to trade the Index Commodities, which may compel the Fund to trade futures or other instruments that are not Index Commodities as proxies for the Index Commodities. The interest rate actually earned by the Fund over any period may differ from the assumed amount of interest income factored into the “TR” version of the Index over the same period. All of these factors can contribute to discrepancies between changes in net asset value per Share and changes in the level of the Index over any period of time. Fees and expenses always will tend to cause changes in the net asset value per Share to underperform changes in the value of the Index over any given period, all other things being equal. Actual interest income could be higher or lower than the assumed interest income factored into the “TR” version of the Index, and therefore could cause changes in the net asset value per Share to outperform or underperform changes in the value of the “TR” version of the Index over any given period, all other things being equal. Similarly, trading futures or other instruments that are not Index Commodities as proxies for the Index Commodities could cause changes in the net asset value per Share to outperform or underperform changes in the value of the Index over any given period, all other things being equal.
25
Table of Contents
COMPARISON OF DBC, DBCNAV AND DBLCIX FOR THE THREE MONTHS ENDED
SEPTEMBER 30, 2013 AND 2012 AND THE NINE MONTHS ENDED SEPTEMBER 30, 2013 AND 2012
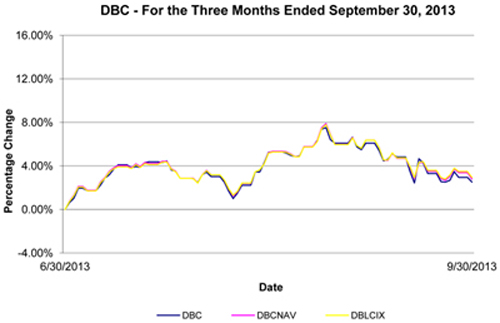
NEITHER THE PAST PERFORMANCE OF THE FUND NOR THE PRIOR INDEX LEVELS AND CHANGES, POSITIVE OR NEGATIVE, SHOULD BE TAKEN AS AN INDICATION OF THE FUND’S FUTURE PERFORMANCE.
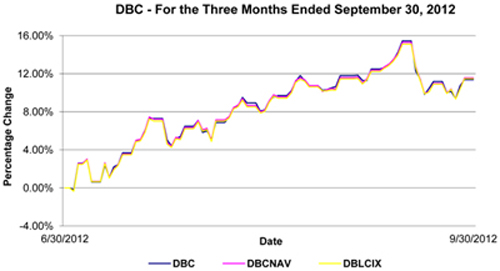
NEITHER THE PAST PERFORMANCE OF THE FUND NOR THE PRIOR INDEX LEVELS AND CHANGES, POSITIVE OR NEGATIVE, SHOULD BE TAKEN AS AN INDICATION OF THE FUND’S FUTURE PERFORMANCE.
See Additional Legends below.
26
Table of Contents
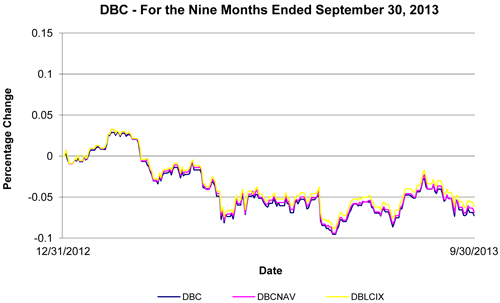
NEITHER THE PAST PERFORMANCE OF THE FUND NOR THE PRIOR INDEX LEVELS AND CHANGES, POSITIVE OR NEGATIVE, SHOULD BE TAKEN AS AN INDICATION OF THE FUND’S FUTURE PERFORMANCE.
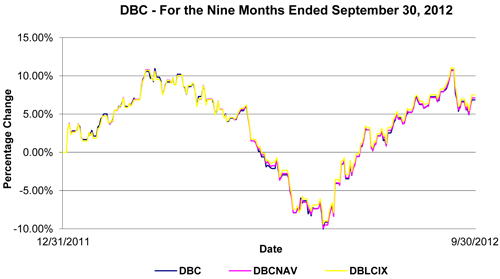
NEITHER THE PAST PERFORMANCE OF THE FUND NOR THE PRIOR INDEX LEVELS AND CHANGES, POSITIVE OR NEGATIVE, SHOULD BE TAKEN AS AN INDICATION OF THE FUND’S FUTURE PERFORMANCE.
See Additional Legends below.
27
Table of Contents
Additional Legends
DBIQ Optimum Yield Diversified Commodity Index Excess Return™ is an index and does not reflect (i) actual trading and (ii) any fees or expenses.
WHILE THE FUND’S OBJECTIVE IS NOT TO GENERATE PROFIT THROUGH ACTIVE PORTFOLIO MANAGEMENT, BUT IS TO TRACK THE INDEX, BECAUSE THE INDEX WAS ESTABLISHED IN JANUARY 2007 (RENAMED IN OCTOBER 2010), CERTAIN INFORMATION RELATING TO THE INDEX CLOSING LEVELS MAY BE CONSIDERED TO BE “HYPOTHETICAL.” HYPOTHETICAL INFORMATION MAY HAVE CERTAIN INHERENT LIMITATIONS, SOME OF WHICH ARE DESCRIBED BELOW. WITH RESPECT TO INDEX DATA, NO REPRESENTATION IS BEING MADE THAT THE INDEX WILL OR IS LIKELY TO ACHIEVE ANNUAL OR CUMULATIVE CLOSING LEVELS CONSISTENT WITH OR SIMILAR TO THOSE SET FORTH HEREIN. SIMILARLY, NO REPRESENTATION IS BEING MADE THAT THE FUND WILL GENERATE PROFITS OR LOSSES SIMILAR TO THE FUND’S PAST PERFORMANCE OR THE HISTORICAL ANNUAL OR CUMULATIVE CHANGES IN THE INDEX CLOSING LEVELS. IN FACT, THERE ARE FREQUENTLY SHARP DIFFERENCES BETWEEN HYPOTHETICAL RESULTS AND THE ACTUAL RESULTS SUBSEQUENTLY ACHIEVED BY INVESTMENT METHODOLOGIES, WHETHER ACTIVE OR PASSIVE.
WITH RESPECT TO INDEX DATA, ONE OF THE LIMITATIONS OF HYPOTHETICAL INFORMATION IS THAT IT IS GENERALLY PREPARED WITH THE BENEFIT OF HINDSIGHT. TO THE EXTENT THAT INFORMATION PRESENTED HEREIN RELATES TO THE PERIOD SEPTEMBER 1997 THROUGH DECEMBER 2006, THE INDEX CLOSING LEVELS REFLECT THE APPLICATION OF THE INDEX METHODOLOGY, AND SELECTION OF INDEX COMMODITIES, IN HINDSIGHT.
NO HYPOTHETICAL RECORD CAN COMPLETELY ACCOUNT FOR THE IMPACT OF FINANCIAL RISK IN ACTUAL TRADING. FOR EXAMPLE, THERE ARE NUMEROUS FACTORS, INCLUDING THOSE DESCRIBED UNDER ITEM 1A. – “RISK FACTORS” SET FORTH IN THE FUND’S ANNUAL REPORT ON FORM 10-K FOR THE YEAR ENDED DECEMBER 31, 2012, RELATED TO THE COMMODITIES MARKETS IN GENERAL OR TO THE IMPLEMENTATION OF THE FUND’S EFFORTS TO TRACK THE INDEX OVER TIME WHICH CANNOT BE, AND HAVE NOT BEEN, ACCOUNTED FOR IN THE PREPARATION OF THE INDEX INFORMATION SET FORTH ON THE FOLLOWING PAGES, ALL OF WHICH CAN ADVERSELY AFFECT ACTUAL PERFORMANCE RESULTS FOR THE FUND. FURTHERMORE, THE INDEX INFORMATION DOES NOT INVOLVE FINANCIAL RISK OR ACCOUNT FOR THE IMPACT OF FEES AND COSTS ASSOCIATED WITH THE FUND.
THE MANAGING OWNER, AN INDIRECT WHOLLY OWNED SUBSIDIARY OF DEUTSCHE BANK AG, COMMENCED OPERATIONS IN JANUARY 2006. AS MANAGING OWNER, THE MANAGING OWNER AND ITS TRADING PRINCIPALS HAVE BEEN MANAGING THE DAY-TO-DAY OPERATIONS FOR THE FUND AND RELATED PRODUCTS AND MANAGING FUTURES ACCOUNTS. BECAUSE THERE ARE LIMITED ACTUAL TRADING RESULTS TO COMPARE TO THE INDEX CLOSING LEVELS SET FORTH HEREIN, PROSPECTIVE INVESTORS SHOULD BE PARTICULARLY WARY OF PLACING UNDUE RELIANCE ON THE ANNUAL OR CUMULATIVE INDEX RESULTS.
FOR THE THREE MONTHS ENDED SEPTEMBER 30, 2013 COMPARED TO THE THREE MONTHS ENDED SEPTEMBER 30, 2012
Fund Share Price Performance
For the Three Months Ended September 30, 2013, the NYSE Arca market value of each Share increased 2.51% from $25.13 per Share to $25.76 per Share. The Share price high and low for the Three Months Ended September 30, 2013 and related change from the Share price on June 30, 2013 was as follows: Shares traded from a high of $27.02 per Share (+7.52%) on August 28, 2013, to a low of $25.29 per Share (+0.64%) on July 1, 2013.
For the Three Months Ended September 30, 2012, the NYSE Arca market value of each Share increased 11.38% from $25.75 per Share to $28.68 per Share. The Share price low and high for the Three Months Ended September 30, 2012 and related change from the Share price on June 30, 2012 was as follows: Shares traded from a low of $25.70 per Share (-0.19%) on July 2, 2012, to a high of $29.73 per Share (+15.46%) on September 14, 2012.
Fund Share Net Asset Performance
For the Three Months Ended September 30, 2013, the net asset value of each Share increased 2.79% from $25.11 per Share to $25.81 per Share. Rising futures contracts prices for brent crude oil, heating oil, gold, aluminum, zinc, copper grade A, RBOB gasoline, soybean, light crude oil and silver were partially offset by lower futures contract prices for corn, wheat and natural gas during the Three Months Ended September 30, 2013 contributing to an overall 2.94% increase in the level of the DBIQ-OY Diversified TR™.
28
Table of Contents
Net income for the Three Months Ended September 30, 2013 was $163.0 million, resulting from $0.7 million of interest income, net realized loss of $193.6 million, net change in unrealized gain of $370.1 million and operating expenses of $14.2 million.
For the Three Months Ended September 30, 2012, the net asset value of each Share increased 11.57% from $25.76 per Share to $28.74 per Share. Rising futures contracts prices for brent crude oil, heating oil, gold, aluminum, zinc, copper grade A, RBOB gasoline, corn, wheat, soybean, light crude oil, natural gas and silver were partially offset by lower futures contract prices for sugar during the Three Months Ended September 30, 2012 contributing to an overall 11.51% increase in the level of the DBIQ-OY Diversified TR™.
Net income for the Three Months Ended September 30, 2012 was $655.6 million, resulting from $1.2 million of interest income, net realized loss of $189.6 million, net unrealized gains of $857.6 million and operating expenses of $13.6 million.
FOR THE NINE MONTHS ENDED SEPTEMBER 30, 2013 COMPARED TO THE NINE MONTHS ENDED SEPTEMBER 30, 2012
Fund Share Price Performance
For the Nine Months Ended September 30, 2013, the NYSE Arca market value of each Share decreased 7.27% from $27.78 per Share to $25.76 per Share. The Share price high and low for the Nine Months Ended September 30, 2013 and related change from the Share price on December 31, 2012 was as follows: Shares traded from a high of $28.59 per Share (+2.92%) on February 5, 2013, to a low of $25.13 per Share (-9.54%) on June 28, 2013.
For the Nine Months Ended September 30, 2012, the NYSE Arca market value of each Share increased 6.86% from $26.84 per Share to $28.68 per Share. The Share price low and high for the Nine Months Ended September 30, 2012 and related change from the Share price on December 31, 2011 was as follows: Shares traded from a low of $24.15 per Share (-10.02%) on June 21, 2012, to a high of $29.78 per Share (+10.95%) on March 1, 2012.
Fund Share Net Asset Performance
For the Nine Months Ended September 30, 2013, the net asset value of each Share decreased 6.89% from $27.72 per Share to $25.81 per Share. Falling futures contracts prices for heating oil, corn, gold, aluminum, wheat, zinc, copper grade A, soybean, sugar, natural gas, light crude oil and silver were partially offset by higher futures contract prices for brent crude oil and RBOB gasoline during the Nine Months Ended September 30, 2013 contributing to an overall 6.09% decrease in the level of the DBIQ-OY Diversified TR™.
Net loss for the Nine Months Ended September 30, 2013 was $486.0 million, resulting from $2.8 million of interest income, net realized loss of $260.2 million, net change in unrealized loss of $185.6 million and operating expenses of $43.0 million.
For the Nine Months Ended September 30, 2012, the net asset value of each Share increased 7.12% from $26.83 per Share to $28.74 per Share. Rising futures contracts prices for heating oil, aluminum, RBOB gasoline, light crude oil, corn, gold, wheat, zinc, copper grade A, soybean and silver were partially offset by lower futures contract prices for brent crude oil, sugar and natural gas during the Nine Months Ended September 30, 2012 contributing to an overall 7.59% increase in the level of the DBIQ-OY Diversified TR™.
Net income for the Nine Months Ended September 30, 2012 was $382.5 million, resulting from $2.7 million of interest income, net realized loss of $448.1 million, net unrealized gain of $867.7 million and operating expenses of $39.8 million.
Off-Balance Sheet Arrangements and Contractual Obligations
In the normal course of its business, the Fund is a party to financial instruments with off-balance sheet risk. The term “off-balance sheet risk” refers to an unrecorded potential liability that, even though it does not appear on the balance sheet, may result in a future obligation or loss. The financial instruments used by the Fund are commodity futures, whose values are based upon an underlying asset and generally represent future commitments which have a reasonable possibility to be settled in cash or through physical delivery. The financial instruments are traded on an exchange and are standardized contracts.
The Fund has not utilized, nor does it expect to utilize in the future, special purpose entities to facilitate off-balance sheet financing arrangements and has no loan guarantee arrangements or off-balance sheet arrangements of any kind, other than agreements entered into in the normal course of business noted above, which may include indemnification provisions related to certain risks service providers undertake in performing services which are in the best interests of the Fund. While the Fund’s exposure under such indemnification provisions cannot be estimated, these general business indemnifications are not expected to have a material impact on the Fund’s financial position.
29
Table of Contents
The Fund’s contractual obligations are with the Managing Owner and the Commodity Broker. Management Fee payments made to the Managing Owner are calculated as a fixed percentage of the Fund’s net asset value. Commission payments to the Commodity Broker are on a contract-by-contract, or round-turn, basis. As such, the Managing Owner cannot anticipate the amount of payments that will be required under these arrangements for future periods as net asset values are not known until a future date. These agreements are effective for one-year terms, renewable automatically for additional one-year terms unless terminated. Additionally, these agreements may be terminated by either party for various reasons.
| ITEM 3. | QUANTITATIVE AND QUALITATIVE DISCLOSURES ABOUT MARKET RISK. |
INTRODUCTION
The Fund is designed to replicate positions in a commodity index. The market sensitive instruments held by it are subject to the risk of trading loss. Unlike an operating company, the risk of market sensitive instruments is integral, not incidental, to the Fund’s main line of business.
Market movements can produce frequent changes in the fair market value of the Fund’s open positions and, consequently, in its earnings and cash flow. The Fund’s market risk is primarily influenced by changes in the price of commodities.
Standard of Materiality
Materiality as used in this section, “Quantitative and Qualitative Disclosures About Market Risk,” is based on an assessment of reasonably possible market movements and the potential losses caused by such movements, taking into account the effects of margin, and any other multiplier features, as applicable, of the Fund’s market sensitive instruments.
QUANTIFYING THE FUND’S TRADING VALUE AT RISK
Quantitative Forward-Looking Statements
The following quantitative disclosures regarding the Fund’s market risk exposures contain “forward-looking statements” within the meaning of the safe harbor from civil liability provided for such statements by the Private Securities Litigation Reform Act of 1995 (set forth in Section 27A of the Securities Act of 1933 and Section 21E of the Exchange Act). All quantitative disclosures in this section are deemed to be forward-looking statements for purposes of the safe harbor, except for statements of historical fact (such as the dollar amount of maintenance margin required for market risk sensitive instruments held at the end of the reporting period).
Value at Risk (“VaR”), is a statistical measure of the value of losses that would not be expected to be exceeded over a given time horizon and at a given probability level arising from movement of underlying risk factors. Loss is measured as a decline in the fair value of the portfolio as a result of changes in any of the material variables by which fair values are determined. VaR is measured over a specified holding period (1 day) and to a specified level of statistical confidence (99th percentile). However, the inherent uncertainty in the markets in which the Fund trades and the recurrence in the markets traded by the Fund of market movements far exceeding expectations could result in actual trading or non-trading losses far beyond the indicated VaR or the Fund’s experience to date (i.e., “risk of ruin”). In light of this, as well as the risks and uncertainties intrinsic to all future projections, the inclusion of the quantification included in this section should not be considered to constitute any assurance or representation that the Fund’s losses in any market sector will be limited to VaR or, if applicable, will be mitigated by the Fund’s attempts to manage its market risk.
THE FUND’S TRADING VALUE AT RISK
The Fund calculates VaR using the actual historical market movements of the Fund’s total assets.
The following table indicates the trading VaR associated with the Fund’s total assets as of September 30, 2013.
| Description |
Total Assets | Daily Volatility | VaR* (99 Percentile) |
Number of times VaR Exceeded |
||||||||||||
| PowerShares DB Commodity Index Tracking Fund |
$ | 7,793,599,095 | 0.72 | % | $ | 107,789,396 | 1 | |||||||||
The following table indicates the trading VaR associated with the Fund’s total assets as of December 31, 2012.
| Description |
Total Assets | Daily Volatility | VaR* (99 Percentile) |
Number of times VaR Exceeded |
||||||||||||
| PowerShares DB Commodity Index Tracking Fund |
$ | 6,614,804,375 | 0.94 | % | $ | 143,451,648 | 0 | |||||||||
| * | The VaR represents the one day downside risk, under normal market conditions, with a 99% confidence level. It is calculated using historical market moves of the Fund’s total assets and uses a one year look-back. |
30
Table of Contents
NON-TRADING RISK
The Fund has non-trading market risk as a result of investing in short-term United States Treasury Obligations. The market risk represented by these investments is expected to be immaterial.
QUALITATIVE DISCLOSURES REGARDING PRIMARY TRADING RISK EXPOSURES
The following qualitative disclosures regarding the Fund’s market risk exposures — except for those disclosures that are statements of historical fact — constitute forward-looking statements within the meaning of Section 27A of the Securities Act and Section 21E of the Exchange Act. The Fund’s primary market risk exposures are subject to numerous uncertainties, contingencies and risks. Government interventions, defaults and expropriations, illiquid markets, the emergence of dominant fundamental factors, political upheavals, changes in historical price relationships, an influx of new market participants, increased regulation and many other factors could result in material losses as well as in material changes to the risk exposures of the Fund. There can be no assurance that the Fund’s current market exposure will not change materially. Investors may lose all or substantially all of their investment in the Fund.
The following were the primary trading risk exposures of the Fund as of September 30, 2013 by market sector.
ENERGY
Light Sweet Crude Oil
The price of light sweet crude oil is volatile and is affected by numerous factors. The level of global industrial activity influences the demand for light sweet crude oil. In addition, various other factors can affect the demand for light sweet crude oil, such as weather, political events and labor activity. The supply of light sweet crude oil can be affected by many events, in particular, the meetings of the Organization of Petroleum Exporting Countries. Market expectations about events that will influence either demand or supply can cause prices for light sweet crude oil to fluctuate greatly. A significant amount of the world oil production capacity is controlled by a relatively small number of producers. Any large change in production by one of these producers could have a substantial effect on the price of light sweet crude oil.
Heating Oil
The price of heating oil is volatile and is affected by numerous factors. The level of global industrial activity influences the demand for heating oil. In addition, the seasonal temperatures in countries throughout the world can also heavily influence the demand for heating oil. Heating oil is derived from crude oil and as such, any factors that influence the supply of crude oil may also influence the supply of heating oil.
Brent Crude Oil
The price of Brent crude oil is volatile and is affected by numerous factors. The price of Brent crude oil is influenced by many factors, including, but not limited to, the amount of output by oil producing nations, worldwide supply/stockpiles, weather, various geopolitical factors that cause supply disruptions (e.g., war, terrorism), global demand (particularly from emerging nations), currency fluctuations, and activities of market participants such as hedgers and speculators.
RBOB Gasoline
The price of RBOB Gasoline is volatile and is affected by numerous factors. The level of global industrial activity influences the demand for RBOB Gasoline. In addition, the demand has seasonal variations, which occur during “driving seasons” usually considered the summer months in North America and Europe. RBOB Gasoline is derived from crude oil and as such, any factors that influence the supply of crude oil may also influence the supply of RBOB Gasoline.
Natural Gas
The price of natural gas is volatile and is affected by numerous factors. The level of global industrial activity influences the demand for natural gas. In addition to the seasonal temperatures in countries throughout the world, any fluctuations in temperature may also heavily influence the demand for natural gas.
METALS
Gold
The price of gold is volatile and is affected by numerous factors. Gold prices float freely in accordance with supply and demand. The price movement of gold may be influenced by a variety of factors, including announcements from central banks regarding reserve gold holdings, agreements among central banks, purchases and sales of gold by central banks, other governmental agencies that hold large supplies of gold, political uncertainties, economic concerns such as an increase or decrease in confidence in the global monetary system, the relative strength of the U.S. dollar, interest rates and numerous other factors. Gold prices may also be affected by industry factors such as industrial and jewelry demand.
31
Table of Contents
Silver
The price of silver is volatile and is affected by numerous factors. The largest industrial users of silver (e.g., photographic, jewelry, and electronic industries) may influence its price. A change in economic conditions, such as a recession, can adversely affect industries which are dependent upon the use of silver. In turn, such a negative economic impact may decrease demand for silver, and, consequently, its price. Worldwide speculation and hedging activity by silver producers may also impact its price.
Aluminum
The price of aluminum is volatile. The price movement of aluminum may be influenced by a variety of factors, including the level of global industrial activity and demand, especially relating to the transportation, packaging and building sectors, each of which significantly influences the demand, and in turn, the price of aluminum. Prices for aluminum are influenced by a number of factors including the level of economic activity in large aluminum consuming markets, political uncertainties, economic concerns and the rate of supply of new metal from producers. The production of aluminum is a power intensive process that requires large amounts of inexpensive power. Disruptions in the amount of energy available to aluminum producers could affect the supply of aluminum.
Zinc
The price of zinc is volatile and is affected by numerous factors. The price of zinc is primarily affected by the global demand for and supply of zinc. Demand for zinc is significantly influenced by the level of global industrial economic activity. The galvanized steel industrial sector is particularly important given that the use of zinc in the manufacture of galvanized steel accounts for approximately 50% of world-wide zinc demand. The galvanized steel sector is in turn heavily dependent on the automobile and construction sectors. An additional, but highly volatile component of demand, is adjustments to inventory in response to changes in economic activity and/or pricing levels. The supply of zinc concentrate (the raw material) has generally been dominated by China, Australia, North America and Latin America. The supply of zinc is also affected by current and previous price levels, which will influence investment decisions in new mines and smelters. It is not possible to predict the aggregate effect of all or any combination of these factors.
Copper
The price of copper is volatile. The price of copper is primarily affected by the global demand for and supply of copper. Demand for copper is significantly influenced by the level of global industrial economic activity. Industrial sectors which are particularly important include the electrical and construction sectors. In recent years demand has been supported by strong consumption from newly industrializing countries, which continue to be in a copper-intensive period of economic growth as they develop their infrastructure (such as China). An additional, but highly volatile, component of demand is adjustments to inventory in response to changes in economic activity and/or pricing levels. Apart from the United States, Canada and Australia, the majority of copper concentrate supply (the raw material) comes from outside the Organization for Economic Cooperation and Development countries. Chile is the largest producer of copper concentrate. In previous years, copper supply has been affected by strikes, financial problems, political turmoil and terrorist activity.
AGRICULTURAL
Corn
The price of corn is volatile. The price movement of corn may be influenced by three primary supply factors: farmer planting decisions, climate, and government agricultural policies and three major market demand factors: livestock feeding, shortages or surpluses of world grain supplies, and domestic and foreign government policies and trade agreements. Additionally, the price movement of corn may be influenced by a variety of other factors, including weather conditions, disease, transportation costs, political uncertainties and economic concerns.
Wheat
The price of wheat is volatile. The price movement of wheat may be influenced by three primary supply factors: farmer planting decisions, climate, and government agricultural policies and three major market demand factors: food, shortages or surpluses of world grain supplies, and domestic and foreign government policies and trade agreements. Additionally, the price movement of wheat may be influenced by a variety of other factors, including weather conditions, disease, transportation costs, political uncertainties and economic concerns.
32
Table of Contents
Soybeans
The price of soybeans is volatile. The price movement of soybeans may be influenced by a variety of factors, including demand, weather conditions, disease, crop production, transportation costs, political uncertainties and economic concerns.
Sugar
The price of sugar is volatile. The price movement of sugar may be influenced by a variety of factors, including demand, weather conditions, disease, crop production, transportation costs, political uncertainties and economic concerns.
QUALITATIVE DISCLOSURES REGARDING NON-TRADING RISK EXPOSURE
General
The Fund is unaware of any (i) anticipated known demands, commitments or capital expenditures; (ii) material trends, favorable or unfavorable, in its capital resources; or (iii) trends or uncertainties that will have a material effect on operations.
QUALITATIVE DISCLOSURES REGARDING MEANS OF MANAGING RISK EXPOSURE
Under ordinary circumstances, the Managing Owner’s discretionary power is limited to determining whether the Fund will make a distribution. Under emergency or extraordinary circumstances, the Managing Owner’s discretionary powers increase, but remain circumscribed. These special circumstances, for example, include the unavailability of the Index or certain natural or man-made disasters. The Managing Owner does not apply risk management techniques. The Fund initiates positions only on the “long” side of the market and does not employ “stop-loss” techniques.
| ITEM 4. | CONTROLS AND PROCEDURES. |
Evaluation of Disclosure Controls and Procedures
Under the supervision and with the participation of the management of the Managing Owner, including Martin Kremenstein, its Chief Executive Officer, and Michael Gilligan, its Chief Financial Officer, the Fund carried out an evaluation of the effectiveness of the design and operation of its disclosure controls and procedures (as defined in Rule 13a-15(e) or 15d-15(e) of the Exchange Act) as of the end of the period covered by this quarterly report, and, based upon that evaluation, Martin Kremenstein, the Chief Executive Officer, and Michael Gilligan, the Chief Financial Officer of the Managing Owner, concluded that the Fund’s disclosure controls and procedures were effective to ensure that information the Fund is required to disclose in the reports that it files or submits with the Securities and Exchange Commission (the “SEC”) under the Exchange Act is recorded, processed, summarized and reported, within the time periods specified in the SEC’s rules and forms, and to ensure that information required to be disclosed by the Fund in the reports that it files or submits under the Exchange Act is accumulated and communicated to management of the Managing Owner, including its Chief Executive Officer and Chief Financial Officer, as appropriate to allow timely decisions regarding required disclosure.
Changes in Internal Control Over Financial Reporting
There has been no change in internal control over financial reporting (as defined in the Rules 13a-15(f) and 15d-15(f) of the Exchange Act) that occurred during the Fund’s last fiscal quarter that has materially affected, or is reasonably likely to materially affect, the Fund’s internal control over financial reporting.
33
Table of Contents
| Item 1. | Legal Proceedings. |
Not applicable.
| Item 1A. | Risk Factors. |
There are no material changes from risk factors as previously disclosed in the Annual Report on Form 10-K for the year ended December 31, 2012, filed February 22, 2013.
| Item 2. | Unregistered Sales of Equity Securities and Use of Proceeds. |
(a) There have been no unregistered sales of the Fund’s securities. No Fund securities are authorized for issuance by the Fund under equity compensation plans.
(b) Not applicable.
(c) The following table summarizes the redemptions by Authorized Participants during the Three Months Ended September 30, 2013:
| Period of Redemption |
Total Number of Shares Redeemed |
Average Price Paid per Share |
||||||
| July 1, 2013 to July 31, 2013 |
— | — | ||||||
| August 1, 2013 to August 31, 2013 |
400,000 | $ | 25.42 | |||||
| September 1, 2013 to September 30, 2013 |
8,400,000 | $ | 26.21 | |||||
|
|
|
|
|
|||||
| Total: |
8,800,000 | $ | 26.18 | |||||
|
|
|
|
|
|||||
| Item 3. | Defaults Upon Senior Securities. |
None.
| Item 4. | Mine Safety Disclosures. |
Not applicable.
| Item 5. | Other Information. |
Disclosures Under Iran Threat Reduction and Syria Human Rights Act of 2012 (“ITRA”)
Deutsche Bank AG, an affiliate of ours, has provided us the disclosure set forth below describing the ITRA-relevant activities of it and its affiliates for the quarter ended September 30, 2013. All references in this quoted disclosure to “we,” “us” and “our” are to Deutsche Bank AG and its affiliates. None of the disclosed activities or transactions were conducted by the Registrant.
Disclosures Under Iran Threat Reduction and Syria Human Rights Act of 2012
Under Section 219 of the Iran Threat Reduction and Syria Human Rights Act of 2012, which added Section 13(r) of the U.S. Securities Exchange Act of 1934, as amended, an issuer of securities registered under the Securities Exchange Act of 1934 is required to disclose in its periodic reports filed under the Securities Exchange Act of 1934 certain of its activities and those of its affiliates relating to Iran and to other persons sanctioned by the U.S. under programs relating to terrorism and proliferation of weapons of mass destruction that occurred during the period covered by the report. We describe below a number of potentially disclosable activities of Deutsche Bank AG and its affiliates. Disclosure is generally required regardless of whether the activities, transactions or dealings were conducted in compliance with applicable law.
Legacy Financing Arrangements. Despite having ceased entering into new business in or with Iran in 2007, we continue to be engaged as lender, sponsoring bank and/or facility agent in several long-term financing agreements relating to the construction or acquisition of plant or equipment for the petroleum and petrochemical industries, under which Iranian entities were the direct or indirect borrowers. Before 2007, as part of a number of banking consortia, we entered into a number of financing arrangements, six of which remained outstanding as of July 1, 2013, with the National Iranian Oil Company (NIOC), the National Petrochemical Company (NPC), Bank Melli Iran and their respective group entities as borrowers. The latest final maturity under these loan facilities is in 2019. These loan facilities are guaranteed by national export credit agencies representing two European national governments and one Asian national government. The obligations of the borrowers under these loan facilities are, in principle, secured by assignments of receivables from oil
34
Table of Contents
and oil products exported by NIOC, NPC and/or their trading subsidiaries to buyers, mostly in Asia. These delivery obligations, however, are waived for 2013, due to the current sanctions environment. For some of these arrangements, we act as escrow agent, holding escrow accounts for the Iranian borrowers mentioned above or for the former borrower NIOC, into which receivables are in principle paid by the buyers of the oil and oil products. During the third quarter of 2013, however, no receivables were effectively paid to the said escrow accounts. Such accounts are pledged in favor of the relevant banking consortium. We have no involvement in the contractual arrangements related to, or in the physical settlement of, the oil and oil product exports mentioned above. The Iranian entities in whose names the escrow accounts are held are not permitted to draw on these accounts, either because they are parties sanctioned under applicable law or, where this is not the case, due to our business decision to freeze the accounts in light of the overall sanctions environment.
During the third quarter of 2013, approximately € 40,000 was paid into one of the escrow accounts, caused by a partial refund of the premium originally paid to the German export credit agency, due to the prepayment of the covered financing in 2012,, and we, in our role as escrow agent, distributed to the participants in the banking consortia approximately € 5,000 including portions attributable to us totalling approximately € 400.
We generated revenues in the third quarter of 2013 of approximately € 0.7 million in respect of these financing arrangements, of which approximately € 0.65 million consisted of escrow account revenues, approximately € 40,000 consisted of loan interest revenues and approximately € 10,000 consisted of fee revenues. The net profits were less than these amounts.
Our portion of the remaining loan facilities amounted to approximately € 31.2 million as of September 30, 2013. We intend to continue pursuing repayment and fulfilling our administrative role under these agreements, but we do not intend to engage in any extensions of or new credit to these or other Iranian entities.
As of September 30, 2013, we have an undrawn commitment under one of the financing agreements referred to above under which the NPC is borrower of approximately € 1.3 million. Due to the export credit agency coverage, this remainder cannot be cancelled without German government approval, for which we have applied but have not yet received. We do not intend to make further disbursements upon this undrawn commitment.
A wholly-owned subsidiary of ours, BHF-BANK AG, which we acquired as part of the acquisition of the Sal. Oppenheim Group in March 2010 and which we intend to sell pending regulatory approvals, was a lender participant in a number of similar arrangements, the borrowers of which were Bank Saderat, Bank Melli, Bank Sepah, Bank Tejarat and NPC. In that capacity, it received no repayments of principal and less than € 1,000 of interest in the third quarter of 2013, which was paid by us to BHF-BANK in our capacity as agent or arranger. Of the amount received, BHF-Bank passed on a half to a participant in such arrangement. In the third quarter of 2013, BHF-BANK’s gross revenues from this business were approximately € 20,000 and its net profits were less than this amount.
Legacy Contractual Obligations Related to Guarantees. Prior to 2007, we provided guarantees to a number of Iranian entities. In almost all of these cases, we issued counter-indemnities in support of guarantees issued by Iranian banks because the Iranian beneficiaries of the guarantees required that they be backed directly by Iranian banks. In 2007, we made a decision to refrain from issuing new guarantees to Iranian or Iran-related beneficiaries. Although these pre-existing guarantees stipulate that they must be either extended or honored if we receive such a demand and we are legally not able to terminate these guarantees, we decided in 2011 to reject any “extend or pay” demands under such guarantees. Even though we exited many of these guarantees, a number are still outstanding, having an aggregate face amount of approximately € 8.3 million as of September 30, 2013. The gross revenues from this business in the third quarter of 2013 were approximately € 11,000 and the net profits we derived from these activities was less than this amount.
We also have outstanding legacy guarantees in relation to a Syrian bank sanctioned by the U.S. under its non-proliferation programs. The aggregate face amount of these legacy guarantees was approximately € 9.0 million as of September 30, 2013, the gross revenues received from non-Syrian parties for these guarantees in the third quarter of 2013 were approximately € 3,000 and the net profits we derived from these activities was less than this amount.
BHF-BANK, based on similar legacy guarantees issued before 2010, paid commissions and charges in the third quarter of 2013 of approximately € 2,000 to accounts of relevant Iranian banks frozen under applicable EU law. BHF-BANK received in the third quarter of 2013 approximately € 35,000 in fees from the non-Iranian parties for which the guarantees were issued and their net profits were less than this amount. The aggregate face amount of these legacy guarantees was approximately € 20.1 million as of September 30, 2013.
BHF-BANK also has outstanding legacy guarantees in relation to a Syrian bank sanctioned by the U.S. under its non-proliferation programs. The aggregate face amount of these legacy guarantees was approximately € 0.4 million, the gross revenues received from non-Syrian parties for these guarantees were less than € 1,500 and the net profits derived from these activities was less than this amount.
35
Table of Contents
We intend to exit these arrangements in the coming years as soon as possible.
Payments. We received 29 payments amounting to less than € 6.4 million in favor of non-Iranian clients in Germany, Belgium and the Netherlands, which payments were subsequently found to have stemmed from a relevant Iranian entity. Revenues for these incoming payments were less than € 7,500. These figures include relevant payments in favor of clients of our subsidiary Postbank. In general, we intend to continue these activities.
Operations of Iranian Bank Branches and Subsidiaries in Germany and/or France. Several Iranian banks, including Bank Melli Iran, Bank Saderat, Bank Tejarat and Europäisch-Iranische Handelsbank, have branches or offices in Germany and/or France, even though their funds and other economic resources are frozen under European law. As part of the payment clearing system in Germany and other European countries, when these branches or offices need to make payments in Germany or Europe to cover their day-to-day operations such as rent, taxes, insurance premia and salaries for their remaining staff, or for any other kind of banking-related operations necessary to wind down their legacy trade business, the German Bundesbank accepts fund transfers from these Iranian banks and disburses them to the applicable (mainly German) payees, some of whom hold accounts with us. In the third quarter of 2013, we received approximately € 2.0 million in such disbursements in less than 300 transactions via the German Bundesbank and French banks in respect of payments from the above-mentioned Iranian banks, and the net profits derived from these payments were negligible (less than one euro per transaction). Relevant transactions of our subsidiary Postbank are included in these figures. In general, we intend to continue these activities.
Based on discussions initiated by the German Bundesbank, BHF-BANK continues to maintain accounts for Bank Sepah’s Frankfurt branch, which accounts are frozen under European sanctions law. In the third quarter of 2013, the total volume of outgoing payments from these accounts was approximately € 5.2 million, which payments were made with the consent of the competent authorities in Germany under applicable law. In the third quarter of 2013, the gross revenues from this activity were approximately € 1,500 and the net profits were less than this amount.
Maintaining of Accounts for Iranian Consulates and Embassies. Iranian embassies and consulates in Germany and the Netherlands also hold accounts with us as well as with Postbank. This includes the provision by a subsidiary of Postbank to the Iranian Consulate of girocard (debit card/ATM) terminals as well as the processing of transactions of cardholders using those terminals; the terminals are used to facilitate the payment of fees for the issuance of visas and other administrative measures by the consulate. The accounts maintained exist to fund the day-to-day operational costs of the embassies and consulates, such as salaries, rent, and electricity. Additionally, Deutsche Bank Netherlands N.V. has a relationship with the Agent Bureau of the Embassy of the Islamic Republic of Iran in The Hague (which is responsible for all Iran-U.S. Claims Tribunal activities). The total volume of outgoing payments from these accounts was approximately € 12 million in the third quarter of 2013, which payments were made with the consent of the competent authorities in the relevant European countries under applicable law. We derived gross revenues of approximately € 12,000 and net profits which were less than this amount from these activities. The German government has requested that we continue to provide these services in the future to enable the Government of Iran to conduct its diplomatic relations with Germany; we intend to continue these activities. In the Netherlands, we are in the process of discontinuing the relevant services.
Activities of Entities in Which We Have Interests. Section 13(r) requires us to provide the specified disclosure with respect to ourselves and our “affiliates,” as defined in Exchange Act Rule 12b-2. Although we have minority equity interests in certain entities that could arguably result in these entities being deemed “affiliates,” we do not have the authority or the legal ability to acquire in every instance the information from these entities that would be necessary to determine whether they are engaged in any disclosable activities under Section 13(r). In some cases, legally independent entities are not permitted to disclose the details of their activities to us because of German privacy and data protection laws or the applicable banking laws and regulations. In such cases, voluntary disclosure of such details could violate such legal and/or regulatory requirements and subject the relevant entities to criminal prosecution or regulatory investigations.
36
Table of Contents
| Item 6. | Exhibits. |
| 31.1 | Certification required under Exchange Act Rules 13a-14 and 15d-14 (filed herewith) | |
| 31.2 | Certification required under Exchange Act Rules 13a-14 and 15d-14 (filed herewith) | |
| 32.1 | Certification of Chief Executive Officer pursuant to 18 U.S.C. Section 1350 as adopted pursuant to Section 906 of the Sarbanes-Oxley Act of 2002 (furnished herewith) | |
| 32.2 | Certification of Chief Financial Officer pursuant to 18 U.S.C. Section 1350 as adopted pursuant to Section 906 of the Sarbanes-Oxley Act of 2002 (furnished herewith) | |
| 101 | Interactive data file pursuant to Rule 405 of Regulation S-T: (i) the Statements of Financial Condition of PowerShares DB Commodity Index Tracking Fund — September 30, 2013 (unaudited) and December 31, 2012, (ii) the Unaudited Schedule of Investments of PowerShares DB Commodity Index Tracking Fund — September 30, 2013, (iii) the Schedule of Investments of PowerShares DB Commodity Index Tracking Fund — December 31, 2012, (iv) the Unaudited Statements of Income and Expenses of PowerShares DB Commodity Index Tracking Fund — Three Months Ended September 30, 2013 and 2012 and Nine Months Ended September 30, 2013 and 2012, (v) the Unaudited Statements of Changes in Shareholders’ Equity of PowerShares DB Commodity Index Tracking Fund — Three Months Ended September 30, 2013, (vi) the Unaudited Statements of Changes in Shareholders’ Equity of PowerShares DB Commodity Index Tracking Fund — Three Months Ended September 30, 2012, (vii) the Unaudited Statements of Changes in Shareholders’ Equity of PowerShares DB Commodity Index Tracking Fund — Nine Months Ended September 30, 2013, (viii) the Unaudited Statements of Changes in Shareholders’ Equity of PowerShares DB Commodity Index Tracking Fund — Nine Months Ended September 30, 2012, (ix) the Unaudited Statements of Cash Flows of PowerShares DB Commodity Index Tracking Fund — Nine Months Ended September 30, 2013 and 2012, and (x) Notes to Unaudited Financial Statements of PowerShares DB Commodity Index Tracking Fund. | |
37
Table of Contents
Pursuant to the requirements of the Securities Exchange Act of 1934, the Registrant has duly caused this report to be signed on its behalf by the undersigned, thereunto duly authorized.
| PowerShares DB Commodity Index Tracking Fund | ||
| By: | DB Commodity Services LLC, its Managing Owner | |
| By: | /S/ MARTIN KREMENSTEIN | |
| Name: Title: | Martin Kremenstein Chief Executive Officer |
| By: | /S/ MICHAEL GILLIGAN | |
| Name: Title: | Michael Gilligan Chief Financial Officer |
Dated: November 5, 2013
38