Attached files
| file | filename |
|---|---|
| 8-K - FORM 8-K - DORAL FINANCIAL CORP | d623136d8k.htm |
| EX-99.1 - EX-99.1 - DORAL FINANCIAL CORP | d623136dex991.htm |
 Doral Financial Corporation
Q3 2013 Investor Presentation
November 5, 2013
Exhibit 99.2 |
 Disclaimer
2
This presentation may include forward-looking statements as defined in the
Private Securities Litigation Reform Act of 1995 (the
“PSLRA”). These include comments with respect to our objectives and
strategies, and the results of our operations and our business.
Forward-looking statements can be identified by the fact that they do not relate strictly to historical or current facts.
They
often
include
words
such
as
“expects,”
“anticipates,”
“intends,”
“plans,”
“believes,”
“seeks,”
“estimates,”
or
words
of
similar
meaning,
or
future
or
conditional
verbs
such
as
“will,”
“would,”
“should,”
“could”
or
“may.”
We
intend
these
forward-looking
statements to be covered by the safe harbor provisions of the PSLRA.
Forward-looking statements provide our expectations or predictions of future
conditions, events or results. They are, by their nature, subject to risks
and uncertainties. They are not guarantees of future performance, and actual results may differ materially.
By their nature, these forward-looking statements involve numerous assumptions
and uncertainties, both general and specific, including those discussed in
Doral Financial Corporation’s 2012 Annual Report on Form 10-K and other filings we make with the
Securities and Exchange Commission. Risk factors and uncertainties that could cause
the Company's actual results to differ materially from those described in
forward-looking statements can be found in the Company's 2012 Annual Report on Form 10-K,
which is available in the Company's website at
, as they may be updated from time to time in the
Company’s periodic and other reports filed with the Securities and Exchange
Commission. The statements in this presentation speak only as of the date
they are made. We do not undertake to update forward-looking
statements
to
reflect
the
impact
of
circumstances
or
events
that
arise
after
the
date
the
forward-looking
statements
were
made,
other than as required by law, including requirements of applicable securities
laws. www.doralfinancial.com |
 Q3
2013 Results 3
Q3 results showed improvement versus Q2 2013; capital remains in
excess of regulatory requirements
Puerto Rico’s economic recession expected to continue
Doral Recovery strategy is producing benefits
o
NPAs
remained
flat
over
the
quarter
--
NPLs up 4MM; OREO down $6MM
o
Commercial NPAs fell by $20MM on strong collections and restructuring
activity US platform continues to fuel growth
o
Loans increased to $2.7B on $439MM of loan production during Q3
o
Retail deposits increased $250MM to $1.5B
o
Net Loss
$(7.5)MM
o
Pre-Tax, Pre-Credit Provision Income
$7.9MM
o
Provisions
$16.4MM
o
Net Interest Margin
303bps
o
Book Value per Share
$66.55
o
Tier-1 Leverage Ratio (Doral Bank)
8.3%
o
Total Risk-Based Capital (Doral Bank)
12.3% |
 Doral
Financial Corporation Profile 4
Company Overview
$8.6B Asset PR Mortgage & US Commercial Bank
Capital Ratios continue to exceed regulatory requirements:
o
Tier-1 Leverage Ratio (DFC):
8.7%
o
Total Risk-Based Capital Ratio (DFC): 12.1%
Book Value of $66.55 per share
o
A valuation allowance against Doral’s remaining deferred
tax asset represents an additional $ 44.79 per share ($297.9MM)
Doral operates two segments:
1.
Doral Growth : Profitable Mortgage & Commercial Bank
o
PR Growth: Mortgage & Retail Bank
o
US: Commercial & Retail Bank
2.
Doral Recovery:
Puerto Rico Special Servicing Portfolio
o
PR Residential Mortgage & OREO
o
PR Commercial Loans & OREO
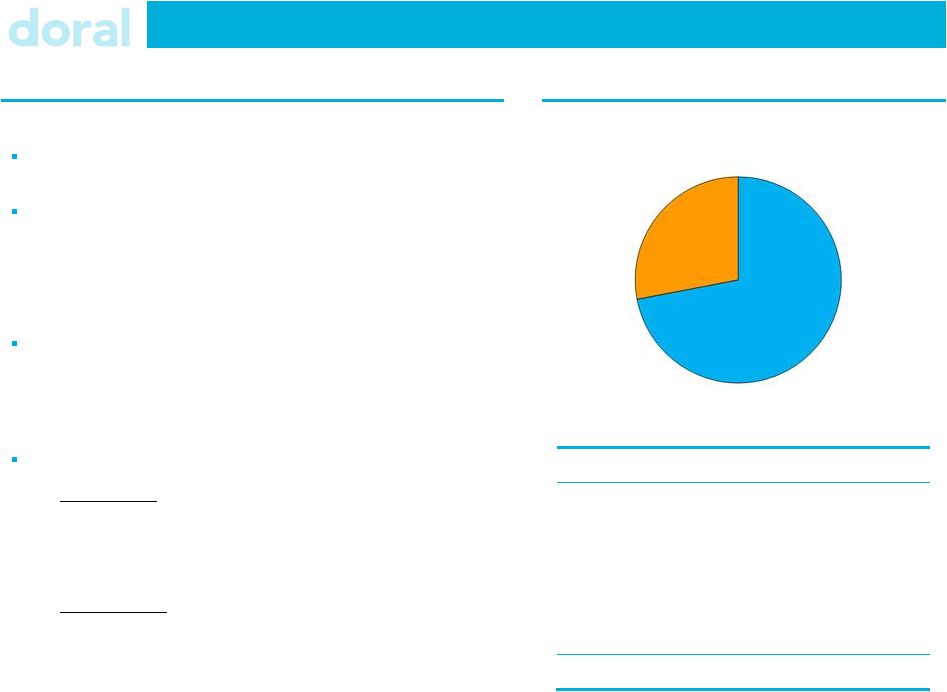
Loan Portfolio Composition ($6.8B)
Doral Growth
(73%)
Doral Recovery
(27%)
Loan Portfolio
$ MM
Loan Category
Growth
Recovery
Total
Residential
$2,260
$1,071
$3,331
CRE
701
477
1,178
C&I
1,527
111
1,638
Construction & Land
448
136
584
Consumer / Other
20
-
20
Total
$4,956
$1,795
$6,751 |
 5
Doral Operating Segments
Two Operating Segments: Profitable, High Margin Bank & Special Servicing
Group Puerto Rico Mortgage & Retail Banking
o
$2.2B Residential Mortgage Portfolio
o
#2 Mortgage Originator in Puerto Rico
o
A $11.2B Mortgage Servicer
o
$1.6B of deposits
US Commercial & Retail Banking
o
$2.7B
High NIM Specialty Commercial Lender
o
8 branches with $1.5B of deposits
61% of Loans are Performing.
$1.1B of Puerto Rico Residential Mortgages
o
TDRs and Defaulted Loans (180 days past due)
o
63% of loans are Performing
$0.7B of Puerto Rico Commercial Loans
o
CRE, Small Business and Construction & Land
o
58% of loans are Performing
$0.1B of OREO & Other
Puerto Rico Loans
(33%)
US Loans
(40%)
PR OREO & Other
(7%)
Cash & Securities
(16%)
PR Commercial
(38%)
PR Residential Mortgage
(59%)
Taxes & Other
(11%)
Doral Growth: Profitable Mortgage & Commercial Bank
Doral Recovery: Puerto Rico Special Servicing Portfolio
|
 Q3
Results Net Loss ($MM)
3Q ’13
Net Interest Income
$57.6
Non Interest Income
18.7
Total Net Revenue
76.3
Non-Interest Expense
68.4
Pre-Tax, Pre-Provision Income
7.9
Credit Provision
16.4
Pre-Tax Income
(8.5)
Tax Expense (Benefit)
(1.0)
Reported Net Loss
$(7.5)
Ratios:
NIM (bps)
303
Average Assets
$8,532
Improved Net Loss by $3MM vs. Q2’13
NIM returned to above 300 bps
Slow mortgage market continues to weigh on Non-
Interest Income
Significant improvement in Non-Interest Expense.
Credit Provisions largely driven by changes in
asset values / re-appraisals:
Tax Benefit reflects changes to the legislation in
PR.
(Tax rate increased from 30% to 39%, positively
impacting the Deferred Tax Assets)
6
$MM
Growth
Recovery
Total
Residential
$1.7
$9.3
$11.0
Commercial
$1.5
$3.9
$5.4
Total
$3.2
$13.2
$16.4
o
$144MM of production in Q3, 30% lower than Q2
o
Continue to see strong gains on sale (average 3.76%)
o
Fair Value Assets showed stability during the quarter.
|
 Overview
Doral Growth
7
Segment
Results
1
Doral Growth generated $12MM in Pre-Tax Income
NIM remained strong at 325 bps
Non-Interest Income continues to suffer from a soft
mortgage market in Puerto Rico
Non-Interest Expense includes $3MM benefit related
to a PR housing tax credit
Continued strong US growth
($MM)
3Q 13
Net Interest Income
$47.0
Non Interest Income
18.7
Total Net Revenue
65.7
Non-Interest Expense
50.5
Pre-Tax, Pre-Provision Income
15.2
Credit Provision
3.2
Pre-Tax Income
$12.0
Ratios:
NIM (bps)
325
Efficiency Ratio
77%
Average Assets
$6,647
Pre-Tax ROAA
0.7%
Loan Portfolio
$ MM
Loan Category
PR
US
Total
Residential
$2,249
$11
$2,260
CRE
-
701
701
C&I
13
1,514
1,527
Construction & Land
-
448
448
Consumer / Other
20
-
20
Total
$2,281
$2,675
$4,956
1
Includes Allocation of Administrative Expenses ( Corporate and Treasury)
--
for additional details see exhibit B)
o
o
Loan originations of $439MM driving loans to $2.7B
Retail deposits grew by $250MM to $1.5B |
 Segment
Results
1
Doral Recovery
8
($MM)
3Q 13
Net Interest Income
$10.6
Non Interest Income
0.0
Total Net Revenue
10.6
Non-Interest Expense
17.9
Pre-Tax, Pre-Provision Income
(7.3)
Credit Provision
13.2
Pre-Tax Income
$(20.5)
Ratios:
NIM (bps)
232
Average Assets
$1,884
Non-Performing Loans
$649
NPL %
38.7%
Overview
Net Loss improved by $2M versus Q2
Commercial NPAs fell by $20MM
61% of Recovery Loans are Performing
o
63% of Residential loans are performing
o
58% of Commercial loans are performing
$ MM
Loan Category
Total
NPL
% NPL
Residential
$996.2
$365.3
36.6%
Commercial Real Estate
434.9
184.2
42.3%
Commercial
111.3
3.4
3.0%
Land & Construction
135.6
96.5
71.2%
Total
$1,678.0
$649.4
38.7%
2
Excludes Loans HFS
1
Includes Allocation of Administrative Expenses ( Corporate and Treasury)
--
for additional details see exhibit B)
Loan
Portfolio
2 |
 Asset
Quality 9
1
Excludes Loans Held for Sale & FHA / VA Loans
2
UPB-
Partial Charge Offs
3
Adjusted Coverage ratio, (ALLL+Partial Charge Offs)/UPB
NPAs down $2MM; Recovery efforts driving continued reduction in Commercial NPAs
NPL: Adjusted Coverage Ratios
1
$ MM
UPB
Partial Charge-Offs,
Deferred Fees and
Discounts
Recorded
Investment
2
ALLL
ALLL + Partial
Charge-Offs
Adjusted
Coverage
Ratio
3
Residential
508.3
77.3
431.0
80.5
157.8
31.0%
Commercial
415.4
128.9
286.5
32.8
161.7
38.9%
Total
$923.7
$206.2
$717.4
$113.3
$319.5
34.6%
NPL Adjusted Coverage Ratio maintained at 35%
NPL & NPA: Q2 vs. Q3
NPL
NPA
$ MM
Q2
Q3
Change
Q2
Q3
Change
Residential
409.7
431.0
21.3
527.1
544.4
17.3
Commercial
303.7
286.5
(17.2)
350.4
330.9
(19.5)
Total
$713.4
$717.4
$4.1
$877.5
$875.3
$(2.2)
1 |
 10
Executive Summary
Third Quarter demonstrated improved financial performance
US platform continues profitable growth –
now represents 40% of loans and 47% of retail
deposits
Opportunity for further NIM expansion as ~$500MM of liabilities with an average cost
of 2.6% mature over the next six months.
Capital ratios remain in excess of regulatory requirements
Doral Growth delivered $12MM of profits -- earnings are up $5MM from Q2
Doral Recovery continues to deliver strong results -- earnings are up while NPAs
are down |
 Investor Relations Contact and Conference Replay Details
11
Investor Relations:
Christopher Poulton –
Executive Vice President
212 / 329-3794
christopher.poulton@doralfinancial.com
Media:
Lucienne Gigante –
SVP Public Relations
787 / 474-6298
lucienne.gigante@doralbank.com
Conference Call:
2.00 PM EST November 5, 2013
(800) 230-1093 or (612) 288-0329
Conference Call Replay:
November 5, 2013 –
December 5, 2013
(800) 475-6701 or (320) 365-3844
Replay Code: 306281 |
 Exhibits |
 Exhibit A –
Financial Summary
13
($ MM)
30-Sep-13
30-June-13
31-Mar-13
31-Dec-12
30-Sep-12
Income Statement
Net Interest Income
57.6
50.5
60.7
56.8
56.2
Provision for Credit Losses
16.4
5.5
18.7
21.3
34.4
NII After Provisions
41.2
45.0
42.0
35.5
21.8
Non-Interest Income
18.6
16.8
24.4
29.1
19.7
Non-Interest Expense
68.4
73.9
74.9
86.5
73.5
Pre-Tax Income
(8.5)
(12.1)
(8.5)
(21.9)
(32.0)
Taxes
(1.0)
(1.8)
3.9
(50.2)
0.5
Net Income
(7.5)
(10.4)
(12.4)
28.3
(32.5)
Pre-Tax Pre-Provision Income
7.9
(6.6)
10.2
(0.6)
2.4
Balance Sheet
Total Gross Loans (incl. HFS)
$6,751
$6,705
$6,614
$6,613
$6,611
Loan Loss Reserves
113
112
125
135
146
Total Deposits
4,980
4,972
4,783
4,629
4,614
Total Assets
8,570
8,521
8,369
8,479
8,371
Profitability Metrics
Net Interest Margin
3.03%
2.70%
3.31%
2.97%
2.95%
Capital & Credit Ratios
NPL / Loans
11.1%
11.6%
12.6%
12.2%
11.5%
Leverage Ratio
8.67%
8.98%
9.26%
9.39%
9.32%
1
Excludes
Loans
Held
for
Sale
and
Residential
loans
guaranteed
by
FHA
/
VA
1 |
 14
($ MM)
PR
US
Doral Growth
1
Recovery
Corporate
Treasury
Total
Income Statement
Net Interest Income
$21.0
$26.5
$47.5
$10.6
$(0.1)
$(0.4)
$57.6
Non-Interest Income
17.4
1.4
18.8
0.0
0.0
(0.1)
18.6
Total Net Revenue
38.4
27.9
66.3
10.6
(0.1)
(0.5)
76.3
Non-Interest Expense
29.4
13.3
42.7
16.7
7.9
1.2
68.4
Pre-Tax , Pre Provision Income
9.0
14.6
23.6
(6.0)
(8.0)
(1.7)
7.9
Credit Provision
1.6
1.5
3.2
13.1
0.0
0.0
16.4
Pre-Tax Income
$7.4
$13.1
$20.4
$(19.3)
$(8.0)
$(1.7)
$(8.5)
Allocation of Corporate & Treasury
Adjusted Revenue
(0.6)
0.0
0.1
0.5
0.0
Adjusted Non Interest Expense
7.9
1.2
(7.9)
(1.2)
0.0
Adjusted Pre-Tax Income
$11.9
$(20.4)
$0.0
$0.0
$(8.5)
Exhibit B –
Segment Reconciliation
1
Doral Growth is the sum of PR and US Segments |