Attached files
| file | filename |
|---|---|
| EX-99.1 - EX-99.1 - ADVENT SOFTWARE INC /DE/ | a13-22969_1ex99d1.htm |
| 8-K - 8-K - ADVENT SOFTWARE INC /DE/ | a13-22969_18k.htm |
|
|
Exhibit 99.2 Advent Software, Inc. Third Quarter 2013 Earnings Highlights October 28, 2013 Advent Investor Relations Contact: InvestorRelations@advent.com |

|
|
ADVS Forward-Looking Statements The financial projections under Financial Guidance and any other forward-looking statements included in this presentation reflect management's best judgment based on factors currently known and involve risks and uncertainties; our actual results may differ materially from those discussed here. These risks and uncertainties include: potential fluctuations in new contract bookings, renewal rates, operating results and future growth rates; continued market acceptance of our products; the successful development, release and market acceptance of new products and product enhancements; uncertainties and fluctuations in the financial markets; the Company’s ability to satisfy contractual performance requirements objectives and other risks detailed from time to time in our SEC reports including, but not limited to, our quarterly reports on Form 10-Q and our 2012 Annual Report on Form 10-K. The Company disclaims any intention or obligation to publicly update or revise any forward-looking statements including any guidance, whether as a result of events or circumstances after the date hereof or to reflect the occurrence of unanticipated events. Advent, the Advent logo, Advent Software, Geneva, and Tamale RMS are registered trademarks of Advent Software, Inc. Any other company names or marks mentioned herein are those of their respective owners. 1 |

|
|
ADVS Q313 Highlights Annual Contract Value (ACV) from term license Advent license, OnDemand, and Black Diamond contracts was $7.1M for Q3; YTD was $22.4M, increase of 3% over prior year Quarterly revenue of $96 8M; 7% increase over prior year 96.8M; 18% of revenue was from international sources 91% of revenue was categorized as recurring Non-GAAP Operating Income of $29 0M or 30 0% of revenue; increase Non 29.0M, 30.0% of 39% compared to $20.8M in prior year Non-GAAP EPS of $0.31; increase of 22% over prior year Adjusted EBITDA of $31.6M; increase of 27.5% versus prior year Operating cash flows of $22.8M; YTD was $61.9M, increase of 15% over prior year Q1 updated renewal rate of 97%; increase of 3 points over the initially reported rate Q2 initially reported renewal rate of 92%; increase of 5 points over © 2013 Advent Software, Inc. Advent Confidential Q y p ; p prior year 3 |

|
|
ADVS Q313 Financial Highlights Metric Q312 Q313 $ +/- % +/- Annual Contract Value ($M) $7.1 $7.1 ($0.1) (1%) M) $90 2 $96 8 $6 6 7% Revenue ($90.2 96.8 6.6 Operating Cash Flow ($M) $25.3 $22.8 ($2.4) (10%) GAAP Operating Margin 14.0% 18.0% 4.0pts 28% GAAP Diluted EPS $0.15 $0.18 $0.04 24% Non-GAAP Operating Margin1 23.1% 30.0% 6.9pts 30% Adjusted EBITDA ($M) $24.8 $31.6 $6.8 28% Non-GAAP Diluted EPS1 $0.26 $0.31 $0.06 22% 1 See reconciliation of GAAP to Non-GAAP measures on slide #10 © 2013 Advent Software, Inc. Advent Confidential * Totals, $+/- and % +/ - may not recalculate due to rounding 4 |

|
|
$35 $33 ADVS Renewal Rates & Annual Contract Value ($ in millions) 120% Renewal Rates Annual Contract Value $11 $30 93% 95% 94% 94% 92% 97% 94% 98% 96% 92% 98% 95% 97% 100% $ 7 $7 $20 $25 $22 YTD 92% 91% 87% 91% 80% $7 $7 $ 10 $15 40% 60% $7 $9 $5 20% $- 2012 2013 YTD Q1 Q2 Q3 Q4 0% Q2 11 Q3 11 Q4 11 Q1 12 Q2 12 Q3 12 Q4 12 Q1 13 Q2 13 Initially reported renewal/run rate Subsequently updated © 2013 Advent Software, Inc. Advent Confidential * Totals, $+/- and % +/- may not recalculate due to rounding 5 renewal/run rate |

|
|
ADVS Revenue ($ in millions) $400 $326 $359 18% Q3 Revenue Breakdown by Region $90 $97 $66 $76 $86 $92 $300 $260 $284 $285 YTD 82% Domestic International $90 $96 $64 $72 $85 $200 Q3 Revenue Breakdown by Type $ 66 $67 $75 $87 $92 $63 $69 $80 $100 9% Recurring Non-recurring $- 2009 2010 2011 2012 2013 YTD Q1 Revenue Q2 Revenue Q3 Revenue Q4 Revenue 91% © 2013 Advent Software, Inc. Advent Confidential * Totals, $+/- and % +/ - may not recalculate due to rounding 6 |

|
|
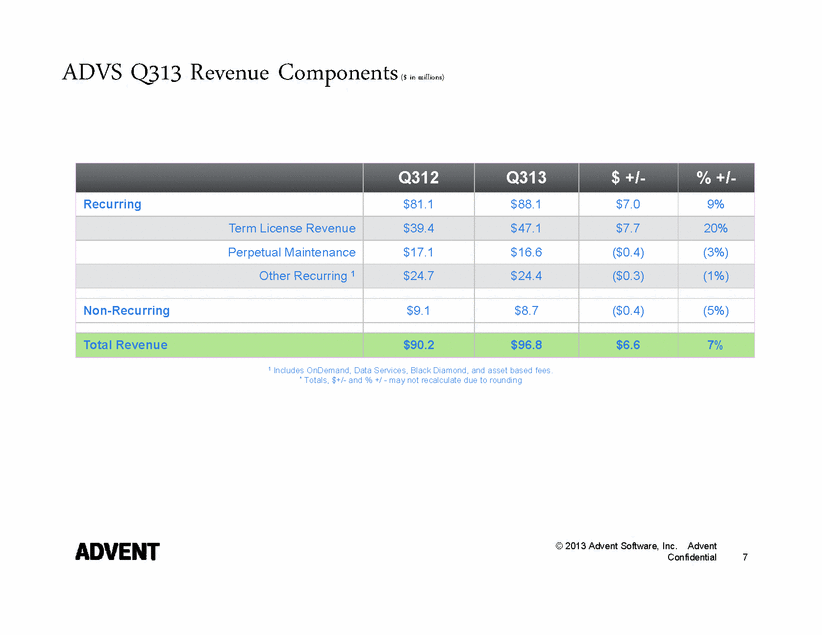
ADVS Q313 Revenue Components($ in millions) Q312 Q313 $ +/- % +/- Recurring $81.1 $88.1 $7.0 9% Term License Revenue $39.4 $47.1 $7.7 20% Perpetual Maintenance $17.1 $16.6 ($0.4) (3%) 1 $24 7 $24 4 ($0 3) (1%) Other Recurring 24.7 24.4 0.3) Non-Recurring $9.1 $8.7 ($0.4) (5%) Total Revenue $90.2 $96.8 $6.6 7% 1 Includes OnDemand, Data Services, Black Diamond, and asset based fees. * Totals, $+/- and % +/ - may not recalculate due to rounding © 2013 Advent Software, Inc. Advent Confidential 7 |
|
|
$200 ADVS Deferred Revenue and Backlog ($ in millions) $200 Deferred Revenue $146 $154 $175 $183 $173 $160 $180 $18 $20 $18 $160 $180 $162 $183 $173 $100 $127 $133 $129 $100 $120 $140 $73 $95 $85 $120 $140 $60 $80 $60 $80 $100 $20 $40 $33 $32 $31 $38 $36 $39 $20 $40 $- 12/31/09 12/31/10 12/31/11 12/31/12 9/30/13 Deferred Revenue Backlog $- 9/30/12 12/31/12 9/30/13 Perpetual License/Maintenance Deferred Revenue Term Implementations Deferred Revenue Term License Deferred Revenue Other Recurring Deferred Revenue © 2013 Advent Software, Inc. Advent Confidential Deferred revenue represents invoiced bookings, not yet recognized as revenue Backlog represents contractual bookings, not yet invoiced (disclosed annually) 8 |

|
|
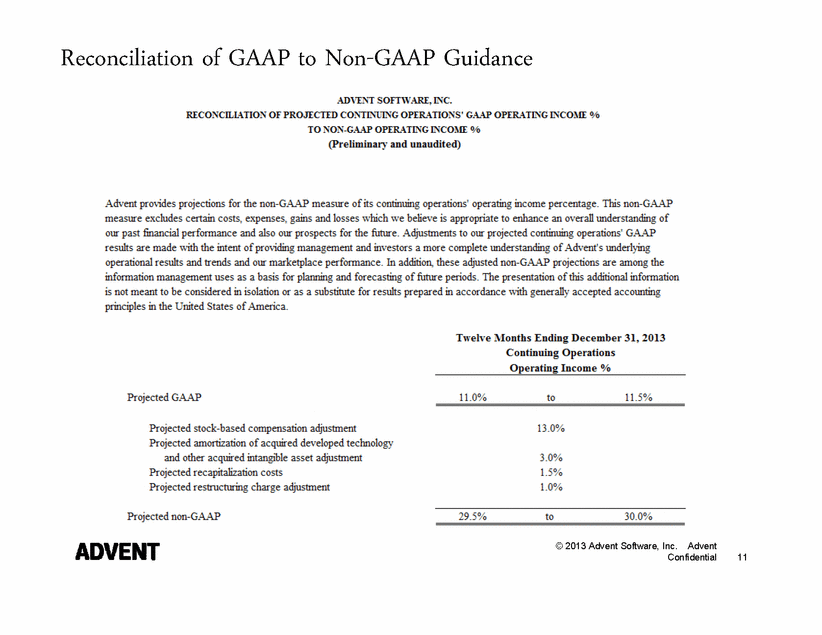
ADVS 2013 Guidance Guidance Q413 FY13 Operating Measures: Total Revenue ($M) $95M - $97M $380M - $382M YoY Revenue Growth 3% - 5% 6% GAAP Operating Margin 11.0% - 11.5% Stock Compensation Expense (% of revenue) 13.0% Amortization (% of revenue) 3.0% Recapitalization Costs (% of revenue) 1.5% Restructuring Charge (% of revenue) 1.0% Non-GAAP Operating Margin * 29.5% - 30.0% Tax and Cash Measures: Effective Tax Rate (GAAP) 25% – 30% Effective Tax Rate (Non-GAAP) 35% Operating Flow ($$93M - $97M © 2013 Advent Software, Inc. Advent Confidential Cash M) Capital Expenditures, incl. cap’d SW devel. ($M) $8M - $10M *See reconciliation of GAAP to Non-GAAP guidance on slide #11 9 |

|
|
Q313 Reconciliation of GAAP to Non-GAAP 2 Amount % of Net Revenues Amount % of Net Revenues GAAP gross margin 64,976 $ 67.1% 57,361 $ 63.6% Amortization of acquired intangibles 1,883 1,894 Stock-based compensation 1,431 946 Non-GAAP gross margin 68,290 $ 70.6% 60,201 $ 66.8% GAAP operating income 17,371 $ 18.0% 12,629 $ 14.0% Amortization of acquired intangibles 2,836 2,849 Stock-based compensation 8,391 5,371 Restructuring benefit (157) (17) Recapitalization costs - - Transaction related fees 565 - Non-GAAP operating income 29,006 $ 30.0% 20,832 $ 23.1% GAAP net income 9,833 $ 7,687 $ Amortization of acquired intangibles 2,836 2,849 Stock-based compensation 8,391 5,371 Restructuring benefit (157) (17) Recapitalization costs - - Transaction related fees 565 - Income tax adjustment (1) (4,549) (2,434) Non-GAAP net income 16,919 $ 13,456 $ GAAP net income 9,833 $ 7,687 $ Net interest 2,631 422 Provision for income taxes 4,561 4,812 Depreciation expense 2,771 2,980 Amortization expense 3,461 3,541 Stock-based compensation 8,391 5,371 Adjusted EBITDA 31,648 $ 24,813 $ Diluted net income per share GAAP 0.18 $ 0.15 $ Non-GAAP 0.31 $ 0.26 $ Shares used to compute diluted net income per share 53,937 52,248 (1) The estimated non-GAAP effective tax rate was 35% for the three months ended September 30, 2013 and 2012, respectively, and has been used to adjust the provision for income taxes for non-GAAP net income and non-GAAP diluted net income per share purposes. 2013 2012 ADVENT SOFTWARE, INC. RECONCILIATION OF SELECTED CONTINUING OPERATIONS' GAAP MEASURES TO NON-GAAP MEASURES (In thousands, except per share data) (Unaudited) To supplement our condensed consolidated financial statements presented in accordance with generally accepted accounting principles in the United States of America (or GAAP), Advent uses non-GAAP measures of continuing operations' gross margin, operating income, net income and net income per share, which are adjusted to exclude certain costs, expenses, income, gains and losses we believe appropriate to enhance an overall understanding of our past financial performance and also our prospects for the future. These adjustments to our current period GAAP results are made with the intent of providing both management and investors a more complete understanding of Advent’s underlying operational results and trends and our marketplace performance. In addition, these non-GAAP results are among the information management uses as a basis for our planning and forecasting of future periods. The presentation of this additional information is not meant to be considered in isolation or as a substitute for results prepared in accordance with GAAP. Three Months Ended September 30 |

|
|
Reconciliation of GAAP to Non-GAAP Guidance © 2013 Advent Software, Inc. Advent Confidential 11 |