Attached files
| file | filename |
|---|---|
| 8-K - FORM 8_K - BRINKS CO | form_8k.htm |
| EX-99.1 - EXHIBIT 99.1 - BRINKS CO | exhibit_99-1.htm |

The Brink’s Company
Third-Quarter 2013 Earnings
Conference Call
NYSE:BCO
October 24, 2013
Exhibit 99.2

Forward-Looking Statements
These materials contain forward-looking statements. Actual
results could differ materially from projected or estimated
results. Information regarding factors that could cause such
differences is available in today's release and in The Brink’s
Company’s most recent SEC filings.
results could differ materially from projected or estimated
results. Information regarding factors that could cause such
differences is available in today's release and in The Brink’s
Company’s most recent SEC filings.
Information discussed today is representative as of today
only and Brink's assumes no obligation to update any
forward-looking statements. These materials are
copyrighted and may not be used without written permission
from Brink's.
only and Brink's assumes no obligation to update any
forward-looking statements. These materials are
copyrighted and may not be used without written permission
from Brink's.
2

The Brink’s Company
Ed Cunningham
Director - Investor Relations

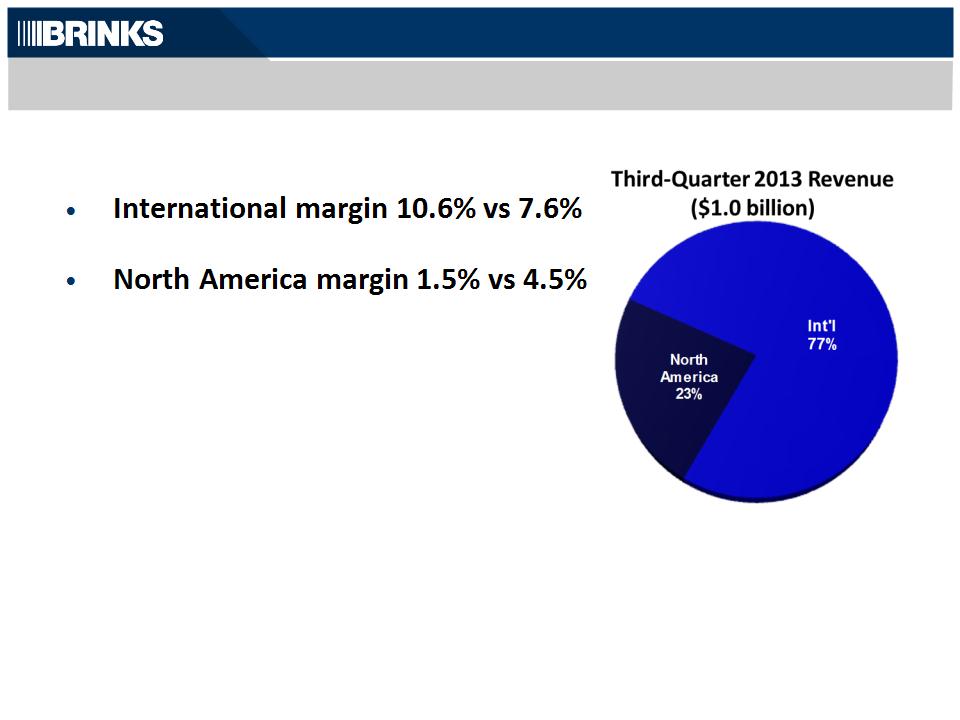
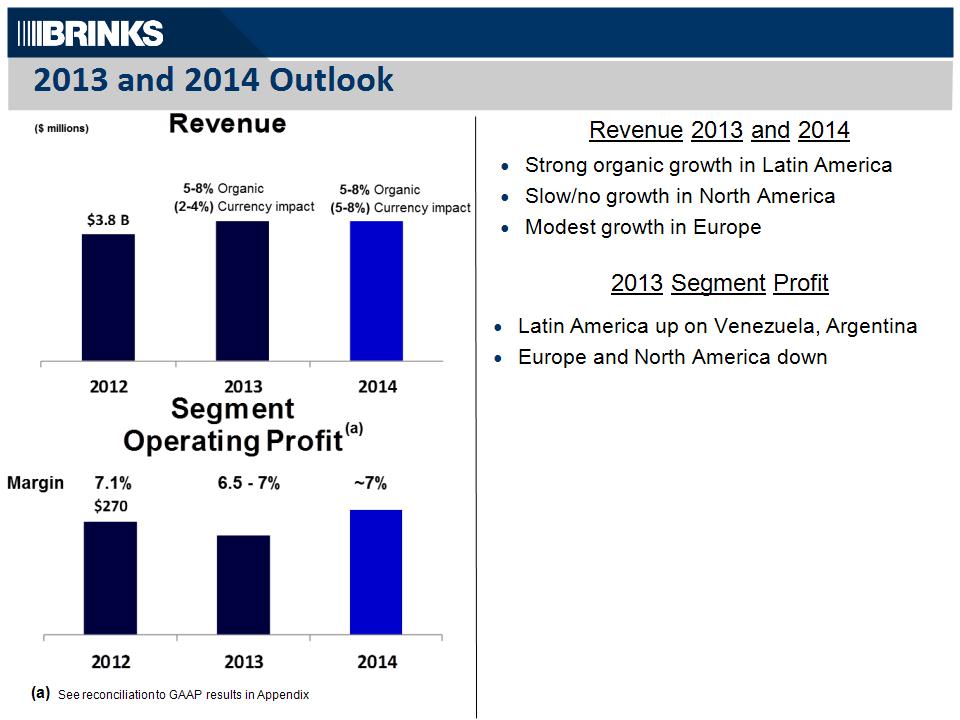
Highlights of Third-Quarter Results
GAAP EPS $.63 vs $.44
Non-GAAP Summary:
• EPS $.69 vs $.58
• Segment margin 8.5% vs 6.8%
• Revenue up 6% (9% organic growth)
Note: See reconciliation to GAAP results in Appendix
4

The Brink’s Company
Tom Schievelbein
Chairman, President and
Chief Executive Officer
CEO Overview
• Third Quarter
• Full-Year Segment Margin Outlook
• 6.5% to 7% in 2013
• ~ 7% in 2014
6
International Operations
• Latin America Profit Growth
• Driven primarily by Venezuela
• Mexico improvement on track
• Europe - profits flat
• Asia-Pacific - continued improvement
7
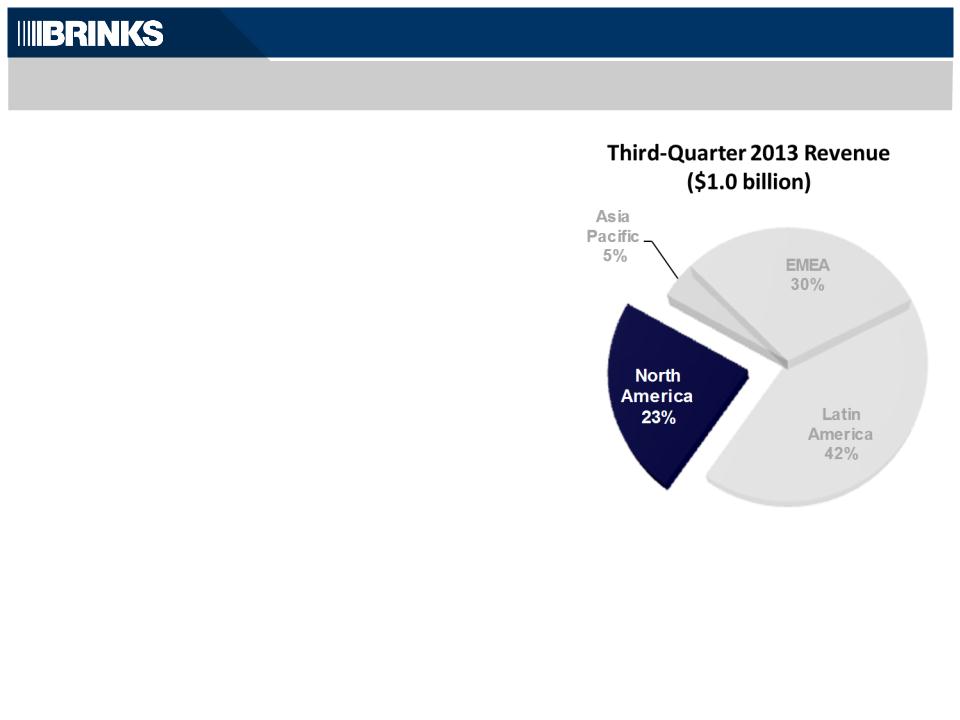
North America Plans
• Reduce Labor and SG&A
• Increase performing branches in the
U.S.
U.S.
• Change revenue mix
• Strengthen management team
8
North America
9
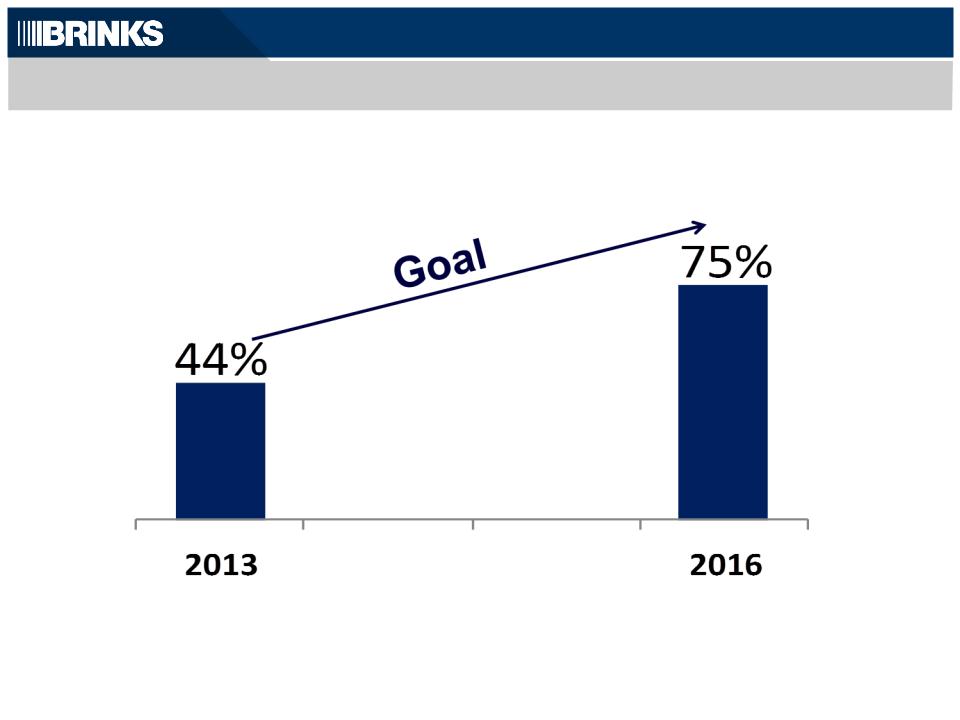
Performing Branches in U.S.
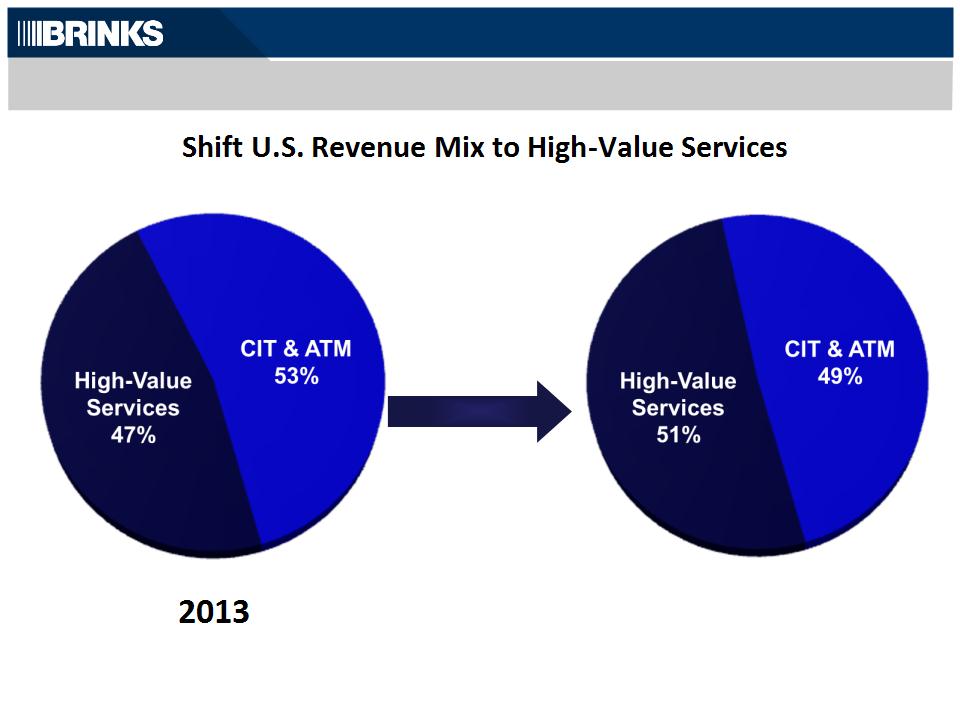
CEO Overview
2016 Goal
10
Note: High-Value Services includes Global Services and Cash Management Services. Cash Management Services includes money
processing, vaulting, ATM management and CompuSafe® Service.
processing, vaulting, ATM management and CompuSafe® Service.

The Brink’s Company
Tom Schievelbein
Chairman, President and
Chief Executive Officer

The Brink’s Company
Joe Dziedzic
Vice President and Chief
Financial Officer
Financial Officer
Review and Outlook
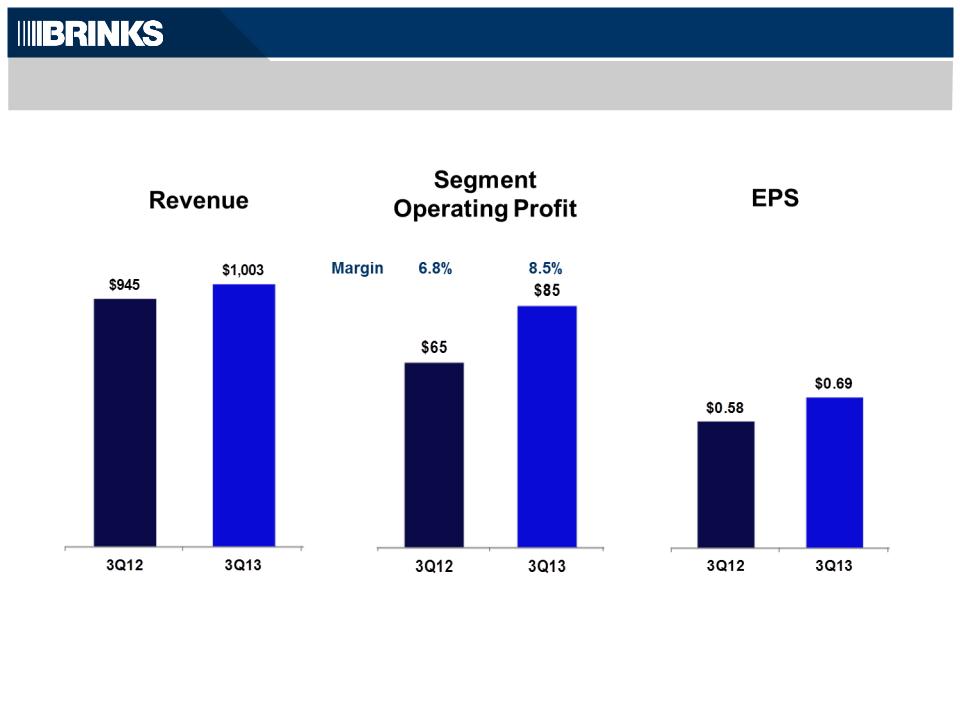
3Q13 Non-GAAP Results
($ millions, except EPS)
Note: See reconciliation to GAAP results in Appendix
13
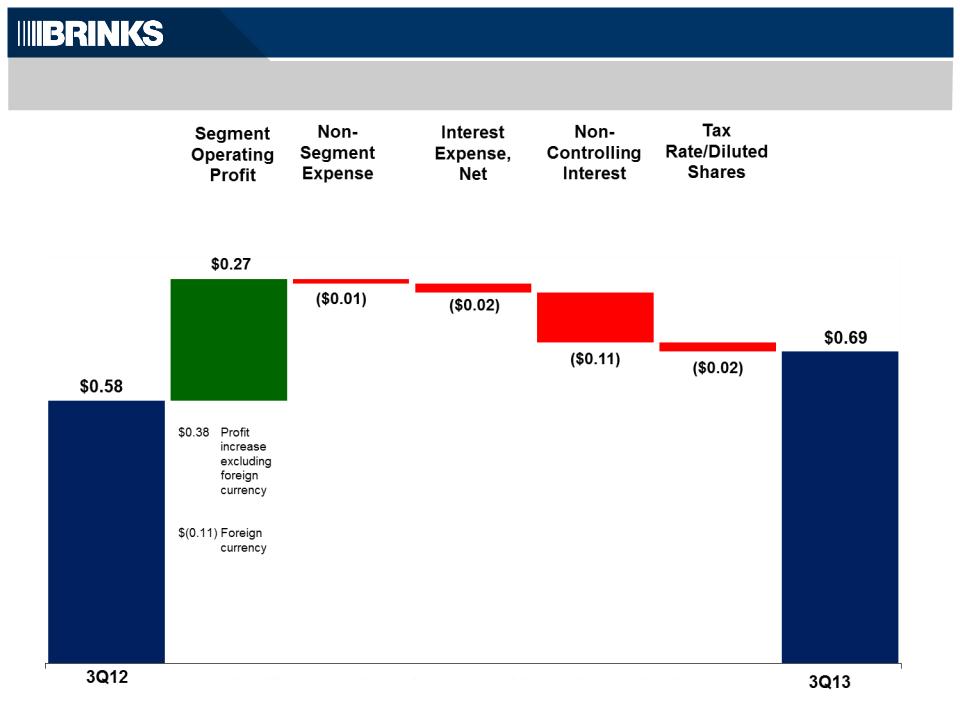
Non-GAAP EPS: 3Q12 Versus 3Q13
14
Note: See reconciliation to GAAP results in Appendix
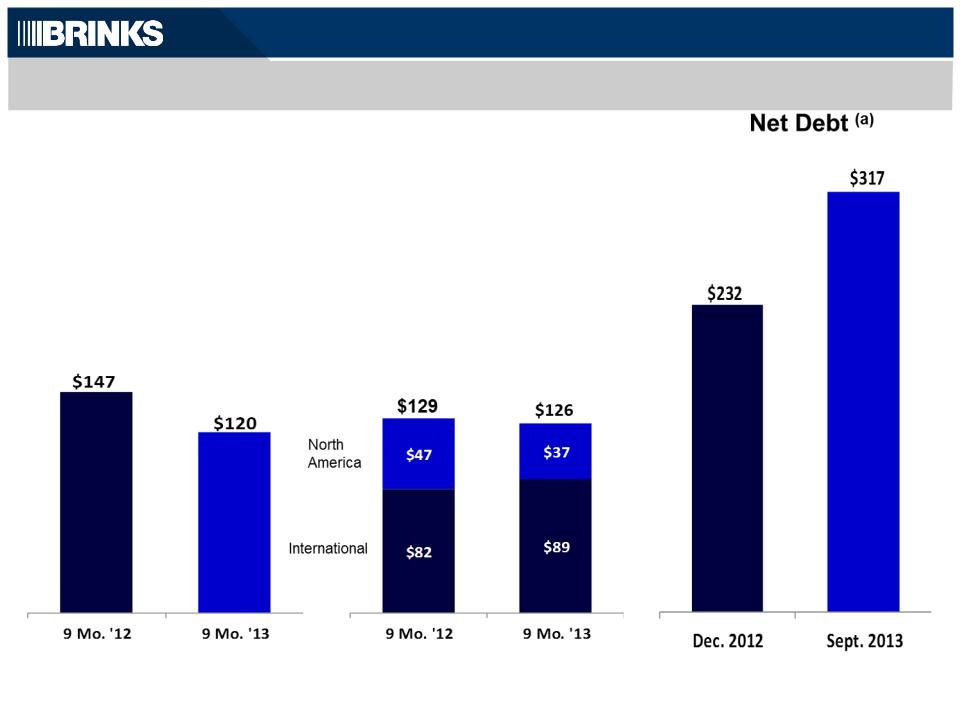
Non-GAAP Cash Flow, Capital Investment and Net Debt
15
($ millions)
(a) See reconciliation to GAAP results in Appendix
(b) From continuing operations
15
Capital
Expenditures
and Capital
Leases(b)
Expenditures
and Capital
Leases(b)
Non-GAAP
CFOA(a) (b)
CFOA(a) (b)
Capital Deployment
— Future pension contributions in cash
— 2013 Capital Expenditures/Leases flat to
2012
2012
— Margin expansion offset by projected
devaluation in Venezuela
devaluation in Venezuela
2014 Segment Profit
16

The Brink’s Company
Third-Quarter 2013 Earnings
Conference Call
NYSE:BCO
October 24, 2013

Appendix
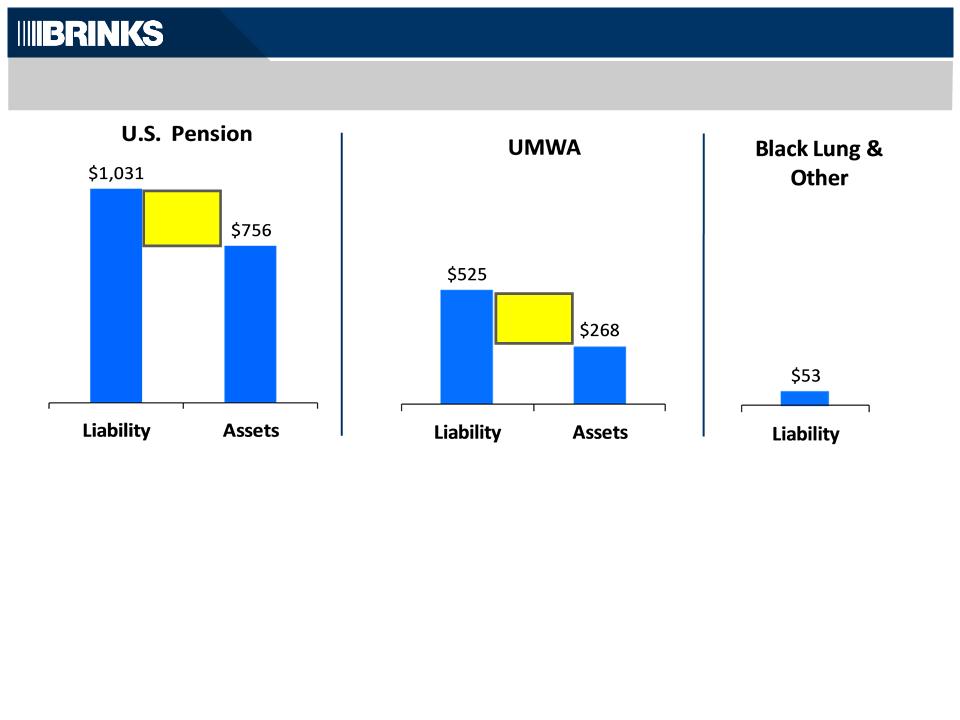
Legacy Liabilities at December 31, 2012
|
|
Estimated Contributions to U.S. Plans
|
|
||||||||||||
|
|
|
2012A
|
2013
|
2014
|
2015
|
2016
|
2017
|
|||||||
|
|
US Pension
|
$ 37
|
|
14
|
|
29
|
|
42
|
|
44
|
|
38
|
|
|
|
|
UMWA
|
0
|
|
0
|
|
0
|
|
0
|
|
0
|
|
0
|
|
|
|
|
Black Lung/Other
|
7
|
|
7
|
|
5
|
|
5
|
|
4
|
|
4
|
|
|
|
|
Total
|
$ 44
|
|
21
|
|
34
|
|
46
|
|
49
|
|
42
|
|
|
($ millions)
$275
Under-
funding
Under-
funding
Under-
funding
funding
$257
Note: Above amounts based on actuarial assumptions at December 31, 2012. If rates had been 1% higher at December 31,
2012, our U.S. pension plan & UMWA liabilities would have been $125 million and $51 million lower, respectively. See
page 62 of the Company’s 2012 Annual Report on form 10-K.
2012, our U.S. pension plan & UMWA liabilities would have been $125 million and $51 million lower, respectively. See
page 62 of the Company’s 2012 Annual Report on form 10-K.
19
3Q13 Non-GAAP Segment Results
Revenue
Segment Operating Profit
— 9% organic growth, 3% unfavorable
currency impact
currency impact
— 12% organic growth in International
— North America flat
— International up $28
— North America down $7
— Unfavorable currency impact of $8
20

Appendix
Non-GAAP Reconciliations
Non-GAAP Reconciliations

(a) To eliminate:
• $1.1 million adjustment in the first quarter of 2013 to the amount of gain recognized on a 2010 business acquisition in Mexico as a result of a favorable
adjustment to the purchase price received in the first quarter of 2013.
• $0.9 million of adjustments in the third quarter of 2013 primarily related to a January 2013 acquisition of Rede Trel in Brazil.
(b) To eliminate currency exchange losses related to a 16% devaluation of the official exchange rate in Venezuela from 5.3 to 6.3 bolivar fuertes to the U.S. dollar in
February 2013.
February 2013.
(c) To eliminate employee benefit settlement losses in Mexico.
(d) To eliminate expenses related to U.S. retirement plans.
(e) To adjust effective income tax rate in the interim period to be equal to the midpoint of the estimated range of the full-year non-GAAP effective income tax rate. The
midpoint of the estimated range of the full-year non-GAAP effective tax rate for 2013 is 37.5%.
midpoint of the estimated range of the full-year non-GAAP effective tax rate for 2013 is 37.5%.
GAAP
Basis
Basis
Gains & Losses on
Acquisitions and
Dispositions (a)
Acquisitions and
Dispositions (a)
Net Monetary Asset
Remeasurement Losses
in Venezuela (b)
Remeasurement Losses
in Venezuela (b)
Employee Benefit
Settlement
Losses (c)
Settlement
Losses (c)
U.S. Retirement
Plans (d)
Plans (d)
Adjust
Income Tax
Rate (e)
Income Tax
Rate (e)
Non-
GAAP
Basis
GAAP
Basis
Third Quarter 2013
Revenues:
Latin America
$
423.8
−
−
−
−
−
423.8
EMEA
301.2
−
−
−
−
−
301.2
Asia Pacific
43.5
−
−
−
−
−
43.5
International
768.5
−
−
−
−
−
768.5
North America
234.5
−
−
−
−
−
234.5
Revenues
$
1,003.0
−
−
−
−
−
1,003.0
Operating profit:
International
$
81.0
−
−
0.8
−
−
81.8
North America
0.7
−
−
−
2.9
−
3.6
Segment operating profit
81.7
−
−
0.8
2.9
−
85.4
Non-segment
(20.7)
(0.9)
−
−
10.3
−
(11.3)
Operating profit
$
61.0
(0.9)
−
0.8
13.2
−
74.1
Amounts attributable to Brink’s:
Income from continuing operations
$
31.1
(0.9)
−
0.6
7.7
(4.8)
33.7
Diluted EPS - continuing operations
0.63
(0.02)
−
0.01
0.16
(0.10)
0.69
Non-GAAP Reconciliations - 3Q13
Amounts may not add due to rounding.
22

Non-GAAP Reconciliations - Nine Months 2013
Amounts may not add due to rounding. See page 22 for notes.
23
GAAP
Basis
Basis
Gains & Losses on
Acquisitions and
Dispositions (a)
Acquisitions and
Dispositions (a)
Net Monetary Asset
Remeasurement Losses
in Venezuela (b)
Remeasurement Losses
in Venezuela (b)
Employee Benefit
Settlement
Losses (c)
Settlement
Losses (c)
U.S. Retirement
Plans (d)
Plans (d)
Adjust
Income Tax
Rate (e)
Income Tax
Rate (e)
Non-
GAAP
Basis
GAAP
Basis
Nine Months 2013
Revenues:
Latin America
$
1,250.3
−
−
−
−
−
1,250.3
EMEA
872.4
−
−
−
−
−
872.4
Asia Pacific
128.9
−
−
−
−
−
128.9
International
2,251.6
−
−
−
−
−
2,251.6
North America
708.8
−
−
−
−
−
708.8
Revenues
$
2,960.4
−
−
−
−
−
2,960.4
Operating profit:
International
$
166.5
−
13.4
1.6
−
−
181.5
North America
5.1
−
−
−
8.7
−
13.8
Segment operating profit
171.6
−
13.4
1.6
8.7
−
195.3
Non-segment
(59.3)
(2.0)
−
−
31.0
−
(30.3)
Operating profit
$
112.3
(2.0)
13.4
1.6
39.7
−
165.0
Amounts attributable to Brink’s:
Income from continuing operations
$
47.8
(2.0)
8.4
1.2
23.6
(6.4)
72.6
Diluted EPS - continuing operations
0.98
(0.04)
0.17
0.02
0.48
(0.13)
1.48

(a) To eliminate:
• Gains related to the sale of investments in mutual fund securities ($1.9 million in the first quarter and $0.5 million in the third quarter). Proceeds from the sales
were used to fund the settlement of pension obligations related to our former chief executive officer, and former chief administrative officer.
• Gains and losses related to business acquisitions and dispositions. A $0.9 million gain was recognized in the second quarter and a $0.1 million loss was
recognized in the third quarter. In the fourth quarter of 2012, tax expense included a benefit of $7.5 million related to a reduction in an income tax accrual
established as part of the 2010 acquisition of subsidiaries in Mexico, and pretax income included a $2.1 million favorable adjustment to the local profit sharing
accrual as a result of the change in tax expectation.
• Third-quarter gain on the sale of real estate in Venezuela ($7.2 million).
(b) To eliminate employee benefit settlement and acquisition-related severance losses (Mexico and Argentina). Employee termination benefits in Mexico are accounted for
under FASB ASC Topic 715, Compensation - Retirement Benefits.
under FASB ASC Topic 715, Compensation - Retirement Benefits.
(c) To eliminate expenses related to U.S. retirement plans.
(d) To eliminate tax benefit related to change in retiree health care funding strategy.
(e) To adjust effective income tax rate in the interim period to be equal to the full-year non-GAAP effective income tax rate. The full-year non-GAAP effective tax rate for
2012 was 36.2%.
2012 was 36.2%.
Non-GAAP Reconciliations - 3Q12
Amounts may not add due to rounding.
24
GAAP
Basis
Basis
Gains & Losses on
Acquisitions and
Dispositions (a)
Acquisitions and
Dispositions (a)
Employee Benefit
Settlement and
Severance Losses (b)
Settlement and
Severance Losses (b)
U.S. Retirement
Plans (c)
Plans (c)
Tax Benefit on
Change in Health
Care Funding
Strategy (d)
Change in Health
Care Funding
Strategy (d)
Adjust
Income Tax
Rate (e)
Income Tax
Rate (e)
Non-
GAAP
Basis
GAAP
Basis
Third Quarter 2012
Revenues:
Latin America
$
385.2
−
−
−
−
−
385.2
EMEA
286.0
−
−
−
−
−
286.0
Asia Pacific
39.1
−
−
−
−
−
39.1
International
710.3
−
−
−
−
−
710.3
North America
234.6
−
−
−
−
−
234.6
Revenues
$
944.9
−
−
−
−
−
944.9
Operating profit:
International
$
59.4
(7.2)
2.0
−
−
−
54.2
North America
8.3
−
−
2.2
−
−
10.5
Segment operating profit
67.7
(7.2)
2.0
2.2
−
−
64.7
Non-segment
(22.0)
0.1
−
11.5
−
−
(10.4)
Operating profit
$
45.7
(7.1)
2.0
13.7
−
−
54.3
Amounts attributable to Brink’s:
Income from continuing operations
$
21.3
(3.0)
1.4
8.2
−
0.3
28.2
Diluted EPS - continuing operations
0.44
(0.06)
0.03
0.17
−
0.01
0.58

Non-GAAP Reconciliations - Nine Months 2012
Amounts may not add due to rounding. See page 24 for notes.
25
GAAP
Basis
Basis
Gains & Losses on
Acquisitions and
Dispositions (a)
Acquisitions and
Dispositions (a)
Employee Benefit
Settlement and
Severance Losses (b)
Settlement and
Severance Losses (b)
U.S. Retirement
Plans (c)
Plans (c)
Tax Benefit on
Change in Health
Care Funding
Strategy (d)
Change in Health
Care Funding
Strategy (d)
Adjust
Income Tax
Rate (e)
Income Tax
Rate (e)
Non-
GAAP
Basis
GAAP
Basis
Nine Months 2012
Revenues:
Latin America
$
1,147.4
−
−
−
−
−
1,147.4
EMEA
840.2
−
−
−
−
−
840.2
Asia Pacific
115.2
−
−
−
−
−
115.2
International
2,102.8
−
−
−
−
−
2,102.8
North America
708.6
−
−
−
−
−
708.6
Revenues
$
2,811.4
−
−
−
−
−
2,811.4
Operating profit:
International
$
168.0
(7.2)
3.1
−
−
−
163.9
North America
25.5
−
−
6.6
−
−
32.1
Segment operating profit
193.5
(7.2)
3.1
6.6
−
−
196.0
Non-segment
(67.6)
(0.8)
−
36.7
−
−
(31.7)
Operating profit
$
125.9
(8.0)
3.1
43.3
−
−
164.3
Amounts attributable to Brink’s:
Income from continuing operations
$
78.6
(5.1)
2.2
26.0
(20.9)
3.9
84.7
Diluted EPS - continuing operations
1.62
(0.10)
0.05
0.53
(0.43)
0.08
1.74

Non-GAAP Reconciliations - Full Year 2012
26
GAAP
Basis
Basis
Gains & Losses on
Acquisitions and
Dispositions (a)
Acquisitions and
Dispositions (a)
Employee Benefit
Settlement and
Severance Losses (b)
Settlement and
Severance Losses (b)
U.S. Retirement
Plans (c)
Plans (c)
Tax Benefit on
Change in Health
Care Funding
Strategy (d)
Change in Health
Care Funding
Strategy (d)
Adjust
Income Tax
Rate (e)
Income Tax
Rate (e)
Non-
GAAP
Basis
GAAP
Basis
Full Year 2012
Revenues:
Latin America
$
1,579.4
−
−
−
−
−
1,579.4
EMEA
1,125.9
−
−
−
−
−
1,125.9
Asia Pacific
158.9
−
−
−
−
−
158.9
International
2,864.2
−
−
−
−
−
2,864.2
North America
945.4
−
−
−
−
−
945.4
Revenues
$
3,809.6
−
−
−
−
−
3,809.6
Operating profit:
International
$
233.4
(8.5)
3.9
−
−
−
228.8
North America
32.5
−
−
8.8
−
−
41.3
Segment operating profit
265.9
(8.5)
3.9
8.8
−
−
270.1
Non-segment
(88.9)
(0.8)
−
47.4
−
−
(42.3)
Operating profit
$
177.0
(9.3)
3.9
56.2
−
−
227.8
Amounts attributable to Brink’s:
Income from continuing operations
$
113.0
(14.0)
2.8
33.8
(21.1)
−
114.5
Diluted EPS - continuing operations
2.32
(0.29)
0.06
0.70
(0.43)
−
2.36
Amounts may not add due to rounding. See page 24 for notes.

Non-GAAP Reconciliations - Cash Flows
(a) To eliminate the change in the balance of customer obligations related to cash received and processed in certain of our Cash Management
Services operations. The title to this cash transfers to us for a short period of time. The cash is generally credited to customers’accounts the
following day and we do not consider it as available for general corporate purposes in the management of our liquidity and capital resources.
(b) To eliminate cash flows related to our discontinued operations.
Non-GAAP cash flows from operating activities is a supplemental financial measure that is not required by, or presented in accordance with
GAAP. The purpose of the non-GAAP cash flows from operating activities is to report financial information excluding the impact of cash received
and processed in certain of our secure Cash Management Service operations and without cash flows from discontinued operations. Brink’s
believes these measures are helpful in assessing cash flows from operations, enable period-to-period comparability and are useful in predicting
future operating cash flows. Non-GAAP cash flows from operating activities should not be considered as an alternative to cash flows from
operating activities determined in accordance with GAAP and should be read in conjunction with our consolidated statements of cash flows.
|
NON-GAAP CASH FLOWS FROM OPERATING ACTIVITIES - RECONCILED TO AMOUNTS REPORTED UNDER U.S. GAAP
|
||||||
|
|
Nine Months
|
|||||
|
|
|
2013
|
|
|
2012
|
|
|
Cash flows from operating activities - GAAP
|
$
|
104.4
|
|
$
|
129.3
|
|
|
Decrease (increase) in certain customer obligations (a)
|
|
4.4
|
|
|
(0.2)
|
|
|
Cash outflows (inflows) related to discontinued operations (b)
|
|
10.9
|
|
|
17.7
|
|
|
|
|
|
|
|
|
|
|
|
Cash flows from operating activities - Non-GAAP
|
$
|
119.7
|
|
$
|
146.8
|
27
|
NET DEBT - RECONCILED TO U.S. GAAP
|
September 30,
|
|
December 31,
|
|||||
|
|
2013
|
|
2012
|
|||||
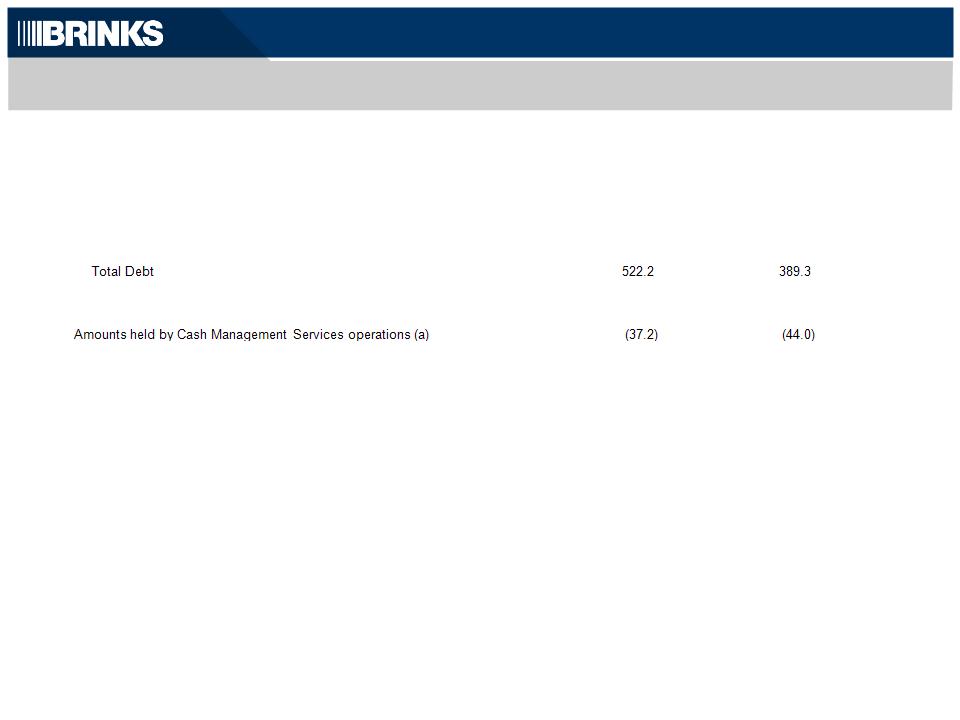
|
Debt:
|
|
|
|
|
|
|||
|
|
Short-term debt
|
|
$
|
76.5
|
|
26.7
|
||
|
|
Long-term debt
|
|
|
445.7
|
|
362.6
|
||
|
|
|
|
|
|
||||
|
Less:
|
|
|
|
|
|
|
||
|
Cash and cash equivalents
|
|
|
242.3
|
|
201.7
|
|||
|
|
|
|
||||||
|
|
|
|
Cash and cash equivalents available for general corporate purposes
|
|
|
205.1
|
|
157.7
|
|
|
|
|
|
|
|
|
|
|
|
|
|
Net Debt
|
|
$
|
317.1
|
|
231.6
|
|
(a) Title to cash received and processed in certain of our Cash Management Services operations transfers to us for a short period of time.
The cash is generally credited to customers’ accounts the following day and we do not consider it as available for general corporate
purposes in the management of our liquidity and capital resources and in our computation of Net Debt.
Net Debt is a supplemental financial measure that is not required by, or presented in accordance with GAAP. We use Net Debt as a measure of
our financial leverage. We believe that investors also may find Net Debt to be helpful in evaluating our financial leverage. Net Debt should not
be considered as an alternative to Debt determined in accordance with GAAP and should be reviewed in conjunction with our consolidated
balance sheets. Set forth above is a reconciliation of Net Debt, a non-GAAP financial measure, to Debt, which is the most directly comparable
financial measure calculated and reported in accordance with GAAP. Net Debt excluding cash and debt in Venezuelan operations was $402
million at September 30, 2013, and $280 million at December 31, 2012.
Non-GAAP Reconciliations - Net Debt
28