Attached files
| file | filename |
|---|---|
| EX-99.1 - EXHIBIT 99.1 - PLEXUS CORP | q4f13pressrelease.htm |
| 8-K - 8-K - PLEXUS CORP | a8-kcoverpageq4f13.htm |

FISCAL FOURTH QUARTER 2013 FINANCIAL RESULTS October 24, 2013

SAFE HARBOR & FAIR DISCLOSURE STATEMENT 2 Any statements made during our call today that are not historical in nature, such as statements in the future tense and statements that include "believe," "expect," "intend," "plan," "anticipate," and similar terms and concepts, are forward-looking statements. Forward- looking statements are not guarantees since there are inherent difficulties in predicting future results, and actual results could differ materially from those expressed or implied in the forward-looking statements. For a list of major factors that could cause actual results to differ materially from those projected, please refer to the Company’s periodic SEC filings, particularly the risk factors in our Form 10-K filing for the fiscal year ended September 29, 2012, and the Safe Harbor and Fair Disclosure statement in yesterday’s press release. The Company provides non-GAAP supplemental information. For example, our call today will reference return on invested capital and free cash flow. These non-GAAP financial measures are used for internal management assessments because they provide additional insight into ongoing financial performance and the metrics that are driving management decisions. For a full reconciliation of non-GAAP supplemental information please refer to yesterday’s press release and our periodic SEC filings.

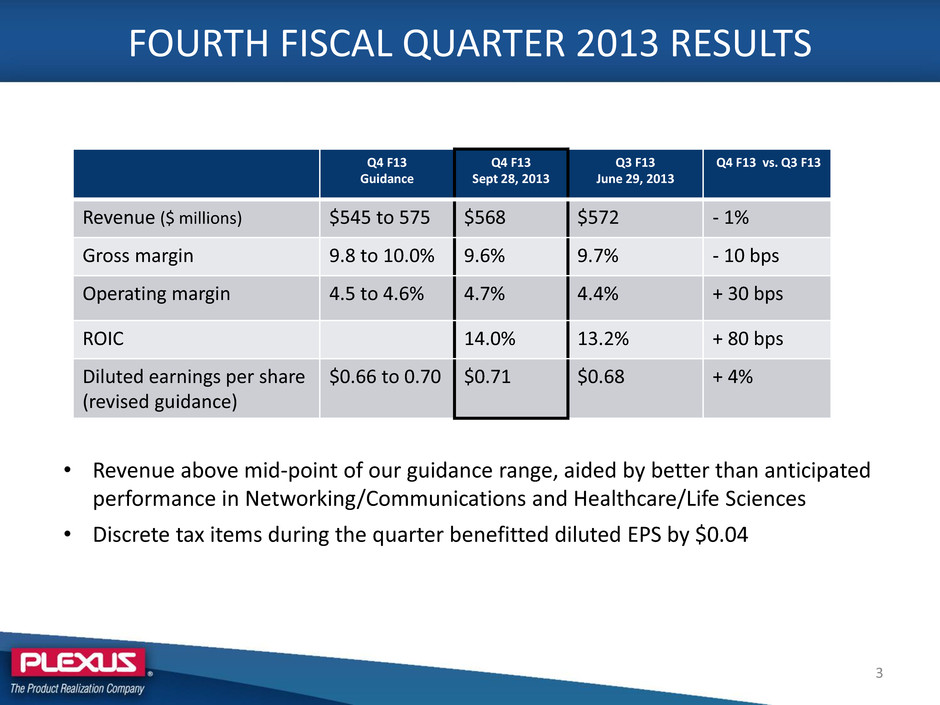
FOURTH FISCAL QUARTER 2013 RESULTS 3 Q4 F13 Guidance Q4 F13 Sept 28, 2013 Q3 F13 June 29, 2013 Q4 F13 vs. Q3 F13 Revenue ($ millions) $545 to 575 $568 $572 - 1% Gross margin 9.8 to 10.0% 9.6% 9.7% - 10 bps Operating margin 4.5 to 4.6% 4.7% 4.4% + 30 bps ROIC 14.0% 13.2% + 80 bps Diluted earnings per share (revised guidance) $0.66 to 0.70 $0.71 $0.68 + 4% • Revenue above mid-point of our guidance range, aided by better than anticipated performance in Networking/Communications and Healthcare/Life Sciences • Discrete tax items during the quarter benefitted diluted EPS by $0.04

FISCAL 2013 RESULTS VS. GOALS $1,062 $884 $808 $1,041 $1,229 $1,432 $1,546 $1,842 $1,617 $2,013 $2,231 $2,307 $2,228 -5% 0% 5% 10% 15% 20% 25% 30% 35% $0 $500 $1,000 $1,500 $2,000 $2,500 F01 F02 F03 F04 F05 F06 F07 F08 F09 F10 F11 F12 F13 WACC Revenue ($M) ROIC Goal Result Revenue Growth 15% -3.4% ROIC 17.0% 14.0% 4

F13 SECTOR REVENUES—MIXED PERFORMANCE Sectors $s in millions Revenue F13 $ Growth Vs. F12 % Growth Vs. F12 Networking/ Communications $826 ($77) -9% Healthcare/ Life Sciences $563 $69 14% Industrial/ Commercial $551 ($120) -18% Defense/Security/ Aerospace $288 $50 21% Plexus $2,228 ($79) -3% HC/LS 25% I/C 25% D/S/A 13% N/C 37% Networking/Communications • Weak end-markets • Loss of largest customer—headwind for fiscal 2014 Healthcare/Life Sciences • Share gains and new customers • Engineering Solutions strong Industrial/Commercial • Tepid end-markets • Top 5 customer in sector has a challenging year Defense/Security/Aerospace • Share gains and end-market strength in Aerospace HC/LS 28% I/C 27% D/S/A 15% N/C 30% Fiscal 2014—A Healthier Sector Mix (estimate) Fiscal 2013 Sector Mix 5

A FEW FISCAL 2013 HIGHLIGHTS Operating Performance • Operating Profit—grew Q/Q throughout the year • Exited year with reduced operating expenses • Cash Cycle improved 10 days over prior year • Free cash flow exceeded $100M Projects/Initiatives • Good progress on working capital and supply chain initiatives • Good progress on cost/productivity initiatives • Completed footprint investments in Oradea, Romania & Livingston, Scotland • Completed construction of new consolidation facility in Fox Cities, WI • Excellent work managing Juniper disengagement; no surprises Capital Allocation • Completed $50 million share buyback program during fiscal 2013 • $30 million buyback program authorized for fiscal 2014 6

FISCAL 2014—CAUSE OPTIMISM Revenues Healthier sector portfolio mix with lower customer concentration risk Strong trailing four quarter new business wins leading into the year Anticipate sequential revenue growth throughout fiscal 2014 Platform for growth, lower capital spending EMEA: F12 & F13 investments offer customers a compelling value proposition AMER: Fox Cities, WI transformation—3:1 consolidation complete Q2F14 New ‘low cost’ facility in Guadalajara, Mexico (lease) complete Q4F14 APAC: Ample capacity for growth Value Stream (higher margins) Engineering Solutions (7 locations), Sustaining Solutions & Micro Electronics Operating Performance Continued focus on delivering 5% operating margin as we exit fiscal 2014 Continued focus on productivity initiatives and operational excellence culture initiatives 7

Q1F14 GUIDANCE 8 Q1 F14 Guidance Revenue ($ millions) $520 to $550 Diluted earnings per share $0.57 to $0.63 Excludes restructuring charges Includes $0.08 stock based compensation expense Mid-point of range suggests a 6% sequential decline Q4F13 to Q1F14 • Juniper headwind in Q1F14 is $42M (sequential) • Ex JNPR, underlining growth at mid-point of guidance is 2% (sequential) Current customer forecasts indicate sequential growth in Q2F14

PERFORMANCE BY SECTOR 9 Q4 F13 Sept 28, 2013 Q3 F13 June 29, 2013 Q4 F13 vs. Q3 F13 Q1 F14 Expectations (percentage points) Networking/ Communications $197 35% $218 38% - 10% Down high teens Healthcare/ Life Sciences $159 28% $142 25% 12% Flat Industrial/ Commercial $143 25% $138 24% 4% Down mid single Defense/ Security/ Aerospace $69 12% $74 13% - 6% Up high single Total Revenue $568 100% $572 100% - 1% Revenue in millions • N/C showing strong growth in Q4 F13 Ex-JNPR as a result of new program wins • I/C and HC/LS solid in Q4 F13 primarily due to new program wins • D/S/A soft in Q4 F13, but expected to improve in Q1 F14 Networking/ Communications $155 $133 17% Up low single Ex-JNPR

Q4 F13 MANUFACTURING WINS 10 $27 $83 $39 $6 Manufacturing Wins by Sector ($Ms) Networking/Communications Healthcare/Life Sciences Industrial/Commercial Defense/Security/Aerospace $57 $36 $62 Manufacturing Wins by Region ($Ms) AMER EMEA APAC 34 wins totaling $155M in anticipated annual revenue when fully ramped within Manufacturing Solutions group • Balanced performance between the regions • Exceptional performance from Healthcare/Life Sciences Engineering Solutions wins of $19M in anticipated revenue

0% 5% 10% 15% 20% 25% 30% 35% 40% 45% 50% $0 $100 $200 $300 $400 $500 $600 $700 $800 $900 $1,000 % o f TFQ S al e s N ew W in s $ M TFQ Wins TFQ Wins % of TFQ Sales Qtrly Wins MANUFACTURING WINS AS A PERCENT OF SALES Goal Trailing Four Quarters (TFQ) of New Manufacturing Wins 11 TFQ $703M

FUNNEL OF MANUFACTURING OPPORTUNITIES 12 - 500 1,000 1,500 2,000 2,500 $ M il li o n Customer Target Sufficient funnel, focused on increasing $2.0B

FOX CITIES, WI TRANSFORMATION • New 418,000 sq. ft. facility • Consolidation of three sites - Two leased, one owned • Transitioning product in Q1F14 and Q2F14 • Initial customer qualified in facility • Estimated restructuring charges of $3-4M over Q1F14 and Q2F14 * As of Oct 2013 13

Q1F10 Q2F10 Q3F10 Q4F10 Q1F11 Q2F11 Q3F11 Q4F11 Q1F12 Q2F12 Q3F12 Q4F12 Q1F13 Q2F13 Q3F13 Q4F13 Inventory Days 88 89 89 90 93 89 87 85 87 87 81 78 92 87 78 72 A/R Days 50 45 47 51 51 45 49 48 46 47 47 49 50 55 54 49 A/P Days 69 69 61 66 62 57 56 57 57 62 59 58 61 61 54 56 Customer Deposit Days 6 5 5 5 5 5 6 6 6 6 6 6 7 17 19 12 Net Cash Cycle Days 63 60 69 70 78 71 75 70 70 66 63 63 74 64 59 53 PLEXUS CASH CYCLE TREND - 10 20 30 40 50 60 70 80 90 100 D ay s Fiscal Quarters Net Cash Cycle Days Inventory Days A/R Days A/P Days Customer Deposit Days 14

OPERATIONS INITIATIVES Micro-Electronics Initiative • Appointed General Manager and business development leader • New cleanroom under construction at Boise Center of Excellence • Winning new programs – 2 worth over $20M • Strong funnel developed Supply Chain Productivity Manufacturing Productivity Facility simplifications Improved sector mix 15 3.8% 4.0% 4.2% 4.4% 4.6% 4.8% Q1F13 Q2F13 Q3F13 Q4F13 Operating Profit Margin

FOURTH QUARTER 2013 INCOME STATEMENT HIGHLIGHTS 16 Q4 F13 Sept 28, 2013 Q3 F13 June 29, 2013 Q4 F13 vs. Q3 F13 Change Revenue $568 $572 - 1% Gross margin 9.6% 9.7% - 10 bps Operating margin 4.7% 4.4% + 30 bps Net income $24.5 $23.2 + 5% Diluted earnings per share $0.71 $0.68 + 4% Revenue and Net Income in millions • Gross margin lower than expected; due to customer mix and $400,000 for Fox Cities consolidation (included in ongoing results) • SG&A during the quarter lower than expected on focused cost management • Discrete tax items during the quarter benefitted diluted EPS by $0.04

BALANCE SHEET AND CASH FLOWS 17 Q4 F13 Comments Return on invested capital 14.0% Above WACC of 12%, but below enduring goal of WACC + 500 bps (17%) Share repurchases $13.8 million Average price of $33.60 per share Cash cycle days 53 days Better than expectations and 6 days better than Q3 F13 Free cash flow $68 million

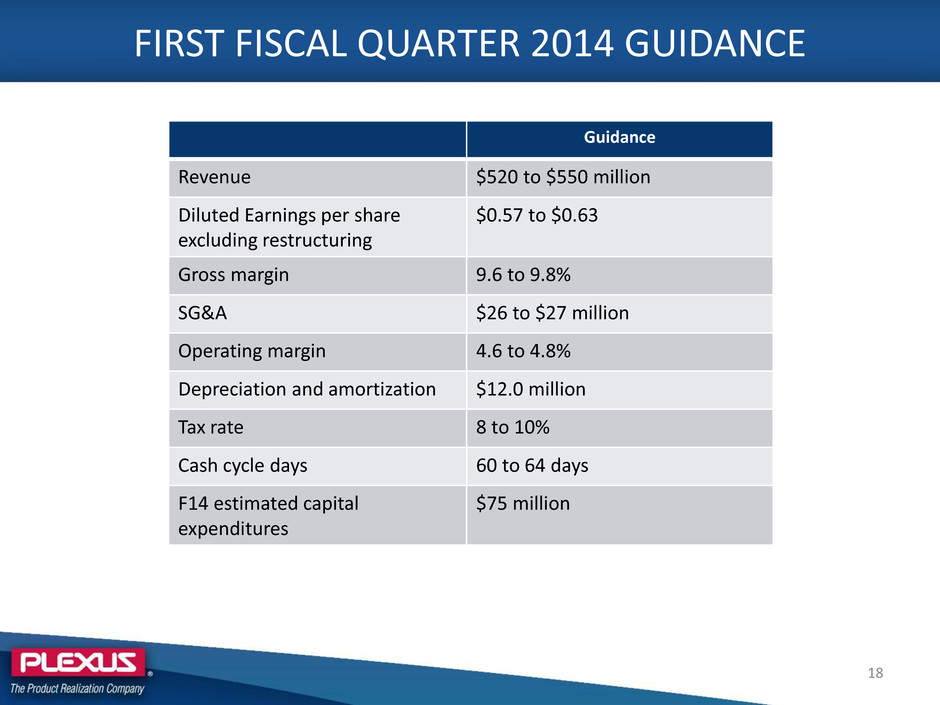
FIRST FISCAL QUARTER 2014 GUIDANCE 18 Guidance Revenue $520 to $550 million Diluted Earnings per share excluding restructuring $0.57 to $0.63 Gross margin 9.6 to 9.8% SG&A $26 to $27 million Operating margin 4.6 to 4.8% Depreciation and amortization $12.0 million Tax rate 8 to 10% Cash cycle days 60 to 64 days F14 estimated capital expenditures $75 million

QUESTIONS
