Attached files
| file | filename |
|---|---|
| 8-K - 8-K - IBERIABANK CORP | d616262d8k.htm |
| EX-99.1 - EX-99.1 - IBERIABANK CORP | d616262dex991.htm |
 3Q13 Earnings Conference Call
Supplemental Presentation
October 22, 2013
Exhibit 99.2 |
 Safe Harbor Language
To
the
extent
that
statements
in
this
presentation
and
the
accompanying
press
release
relate
to
future
plans,
objectives,
financial
results
or
performance
of
IBERIABANK
Corporation,
these
statements
are
deemed
to
be
forward-looking
statements
within
the
meaning
of
the
Private
Securities
Litigation
Reform
Act
of
1995.
Such
statements,
which
are
based
on
management’s
current
information,
estimates
and
assumptions
and
the
current
economic
environment,
are
generally
identified
by
the
use
of
the
words
“plan”,
“believe”,
“expect”,
“intend”,
“anticipate”,
“estimate”,
“project”
or
similar
expressions.
IBERIABANK
Corporation’s
actual
strategies
and
results
in
future
periods
may
differ
materially
from
those
currently
expected
due
to
various
risks
and uncertainties.
Actual
results
could
differ
materially
because
of
factors
such
as
the
level
of
market
volatility,
our
ability
to
execute
our
growth
strategy,
including
the
availability
of
future
FDIC-assisted
failed
bank
opportunities,
unanticipated
losses
related
to
the
integration
of
and
refinements
to
purchase
accounting
adjustments
for,
acquired
businesses
and
assets
and
assumed
liabilities
in
these
transactions,
adjustments
of
fair
values
of
acquired
assets
and
assumed
liabilities
and
of
deferred
taxes
in
acquisitions,
actual
results
deviating
from
the
Company’s
current
estimates
and
assumptions
of
timing
and
amounts
of
cash
flows,
credit
risk
of
our
customers,
effects
of
the
on-going
correction
in
residential
real
estate
prices
and
reduced
levels
of
home
sales,
our
ability
to
satisfy
new
capital
and
liquidity
standards
such
as
those
imposed
by
the
Dodd-Frank
Act
and
those
adopted
by
the
Basel
committee
and
federal
banking
regulators,
sufficiency
of
our
allowance
for
loan
losses,
changes
in
interest
rates,
access
to
funding
sources,
reliance
on
the
services
of
executive
management,
competition
for
loans,
deposits
and
investment
dollars,
reputational
risk
and
social
factors,
changes
in
government
regulations
and
legislation,
increases
in
FDIC
insurance
assessments,
geographic
concentration
of
our
markets
and
economic
conditions
in
these
markets,
rapid
changes
in
the
financial
services
industry,
dependence
on
our
operational,
technological,
and
organizational
systems
or
infrastructure
and
those
of
third-party
providers
of
those
services,
hurricanes
and
other
adverse
weather
events,
the
modest
trading
volume
of
our
common
sock,
and
valuation
of
intangible
assets.
These
and
other
factors
that
may
cause
actual
results
to
differ
materially
from
these
forward-looking
statements
are
discussed
in
the
Company’s
Annual
Report
on
Form
10-K,
subsequent
Quarterly
Reports
on
Form
10-Q,
and
other
filings
with
the
Securities
and
Exchange
Commission
(the
“SEC”),
available
at
the
SEC’s
website,
http://www.sec.gov,
and
the
Company’s
website,
http://www.iberiabank.com,
under
the
heading
“Investor
Information.”
All
information
in
this
presentation
and
the
accompanying
press
release
is
as
of
the
date
of
this
release.
The
Company
undertakes
no
duty
to
update
any
forward-looking
statement
to
conform
to
the
statement
to
actual
results
or
changes
in
the
Company’s
expectations.
Certain
tabular
presentations
may
not
reconcile
because
of
rounding.
2
2 |
 3
•
Operating EPS of $0.83 driven by higher net interest income, improvement in
operating expenses and continued strong organic loan and core deposit
growth •
Legacy loan growth:
•
Core deposit growth:
•
Stable net interest margin -
2 bps decline to 3.37%
•
Tax equivalent net interest income increased $1 million, or 1%, while average
earning assets increased $89 million, or 1%
•
$3.6
million
aggregate
provision
for
credit
losses
--
$2
million
provision
for
loan
losses
and $1.6 million provision for unfunded lending commitments
•
Total operating expenses declined from $110 million in 2Q13 to $106 million in
3Q13. Included in 3Q13 operating expense is a $1.1 million increase
in provision for unfunded
lending commitments
Introductory Comments
Third Quarter 2013 –
Summary Comments
$295 million since June 30, 2013 (+16% annualized)
$2.4 billion since year-end 2011 (+25% annualized)
$413 million since June 30, 2013 (+19% annualized)
$2.1 billion since year-end 2011 (+17% annualized)
6 bps decline in the earning asset yield
2 bps decline in total cost of deposits |
 4
Loan Growth
Since Year-End 2008
Year-End 2008
$3.7 Billion
September 30, 2013
$9.0 Billion
Acquired loans, net of discount
+$2.9 billion
Acquired loan pay downs
($1.6 billion)
Legacy loan growth
+$4.0 billion
Total net growth
+$5.3 billion |
 5
Deposit Growth
Since Year-End 2008
Year-End 2008
$4.0 Billion
September 30, 2013
$11.0 Billion
•
$7.0 billion growth in total
deposits or +174% (+37%
annualized) |
 6
Financial Overview
Financial Overview
Performance Metrics –
Yields and Costs
•
Investment yield
increased 6 bps due to
reduced bond premium
amortization
•
Non-covered loan yield
was stable on a linked
quarter basis
•
Net covered loan yield
declined 145 bps due to
improving credit quality
and lower income on
covered loans that led to
higher amortization on
the Indemnification Asset
•
Average noninterest
bearing deposits up $329
million (+16% linked
quarter basis)
•
Interest bearing deposit
costs declined 2 bps
•
Margin declined 2 bps to
3.37%
6/30/2013
9/30/2013
Investment Securities
1.92%
1.98%
6
bps
Covered Loans, net of loss share receivable
5.11%
3.66%
(145)
bps
Noncovered Loans
4.40%
4.39%
(1)
bps
Loans & Loss Share Receivable
4.35%
4.21%
(14)
bps
Mortgage Loans Held For Sale
3.17%
4.32%
115
bps
Other Earning Assets
0.87%
0.89%
2
bps
Total Earning Assets
3.80%
3.74%
(6)
bps
Interest Bearing Deposits
0.42%
0.40%
(2)
bps
Short-Term Borrowings
0.16%
0.14%
(2)
bps
Long-Term Borrowings
3.39%
3.37%
(2)
bps
Total Interest Bearing Liabilities
0.51%
0.49%
(2)
bps
Net Interest Spread
3.29%
3.25%
(4)
bps
Net Interest Margin
3.39%
3.37%
(2)
bps
(1)
Earning asset yields are shown on a fully taxable equivalent basis.
Basis Point
Change
For Quarter Ended: |
 7
Financial Overview
Non-Interest Income Trends
•
Mortgage loan income declined $2.5 million or -14%
•
Title insurance income decreased $0.2 million, or -4%
•
Increased brokerage commissions of $0.1 million or 2%
•
Deposit service charge income increased $0.4 million, or 6%,
from 2Q13
•
Increased client derivative income of $1.8 million
3Q13 originations down 25% from 2Q13
due to market forces and seasonal trends
Refinancings were 19% of production,
down from 31% in 2Q13
Sales down 19% in 3Q13 and down 18%
from 3Q12
$15 million in 3Q13 revenues (down
14%)
Margins declined as industry rates rose;
Small buyback costs
Pipeline of $182 million at quarter-end
and
$191
million
on
October
11
th
(+9%)
Noninterest Income ($000s)
3Q12
4Q12
1Q13
2Q13
3Q13
$ Change
% Change
Service Charges on Deposit Accounts
6,952
$
7,295
$
6,797
$
7,106
$
7,512
$
406
$
6%
ATM / Debit Card Fee Income
2,377
2,412
2,183
2,357
2,476
119
5%
BOLI Proceeds and CSV Income
916
909
939
901
908
7
1%
Mortgage Income
23,215
22,935
18,931
17,708
15,202
(2,506)
-14%
Title Revenue
5,623
5,492
5,021
5,696
5,482
(214)
-4%
Broker Commissions
3,092
4,192
3,534
3,863
3,950
87
2%
Other Noninterest Income
4,337
4,928
4,727
4,915
7,720
2,805
57%
Noninterest
income
excluding
non-operating
income
46,512
48,162
42,132
42,546
43,250
704
2%
Gain (Loss) on Sale of Investments, Net
41
(4)
2,359
(57)
13
70
123%
Other Non-operating income
-
2,196
-
-
-
-
-
Total Noninterest Income
46,553
$
50,354
$
44,491
$
42,489
$
43,263
$
774
$
2%
3Q13 vs. 2Q13 |
 8
Financial Overview
Non-Interest Expense
•
Noninterest expenses excluding non-operating items down $4
million, or 4%, as compared to 2Q13
•
Total expenses down $9 million, or 8%, in 3Q13
•
Severance expense down $1 million, or 67%
•
Occupancy and branch closure costs down $4 million
•
Impairment of closed fixed assets of $1 million
•
Provision for FDIC clawback liability up $0.5 million
•
Debit Card Rewards program termination down $0.5 million
Mortgage commissions
(1.9)
$
mil.
Salaries and benefits
(1.9)
Consulting and professional expense
(0.8)
Occupancy expense
(0.2)
Reserve for unfunded lending commitments
1.1
(3.7)
$
Noninterest Expense ($000s)
3Q12
4Q12
1Q13
2Q13
3Q13
$ Change
%
Change
Mortgage Commissions
6,006
$
5,747
$
4,327
$
6,127
$
4,238
$
(1,889)
$
-31%
Hospitalization Expense
3,773
4,005
4,407
3,994
4,303
309
8%
Other Salaries and Benefits
49,270
50,675
53,668
52,024
50,140
(1,884)
-4%
Salaries and Employee Benefits
59,049
$
60,426
$
62,402
$
62,145
$
58,681
$
(3,464)
$
-6%
Credit/Loan Related
4,846
4,386
3,739
4,168
5,248
1,080
26%
Occupancy and Equipment
13,500
14,413
14,774
14,321
13,863
(457)
-3%
Amortization of Acquisition Intangibles
1,287
1,285
1,183
1,181
1,179
(2)
0%
All Other Noninterest Expense
26,611
30,328
28,050
28,222
26,933
(1,288)
-5%
Nonint. Exp. (Ex-Non-Operating Exp.)
105,293
$
110,838
$
110,148
$
110,036
$
105,904
$
(4,132)
$
-4%
Severance
712
370
97
1,670
554
(1,116)
-67%
Occupancy and Branch Closure Costs
284
711
375
4,925
594
(4,330)
-88%
Impairment of Long-lived Assets
-
-
31,813
-
977
977
100%
Provision for FDIC clawback liability
-
-
-
130
667
537
414%
Debt Prepayment
-
-
2,307
-
-
-
0%
Termination of Debit Card Rewards Program
-
-
-
450
-
(450)
-100%
Consulting and Professional
574
339
-
150
(630)
(780)
-520%
Merger-Related Expenses
2,985
1,183
157
-
85
85
100%
Total Noninterest Expense
109,848
$
113,441
$
144,898
$
117,361
$
108,152
$
(9,209)
$
-8%
Tangible Efficiency Ratio -
excl Nonop Exp
71.2%
72.5%
74.1%
74.2%
70.3%
3Q13 vs. 2Q13
Linked
quarter
increases/(decreases)
of: |
 9
Financial Overview
Non-Operating Items
•
Amortization of Indemnification Asset of $5.5 million in 3Q13 ($0.12 EPS)
•
3Q13 Provision for FDIC clawback liability of $0.7 million ($0.01 EPS)
•
3Q13 Severance expense of $0.6 million ($0.01 EPS)
•
Branch closure expense of $0.6 million in 3Q13 ($0.1 EPS)
Pre-tax
After-tax
(2)
Per share
Pre-tax
After-tax
(2)
Per share
Pre-tax
After-tax
(2)
Per share
Net Income (Loss) (GAAP)
29,378
$
21,234
$
0.73
$
19,803
$
15,590
$
0.53
$
30,549
$
23,192
$
0.78
$
Noninterest income adjustments
Loss (Gain) on sale of investments
(41)
(27)
(0.00)
57
37
0.00
(13)
(8)
(0.00)
Other noninterest income
-
-
-
-
-
-
-
-
-
Noninterest expense adjustments
Merger-related expenses
2,985
1,940
0.07
-
-
-
85
55
0.00
Severance expenses
712
463
0.02
1,670
1,086
0.04
554
360
0.01
Impairment of indemnification asset
-
-
-
4,618
3,002
0.10
977
635
0.02
Provision for FDIC clawback liability
-
-
-
130
84
0.00
667
434
0.01
Occupancy expenses and branch closure expenses
284
185
0.01
306
199
0.01
594
386
0.01
Termination of debit card rewards program
-
-
-
450
293
0.01
-
-
-
Professional expenses and litigation settlements
574
373
0.01
150
97
0.00
(630)
(410)
(0.01)
Operating earnings (Non-GAAP) (3)
33,892
24,168
0.83
27,185
20,388
0.69
32,783
24,644
0.83
Covered and acquired impaired (reversal of) provision for loan losses
3,827
2,488
0.09
(3,141)
(2,042)
(0.07)
(854)
(555)
(0.02)
Other (reversal of) provision for loan losses
226
147
0.01
4,949
3,217
0.11
2,868
1,864
0.07
Pre-provision operating earnings (Non-GAAP) (3)
37,945
$
26,803
$
0.92
$
28,992
$
21,563
$
0.73
$
34,797
$
25,953
$
0.89
$
Net Income (Loss) (GAAP)
29,378
$
21,234
$
0.73
$
19,803
$
15,590
$
0.53
$
30,549
$
23,192
$
0.78
$
Impact of adoption of new accounting standard
(3)
-
-
-
4,967
3,228
0.11
5,496
3,572
0.12
Earnings less impact of new accounting standard (Non-GAAP)
29,378
$
21,234
$
0.73
$
24,770
$
18,818
$
0.64
$
36,045
$
26,764
$
0.90
$
Operating earnings including the impact of the adoption
33,892
$
24,168
$
0.83
$
27,185
$
20,388
$
0.69
$
32,783
$
24,644
$
0.83
$
of new accounting standard (Non-GAAP)
Impact of adoption of new accounting standard
(3)
-
-
-
4,967
3,228
0.11
5,496
3,572
0.12
Operating
earnings
less
impact
of
new
accounting
standard
(Non-GAAP)
33,892
$
24,168
$
0.83
$
32,152
$
23,617
$
0.80
$
38,279
$
28,216
$
0.95
$
(1) Per share amounts may not appear to foot due to rounding.
(2) After-tax amounts estimated based on a 35% marginal tax rate.
(3) Includes the impact of the adoption of ASU 2012-06 in the three-month periods ending
September 30, 2013 and June 30, 2013. Dollar Amount
Dollar Amount
Dollar Amount
RECONCILIATION
OF
NON-GAAP
FINANCIAL
MEASURES
(1)
(dollars in thousands)
For The Quarter Ended
September 30, 2012
June 30, 2013
September 30, 2013 |
 10
9/30/2012
12/31/2012
3/31/2013
6/30/2013
9/30/2013
Net Income ($ in thousands)
21,234
$
23,208
$
717
$
15,590
$
23,192
$
49%
Per Share Data:
Fully Diluted Earnings
0.73
$
0.79
$
0.02
$
0.53
$
0.78
$
48%
Operating Earnings (Non-GAAP)
0.83
0.80
0.74
0.69
0.83
21%
Pre-provision Operating Earnings (Non-GAAP)
0.92
0.91
0.66
0.73
0.89
21%
Tangible Book Value
37.07
37.34
36.93
36.30
37.00
2%
Key Ratios:
Return on Average Assets
0.69%
0.73%
0.02%
0.49%
0.71%
22
bps
Return on Average Common Equity
5.56%
6.02%
0.19%
4.09%
6.08%
199
bps
Return on Average Tangible Common Equity (Non-GAAP)
7.91%
8.62%
0.55%
5.96%
8.74%
278
bps
Net Interest Margin (TE)
(1)
3.58%
3.55%
3.23%
3.39%
3.37%
(2)
bps
Tangible Efficiency Ratio (TE)
(1)
(Non-GAAP)
74.3%
73.2%
102.4%
81.9%
74.5%
(737)
bps
Tangible Common Equity Ratio (Non-GAAP)
9.01%
8.66%
8.75%
8.69%
8.64%
(5)
bps
Tier 1 Leverage Ratio
10.01%
9.70%
9.37%
9.59%
9.65%
6
bps
Tier 1 Common Ratio (Non-GAAP)
12.04%
11.74%
11.39%
11.08%
10.95%
(13)
bps
Total Risk Based Capital Ratio
14.54%
14.19%
13.80%
13.45%
13.28%
(17)
bps
Net Charge-Offs to Average Loans
(2)
0.12%
0.07%
0.06%
0.06%
0.02%
(4)
bps
Nonperforming Assets to Total Assets
(2)
0.65%
0.69%
0.68%
0.69%
0.66%
(3)
bps
(1)
Fully taxable equivalent basis.
(2)
Excluding FDIC Covered Assets and Acquired Assets.
%/Basis Point
Change
For Quarter Ended:
Financial Overview
Performance Metrics –
Quarterly Trends
•
Average earning
assets up $89
million (+1%)
•
T/E net interest
income up $1
million (+1%)
•
Provision for loan
losses of $2 million:
•
Net charge-offs:
$0.3 million (0.02%
annualized rate)
•
Covered and
acquired loan loss
provision reversal:
$0.9 million
•
Legacy provision
for loan losses:
$2.9 million |
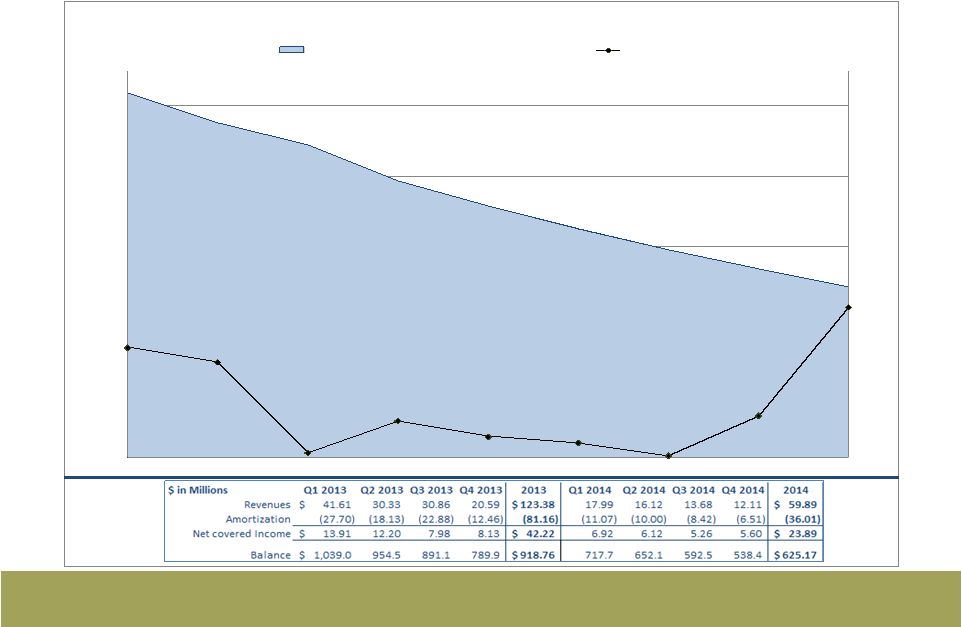 11
Financial Overview
Expected Amortization
3.50%
4.50%
5.50%
6.50%
7.50%
8.50%
9.50%
$0
$200
$400
$600
$800
$1,000
Q1 2013
Q2 2013
Q3 2013
Q4 2013
Q1 2014
Q2 2014
Q3 2014
Q4 2014
Q1 2015
Projected Average Loan Balances and Net Yields
Projected Average Balance
Projected Net Yield |
 12
Asset Quality
Non-Performing Assets Trends
$ in thousands |
 13
Asset Quality
Legacy Portfolio
Asset Quality Summary
(Excludes FDIC covered assets and all acquired loans)
•
NPAs equated to 0.66%
of total assets, down 3
bps compared to 2Q13
•
$78 million in classified
assets (-20% from
2Q13)
•
$55 million special
mention loans (-29%
from 2Q13)
•
Net charge-offs of $0.3
million, or an annualized
rate of 0.02% of
average loans
•
$2.9 million provision for
legacy franchise in
3Q13
($ thousands)
9/30/2012
6/30/2013
9/30/2013
Nonaccrual Loans
45,094
$
49,069
$
43,838
$
-3%
-11%
OREO
18,467
25,893
30,607
66%
18%
Accruing Loans 90 Days+ Past Due
2,883
1,071
1,418
-51%
32%
Nonperforming Assets
66,444
76,033
75,863
14%
0%
Past Due Loans
58,487
65,316
57,662
-1%
-12%
Classified Loans
144,090
97,818
78,059
-46%
-20%
Nonperforming Assets/Assets
0.65%
0.69%
0.66%
1
bps
(3)
bps
NPAs/(Loans + OREO)
1.04%
1.02%
0.98%
(6)
bps
(4)
bps
Classified Assets/Assets
1.32%
0.85%
0.66%
(66)
bps
(19)
bps
(Past Dues & Nonaccruals)/Loans
0.92%
0.88%
0.75%
(17)
bps
(13)
bps
Provision For Loan Losses
226
$
4,949
$
2,868
$
1169%
-42%
Net Charge-Offs/(Recoveries)
1,923
1,029
303
-84%
-71%
Provision Less Net Charge-Offs
(1,697)
$
3,920
$
2,565
$
251%
-35%
Net Charge-Offs/Average Loans
0.12%
0.06%
0.02%
(11)
bps
(4)
bps
Allowance For Loan Losses/Loans
1.21%
0.83%
0.83%
(38)
bps
0
bps
Allowance For Credit Losses/Loans
1.21%
0.97%
0.99%
(22)
bps
2
bps
For Quarter Ended:
% or Basis Point Change
Year/Year
Qtr/Qtr |
 14
Asset Quality
Total Portfolio Trends
($ thousands)
Nonaccruals
567,006
$
409,775
$
341,691
$
-40%
-17%
OREO & Foreclosed
129,173
129,607
128,987
0%
0%
90+ Days Past Due
5,538
4,126
10,844
96%
163%
Nonperforming Assets
701,717
$
543,508
$
481,522
$
-31%
-11%
NPAs/Assets
5.60%
4.24%
3.66%
(194)
bps
(58)
bps
NPAs/(Loans + OREO)
8.39%
6.02%
5.25%
(314)
bps
(77)
bps
LLR/Loans
2.45%
1.83%
1.64%
(81)
bps
(19)
bps
ACL/Loans
2.45%
1.95%
1.77%
(68)
bps
(18)
bps
Net Charge-Offs/Loans
0.10%
0.05%
0.01%
(9)
bps
(4)
bps
Past Dues:
30-89 Days Past Due
59,063
$
35,204
$
26,445
$
-55%
-25%
90+ days Past Due
5,538
4,126
10,844
96%
163%
Nonaccual Loans
567,006
409,775
341,691
-40%
-17%
Total 30+ Past Dues
631,607
$
449,105
$
378,979
$
-40%
-16%
% Loans
7.67%
5.04%
4.19%
(348)
bps
(85)
bps
Total Portfolio
3Q12
2Q13
3Q13
% or Basis Point Change
Year/Year
Qtr/Qtr |
 15
Markets
Loan Growth
Legacy Loan Growth
$ in millions
3
rd
Quarter 2013:
•
$295 million, or
+4% (+16%
annualized)
Since YE 2011:
•
$2.4 billion, or
+44% (+25%
annualized)
Since YE 2009:
•
$3.6 billion, or
+88% (+23%
annualized)
•
The FDIC
covered loan
portfolio declined
52%, or $863
million (14%
annualized rate) |
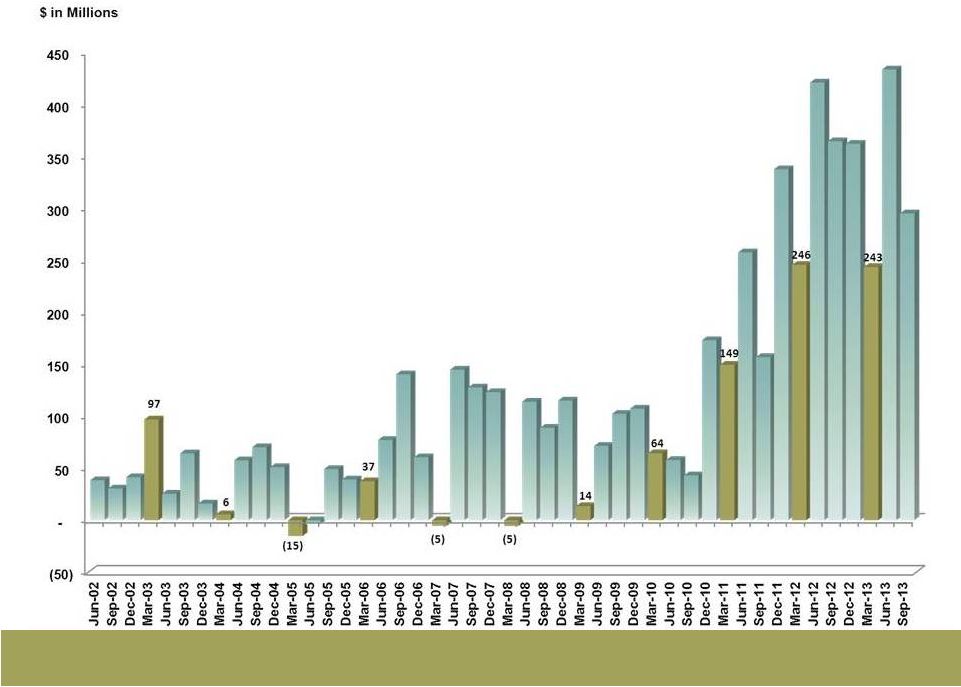 16
Markets
Quarterly Legacy Loan Growth
•
First quarter of each year tends
to exhibit slower loan growth
than other quarters |
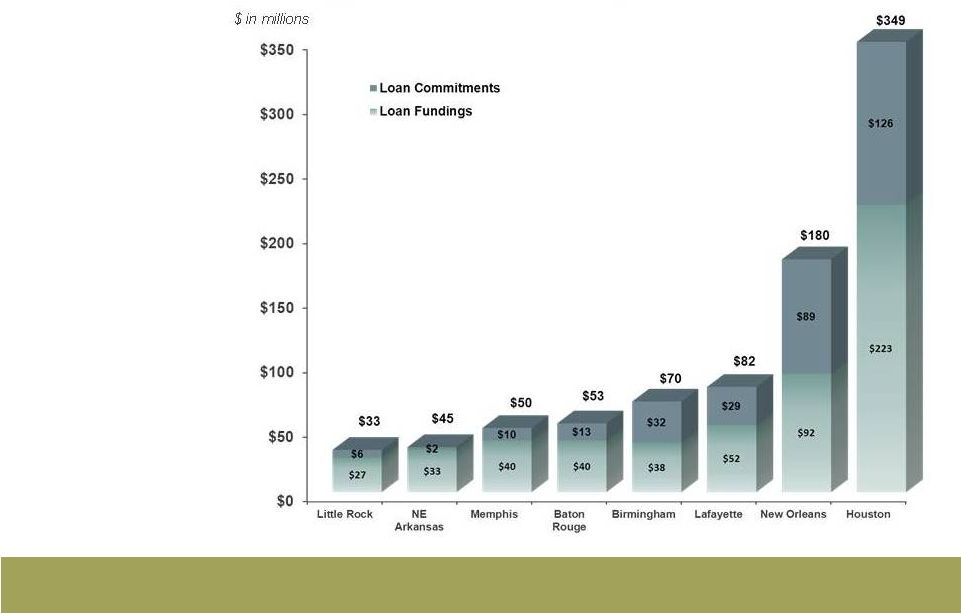 17
Markets
Loan Originations 3Q13 –Top Markets
•
$1.2 billion in total
funded loans and
unfunded loan
commitments
originated in 3Q13
•
Significant growth in
Houston and New
Orleans. Strong
growth across the
franchise
•
Continued growth in
other markets in which
we have invested
heavily
Loan commitments and originations include renewals |
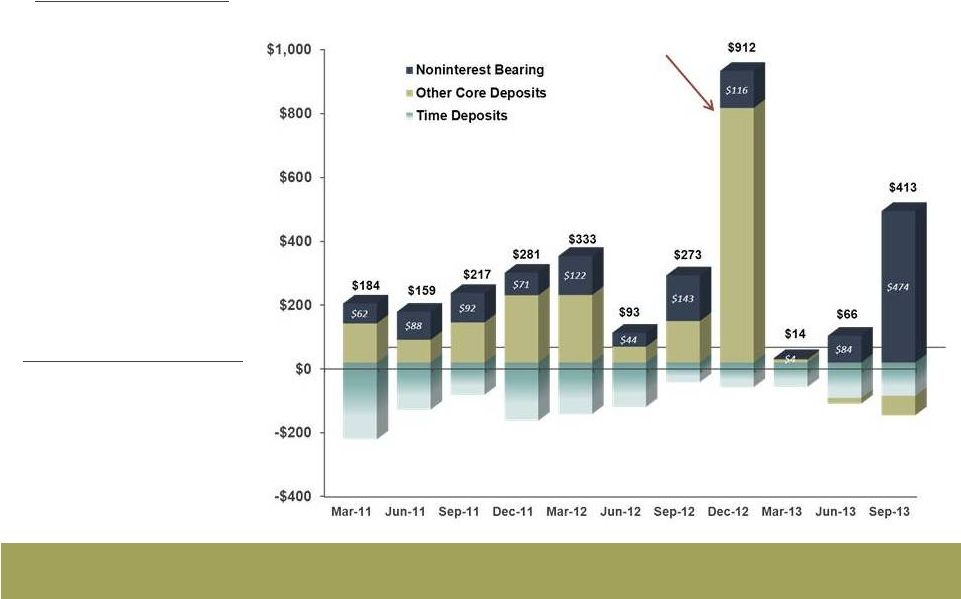 18
Excludes acquired deposits
Markets
Deposit Growth
$ in millions
Organic Deposit Growth
3
rd
Quarter 2013:
•
Increase of $309
million, or +3% in
3Q13 (+12%
Annualized)
•
$474 million (+23%)
growth in NIB deposits
for 3Q13 (impacted by
transition of NOW
accounts to NIB)
•
$104 million (-5%)
decline in time
deposits in 3Q13
Total Deposit Growth
Very strong
transaction account
growth in 4Q12
•
Core deposit growth
of $413 million, or
+5% (+19%
annualized) |
 19
Markets
Noninterest Bearing Deposit Accounts
•
Strong account growth in
high-focus markets
•
3Q13 includes accounts
transitioned from NOW
accounts to Noninterest
Bearing |
 20
Markets
Noninterest Bearing Deposits
% of Total Deposits
•
Since
2010,
total
noninterest
bearing
deposits
increased
$1.7
billion
or
+188%
(+68%
annualized rate)
•
$228
million
of
incremental
noninterest
bearing
deposit
growth
or
+12%
(+48%
annualized)
•
Additional
$246
million
of
NOW
accounts
transitioned
to
noninterest
bearing
this
quarter
•
Top
3Q13
noninterest
bearing
deposit
growth
markets
include
Naples,
Lafayette,
New
Orleans,
Houston
and
Lake
Charles
Noninterest bearing deposits at period-end
$ in billions |
 21
Markets
3Q13 Highlights
•
Loan pricing and structure remain competitive for target commercial and
business banking clients
•
Houston, New Orleans, Acadiana, Birmingham and Baton Rouge showed
strong commercial loan originations
•
Loans and commitments originated during 3Q13 of $1.2 billion with 57% fixed
rate and 43% floating rate
•
Commercial loans originated and funded in 3Q13 totaled $466 million with a
mix of 41% fixed and 60% floating ($731 in commercial loan commitments
during the quarter)
•
Strong commercial pipeline of $765 million at quarter-end
•
Small business loan originations, including lines of credit, grew $72 million or
10% in 3Q13 (39% annualized)
•
Period-end core deposit growth of $413 million, with non-interest bearing
deposits up $474 million ($329 million linked quarter growth on an average
balance basis), of which 48% was the result of a transition of interest
bearing NOW accounts into noninterest bearing deposits
|
 22
Retail and Small Business
3Q13 Progress
•
Completed closure and consolidation of 10 branches in the third quarter of 2013, as
planned, bringing total closures to 25 branches and one drive through
facility over the past 12 months
•
Balanced loan growth with Small Business, Consumer and Mortgage accounting for 60%
of total bank-wide loan growth:
•
Small Business of $34 million
•
Indirect of $18 million
•
Direct Consumer and Mortgage of $84 million
•
Strong checking account growth:
•
Small Business account growth increased 14% year-over-year
•
Consumer accounts increased 20% year-over-year
•
Continued emphasis on branch efficiency, productivity and enhanced digital
delivery, with Retail staffing mid-October down 5.5% from end of the
second quarter, with staff costs down 5.8%
•
Launched mobile deposit capture and iPad application during the quarter
|
 23
Wealth And Capital Markets
3Q13 Progress
•
ICP/IWA revenues
of $3.2 million (up
6% compared to
2Q13 and up 67%
from 3Q12)
•
ICP currently
provides research
coverage on 77
public energy
companies
•
IWA assets under
management
increased 1%, to
$1.1 billion at
September 30, 2013
Total Quarterly Revenues For:
•
IBERIA Capital Partners
•
IBERIA Wealth Advisors |
 Appendix
24 |
 25
Appendix
Expected Quarterly Re-pricing Schedule
•
$1.6 Billion in time deposits re-price over next 12 months at 0.63% weighted
average rate •
During 3Q13, new and re-priced time deposits were booked at an average cost of
0.31% •
In 3Q13, retention rate of time deposits was 87% with average reduction in rate of
34 basis points $ in millions
Note: Amounts exclude re-pricing of assets and liabilities from prior
quarters Excludes FDIC loans and receivable, non-accrual loans and market value
adjustments 4Q13
1Q14
2Q14
3Q14
4Q14
Cash Equivalents
Balance
336.9
$
-
$
-
$
-
$
-
$
Rate
1.17%
0.00%
0.00%
0.00%
0.00%
Investments
Balance
77.7
$
76.4
$
79.6
$
81.8
$
57.3
$
Rate
2.74%
2.48%
2.81%
3.02%
3.03%
Fixed Rate Loans
Balance
262.5
$
235.9
$
233.3
$
213.8
$
198.5
$
Rate
5.03%
4.99%
4.92%
4.92%
4.86%
Variable Rate Loans
Balance
3,656.6
$
21.9
$
12.7
$
9.8
$
7.4
$
Rate
3.32%
2.85%
3.48%
3.96%
3.10%
Held for Sale Loans
Balance
108.3
$
-
$
-
$
-
$
-
$
Rate
4.84%
0.00%
0.00%
0.00%
0.00%
Time Deposits
Balance
690.4
$
418.8
$
324.2
$
201.0
$
70.1
$
Rate
0.57%
0.78%
0.61%
0.57%
0.72%
Repos
Balance
258.8
$
-
$
-
$
-
$
-
$
Rate
0.14%
0.00%
0.00%
0.00%
0.00%
Borrowed Funds
Balance
120.8
$
0.6
$
5.6
$
13.0
$
0.4
$
Rate
3.19%
3.37%
4.15%
4.04%
3.64% |
 26
Appendix
Interest Rate Risk Simulation
Source: Bancware model, as of September 30, 2013
* Assumes instantaneous and parallel shift in interest rates based on static
balance sheet •
Asset sensitive from an interest rate risk position
•
The degree of asset sensitivity is a function of the reaction of
competitors to changes in deposit pricing
•
Forward curve has a slightly positive impact over 12 months
Base
Blue
Forward
Change In:
-200 bp*
-100 bp*
Case
+100 bp*
+200 bp*
Chip
Curve
Net Interest
Income
-3.8%
-1.6%
0.0%
3.5%
7.3%
0.4%
0.9%
Economic
Value of
Equity
-15.9%
-12.0%
0.0%
3.7%
6.4%
0.0%
0.0% |
 27
Appendix
Expected Amortization Comparison
$(30.00)
$(25.00)
$(20.00)
$(15.00)
$(10.00)
$(5.00)
$-
Q1 2013
Q2 2013
Q3 2013
Q4 2013
Q1 2014
Q2 2014
Q3 2014
Q4 2014
Q1 2015
Indemnification Asset Expected Amortization ($ in Millions)
Current Method
Legacy Method |
 28
Appendix
FDIC Covered Loan Portfolio Roll Forward
Average
Income /
Expense
Average Yield
Average
Income /
Expense
Average Yield
Average
Income /
Expense
Average Yield
Average
Income /
Expense
Average Yield
Covered Loans
1,112,153
49,550
17.528%
1,039,469
41,607
16.047%
954,555
30,324
12.619%
871,768
30,858
13.896%
Mortgage Loans
155,989
5,318
13.636%
180,902
4,398
9.724%
170,420
4,135
9.706%
163,485
2,718
6.650%
Indirect Automobile
(0)
-
0.000%
(0)
-
0.000%
-
-
0.000%
-
-
0.000%
Credit Card
860
14
6.664%
824
13
6.565%
789
14
7.147%
728
13
6.971%
Consumer
148,001
5,308
14.267%
130,960
3,509
10.867%
126,164
2,594
8.248%
104,668
3,029
11.481%
Line
Of
Credit-Consumer
Loans
69,910
3,661
20.831%
41,802
3,200
31.044%
40,543
2,967
29.355%
50,939
(190)
-1.476%
Commercial
&
Business
Banking
737,394
35,250
18.706%
684,981
30,487
17.803%
616,642
20,613
13.224%
551,950
25,288
17.928%
Loans in Process
(1)
-
0.000%
(1)
-
0.000%
(3)
-
0.000%
(2)
-
0.000%
Overdrafts
0
-
0.000%
0
-
0.000%
0
-
0.000%
-
-
0.000%
FDIC Loss Share Receivable
411,328
(28,201)
-26.828%
384,319
(27,702)
-28.832%
268,700
(18,130)
-26.692%
228,047
(22,875)
-39.252%
Net Covered Loan Portfolio
1,523,481
21,349
7.678%
1,423,788
13,905
5.351%
1,223,255
12,194
5.110%
1,099,815
7,983
3.663%
Average
Income /
Expense
Average Yield
Average
Income /
Expense
Average Yield
Average
Income /
Expense
Average Yield
Average
Income /
Expense
Average Yield
Covered Loans
1,112,153
49,550
17.528%
1,039,469
41,607
16.047%
954,555
30,324
12.619%
871,768
31,931
13.896%
CapitalSouth Bank
150,872
6,737
17.537%
138,793
4,109
11.855%
131,981
3,610
10.852%
123,412
2,840
10.332%
Orion Bank
641,252
29,720
18.235%
597,706
25,287
16.960%
548,977
17,685
12.789%
504,934
20,929
13.924%
Century Bank
232,967
7,137
12.108%
219,726
6,401
11.703%
199,836
4,943
9.869%
175,247
5,790
15.184%
Sterling Bank
87,063
5,956
26.806%
83,245
5,810
27.941%
73,762
4,087
21.956%
68,174
2,372
16.831%
FDIC Loss Share Receivable
411,328
(28,201)
-26.828%
384,319
(27,702)
-28.832%
268,700
(18,130)
-26.692%
228,047
(22,875)
-39.252%
CapitalSouth Bank
35,811
(3,431)
-37.492%
29,301
(2,388)
-32.596%
18,955
(2,347)
-48.987%
14,720
(2,538)
-67.473%
Orion Bank
251,749
(17,944)
-27.892%
235,594
(17,330)
-29.423%
164,219
(10,492)
-25.277%
141,213
(12,702)
-35.199%
Century Bank
92,076
(3,200)
-13.601%
90,384
(4,100)
-18.146%
65,145
(3,105)
-18.857%
55,021
(5,304)
-37.719%
Sterling Bank
31,691
(3,625)
-44.761%
29,040
(3,884)
-53.502%
20,382
(2,185)
-42.404%
17,093
(2,331)
-53.365%
Net Covered Loan Portfolio
1,112,153
21,349
7.678%
1,039,469
13,905
5.351%
954,555
12,194
5.110%
871,768
9,056
3.663%
CapitalSouth Bank
150,872
3,305
8.764%
138,793
1,721
4.961%
131,981
1,262
3.826%
123,412
301
2.301%
Orion Bank
641,252
11,776
7.345%
597,706
7,958
5.326%
548,977
7,192
5.240%
504,934
8,227
4.145%
Century Bank
232,967
3,937
6.760%
219,726
2,301
4.188%
199,836
1,837
3.678%
175,247
486
3.304%
Sterling Bank
87,063
2,331
10.709%
83,245
1,925
9.252%
73,762
1,903
10.317%
68,174
41
3.480%
4Q2012
1Q2013
2Q2013
4Q2012
1Q2013
2Q2013
3Q2013
3Q2013 |