Attached files
| file | filename |
|---|---|
| 8-K/A - FORM 8-K/A - Crestwood Midstream Partners LP | d612629d8ka.htm |
| EX-99.3 - EX-99.3 - Crestwood Midstream Partners LP | d612629dex993.htm |
| EX-23.1 - EX-23.1 - Crestwood Midstream Partners LP | d612629dex231.htm |
| EX-99.1 - EX-99.1 - Crestwood Midstream Partners LP | d612629dex991.htm |
Exhibit 99.2
CRESTWOOD MIDSTREAM PARTNERS LP
CONSOLIDATED STATEMENTS OF INCOME
(In thousands, except for per unit data)
(Unaudited)
| Three Months Ended | Six Months Ended | |||||||||||||||
| June 30, | June 30, | |||||||||||||||
| 2013 | 2012(1) | 2013 | 2012(1) | |||||||||||||
| Operating revenues |
||||||||||||||||
| Gathering revenues |
$ | 24,103 | $ | 17,761 | $ | 48,099 | $ | 29,598 | ||||||||
| Gathering revenues—related party |
19,066 | 21,616 | 38,973 | 45,462 | ||||||||||||
| Processing revenues |
3,926 | 1,198 | 7,974 | 2,394 | ||||||||||||
| Processing revenues—related party |
5,515 | 6,550 | 11,197 | 13,321 | ||||||||||||
| Compression revenues |
3,873 | — | 7,799 | — | ||||||||||||
| Product sales |
14,616 | 8,104 | 29,473 | 18,187 | ||||||||||||
|
|
|
|
|
|
|
|
|
|||||||||
| Total operating revenues |
71,099 | 55,229 | 143,515 | 108,962 | ||||||||||||
|
|
|
|
|
|
|
|
|
|||||||||
| Operating expenses |
||||||||||||||||
| Product purchases |
6,154 | 7,441 | 12,902 | 16,414 | ||||||||||||
| Product purchases—related party |
7,878 | — | 14,635 | — | ||||||||||||
| Operations and maintenance |
12,592 | 9,400 | 25,608 | 19,111 | ||||||||||||
| General and administrative |
10,380 | 8,657 | 18,169 | 15,395 | ||||||||||||
| Depreciation, amortization and accretion |
17,701 | 13,695 | 35,061 | 24,341 | ||||||||||||
|
|
|
|
|
|
|
|
|
|||||||||
| Total operating expenses |
54,705 | 39,193 | 106,375 | 75,261 | ||||||||||||
|
|
|
|
|
|
|
|
|
|||||||||
| Operating income |
16,394 | 16,036 | 37,140 | 33,701 | ||||||||||||
| Interest and debt expense |
(11,185 | ) | (8,963 | ) | (22,635 | ) | (16,520 | ) | ||||||||
|
|
|
|
|
|
|
|
|
|||||||||
| Income before income taxes |
5,209 | 7,073 | 14,505 | 17,181 | ||||||||||||
| Income tax expense |
339 | 275 | 677 | 578 | ||||||||||||
|
|
|
|
|
|
|
|
|
|||||||||
| Net income |
$ | 4,870 | $ | 6,798 | $ | 13,828 | $ | 16,603 | ||||||||
|
|
|
|
|
|
|
|
|
|||||||||
| General partner’s interest in net income |
$ | 5,192 | $ | 4,154 | $ | 10,393 | $ | 7,522 | ||||||||
| Limited partners’ interest in net income |
$ | (322 | ) | $ | 2,644 | $ | 3,435 | $ | 9,081 | |||||||
| Basic earnings (loss) per unit: |
||||||||||||||||
| Net income (loss) per limited partner unit |
$ | (0.01 | ) | $ | 0.06 | $ | 0.06 | $ | 0.21 | |||||||
| Diluted earnings (loss) per unit: |
||||||||||||||||
| Net income (loss) per limited partner unit |
$ | (0.01 | ) | $ | 0.06 | $ | 0.06 | $ | 0.21 | |||||||
| (1) | Financial information has been revised to include the results of Crestwood Marcellus Midstream LLC as discussed in Note 2. |
See accompanying notes.
1
CRESTWOOD MIDSTREAM PARTNERS LP
CONSOLIDATED BALANCE SHEETS
(In thousands, except for unit data)
(Unaudited)
| June 30, | December 31, | |||||||
| 2013 | 2012 | |||||||
| ASSETS | ||||||||
| Current assets |
||||||||
| Cash and cash equivalents |
$ | 110 | $ | 111 | ||||
| Accounts receivable |
21,772 | 21,636 | ||||||
| Accounts receivable—related party |
20,851 | 23,755 | ||||||
| Insurance receivable |
3,496 | 2,920 | ||||||
| Prepaid expenses and other |
1,476 | 1,941 | ||||||
| Assets held for sale |
6,680 | — | ||||||
|
|
|
|
|
|||||
| Total current assets |
54,385 | 50,363 | ||||||
| Property, plant and equipment, net of accumulated depreciation of $153,421 in 2013 and $130,030 in 2012 |
1,016,770 | 939,846 | ||||||
| Intangible assets, net of accumulated amortization of $23,821 in 2013 and $12,814 in 2012 |
490,503 | 501,380 | ||||||
| Goodwill |
95,031 | 95,031 | ||||||
| Deferred financing costs, net |
21,134 | 22,528 | ||||||
| Other assets |
2,107 | 1,321 | ||||||
|
|
|
|
|
|||||
| Total assets |
$ | 1,679,930 | $ | 1,610,469 | ||||
|
|
|
|
|
|||||
| LIABILITIES AND PARTNERS’ CAPITAL | ||||||||
| Current liabilities |
||||||||
| Accrued additions to property, plant and equipment |
$ | 36,173 | $ | 9,213 | ||||
| Capital leases |
3,408 | 3,862 | ||||||
| Deferred revenue |
2,426 | 2,634 | ||||||
| Accounts payable—related party |
2,997 | 3,088 | ||||||
| Accounts payable, accrued expenses and other liabilities |
34,056 | 29,717 | ||||||
|
|
|
|
|
|||||
| Total current liabilities |
79,060 | 48,514 | ||||||
| Long-term debt |
778,944 | 685,161 | ||||||
| Long-term capital leases |
1,509 | 3,161 | ||||||
| Asset retirement obligations |
14,425 | 14,024 | ||||||
| Commitments and contingent liabilities (Note 7) |
||||||||
| Partners’ capital |
||||||||
| Common unitholders (53,766,588 and 41,164,737 units issued and outstanding at June 30, 2013 and December 31, 2012) |
676,214 | 442,348 | ||||||
| Class C unitholders (7,165,819 units issued and outstanding at December 31, 2012) |
— | 159,908 | ||||||
| Class D unitholder (6,341,707 units issued and outstanding at June 30, 2013) |
126,644 | — | ||||||
| General partner (1,112,674 and 979,614 units issued and outstanding at June 30, 2013 and December 31, 2012) |
3,134 | 257,353 | ||||||
|
|
|
|
|
|||||
| Total partners’ capital |
805,992 | 859,609 | ||||||
|
|
|
|
|
|||||
| Total liabilities and partners’ capital |
$ | 1,679,930 | $ | 1,610,469 | ||||
|
|
|
|
|
|||||
See accompanying notes.
2
CRESTWOOD MIDSTREAM PARTNERS LP
CONSOLIDATED STATEMENTS OF CASH FLOWS
(In thousands)
(Unaudited)
| Six Months Ended | ||||||||
| June 30, | ||||||||
| 2013 | 2012(1) | |||||||
| Cash flows from operating activities |
||||||||
| Net income |
$ | 13,828 | $ | 16,603 | ||||
| Adjustments to reconcile net income to net cash provided by operating activities: |
||||||||
| Depreciation, amortization and accretion |
35,061 | 24,341 | ||||||
| Equity-based compensation |
1,378 | 994 | ||||||
| Other non-cash income items |
2,067 | 2,546 | ||||||
| Changes in assets and liabilities: |
||||||||
| Accounts receivable |
(136 | ) | 245 | |||||
| Accounts receivable—related party |
2,904 | 4,010 | ||||||
| Insurance receivable |
(576 | ) | — | |||||
| Prepaid expenses and other assets |
(321 | ) | (560 | ) | ||||
| Accounts payable—related party |
(91 | ) | (1,046 | ) | ||||
| Accounts payable, accrued expenses and other liabilities |
3,415 | (4,919 | ) | |||||
|
|
|
|
|
|||||
| Net cash provided by operating activities |
57,529 | 42,214 | ||||||
|
|
|
|
|
|||||
| Cash flows from investing activities |
||||||||
| Capital expenditures |
(80,297 | ) | (22,373 | ) | ||||
| Acquisitions, net of cash acquired |
— | (376,805 | ) | |||||
| Other |
20 | — | ||||||
|
|
|
|
|
|||||
| Net cash used in investing activities |
(80,277 | ) | (399,178 | ) | ||||
|
|
|
|
|
|||||
| Cash flows from financing activities |
||||||||
| Proceeds from credit facilities |
316,900 | 244,700 | ||||||
| Repayments of credit facilities |
(223,000 | ) | (176,250 | ) | ||||
| Payments on capital leases |
(2,248 | ) | (1,375 | ) | ||||
| Deferred financing costs paid |
(82 | ) | (6,486 | ) | ||||
| Proceeds from issuance of common units, net |
118,562 | 103,034 | ||||||
| Contributions from partners |
— | 247,163 | ||||||
| Distribution to General Partner for additional interest in CMM |
(129,000 | ) | — | |||||
| Distributions to partners |
(57,709 | ) | (45,471 | ) | ||||
| Taxes paid for equity-based compensation vesting |
(676 | ) | (402 | ) | ||||
|
|
|
|
|
|||||
| Net cash provided by financing activities |
22,747 | 364,913 | ||||||
|
|
|
|
|
|||||
| Change in cash and cash equivalents |
(1 | ) | 7,949 | |||||
| Cash and cash equivalents at beginning of period |
111 | 797 | ||||||
|
|
|
|
|
|||||
| Cash and cash equivalents at end of period |
$ | 110 | $ | 8,746 | ||||
|
|
|
|
|
|||||
| (1) | Financial information has been revised to include the results of Crestwood Marcellus Midstream LLC as discussed in Note 2. |
See accompanying notes.
3
CRESTWOOD MIDSTREAM PARTNERS LP
CONSOLIDATED STATEMENTS OF CHANGES IN PARTNERS’ CAPITAL
(In thousands)
(Unaudited)
| Limited Partners | ||||||||||||||||||||
| Common | Class C Unitholders |
Class D Unitholder |
General Partner | Total | ||||||||||||||||
| Partners’ capital as of December 31, 2012 |
$ | 442,348 | $ | 159,908 | $ | — | $ | 257,353 | $ | 859,609 | ||||||||||
| Issuance of units, net of offering costs |
118,562 | — | — | — | 118,562 | |||||||||||||||
| Issuance of units |
— | — | 126,286 | (126,286 | ) | — | ||||||||||||||
| Conversion of Class C units to Common units |
159,908 | (159,908 | ) | — | — | — | ||||||||||||||
| Net income |
3,077 | — | 358 | 10,393 | 13,828 | |||||||||||||||
| Equity-based compensation |
1,378 | — | — | — | 1,378 | |||||||||||||||
| Taxes paid for equity-based compensation vesting |
(676 | ) | — | — | — | (676 | ) | |||||||||||||
| Distributions to partners |
(48,383 | ) | — | — | (9,326 | ) | (57,709 | ) | ||||||||||||
| Distribution to General Partner for additional interest in CMM |
— | — | — | (129,000 | ) | (129,000 | ) | |||||||||||||
|
|
|
|
|
|
|
|
|
|
|
|||||||||||
| Partners’ capital as of June 30, 2013 |
$ | 676,214 | $ | — | $ | 126,644 | $ | 3,134 | $ | 805,992 | ||||||||||
|
|
|
|
|
|
|
|
|
|
|
|||||||||||
| Limited Partners | ||||||||||||||||||||
| Common | Class C Unitholders |
Class D Unitholder |
General Partner | Total | ||||||||||||||||
| Partners’ capital as of December 31, 2011 |
$ | 286,945 | $ | 157,386 | $ | — | $ | 11,292 | $ | 455,623 | ||||||||||
| Issuance of units, net of offering costs |
103,034 | — | — | — | 103,034 | |||||||||||||||
| Contributions from partners |
— | — | — | 247,163 | 247,163 | |||||||||||||||
| Net income |
7,664 | 1,417 | 7,522 | 16,603 | ||||||||||||||||
| Equity-based compensation |
994 | — | — | — | 994 | |||||||||||||||
| Taxes paid for equity-based compensation vesting |
(402 | ) | — | — | — | (402 | ) | |||||||||||||
| Distributions to partners |
(36,172 | ) | — | — | (9,299 | ) | (45,471 | ) | ||||||||||||
|
|
|
|
|
|
|
|
|
|
|
|||||||||||
| Partners’ capital as of June 30, 2012(1) |
$ | 362,063 | $ | 158,803 | $ | — | $ | 256,678 | $ | 777,544 | ||||||||||
|
|
|
|
|
|
|
|
|
|
|
|||||||||||
| (1) | Financial information has been revised to include the results of Crestwood Marcellus Midstream LLC as discussed in Note 2. |
See accompanying notes.
4
CRESTWOOD MIDSTREAM PARTNERS LP
NOTES TO CONSOLIDATED FINANCIAL STATEMENTS
UNAUDITED
1. ORGANIZATION AND DESCRIPTION OF BUSINESS
Organization
Crestwood Midstream Partners LP (CMLP) is a publicly traded Delaware limited partnership formed for the purpose of acquiring and operating midstream assets. Our common units are listed on the New York Stock Exchange (NYSE) under the symbol “CMLP.” Prior to June 19, 2013, Crestwood Gas Services GP LLC, our general partner (General Partner), was owned by Crestwood Holdings Partners LLC and its affiliates (Crestwood Holdings). On June 5, 2013, our General Partner distributed all of its common units and Class D units that it owned in us to Crestwood Holdings. On June 19, 2013, Crestwood Holdings acquired the general partner of Inergy, L.P. (NRGY) and contributed its ownership of our General Partner and incentive distribution rights to NRGY in exchange for NRGY common units.
On May 5, 2013, we entered into a definitive merger agreement under which we will be merged with a subsidiary of Inergy Midstream, L.P. (NRGM) in a merger in which our unitholders receive 1.07 units of NRGM for each unit of CMLP they own. Additionally, under the merger agreement, our unitholders (other than Crestwood Holdings) will receive a one-time approximately $35 million cash payment at closing of the merger transaction, or $1.03 per unit, $25 million of which will be payable by NRGM and approximately $10 million of which will be payable by Crestwood Holdings. The merger of NRGM and CMLP is conditioned upon the approval of the holders of a majority of the limited partner interests of CMLP and other customary closing conditions.
5
Organizational Structure
The following chart depicts our ownership structure as of June 30, 2013:
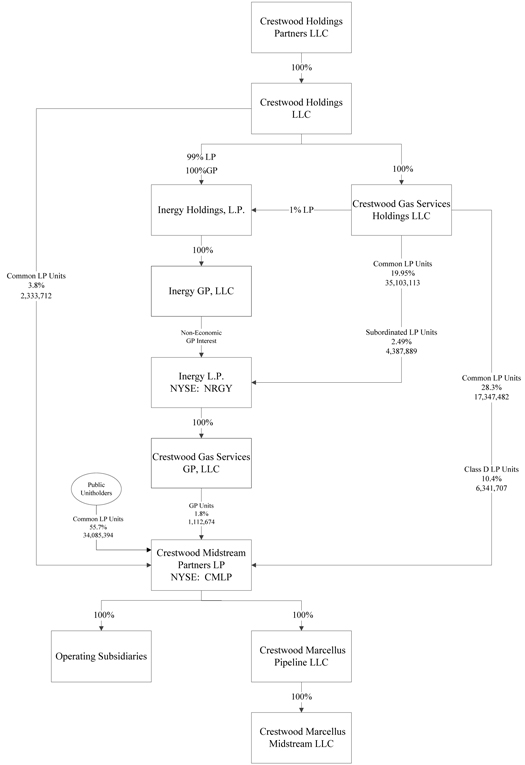
6
Our general partner and limited partner ownership interests as of June 30, 2013 is as follows:
| Crestwood Holdings |
Public | Total | ||||||||||
| General partner interest |
1.8 | % | — | 1.8 | % | |||||||
| Limited partner interests: |
||||||||||||
| Common unitholders |
32.1 | % | 55.7 | % | 87.8 | % | ||||||
| Class D unitholder |
10.4 | % | — | 10.4 | % | |||||||
|
|
|
|
|
|
|
|||||||
| Total |
44.3 | % | 55.7 | % | 100.0 | % | ||||||
|
|
|
|
|
|
|
|||||||
Description of Business
We are a growth-oriented midstream master limited partnership which owns and operates predominately fee-based gathering, processing, treating and compression assets servicing producers in the Marcellus Shale in northern West Virginia, the Barnett Shale in north Texas, the Fayetteville Shale in northwestern Arkansas, the Granite Wash in the Texas Panhandle, the Avalon Shale/Bone Spring in southeastern New Mexico and the Haynesville/Bossier Shale in western Louisiana.
2. BASIS OF PRESENTATION AND SUMMARY OF SIGNIFICANT ACCOUNTING POLICIES
Basis of Presentation
We prepared these interim financial statements under the rules and regulations of the SEC and in accordance with accounting principles generally accepted in the United States of America (GAAP) for interim consolidated financial statements. Accordingly, they do not include all of the disclosures required by GAAP.
On March 26, 2012, Crestwood Holdings contributed approximately $244 million for a 65% membership interest in Crestwood Marcellus Midstream LLC (CMM) and we contributed approximately $131 million for a 35% membership interest in CMM. On January 8, 2013, we acquired Crestwood Holdings’ 65% membership interest in CMM and as a result, we now own 100% of CMM and have the ability to control the operating and financial decisions of CMM. We accounted for this transaction as a reorganization of entities under common control and the accounting standards related to such transactions require us to retroactively adjust our historical results. Accordingly, the consolidated balance sheets reflect the historical carrying value of CMM’s assets and liabilities. Earnings related to the recast of our historical results due to the acquisition of the 65% membership interest in CMM were allocated to the General Partner. As a result, there was no impact to our 2012 reported basic or diluted earnings per limited partner unit. We funded the purchase price for the 65% membership interest in CMM of approximately $258 million through $129 million of borrowings under our CMLP credit facility, the issuance of 6,190,469 Class D units, representing limited partner interests in us to Crestwood Holdings, and the issuance of 133,060 general partner units to our General Partner. For accounting purposes, because of the consolidation of CMM, we reflected the $129 million cash paid to acquire the 65% interest in CMM and the issuance of Class D units as a reduction of our General Partner’s capital.
The financial statements as of June 30, 2013 and for the three and six months ended June 30, 2013 and 2012 are unaudited. The consolidated balance sheet as of December 31, 2012, was derived from the audited balance sheet filed in our Form 8-K filed with the SEC on May 10, 2013. In management’s opinion, all necessary adjustments to fairly present our results of operations, financial position and cash flows for the periods presented have been made and all such adjustments are of a normal and recurring nature. Information for interim periods may not be indicative of our operating results for the entire year.
Significant Accounting Policies
There were no changes in the significant accounting policies described in our 2012 Annual Report on Form 10-K filed with the SEC on February 27, 2013, except as noted below.
Revenues
Our revenues are generated from the gathering, compression and processing of natural gas from producers predominately under fee-based contracts. Our gathering revenues relate to contracts pursuant to which we both transport and compress natural gas based on the volumes that flow through our systems and are not directly dependent on commodity prices. Compression revenues relate to contracts under which we solely provide compression services or contracts under which we charge a compression services fee that is
7
separate from other services provided under our contracts. For the three and six months ended June 30, 2013, our compression revenues were entirely comprised of services provided under contracts obtained in the E. Marcellus Asset Company, LLC (EMAC) acquisition (See Note 3). Under our processing contracts, raw natural gas is gathered, processed and sold at published index prices. Producers are paid based on an agreed percentage of the residue gas and NGLs multiplied by index prices or the actual sale prices.
3. ACQUISITIONS AND DIVESTITURES
Acquisitions
Antero Acquisition
On February 27, 2012, we announced the execution, through CMM, of an Asset Purchase Agreement related to the acquisition of gathering assets owned by Antero Resources Appalachian Corporation (Antero) in the Marcellus Shale located in Harrison and Doddridge Counties, West Virginia (Antero Acquisition), and, at closing, the planned execution of a 20 year, fixed-fee, Gas Gathering and Compression Agreement (GGA) with Antero. On March 26, 2012, CMM completed the Antero Acquisition for approximately $380 million. The assets acquired by CMM consisted of a 33 mile low pressure gathering system which delivers Antero’s Marcellus Shale production to various regional pipeline systems including Columbia, Dominion, Equitrans and MarkWest Energy Partners’ Sherwood Gas Processing Plant.
The GGA with Antero provides for an area of dedication at the time of acquisition of approximately 127,000 gross acres, or 104,000 net acres, largely located in the rich gas corridor of the southwestern core of the Marcellus Shale play. As part of the GGA, Antero committed to deliver minimum annual throughput volumes to us for a seven year period from January 1, 2012 to January 1, 2019, ranging from an average of 300 million cubic feet per day (MMcf/d) in 2012 to an average of 450 MMcf/d in 2018. During the period ended December 31, 2012, Antero delivered less than the minimum annual throughput volumes and at December 31, 2012, we recorded a receivable and deferred revenue of approximately $2.6 million due to Antero’s potential ability to recover this amount if Antero’s 2013 throughput volumes exceed the minimum annual throughput volumes included in the GGA for 2013.
The final purchase price allocation is as follows (In thousands):
| Cash |
$ | 381,718 | ||
|
|
|
|||
| Total purchase price |
$ | 381,718 | ||
|
|
|
|||
| Purchase price allocation: |
||||
| Property, plant and equipment |
$ | 90,562 | ||
| Intangible assets |
291,218 | |||
|
|
|
|||
| Total assets |
$ | 381,780 | ||
|
|
|
|||
| Asset retirement obligation |
$ | 62 | ||
|
|
|
|||
| Total liabilities |
$ | 62 | ||
|
|
|
|||
| Total |
$ | 381,718 | ||
|
|
|
|||
Our intangible assets recorded as a result of the Antero Acquisition relate to the GGA with Antero. These intangible assets will be amortized over the life of the contract. For the period from the acquisition date (March 26, 2012) to June 30, 2012, we recorded approximately $ 7 million of operating revenues and $5 million of operating expenses related to the operations of the assets acquired from Antero.
Devon Acquisition
On August 24, 2012, we completed the acquisition of certain gathering and processing assets in the NGL rich gas region of the Barnett Shale from Devon Energy Corporation (Devon) for approximately $87 million (Devon Acquisition). The final purchase price allocation is pending the completion of the valuation of the assets acquired and liabilities assumed.
8
The preliminary purchase price allocation is as follows (In thousands):
| Cash |
$ | 87,247 | ||
|
|
|
|||
| Total purchase price |
$ | 87,247 | ||
|
|
|
|||
| Preliminary purchase price allocation: |
||||
| Property, plant and equipment |
$ | 41,555 | ||
| Intangible assets |
46,959 | |||
|
|
|
|||
| Total assets |
$ | 88,514 | ||
|
|
|
|||
| Asset retirement obligation |
$ | 540 | ||
| Property tax liability |
527 | |||
| Environmental liability |
200 | |||
|
|
|
|||
| Total liabilities |
$ | 1,267 | ||
|
|
|
|||
| Total |
$ | 87,247 | ||
|
|
|
|||
Our intangible assets recorded as a result of the Devon Acquisition relate to the 20 year fixed-fee gathering, processing and compression agreement with Devon. These intangible assets will be amortized over the life of the contract.
We believe that it is impracticable to present financial information for the acquired assets prior to the acquisition date due to the lack of availability of historical financial information related to the acquired assets, and because the 20 year fixed-fee gathering, processing and compression agreement with Devon has significantly different terms than the historical intercompany relationships between the acquired assets and Devon.
EMAC Acquisition
On December 28, 2012, CMM acquired all of the membership interest of EMAC from Enerven Compression, LLC (Enerven) for approximately $95 million. We financed this acquisition through our CMM credit facility. At the time of acquisition, EMAC’s assets consisted of four compression and dehydration stations located on our gathering systems in Harrison County, West Virginia. These assets provide compression and dehydration services to Antero under a compression services agreement through 2018. Antero has the option to renew the agreement for an additional five years upon expiration of the original agreement. The final purchase price allocation is pending the completion of the valuation of the assets acquired and liabilities assumed.
The preliminary purchase price allocation is as follows (In thousands):
| Cash |
$ | 95,000 | ||
|
|
|
|||
| Total purchase price |
$ | 95,000 | ||
|
|
|
|||
| Preliminary purchase price allocation: |
||||
| Property, plant and equipment |
$ | 45,938 | ||
| Intangible assets |
49,817 | |||
|
|
|
|||
| Total assets |
$ | 95,755 | ||
|
|
|
|||
| Asset retirement obligation |
$ | 755 | ||
|
|
|
|||
| Total liabilities |
$ | 755 | ||
|
|
|
|||
| Total |
$ | 95,000 | ||
|
|
|
|||
Our intangible assets recorded as a result of the EMAC acquisition relate to the compression services agreements with Antero. These intangible assets will be amortized over the life of the contract. Pro forma information has not been provided for the acquisition of the EMAC assets as the impact is immaterial to our financial statements.
9
Divestitures
On July 25, 2013, we sold a cryogenic plant and associated equipment for approximately $11 million, net of fees. At June 30, 2013, we have classified these assets as held for sale at their historical book value of approximately $7 million.
4. NET INCOME PER LIMITED PARTNER UNIT AND DISTRIBUTIONS
Earnings Per Limited Partner Unit. Our net income is allocated to the General Partner and the limited partners, in accordance with their respective ownership percentages, after giving effect to incentive distributions paid to the General Partner. To the extent cash distributions exceed net income, the excess distributions are allocated proportionately to all participating units outstanding based on their respective ownership percentages. Basic earnings per unit are computed by dividing net income attributable to limited partner unitholders by the weighted-average number of limited partner units outstanding during each period. Diluted earnings per unit are computed using the treasury stock method, which considers the impact to net income and limited partner units from the potential issuance of limited partner units.
The tables below show the (i) allocation of net income attributable to limited partners and the (ii) net income per limited partner unit based on the number of basic and diluted limited partner units outstanding for the three and six months ended June 30, 2013 and 2012.
Allocation of Net Income to General Partner and Limited Partners
| Three Months Ended | Six Months Ended | |||||||||||||||
| June 30, | June 30, | |||||||||||||||
| 2013 | 2012 | 2013 | 2012 | |||||||||||||
| (In thousands) | ||||||||||||||||
| Net income |
$ | 4,870 | $ | 6,798 | $ | 13,828 | $ | 16,603 | ||||||||
| General Partner’s incentive distributions |
(5,104 | ) | (3,280 | ) | (10,140 | ) | (6,535 | ) | ||||||||
|
|
|
|
|
|
|
|
|
|||||||||
| Net income (loss) after incentive distributions |
(234 | ) | 3,518 | 3,688 | 10,068 | |||||||||||
| General Partner’s interest in net income after incentive distributions |
(88 | ) | (874 | ) | (253 | ) | (987 | ) | ||||||||
|
|
|
|
|
|
|
|
|
|||||||||
| Limited Partners’ interest in net income (loss) after distributions |
$ | (322 | ) | $ | 2,644 | $ | 3,435 | $ | 9,081 | |||||||
|
|
|
|
|
|
|
|
|
|||||||||
10
Net Income Per Limited Partner Unit
| Three Months Ended | Six Months Ended | |||||||||||||||
| June 30, | June 30, | |||||||||||||||
| 2013 | 2012 | 2013 | 2012 | |||||||||||||
| (In thousands, except per unit data) | ||||||||||||||||
| Limited partners’ interest in net income |
$ | (322 | ) | $ | 2,644 | $ | 3,435 | $ | 9,081 | |||||||
| Weighted-average limited partner units—basic (1) |
60,004 | 43,333 | 57,400 | 43,014 | ||||||||||||
| Effect of unvested phantom units |
— | 201 | 273 | 190 | ||||||||||||
|
|
|
|
|
|
|
|
|
|||||||||
| Weighted-average limited partner units—diluted (1) |
60,004 | 43,534 | 57,673 | 43,204 | ||||||||||||
|
|
|
|
|
|
|
|
|
|||||||||
| Basic earnings (loss) per unit: |
||||||||||||||||
| Net income (loss) per limited partner |
$ | (0.01 | ) | $ | 0.06 | $ | 0.06 | $ | 0.21 | |||||||
| Diluted earnings (loss) per unit: |
||||||||||||||||
| Net income (loss) per limited partner |
$ | (0.01 | ) | $ | 0.06 | $ | 0.06 | $ | 0.21 | |||||||
| (1) | The three months ended June 30, 2013 includes 6,275,229 Class D units. The six months ended June 30, 2013 includes 9,610,969 Class C and Class D units. The three and six months ended June 30, 2012 includes 6,791,526 and 6,727,074 Class C units. |
There were 274 unvested phantom units excluded from our diluted earnings per unit as our limited partners’ interest in net income was a loss for the three months ended June 30, 2013. There were no units excluded from our diluted earnings per unit as we do not have any anti-dilutive units for the six months ended June 30, 2013 and the three and six months ended June 30, 2012.
Distributions. Our Second Amended and Restated Agreement of Limited Partnership, dated February 19, 2008, as amended (Partnership Agreement), requires that, within 45 days after the end of each quarter, we distribute all of our Available Cash (as defined therein) to unitholders of record on the applicable record date, as determined by our General Partner.
The following table presents distributions for 2013 and 2012 (In millions, except per unit data):
| Distributions Paid | ||||||||||||||||||||||||||||||||||||||
| Limited Partner | General Partner | |||||||||||||||||||||||||||||||||||||
| Payment Date |
Attributable to the Quarter Ended |
Per
Unit Distribution |
Cash paid to common(1) |
Paid-In-Kind
Value to Class C unitholders |
Paid-In-Kind
Value to Class D unitholder |
Cash paid to General Partner and IDR |
Paid-In-Kind
Value to Class C unitholder |
Paid-In-Kind
Value to Class D unitholder |
Total Cash |
Total Distribution |
||||||||||||||||||||||||||||
| 2013 |
||||||||||||||||||||||||||||||||||||||
| August 9, 2013 |
June 30, 2013 | $ | 0.51 | $ | 27.5 | $ | — | $ | 3.2 | $ | 5.2 | $ | — | $ | 0.5 | $ | 32.7 | $ | 36.4 | |||||||||||||||||||
| May 10, 2013 |
March 31, 2013 | $ | 0.51 | $ | 27.4 | $ | — | $ | 3.2 | $ | 5.2 | $ | — | $ | 0.5 | $ | 32.6 | $ | 36.3 | |||||||||||||||||||
| February 12, 2013 |
December 31, 2012 | $ | 0.51 | $ | 21.0 | $ | 3.7 | $ | — | $ | 4.1 | $ | 0.6 | $ | — | $ | 25.1 | $ | 29.4 | |||||||||||||||||||
| 2012 |
||||||||||||||||||||||||||||||||||||||
| November 9, 2012 |
September 30, 2012 | $ | 0.51 | $ | 21.0 | $ | 3.5 | $ | — | $ | 4.1 | $ | 0.6 | $ | — | $ | 25.1 | $ | 29.2 | |||||||||||||||||||
| August 10, 2012 |
June 30, 2012 | $ | 0.50 | $ | 20.6 | $ | 3.4 | $ | — | $ | 3.7 | $ | 0.5 | $ | — | $ | 24.3 | $ | 28.2 | |||||||||||||||||||
| May 11, 2012 |
March 31, 2012 | $ | 0.50 | $ | 18.2 | $ | 3.4 | $ | — | $ | 3.3 | $ | 0.5 | $ | — | $ | 21.5 | $ | 25.4 | |||||||||||||||||||
| February 10, 2012 |
December 31, 2011 | $ | 0.49 | $ | 17.9 | $ | 3.2 | $ | — | $ | 2.8 | $ | 0.5 | $ | — | $ | 20.7 | $ | 24.4 | |||||||||||||||||||
| (1) | Distributions for the quarter ended June 30, 2012 exclude approximately $3 million paid by CMM to Crestwood Holdings. |
Our Class D units are substantially similar in all respects to our existing common units, representing limited partner interests, except that we have the option to pay distributions to our Class D unitholders with cash or by issuing additional Paid-In-Kind Class D units, based upon the volume weighted-average price of our common units for the 10 trading days immediately preceding the date the distribution is declared. We issued 151,238 additional Class D units in lieu of paying cash quarterly distributions on our Class D units attributable to the quarter ended March 31, 2013.
11
On April 1, 2013, our outstanding Class C units converted to common units on a one-for-one basis. Prior to the conversion of our Class C units to common, we had the options to pay distributions to our Class C unitholders with cash or by issuing additional Paid-In-Kind Class C units, based upon the volume weighted-average price of our common units for the 10 trading days immediately preceding the date the distribution is declared. The unitholders of the converted units received a quarterly cash distribution for the period ended March 31, 2013 although the Class C units were not converted until April 1, 2013. We issued 136,128 and 138,731 additional Class C units in lieu of paying cash quarterly distributions on our Class C units attributable to the quarters ended March 31, 2012 and June 30, 2012.
On March 22, 2013, we completed a public offering of 4,500,000 common units, representing limited partner interests in us, at a price of $23.90 per common unit ($23.00 per common unit, net of underwriting discounts) providing net proceeds of approximately $103.5 million. We granted the underwriters a 30-day option to purchase up to 675,000 additional common units if the underwriters sold more than 4,500,000 common units in the offering. The underwriters exercised this option on April 5, 2013 providing net proceeds of approximately $15.5 million. The unitholders of these common units received a quarterly distribution for the period ended March 31, 2013. In connection with the issuance of the common units, our General Partner did not make an additional capital contribution to us resulting in a reduction in their general partner interest in us to approximately 1.8% at June 30, 2013.
See our 2012 Annual Report on Form 10-K for additional information regarding our distributions.
5. FINANCIAL INSTRUMENTS
Fair Values
We separate the fair values of our financial instruments into three levels (Levels 1, 2 and 3) based on our assessment of the availability of observable market data and the significance of non-observable data used to determine fair value. Our assessment and classification of an instrument within a level can change over time based on the maturity or liquidity of the instrument and would be reflected at the end of the period in which the change occurs. At June 30, 2013 and December 31, 2012, there have been no changes to the inputs and valuation techniques used to measure fair value, the types of instruments, or the levels in which they are classified.
Cash and Cash Equivalents, Accounts Receivable and Accounts Payable. As of June 30, 2013 and December 31, 2012, the carrying amounts of cash and cash equivalents, accounts receivable and accounts payable represent fair value based on the short-term nature of these instruments.
Credit Facilities. The fair value of our credit facilities approximates their carrying amounts as of June 30, 2013 and December 31, 2012 due primarily to the variable nature of the interest rate of the instrument, which is considered a Level 2 fair value measurement.
Senior Notes. We estimated the fair value of our 7.75% Senior Notes due April 2019 (Senior Notes) (representing a Level 2 fair value measurement) primarily based on quoted market prices for the same or similar issuances. The following table reflects the carrying value and fair value of our Senior Notes (In millions):
| June 30, 2013 | December 31, 2012 | |||||||||||||||
| Carrying Amount |
Fair Value |
Carrying Amount |
Fair Value |
|||||||||||||
| Senior Notes |
$ | 351 | $ | 362 | $ | 351 | $ | 365 | ||||||||
Debt
Our long-term debt consists of the following (In thousands):
| June 30, 2013 |
December 31, 2012 |
|||||||
| CMM Credit Facility, due March 2017 |
$ | 127,400 | $ | 127,000 | ||||
| CMLP Credit Facility, due November 2017 |
300,200 | 206,700 | ||||||
| Senior Notes, due April 2019 |
350,000 | 350,000 | ||||||
|
|
|
|
|
|||||
| 777,600 | 683,700 | |||||||
| Plus: Unamortized premium on Senior Notes |
1,344 | 1,461 | ||||||
|
|
|
|
|
|||||
| Total long-term debt |
$ | 778,944 | $ | 685,161 | ||||
|
|
|
|
|
|||||
12
Credit Facilities
CMM Credit Facility. The CMM credit agreement, dated March 26, 2012 (CMM Credit Facility) allows for revolving loans, letters of credit and swingline loans in an aggregate principal amount of up to $200 million. The CMM Credit Facility is secured by substantially all of CMM’s assets.
Borrowings under the CMM Credit Facility bear interest at the London Interbank Offered Rate (LIBOR) plus an applicable margin or base rate as defined in the CMM Credit Facility. Under the terms of the CMM Credit Facility, the applicable margin under LIBOR was 2.5% at both June 30, 2013 and December 31, 2012. The weighted-average interest rate at both June 30, 2013 and December 31, 2012 was 2.8%. Based on our results through June 30, 2013, our remaining available capacity under the CMM Credit Facility was $73 million. For the three and six months ended June 30, 2013, our average outstanding borrowings were approximately $102 million and $112 million. For the three and six months ended June 30, 2013, our maximum outstanding borrowings were approximately $127 million and $130 million.
The CMM Credit Facility requires CMM to maintain:
| • | a ratio of trailing 12-month EBITDA (as defined in the CMM Credit Facility) to net interest expense of not less than 2.0 to 1.0; and |
| • | a ratio of total indebtedness to trailing 12-month EBITDA (as defined in the CMM Credit Facility) of not more than 4.5 to 1.0, or not more than 5.0 to 1.0 for up to nine months following certain acquisitions. |
CMLP Credit Facility. Our amended and restated senior secured credit agreement, dated November 16, 2012 (CMLP Credit Facility), allows for revolving loans, letters of credit and swingline loans in an aggregate amount of up to $550 million. The CMLP Credit Facility is secured by substantially all of CMLP’s assets and those of certain of its subsidiaries. As of June 30, 2013, the CMLP Credit Facility is guaranteed by our 100% owned subsidiaries except for CMM and its consolidated subsidiaries.
Borrowings under the CMLP Credit Facility bear interest at LIBOR plus an applicable margin or a base rate as defined in the CMLP Credit Facility. Under the terms of the CMLP Credit Facility, the applicable margin under LIBOR borrowings was 2.8% and 2.5% at June 30, 2013 and December 31, 2012. The weighted-average interest rate as of June 30, 2013 and December 31, 2012 was 3.0% and 2.8%. Based on our results through June 30, 2013, our remaining available capacity under the CMLP Credit Facility was $111 million. For the three and six months ended June 30, 2013, our average outstanding borrowings were $312 million and $324 million. For the three and six months ended June 30, 2013, our maximum outstanding borrowings were $328 million and $373 million.
Our CMLP Credit Facility requires us to maintain:
| • | a ratio of our consolidated trailing 12-month EBITDA (as defined in the CMLP Credit Facility) to our net interest expense of not less than 2.5 to 1.0; and |
| • | a ratio of total indebtedness to consolidated trailing 12-month EBITDA (as defined in the CMLP Credit Facility) of not more than 5.0 to 1.0, or not more than 5.5 to 1.0 for up to nine months following certain acquisitions. |
As of June 30, 2013, we were in compliance with the financial covenants under each of the CMM and CMLP Credit Facilities.
Our credit facilities contain restrictive covenants that prohibit the declaration or payment of distributions by us if a default then exists or would result therefrom, and otherwise limits the amount of distributions that we can make. An event of default may result in the acceleration of our repayment of outstanding borrowings under our credit facilities, the termination of our credit facilities and foreclosure on collateral.
Senior Notes
In November 2012, we issued $150 million aggregate principal amount of 7.75% Senior Notes in a private placement offering. These notes were issued as additional notes under the indenture dated April 1, 2011 among us, Crestwood Midstream Finance Corporation, the guarantors names therein, and The Bank of New York Mellon Trust Company, N.A., as trustee, pursuant to which we previously issued our $200 million aggregate principal amount of 7.75% Senior Notes in April 2011. Our Senior Notes require us to maintain a ratio of our consolidated trailing 12-month EBITDA (as defined in the indenture governing the Senior Notes) to fixed charges of at least 1.75 to 1.0. As of June 30, 2013, we were in compliance with this covenant. For additional information regarding our Senior Notes, see our 2012 Annual Report on Form 10-K.
13
6. ACCOUNTS PAYABLE, ACCRUED EXPENSES AND OTHER LIABILITIES
Accounts payable, accrued expenses and other liabilities consist of the following (In thousands):
| June 30, 2013 |
December 31, 2012 |
|||||||
| Accrued expenses |
$ | 9,232 | $ | 9,608 | ||||
| Accrued property taxes |
4,713 | 5,638 | ||||||
| Accrued product purchases payable |
2,014 | 2,450 | ||||||
| Tax payable |
1,297 | 2,159 | ||||||
| Interest payable |
7,791 | 7,505 | ||||||
| Accounts payable |
8,914 | 2,278 | ||||||
| Other |
95 | 79 | ||||||
|
|
|
|
|
|||||
| Total accounts payable, accrued expenses and other liabilities |
$ | 34,056 | $ | 29,717 | ||||
|
|
|
|
|
|||||
7. COMMITMENTS AND CONTINGENT LIABILITIES
Legal Proceedings
Class Action Lawsuits. Five putative class action lawsuits challenging the Crestwood-Inergy merger have been filed, four in federal court in the United States District Court for the Southern District of Texas: (i) Abraham Knoll v. Robert G. Phillips, et al. (Case No. 4:13-cv-01528); (ii) Greg Podell v. Crestwood Midstream Partners, LP, et al. (Case No. 4:13-cv-01599); (iii) Johnny Cooper v. Crestwood Midstream Partners LP, et al. (Case No. 4:13-cv-01660); and (iv) Steven Elliot LLC v. Robert G. Phillips, et al. (Case No. 4:13-cv-01763), and one in Delaware Chancery Court, Hawley v. Crestwood Midstream Partners LP, et al. (Case No. 8689-VCL). All of the cases name Crestwood, Crestwood Gas Services GP LLC, Crestwood Holdings LLC, the current and former directors of Crestwood Gas Services GP LLC, Inergy, L.P., Inergy Midstream, L.P., NRGM GP, LLC, and Intrepid Merger Sub, LLC as defendants. All of the suits are brought by a purported holder of common units of Crestwood, both individually and on behalf of a putative class consisting of holders of common units of Crestwood. The lawsuits generally allege, among other things, that the directors of Crestwood Gas Services GP LLC breached their fiduciary duties to holders of common units of Crestwood by agreeing to a transaction with inadequate consideration and unfair terms and pursuant to an inadequate process. The lawsuits further allege that Inergy, L.P., Inergy Midstream, L.P., NRGM GP, LLC, and Intrepid Merger Sub, LLC aided and abetted the Crestwood directors in the alleged breach of their fiduciary duties. The lawsuits seek, in general, (i) injunctive relief enjoining the merger, (ii) in the event the merger is consummated, rescission or an award of rescissory damages, (iii) an award of plaintiffs’ costs, including reasonable attorneys’ and experts’ fees, (iv) the accounting by the defendants to plaintiffs for all damages caused by the defendants, and (v) such further equitable relief as the court deems just and proper. Certain of the actions also assert claims of inadequate disclosure under Sections 14(a) and 20(a) of the Securities Exchange Act of 1934, and the Elliot case also names Citigroup Global Markets Inc. as an alleged aider and abettor. The plaintiff in the Hawley action in Delaware filed a motion for expedited proceedings but subsequently withdrew that motion and then filed a stipulation voluntarily dismissing the action without prejudice, which has been granted by the Court, such that the Hawley action has now been dismissed. The plaintiffs in the Knoll, Podell, Cooper, and Elliot actions filed an unopposed motion to consolidate these four cases, which the Court granted. The plaintiff in the Elliot action filed a motion for expedited discovery, which remains pending. These lawsuits are at a preliminary stage. Crestwood, Inergy Midstream and the other defendants believe that these lawsuits are without merit and intend to defend against them vigorously.
From time to time, we are party to certain legal or administrative proceedings that arise in the ordinary course and are incidental to our business. There are currently no such pending proceedings to which we are a party that our management believes will have a material adverse effect on our results of operations, cash flows or financial condition. However, future events or circumstances, currently unknown to management, will determine whether the resolution of any litigation or claims will ultimately have a material effect on our results of operations, cash flows or financial condition in any future reporting periods. As of June 30, 2013, we had no amounts accrued for our legal proceedings. At December 31, 2012, we had less than $0.1 million accrued for our legal proceedings.
Regulatory Compliance
In the ordinary course of our business, we are subject to various laws and regulations. In the opinion of our management, compliance with current laws and regulations will not have a material effect on our results of operations, cash flows or financial condition.
Environmental Compliance
Our operations are subject to stringent and complex laws and regulations pertaining to health, safety, and the environment. We are subject to laws and regulations at the federal, state and local levels that relate to air and water quality, hazardous and solid waste
14
management and disposal and other environmental matters. The cost of planning, designing, constructing and operating our facilities must incorporate compliance with environmental laws and regulations and safety standards. Failure to comply with these laws and regulations may trigger a variety of administrative, civil and potentially criminal enforcement measures. At June 30, 2013 and December 31, 2012, we had accrued approximately $0.3 million and $0.2 million for environmental matters, which is based on our undiscounted estimate of amounts we will spend on environmental compliance and remediation. We estimate that our potential liability for reasonably possible outcomes related to our environmental exposures could range from approximately $0.3 million to $0.4 million.
8. INCOME TAXES
No provision for federal or state income taxes is included in our results of operations as such income is taxable directly to the partners. Accordingly, each partner is responsible for its share of federal and state income tax. Net earnings for financial statement purposes may differ significantly from taxable income reportable to each partner as a result of differences between the tax basis and financial reporting basis of assets and liabilities.
We are responsible for our portion of the Texas Margin tax that is included in Crestwood Holdings’ consolidated Texas franchise tax return. Our current tax liability will be assessed based on 0.7% of the gross revenue apportioned to Texas. The margin tax qualifies as an income tax under GAAP, which requires us to recognize the impact of this tax on the temporary differences between the financial statement assets and liabilities and their tax basis attributable to such tax. See our Form 8-K filed with the SEC on May 10, 2013 for more information about our income taxes.
9. EQUITY PLAN
Awards of phantom and restricted units have been granted under our Fourth Amended and Restated 2007 Equity Plan (2007 Equity Plan). The following table summarizes information regarding phantom and restricted unit activity during the six months ended June 30, 2013:
| Payable In Cash | Payable In Units | |||||||||||||||
| Units | Weighted- Average Grant Date Fair Value |
Units | Weighted- Average Grant Date Fair Value |
|||||||||||||
| Unvested—January 1, 2013 |
8,312 | $ | 26.45 | 221,992 | $ | 28.35 | ||||||||||
| Vested—phantom units |
(518 | ) | $ | 27.72 | (71,006 | ) | $ | 28.70 | ||||||||
| Vested—restricted units |
— | — | (8,015 | ) | $ | 27.47 | ||||||||||
| Granted—phantom units |
— | — | 161,807 | $ | 24.33 | |||||||||||
| Granted—restricted units |
— | — | 27,900 | $ | 24.86 | |||||||||||
| Canceled—phantom units |
(354 | ) | $ | 25.81 | (7,114 | ) | $ | 27.96 | ||||||||
|
|
|
|
|
|||||||||||||
| Unvested—June 30, 2013 |
7,440 | $ | 26.39 | 325,564 | $ | 25.99 | ||||||||||
|
|
|
|
|
|||||||||||||
As of June 30, 2013 and December 31, 2012, we had total unamortized compensation expense of approximately $5 million and $3 million related to phantom and restricted units, which we expect will be amortized over three years (the original vesting period of these instruments), except for grants to non-employee directors of our General Partner which vest over one year. Upon the occurrence of certain events, such as a change in control, the vesting period of our phantom and restricted units could be accelerated. We recognized compensation expense of approximately $1.4 million and $1.0 million during the six months ended June 30, 2013 and 2012, included in operating expenses on our consolidated statements of income. We granted phantom and restricted units with a grant date fair value of approximately $5 million during the six months ended June 30, 2013. As of June 30, 2013, we had 345,067 units available for issuance under the 2007 Equity Plan.
Under the 2007 Equity Plan, participants who have been granted restricted units may elect to have us withhold common units to satisfy minimum statutory tax withholding obligations arising in connection with the vesting of non-vested common units. Any such common units withheld are returned to the 2007 Equity Plan on the applicable vesting dates, which correspond to the times at which income is recognized by the employee. When we withhold these common units, we are required to remit to the appropriate taxing authorities the fair value of the units withheld as of the vesting date. The number of units withheld is determined based on the closing price per common unit as reported on the NYSE on such dates. During the six months ended June 30, 2013 and 2012, we withheld 2,429 common units and 414 common units to satisfy employee tax withholding obligations. The withholding of common units by us could be deemed a purchase of the common units.
15
10. TRANSACTIONS WITH RELATED PARTIES
We enter into transactions with our affiliates within the ordinary course of business. For a further discussion of our affiliated transactions, see our 2012 Annual Report on Form 10-K. Reimbursements from our affiliates were less than $1 million for the three and six months ended June 30, 2013 and 2012. The following table shows revenues and expenses from our affiliates for the three and six months ended June 30, 2013 and 2012 (In millions):
| Three Months Ended June 30, |
Six Months Ended June 30, |
|||||||||||||||
| 2013 | 2012 | 2013 | 2012 | |||||||||||||
| Operating revenues |
$ | 24 | $ | 28 | $ | 50 | $ | 59 | ||||||||
| Operating expenses |
13 | 5 | 26 | 10 | ||||||||||||
11. SEGMENT INFORMATION
We conduct our operations in the midstream sector with eight operating segments, four of which are reportable segments. These operating segments reflect the way we internally report the financial information used to make decisions and allocate resources in connection with our operations. We evaluate the performance of our operating segments based on EBITDA, which represents operating income plus depreciation, amortization and accretion expense and income tax expense.
Our reportable segments reflect the primary geographic areas in which we operate and consist of Marcellus, Barnett, Fayetteville and Granite Wash, all of which are located within the United States. Our reportable segments are engaged in the gathering, processing, treating, compression, transportation and sales of natural gas and delivery of NGLs. Our Other operating segment consists of those operating segments or reporting units that did not meet quantitative reporting thresholds.
For the six months ended June 30, 2013 and 2012, one of our customers in the Barnett segment, which is a related party, accounted for approximately 34% and 54% of our total revenues in the Barnett segment. In our Marcellus segment, one customer accounted for approximately 21% of our revenues for the six months ended June 30, 2013. In addition, in our Fayetteville segment, one customer accounted for approximately 10% of our total revenues for the six months ended June 30, 2012.
The following table is a reconciliation of net income to EBITDA (In thousands):
| Three Months Ended | Six Months Ended | |||||||||||||||
| June 30, | June 30, | |||||||||||||||
| 2013 | 2012 | 2013 | 2012 | |||||||||||||
| Net income |
$ | 4,870 | $ | 6,798 | $ | 13,828 | $ | 16,603 | ||||||||
| Add: |
||||||||||||||||
| Interest and debt expense |
11,185 | 8,963 | 22,635 | 16,520 | ||||||||||||
| Income tax expense |
339 | 275 | 677 | 578 | ||||||||||||
| Depreciation, amortization and accretion expense |
17,701 | 13,695 | 35,061 | 24,341 | ||||||||||||
|
|
|
|
|
|
|
|
|
|||||||||
| EBITDA |
$ | 34,095 | $ | 29,731 | $ | 72,201 | $ | 58,042 | ||||||||
|
|
|
|
|
|
|
|
|
|||||||||
16
The following tables summarize the reportable segment data for the three and six months ended June 30, 2013 and 2012 (In thousands):
| Three Months Ended June 30, 2013 | ||||||||||||||||||||||||||||
| Marcellus | Barnett | Fayetteville | Granite Wash |
Other | Corporate | Total | ||||||||||||||||||||||
| Operating revenues |
$ | 15,309 | $ | 8,994 | $ | 6,331 | $ | 13,221 | $ | 2,663 | $ | — | $ | 46,518 | ||||||||||||||
| Operating revenues—related party |
88 | 24,078 | — | 415 | — | — | 24,581 | |||||||||||||||||||||
| Product purchases |
— | 146 | 190 | 4,614 | 1,204 | — | 6,154 | |||||||||||||||||||||
| Product purchases—related party |
— | — | — | 7,878 | — | — | 7,878 | |||||||||||||||||||||
| Operations and maintenance expense |
2,545 | 6,312 | 2,310 | 685 | 740 | — | 12,592 | |||||||||||||||||||||
| General and administrative expense |
— | — | — | — | — | 10,380 | 10,380 | |||||||||||||||||||||
|
|
|
|
|
|
|
|
|
|
|
|
|
|
|
|||||||||||||||
| EBITDA |
$ | 12,852 | $ | 26,614 | $ | 3,831 | $ | 459 | $ | 719 | $ | (10,380 | ) | $ | 34,095 | |||||||||||||
|
|
|
|
|
|
|
|
|
|
|
|
|
|
|
|||||||||||||||
| Goodwill |
$ | — | $ | — | $ | 76,767 | $ | 14,211 | $ | 4,053 | $ | — | $ | 95,031 | ||||||||||||||
| Total assets |
$ | 587,434 | $ | 604,447 | $ | 298,902 | $ | 81,875 | $ | 79,328 | $ | 27,944 | $ | 1,679,930 | ||||||||||||||
| Capital expenditures |
$ | 48,468 | $ | 3,210 | $ | 1,756 | $ | 1,604 | $ | 915 | $ | 71 | $ | 56,024 | ||||||||||||||
| Three Months Ended June 30, 2012 | ||||||||||||||||||||||||||||
| Marcellus | Barnett | Fayetteville | Granite Wash |
Other | Corporate | Total | ||||||||||||||||||||||
| Operating revenues |
$ | 7,027 | $ | 3,337 | $ | 6,330 | $ | 7,722 | $ | 2,647 | $ | — | $ | 27,063 | ||||||||||||||
| Operating revenues—related party |
— | 28,166 | — | — | — | — | 28,166 | |||||||||||||||||||||
| Product purchases |
— | — | 124 | 6,732 | 585 | — | 7,441 | |||||||||||||||||||||
| Operations and maintenance expense |
513 | 5,345 | 2,231 | 541 | 770 | — | 9,400 | |||||||||||||||||||||
| General and administrative expense |
— | — | — | — | — | 8,657 | 8,657 | |||||||||||||||||||||
|
|
|
|
|
|
|
|
|
|
|
|
|
|
|
|||||||||||||||
| EBITDA |
$ | 6,514 | $ | 26,158 | $ | 3,975 | $ | 449 | $ | 1,292 | $ | (8,657 | ) | $ | 29,731 | |||||||||||||
|
|
|
|
|
|
|
|
|
|
|
|
|
|
|
|||||||||||||||
| Goodwill |
$ | — | $ | — | $ | 76,767 | $ | 14,211 | $ | — | $ | — | $ | 90,978 | ||||||||||||||
| Total assets |
$ | 427,692 | $ | 537,333 | $ | 305,767 | $ | 77,031 | $ | 82,774 | $ | 17,301 | $ | 1,447,898 | ||||||||||||||
| Capital expenditures |
$ | 838 | $ | 4,132 | $ | 886 | $ | 675 | $ | 2,660 | $ | 293 | $ | 9,484 | ||||||||||||||
17
| Six Months Ended June 30, 2013 | ||||||||||||||||||||||||||||
| Marcellus | Barnett | Fayetteville | Granite Wash |
Other | Corporate | Total | ||||||||||||||||||||||
| Operating revenues |
$ | 29,583 | $ | 18,390 | $ | 13,584 | $ | 26,635 | $ | 5,153 | $ | — | $ | 93,345 | ||||||||||||||
| Operating revenues—related party |
88 | 49,232 | — | 850 | — | — | 50,170 | |||||||||||||||||||||
| Product purchases |
— | 401 | 483 | 10,064 | 1,954 | — | 12,902 | |||||||||||||||||||||
| Product purchases—related party |
— | — | — | 14,635 | — | — | 14,635 | |||||||||||||||||||||
| Operations and maintenance expense |
4,942 | 13,567 | 4,444 | 1,293 | 1,362 | — | 25,608 | |||||||||||||||||||||
| General and administrative expense |
— | — | — | — | — | 18,169 | 18,169 | |||||||||||||||||||||
|
|
|
|
|
|
|
|
|
|
|
|
|
|
|
|||||||||||||||
| EBITDA |
$ | 24,729 | $ | 53,654 | $ | 8,657 | $ | 1,493 | $ | 1,837 | $ | (18,169 | ) | $ | 72,201 | |||||||||||||
|
|
|
|
|
|
|
|
|
|
|
|
|
|
|
|||||||||||||||
| Goodwill |
$ | — | $ | — | $ | 76,767 | $ | 14,211 | $ | 4,053 | $ | — | $ | 95,031 | ||||||||||||||
| Total assets |
$ | 587,434 | $ | 604,447 | $ | 298,902 | $ | 81,875 | $ | 79,328 | $ | 27,944 | $ | 1,679,930 | ||||||||||||||
| Capital expenditures |
$ | 64,721 | $ | 8,769 | $ | 2,712 | $ | 2,523 | $ | 1,160 | $ | 412 | $ | 80,297 | ||||||||||||||
| Six Months Ended June 30, 2012 | ||||||||||||||||||||||||||||
| Marcellus | Barnett | Fayetteville | Granite Wash |
Other | Corporate | Total | ||||||||||||||||||||||
| Operating revenues |
$ | 7,027 | $ | 6,663 | $ | 13,194 | $ | 17,319 | $ | 5,976 | $ | — | $ | 50,179 | ||||||||||||||
| Operating revenues—related party |
— | 58,783 | — | — | — | — | 58,783 | |||||||||||||||||||||
| Product purchases |
— | — | 206 | 15,033 | 1,175 | — | 16,414 | |||||||||||||||||||||
| Operations and maintenance expense |
513 | 11,475 | 4,544 | 1,059 | 1,520 | — | 19,111 | |||||||||||||||||||||
| General and administrative expense |
— | — | — | — | — | 15,395 | 15,395 | |||||||||||||||||||||
|
|
|
|
|
|
|
|
|
|
|
|
|
|
|
|||||||||||||||
| EBITDA |
$ | 6,514 | $ | 53,971 | $ | 8,444 | $ | 1,227 | $ | 3,281 | $ | (15,395 | ) | $ | 58,042 | |||||||||||||
|
|
|
|
|
|
|
|
|
|
|
|
|
|
|
|||||||||||||||
| Goodwill |
$ | — | $ | — | $ | 76,767 | $ | 14,211 | $ | — | $ | — | $ | 90,978 | ||||||||||||||
| Total assets |
$ | 427,692 | $ | 537,333 | $ | 305,767 | $ | 77,031 | $ | 82,774 | $ | 17,301 | $ | 1,447,898 | ||||||||||||||
| Capital expenditures |
$ | 838 | $ | 5,999 | $ | 8,954 | $ | 1,963 | $ | 4,185 | $ | 434 | $ | 22,373 | ||||||||||||||
18
12. CONDENSED CONSOLIDATING FINANCIAL STATEMENTS
The CMLP Credit Facility and our Senior Notes are fully and unconditionally guaranteed, jointly and severally, by CMLP’s present and future direct and indirect 100% owned subsidiaries (the Guarantor Subsidiaries), except for CMM and its consolidated subsidiaries (the Non-Guarantor Subsidiaries). CMLP (Issuer) issued the Senior Notes together with Crestwood Midstream Finance Corporation (Co-Issuer). The Co-Issuer is our 100% owned subsidiary and has no material assets, operations, revenues or cash flows other than those related to its service as co-issuer of our Senior Notes. Accordingly, it has no ability to service obligations on our debt securities.
The following reflects condensed consolidating financial information of the Issuer, Co-Issuer, Guarantor Subsidiaries, Non-Guarantor Subsidiaries, eliminating entries to combine the entities and our consolidated results as of June 30, 2013 and December 31, 2012 and for the three and six months ended June 30, 2013 and 2012.
| For the Three Months Ended June 30, 2013 | ||||||||||||||||||||||||
| Issuer | Co-Issuer | Guarantor Subsidiaries |
Non-Guarantor Subsidiaries |
Eliminations | Consolidated | |||||||||||||||||||
| (In thousands) | ||||||||||||||||||||||||
| Operating revenues |
$ | — | $ | — | $ | 55,790 | $ | 15,309 | $ | — | $ | 71,099 | ||||||||||||
| Operating expenses |
202 | — | 46,709 | 7,794 | — | 54,705 | ||||||||||||||||||
|
|
|
|
|
|
|
|
|
|
|
|
|
|||||||||||||
| Operating income (loss) |
(202 | ) | — | 9,081 | 7,515 | — | 16,394 | |||||||||||||||||
| Interest and debt expense |
(10,108 | ) | — | (61 | ) | (1,016 | ) | — | (11,185 | ) | ||||||||||||||
|
|
|
|
|
|
|
|
|
|
|
|
|
|||||||||||||
| Income (loss) before income tax |
(10,310 | ) | — | 9,020 | 6,499 | — | 5,209 | |||||||||||||||||
| Income tax expense |
— | — | 339 | — | — | 339 | ||||||||||||||||||
|
|
|
|
|
|
|
|
|
|
|
|
|
|||||||||||||
| Income (loss) before earnings from consolidated subsidiaries |
(10,310 | ) | — | 8,681 | 6,499 | — | 4,870 | |||||||||||||||||
| Earnings (loss) from consolidated subsidiaries |
15,180 | — | — | — | (15,180 | ) | — | |||||||||||||||||
|
|
|
|
|
|
|
|
|
|
|
|
|
|||||||||||||
| Net income (loss) |
4,870 | — | 8,681 | 6,499 | (15,180 | ) | 4,870 | |||||||||||||||||
| General partner’s interest in net income |
5,192 | — | — | — | — | 5,192 | ||||||||||||||||||
|
|
|
|
|
|
|
|
|
|
|
|
|
|||||||||||||
| Limited partner’s interest in net income (loss) |
$ | (322 | ) | $ | — | $ | 8,681 | $ | 6,499 | $ | (15,180 | ) | $ | (322 | ) | |||||||||
|
|
|
|
|
|
|
|
|
|
|
|
|
|||||||||||||
| For the Three Months Ended June 30, 2012 | ||||||||||||||||||||||||
| Issuer | Co-Issuer | Guarantor Subsidiaries |
Non-Guarantor Subsidiaries |
Eliminations | Consolidated | |||||||||||||||||||
| (In thousands) | ||||||||||||||||||||||||
| Operating revenues |
$ | — | $ | — | $ | 48,202 | $ | 7,027 | $ | — | $ | 55,229 | ||||||||||||
| Operating expenses |
179 | — | 33,923 | 5,091 | — | 39,193 | ||||||||||||||||||
|
|
|
|
|
|
|
|
|
|
|
|
|
|||||||||||||
| Operating income (loss) |
(179 | ) | — | 14,279 | 1,936 | — | 16,036 | |||||||||||||||||
| Interest and debt expense |
(8,242 | ) | — | (44 | ) | (677 | ) | — | (8,963 | ) | ||||||||||||||
|
|
|
|
|
|
|
|
|
|
|
|
|
|||||||||||||
| Income (loss) before income tax |
(8,421 | ) | — | 14,235 | 1,259 | — | 7,073 | |||||||||||||||||
| Income tax expense |
— | — | 275 | — | — | 275 | ||||||||||||||||||
|
|
|
|
|
|
|
|
|
|
|
|
|
|||||||||||||
| Income (loss) before earnings from consolidated subsidiaries |
(8,421 | ) | — | 13,960 | 1,259 | — | 6,798 | |||||||||||||||||
| Earnings (loss) from consolidated subsidiaries |
15,219 | — | — | — | (15,219 | ) | — | |||||||||||||||||
|
|
|
|
|
|
|
|
|
|
|
|
|
|||||||||||||
| Net income (loss) |
6,798 | — | 13,960 | 1,259 | (15,219 | ) | 6,798 | |||||||||||||||||
| General partner’s interest in net income |
4,154 | — | — | — | — | 4,154 | ||||||||||||||||||
|
|
|
|
|
|
|
|
|
|
|
|
|
|||||||||||||
| Limited partner’s interest in net income (loss) |
$ | 2,644 | $ | — | $ | 13,960 | $ | 1,259 | $ | (15,219 | ) | $ | 2,644 | |||||||||||
|
|
|
|
|
|
|
|
|
|
|
|
|
|||||||||||||
19
| For the Six Months Ended June 30, 2013 | ||||||||||||||||||||||||
| Issuer | Co-Issuer | Guarantor Subsidiaries |
Non-Guarantor Subsidiaries |
Eliminations | Consolidated | |||||||||||||||||||
| (In thousands) | ||||||||||||||||||||||||
| Operating revenues |
$ | — | $ | — | $ | 113,932 | $ | 29,583 | $ | — | $ | 143,515 | ||||||||||||
| Operating expenses |
394 | — | 89,815 | 16,166 | — | 106,375 | ||||||||||||||||||
|
|
|
|
|
|
|
|
|
|
|
|
|
|||||||||||||
| Operating income (loss) |
(394 | ) | — | 24,117 | 13,417 | — | 37,140 | |||||||||||||||||
| Interest and debt expense |
(20,213 | ) | — | (133 | ) | (2,289 | ) | — | (22,635 | ) | ||||||||||||||
|
|
|
|
|
|
|
|
|
|
|
|
|
|||||||||||||
| Income (loss) before income tax |
(20,607 | ) | — | 23,984 | 11,128 | — | 14,505 | |||||||||||||||||
| Income tax expense |
— | — | 677 | — | — | 677 | ||||||||||||||||||
|
|
|
|
|
|
|
|
|
|
|
|
|
|||||||||||||
| Income (loss) before earnings from consolidated subsidiaries |
(20,607 | ) | — | 23,307 | 11,128 | — | 13,828 | |||||||||||||||||
| Earnings (loss) from consolidated subsidiaries |
34,435 | — | — | — | (34,435 | ) | — | |||||||||||||||||
|
|
|
|
|
|
|
|
|
|
|
|
|
|||||||||||||
| Net income (loss) |
13,828 | — | 23,307 | 11,128 | (34,435 | ) | 13,828 | |||||||||||||||||
| General partner’s interest in net income |
10,393 | — | — | — | — | 10,393 | ||||||||||||||||||
|
|
|
|
|
|
|
|
|
|
|
|
|
|||||||||||||
| Limited partner’s interest in net income (loss) |
$ | 3,435 | $ | — | $ | 23,307 | $ | 11,128 | $ | (34,435 | ) | $ | 3,435 | |||||||||||
|
|
|
|
|
|
|
|
|
|
|
|
|
|||||||||||||
| For the Six Months Ended June 30, 2012 | ||||||||||||||||||||||||
| Issuer | Co-Issuer | Guarantor Subsidiaries |
Non-Guarantor Subsidiaries |
Eliminations | Consolidated | |||||||||||||||||||
| (In thousands) | ||||||||||||||||||||||||
| Operating revenues |
$ | — | $ | — | $ | 101,935 | $ | 7,027 | $ | — | $ | 108,962 | ||||||||||||
| Operating expenses |
218 | — | 69,952 | 5,091 | — | 75,261 | ||||||||||||||||||
|
|
|
|
|
|
|
|
|
|
|
|
|
|||||||||||||
| Operating income (loss) |
(218 | ) | — | 31,983 | 1,936 | — | 33,701 | |||||||||||||||||
| Interest and debt expense |
(15,749 | ) | — | (94 | ) | (677 | ) | — | (16,520 | ) | ||||||||||||||
|
|
|
|
|
|
|
|
|
|
|
|
|
|||||||||||||
| Income (loss) before income tax |
(15,967 | ) | — | 31,889 | 1,259 | — | 17,181 | |||||||||||||||||
| Income tax expense |
— | — | 578 | — | — | 578 | ||||||||||||||||||
|
|
|
|
|
|
|
|
|
|
|
|
|
|||||||||||||
| Income (loss) before earnings from consolidated subsidiaries |
(15,967 | ) | — | 31,311 | 1,259 | — | 16,603 | |||||||||||||||||
| Earnings (loss) from consolidated subsidiaries |
32,570 | — | — | — | (32,570 | ) | — | |||||||||||||||||
|
|
|
|
|
|
|
|
|
|
|
|
|
|||||||||||||
| Net income (loss) |
16,603 | — | 31,311 | 1,259 | (32,570 | ) | 16,603 | |||||||||||||||||
| General partner’s interest in net income |
7,522 | — | — | — | — | 7,522 | ||||||||||||||||||
|
|
|
|
|
|
|
|
|
|
|
|
|
|||||||||||||
| Limited partner’s interest in net income (loss) |
$ | 9,081 | $ | — | $ | 31,311 | $ | 1,259 | $ | (32,570 | ) | $ | 9,081 | |||||||||||
|
|
|
|
|
|
|
|
|
|
|
|
|
|||||||||||||
20
| As of June 30, 2013 | ||||||||||||||||||||||||
| Issuer | Co-Issuer | Guarantor Subsidiaries |
Non-Guarantor Subsidiaries |
Eliminations | Consolidated | |||||||||||||||||||
| (In thousands) | ||||||||||||||||||||||||
| ASSETS | ||||||||||||||||||||||||
| Current assets |
||||||||||||||||||||||||
| Cash and cash equivalents |
$ | 84 | $ | — | $ | — | $ | 26 | $ | — | $ | 110 | ||||||||||||
| Accounts receivable |
6,266 | — | 10,365 | 5,141 | — | 21,772 | ||||||||||||||||||
| Accounts receivable—related party |
407,884 | 1 | 20,797 | — | (407,831 | ) | 20,851 | |||||||||||||||||
| Insurance receivable |
— | — | 3,496 | — | — | 3,496 | ||||||||||||||||||
| Prepaid expenses and other |
968 | — | 508 | — | — | 1,476 | ||||||||||||||||||
| Assets held for sale |
— | — | 6,680 | — | — | 6,680 | ||||||||||||||||||
|
|
|
|
|
|
|
|
|
|
|
|
|
|||||||||||||
| Total current assets |
415,202 | 1 | 41,846 | 5,167 | (407,831 | ) | 54,385 | |||||||||||||||||
| Investment in consolidated affiliates |
1,042,846 | — | — | — | (1,042,846 | ) | — | |||||||||||||||||
| Property, plant and equipment—net |
3,152 | — | 799,205 | 214,413 | — | 1,016,770 | ||||||||||||||||||
| Intangible assets—net |
— | — | 156,930 | 333,573 | — | 490,503 | ||||||||||||||||||
| Goodwill |
— | — | 95,031 | — | — | 95,031 | ||||||||||||||||||
| Deferred financing costs, net |
16,388 | — | — | 4,746 | — | 21,134 | ||||||||||||||||||
| Other assets |
1,032 | — | 1,075 | — | — | 2,107 | ||||||||||||||||||
|
|
|
|
|
|
|
|
|
|
|
|
|
|||||||||||||
| Total assets |
$ | 1,478,620 | $ | 1 | $ | 1,094,087 | $ | 557,899 | $ | (1,450,677 | ) | $ | 1,679,930 | |||||||||||
|
|
|
|
|
|
|
|
|
|
|
|
|
|||||||||||||
| LIABILITIES AND PARTNERS’ CAPITAL/MEMBERS’ EQUITY | ||||||||||||||||||||||||
| Current liabilities |
||||||||||||||||||||||||
| Accrued additions to property, plant and equipment |
$ | — | $ | — | $ | 24,002 | $ | 12,171 | $ | — | $ | 36,173 | ||||||||||||
| Capital leases |
402 | — | 3,006 | — | — | 3,408 | ||||||||||||||||||
| Deferred revenue |
— | — | — | 2,426 | — | 2,426 | ||||||||||||||||||
| Accounts payable—related party |
868 | — | 409,888 | 72 | (407,831 | ) | 2,997 | |||||||||||||||||
| Accounts payable, accrued expenses and other liabilities |
19,042 | — | 8,293 | 6,721 | — | 34,056 | ||||||||||||||||||
|
|
|
|
|
|
|
|
|
|
|
|
|
|||||||||||||
| Total current liabilities |
20,312 | — | 445,189 | 21,390 | (407,831 | ) | 79,060 | |||||||||||||||||
| Long-term debt |
651,544 | — | — | 127,400 | — | 778,944 | ||||||||||||||||||
| Long-term capital leases |
772 | — | 737 | — | — | 1,509 | ||||||||||||||||||
| Asset retirement obligations |
— | — | 13,564 | 861 | — | 14,425 | ||||||||||||||||||
| Partners’/members’ equity |
805,992 | 1 | 634,597 | 408,248 | (1,042,846 | ) | 805,992 | |||||||||||||||||
|
|
|
|
|
|
|
|
|
|
|
|
|
|||||||||||||
| Total liabilities and partners’ capital/members’ equity |
$ | 1,478,620 | $ | 1 | $ | 1,094,087 | $ | 557,899 | $ | (1,450,677 | ) | $ | 1,679,930 | |||||||||||
|
|
|
|
|
|
|
|
|
|
|
|
|
|||||||||||||
21
| As of December 31, 2012 | ||||||||||||||||||||||||
| Issuer | Co-Issuer | Guarantor Subsidiaries |
Non-Guarantor Subsidiaries |
Eliminations | Consolidated | |||||||||||||||||||
| (In thousands) | ||||||||||||||||||||||||
| ASSETS | ||||||||||||||||||||||||
| Current assets |
||||||||||||||||||||||||
| Cash and cash equivalents |
$ | 21 | $ | — | $ | — | $ | 90 | $ | — | $ | 111 | ||||||||||||
| Accounts receivable |
608 | — | 14,515 | 6,513 | — | 21,636 | ||||||||||||||||||
| Accounts receivable—related party |
366,405 | 1 | 22,587 | — | (365,238 | ) | 23,755 | |||||||||||||||||
| Insurance receivable |
— | — | 2,920 | — | — | 2,920 | ||||||||||||||||||
| Prepaid expenses and other |
584 | — | 1,357 | — | — | 1,941 | ||||||||||||||||||
|
|
|
|
|
|
|
|
|
|
|
|
|
|||||||||||||
| Total current assets |
367,618 | 1 | 41,379 | 6,603 | (365,238 | ) | 50,363 | |||||||||||||||||
| Investment in consolidated affiliates |
1,041,936 | — | — | — | (1,041,936 | ) | — | |||||||||||||||||
| Property, plant and equipment—net |
8,519 | — | 775,852 | 155,475 | — | 939,846 | ||||||||||||||||||
| Intangible assets—net |
— | — | 163,021 | 338,359 | — | 501,380 | ||||||||||||||||||
| Goodwill |
— | — | 95,031 | — | — | 95,031 | ||||||||||||||||||
| Deferred financing costs, net |
17,149 | — | — | 5,379 | — | 22,528 | ||||||||||||||||||
| Other assets |
20 | — | 1,301 | — | — | 1,321 | ||||||||||||||||||
|
|
|
|
|
|
|
|
|
|
|
|
|
|||||||||||||
| Total assets |
$ | 1,435,242 | $ | 1 | $ | 1,076,584 | $ | 505,816 | $ | (1,407,174 | ) | $ | 1,610,469 | |||||||||||
|
|
|
|
|
|
|
|
|
|
|
|
|
|||||||||||||
| LIABILITIES AND PARTNERS’ CAPITAL/MEMBERS’ EQUITY | ||||||||||||||||||||||||
| Current liabilities |
||||||||||||||||||||||||
| Accrued additions to property, plant and equipment |
$ | — | $ | — | $ | 3,829 | $ | 5,384 | $ | — | $ | 9,213 | ||||||||||||
| Capital leases |
429 | — | 3,433 | — | — | 3,862 | ||||||||||||||||||
| Deferred revenue |
— | — | — | 2,634 | — | 2,634 | ||||||||||||||||||
| Accounts payable—related party |
536 | — | 367,682 | 108 | (365,238 | ) | 3,088 | |||||||||||||||||
| Accounts payable, accrued expenses and other liabilities |
15,547 | — | 11,876 | 2,294 | — | 29,717 | ||||||||||||||||||
|
|
|
|
|
|
|
|
|
|
|
|
|
|||||||||||||
| Total current liabilities |
16,512 | — | 386,820 | 10,420 | (365,238 | ) | 48,514 | |||||||||||||||||
| Long-term debt |
558,161 | — | — | 127,000 | — | 685,161 | ||||||||||||||||||
| Long-term capital leases |
960 | — | 2,201 | — | — | 3,161 | ||||||||||||||||||
| Asset retirement obligations |
— | — | 13,188 | 836 | — | 14,024 | ||||||||||||||||||
| Partners’/members’ equity |
859,609 | 1 | 674,375 | 367,560 | (1,041,936 | ) | 859,609 | |||||||||||||||||
|
|
|
|
|
|
|
|
|
|
|
|
|
|||||||||||||
| Total liabilities and partners’ capital/members’ equity |
$ | 1,435,242 | $ | 1 | $ | 1,076,584 | $ | 505,816 | $ | (1,407,174 | ) | $ | 1,610,469 | |||||||||||
|
|
|
|
|
|
|
|
|
|
|
|
|
|||||||||||||
22
| For the Six Months Ended June 30, 2013 | ||||||||||||||||||||||||
| Issuer | Co-Issuer | Guarantor Subsidiaries |
Non-Guarantor Subsidiaries |
Eliminations | Consolidated | |||||||||||||||||||
| (In thousands) | ||||||||||||||||||||||||
| Net cash provided by (used in) operating activities |
$ | (21,601 | ) | $ | — | $ | 74,455 | $ | 25,115 | $ | (20,440 | ) | $ | 57,529 | ||||||||||
|
|
|
|
|
|
|
|
|
|
|
|
|
|||||||||||||
| Investing activities: |
||||||||||||||||||||||||
| Capital expenditures |
(412 | ) | — | (24,726 | ) | (55,159 | ) | — | (80,297 | ) | ||||||||||||||
| Capital contribution to consolidated affiliate |
(50,000 | ) | — | — | — | 50,000 | — | |||||||||||||||||
| Other |
— | — | — | 20 | — | 20 | ||||||||||||||||||
| Change in advances to affiliates, net |
47,019 | — | — | — | (47,019 | ) | — | |||||||||||||||||
|
|
|
|
|
|
|
|
|
|
|
|
|
|||||||||||||
| Net cash provided by (used in) investing activities |
(3,393 | ) | — | (24,726 | ) | (55,139 | ) | 2,981 | (80,277 | ) | ||||||||||||||
|
|
|
|
|
|
|
|
|
|
|
|
|
|||||||||||||
| Financing activities: |
||||||||||||||||||||||||
| Proceeds from credit facilities |
247,500 | — | — | 69,400 | — | 316,900 | ||||||||||||||||||
| Repayments of credit facilities |
(154,000 | ) | — | — | (69,000 | ) | — | (223,000 | ) | |||||||||||||||
| Payments on capital leases |
(214 | ) | — | (2,034 | ) | — | — | (2,248 | ) | |||||||||||||||
| Deferred financing costs paid |
(82 | ) | — | — | — | — | (82 | ) | ||||||||||||||||
| Proceeds from issuance of common units, net |
118,562 | — | — | — | — | 118,562 | ||||||||||||||||||
| Contributions received |
— | — | — | 50,000 | (50,000 | ) | — | |||||||||||||||||
| Distributions to General Partner for additional interest in CMM |
(129,000 | ) | — | — | — | — | (129,000 | ) | ||||||||||||||||
| Distributions paid |
(57,709 | ) | (20,440 | ) | 20,440 | (57,709 | ) | |||||||||||||||||
| Change in advances from affiliates, net |
— | — | (47,019 | ) | — | 47,019 | — | |||||||||||||||||
| Taxes paid for equity-based compensation vesting |
— | — | (676 | ) | — | — | (676 | ) | ||||||||||||||||
|
|
|
|
|
|
|
|
|
|
|
|
|
|||||||||||||
| Net cash provided by (used in) financing activities |
25,057 | — | (49,729 | ) | 29,960 | 17,459 | 22,747 | |||||||||||||||||
|
|
|
|
|
|
|
|
|
|
|
|
|
|||||||||||||
| Change in cash and cash equivalents |
63 | — | — | (64 | ) | — | (1 | ) | ||||||||||||||||
| Cash and cash equivalents at beginning of period |
21 | — | — | 90 | — | 111 | ||||||||||||||||||
|
|
|
|
|
|
|
|
|
|
|
|
|
|||||||||||||
| Cash and cash equivalents at end of period |
$ | 84 | $ | — | $ | — | $ | 26 | $ | — | $ | 110 | ||||||||||||
|
|
|
|
|
|
|
|
|
|
|
|
|
|||||||||||||
23
| For the Six Months Ended June 30, 2012 | ||||||||||||||||||||||||
| Issuer | Co-Issuer | Guarantor Subsidiaries |
Non-Guarantor Subsidiaries |
Eliminations | Consolidated | |||||||||||||||||||
| (In thousands) | ||||||||||||||||||||||||
| Net cash provided by (used in) operating activities |
$ | (16,255 | ) | $ | — | $ | 55,789 | $ | 3,121 | $ | (441 | ) | $ | 42,214 | ||||||||||
|
|
|
|
|
|
|
|
|
|
|
|
|
|||||||||||||
| Investing activities: |
||||||||||||||||||||||||
| Acquisitions, net of cash acquired |
— | — | — | (376,805 | ) | — | (376,805 | ) | ||||||||||||||||
| Capital expenditures |
(434 | ) | — | (21,101 | ) | (838 | ) | — | (22,373 | ) | ||||||||||||||
| Acquisition of interests in CMM |
(131,250 | ) | — | — | — | 131,250 | — | |||||||||||||||||
| Capital contribution to consolidated affiliate |
1,284 | — | — | — | (1,284 | ) | — | |||||||||||||||||
| Change in advances to affiliates, net |
33,043 | — | — | — | (33,043 | ) | — | |||||||||||||||||
|
|
|
|
|
|
|
|
|
|
|
|
|
|||||||||||||
| Net cash provided by (used in) investing activities |
(97,357 | ) | — | (21,101 | ) | (377,643 | ) | 96,923 | (399,178 | ) | ||||||||||||||
|
|
|
|
|
|
|
|
|
|
|
|
|
|||||||||||||
| Financing activities: |
||||||||||||||||||||||||
| Proceeds from credit facilities |
223,700 | — | — | 21,000 | — | 244,700 | ||||||||||||||||||
| Repayments of credit facilities |
(174,750 | ) | — | — | (1,500 | ) | — | (176,250 | ) | |||||||||||||||
| Payments on capital leases |
(132 | ) | — | (1,243 | ) | — | — | (1,375 | ) | |||||||||||||||
| Deferred financing costs paid |
(161 | ) | — | — | (6,325 | ) | — | (6,486 | ) | |||||||||||||||
| Proceeds from issuance of common units, net |
103,034 | — | — | — | — | 103,034 | ||||||||||||||||||
| Contributions received |
3,413 | — | — | 375,000 | (131,250 | ) | 247,163 | |||||||||||||||||
| Distributions paid |
(42,268 | ) | — | — | (4,928 | ) | 1,725 | (45,471 | ) | |||||||||||||||
| Change in advances from affiliate, net |
— | — | (33,043 | ) | — | 33,043 | — | |||||||||||||||||
| Taxes paid for equity-based compensation vesting |
— | — | (402 | ) | — | — | (402 | ) | ||||||||||||||||
|
|
|
|
|
|
|
|
|
|
|
|
|
|||||||||||||
| Net cash provided by (used in) financing activities |
112,836 | — | (34,688 | ) | 383,247 | (96,482 | ) | 364,913 | ||||||||||||||||
|
|
|
|
|
|
|
|
|
|
|
|
|
|||||||||||||
| Change in cash and cash equivalents |
(776 | ) | — | — | 8,725 | — | 7,949 | |||||||||||||||||
| Cash and cash equivalents at beginning of period |
797 | — | — | — | — | 797 | ||||||||||||||||||
|
|
|
|
|
|
|
|
|
|
|
|
|
|||||||||||||
| Cash and cash equivalents at end of period |
$ | 21 | $ | — | $ | — | $ | 8,725 | $ | — | $ | 8,746 | ||||||||||||
|
|
|
|
|
|
|
|
|
|
|
|
|
|||||||||||||
13. SUBSEQUENT EVENT
On June 24, 2013, Crestwood Niobrara LLC, our consolidated subsidiary, entered into an agreement with RKI Exploration and Production LLC (RKI), an affiliate of our General Partner, to purchase RKI’s 50% interest in a gathering system located in the Powder River Basin Niobrara play for approximately $108 million. This acquisition closed on July 19, 2013, and was funded through our contribution of approximately $27 million to Crestwood Niobrara (which was borrowed under the CMLP Credit Facility) and an additional $81 million was obtained through Crestwood Niobrara’s issuance of a preferred interest to a subsidiary of General Electric Capital Corporation and GE Structured Finance, Inc. (collectively, GE EFS).
Crestwood Niobrara will fund 75% of future capital contributions to the gathering system joint venture through additional preferred interest issuances to GE EFS (up to a maximum of $69 million), with the remainder to be funded through our capital contributions to Crestwood Niobrara. We serve as the managing member of Crestwood Niobrara and we have the ability to redeem GE EFS’s preferred security in either cash or CMLP common units, subject to certain restrictions.
24