Attached files
| file | filename |
|---|---|
| 8-K/A - FORM 8-K/A - Crestwood Midstream Partners LP | d612629d8ka.htm |
| EX-99.3 - EX-99.3 - Crestwood Midstream Partners LP | d612629dex993.htm |
| EX-23.1 - EX-23.1 - Crestwood Midstream Partners LP | d612629dex231.htm |
| EX-99.2 - EX-99.2 - Crestwood Midstream Partners LP | d612629dex992.htm |
Exhibit 99.1
Index
| Page | ||||
| Report of Independent Registered Public Accounting Firm |
1 | |||
| Consolidated Statements of Income |
2 | |||
| Consolidated Balance Sheets |
3 | |||
| Consolidated Statements of Cash Flows |
4 | |||
| Consolidated Statements of Changes in Partners’ Capital |
5 | |||
| Notes to Consolidated Financial Statements |
6 | |||
| Supplemental Financial Information |
||||
| Supplemental Selected Quarterly Financial Information (Unaudited) |
29 | |||
REPORT OF INDEPENDENT REGISTERED PUBLIC ACCOUNTING FIRM
To the Board of Directors and Unitholders of
Crestwood Midstream Partners LP
We have audited the accompanying consolidated balance sheets of Crestwood Midstream Partners LP and subsidiaries (the “Partnership”) as of December 31, 2012 and 2011, and the related consolidated statements of income, cash flows, and changes in partners’ capital for each of the three years in the period ended December 31, 2012. These financial statements are the responsibility of the Partnership’s management. Our responsibility is to express an opinion on these financial statements based on our audits.
We conducted our audits in accordance with the standards of the Public Company Accounting Oversight Board (United States). Those standards require that we plan and perform the audit to obtain reasonable assurance about whether the financial statements are free of material misstatement. An audit includes examining, on a test basis, evidence supporting the amounts and disclosures in the financial statements. An audit also includes assessing the accounting principles used and significant estimates made by management, as well as evaluating the overall financial statement presentation. We believe that our audits provide a reasonable basis for our opinion.
In our opinion, such consolidated financial statements present fairly, in all material respects, the financial position of Crestwood Midstream Partners LP and subsidiaries at December 31, 2012 and 2011, and the results of their operations and their cash flows for each of the three years in the period ended December 31, 2012, in conformity with accounting principles generally accepted in the United States of America.
The consolidated financial statements give retroactive effect to the acquisition of Crestwood Marcellus Midstream LLC by the Partnership on January 8, 2013, which has been accounted for at historical cost as a reorganization of entities under common control as described in Note 1 to the consolidated financial statements.
/s/ DELOITTE & TOUCHE LLP
Houston, Texas
March 18, 2013
(May 10, 2013 as to Note 16)
1
CRESTWOOD MIDSTREAM PARTNERS LP
CONSOLIDATED STATEMENTS OF INCOME
(In thousands, except for per unit data)
| Year Ended December 31, | ||||||||||||
| 2012(1) | 2011 | 2010 | ||||||||||
| Operating revenues |
||||||||||||
| Gathering revenue—related party |
$ | 88,091 | $ | 102,427 | $ | 77,645 | ||||||
| Gathering revenue |
74,922 | 28,528 | 5,749 | |||||||||
| Processing revenue—related party |
25,652 | 28,798 | 27,590 | |||||||||
| Processing revenue |
8,481 | 2,714 | 2,606 | |||||||||
| Product sales |
42,317 | 43,353 | — | |||||||||
|
|
|
|
|
|
|
|||||||
| Total operating revenues |
239,463 | 205,820 | 113,590 | |||||||||
|
|
|
|
|
|
|
|||||||
| Operating expenses |
||||||||||||
| Product purchases |
23,853 | 38,787 | — | |||||||||
| Product purchases—related party |
15,152 | — | — | |||||||||
| Operations and maintenance |
43,108 | 36,303 | 25,702 | |||||||||
| General and administrative |
29,582 | 24,153 | 17,657 | |||||||||
| Depreciation, amortization and accretion |
51,908 | 33,812 | 22,359 | |||||||||
|
|
|
|
|
|
|
|||||||
| Total operating expenses |
163,603 | 133,055 | 65,718 | |||||||||
|
|
|
|
|
|
|
|||||||
| Gain from exchange of property, plant and equipment |
— | 1,106 | — | |||||||||
|
|
|
|
|
|
|
|||||||
| Operating income |
75,860 | 73,871 | 47,872 | |||||||||
| Interest and debt expense |
(35,765 | ) | (27,617 | ) | (13,550 | ) | ||||||
|
|
|
|
|
|
|
|||||||
| Income before income taxes |
40,095 | 46,254 | 34,322 | |||||||||
| Income tax expense (benefit) |
1,206 | 1,251 | (550 | ) | ||||||||
|
|
|
|
|
|
|
|||||||
| Net income |
$ | 38,889 | $ | 45,003 | $ | 34,872 | ||||||
|
|
|
|
|
|
|
|||||||
| General partner’s interest in net income |
$ | 22,218 | $ | 7,735 | $ | 2,526 | ||||||
| Limited partners’ interest in net income |
$ | 16,671 | $ | 37,268 | $ | 32,346 | ||||||
| Basic income per unit: |
||||||||||||
| Net income per limited partner unit |
$ | 0.37 | $ | 1.00 | $ | 1.11 | ||||||
| Diluted income per unit: |
||||||||||||
| Net income per limited partner unit |
$ | 0.37 | $ | 1.00 | $ | 1.03 | ||||||
| (1) | Financial information has been revised to include the results of Crestwood Marcellus Midstream LLC as discussed in Note 1. |
See accompanying notes.
2
CRESTWOOD MIDSTREAM PARTNERS LP
CONSOLIDATED BALANCE SHEETS
(In thousands, except for unit data)
| December 31, | ||||||||
| 2012(1) | 2011 | |||||||
| ASSETS | ||||||||
| Current assets |
||||||||
| Cash and cash equivalents |
$ | 111 | $ | 797 | ||||
| Accounts receivable—related party |
23,755 | 27,312 | ||||||
| Accounts receivable |
21,636 | 11,926 | ||||||
| Insurance receivable |
2,920 | — | ||||||
| Prepaid expenses and other assets |
1,941 | 1,935 | ||||||
|
|
|
|
|
|||||
| Total current assets |
50,363 | 41,970 | ||||||
| Property, plant and equipment, net of accumulated depreciation of $130,030 in 2012 and $89,860 in 2011 |
939,846 | 746,045 | ||||||
| Intangible assets, net of accumulated amortization of $12,814 in 2012 and $2,440 in 2011 |
501,380 | 127,760 | ||||||
| Goodwill |
95,031 | 93,628 | ||||||
| Deferred financing costs, net |
22,528 | 16,699 | ||||||
| Other assets |
1,321 | 790 | ||||||
|
|
|
|
|
|||||
| Total assets |
$ | 1,610,469 | $ | 1,026,892 | ||||
|
|
|
|
|
|||||
| LIABILITIES AND PARTNERS’ CAPITAL | ||||||||
| Current liabilities |
||||||||
| Accrued additions to property, plant and equipment |
$ | 9,213 | $ | 7,500 | ||||
| Capital leases |
3,862 | 2,693 | ||||||
| Deferred revenue |
2,634 | — | ||||||
| Accounts payable—related party |
3,088 | 1,308 | ||||||
| Accounts payable, accrued expenses and other liabilities |
29,717 | 31,794 | ||||||
|
|
|
|
|
|||||
| Total current liabilities |
48,514 | 43,295 | ||||||
| Long-term debt |
685,161 | 512,500 | ||||||
| Long-term capital leases |
3,161 | 3,929 | ||||||
| Asset retirement obligations |
14,024 | 11,545 | ||||||
| Commitments and contingent liabilities (Note 10) |
||||||||
| Partners’ capital |
||||||||
| Common unitholders (41,164,737 and 32,997,696 units issued and outstanding at December 31, 2012 and 2011) |
442,348 | 286,945 | ||||||
| Class C unitholders (7,165,819 and 6,596,635 units issued and outstanding at December 31, 2012 and 2011) |
159,908 | 157,386 | ||||||
| General partner (979,614 and 763,892 units issued and outstanding at December 31, 2012 and 2011) |
257,353 | 11,292 | ||||||
|
|
|
|
|
|||||
| Total partners’ capital |
859,609 | 455,623 | ||||||
|
|
|
|
|
|||||
| Total liabilities and partners’ capital |
$ | 1,610,469 | $ | 1,026,892 | ||||
|
|
|
|
|
|||||
| (1) | Financial information has been revised to include the results of Crestwood Marcellus Midstream LLC as discussed in Note 1. |
See accompanying notes.
3
CRESTWOOD MIDSTREAM PARTNERS LP
CONSOLIDATED STATEMENTS OF CASH FLOWS
(In thousands)
| Year Ended December 31, | ||||||||||||
| 2012(1) | 2011 | 2010 | ||||||||||
| Cash flows from operating activities |
||||||||||||
| Net income |
$ | 38,889 | $ | 45,003 | $ | 34,872 | ||||||
| Adjustments to reconcile net income to net cash provided by operating activities: |
||||||||||||
| Depreciation, amortization and accretion |
51,908 | 33,812 | 22,359 | |||||||||
| Deferred income taxes |
— | — | (768 | ) | ||||||||
| Equity-based compensation |
1,877 | 916 | 5,522 | |||||||||
| Gain from exchange of property, plant and equipment |
— | (1,106 | ) | — | ||||||||
| Other non-cash income items |
5,234 | 3,473 | 4,961 | |||||||||
| Changes in assets and liabilities: |
||||||||||||
| Accounts receivable—related party |
3,557 | (4,309 | ) | (23,003 | ) | |||||||
| Accounts receivable |
(7,076 | ) | (7,348 | ) | (270 | ) | ||||||
| Insurance receivable |
(1,251 | ) | — | — | ||||||||
| Prepaid expenses and other assets |
2,113 | 249 | (903 | ) | ||||||||
| Accounts payable—related party |
1,780 | (2,959 | ) | 4,630 | ||||||||
| Accounts payable, accrued expenses and other liabilities |
5,034 | 18,600 | 603 | |||||||||
|
|
|
|
|
|
|
|||||||
| Net cash provided by operating activities |
102,065 | 86,331 | 48,003 | |||||||||
|
|
|
|
|
|
|
|||||||
| Cash flows from investing activities |
||||||||||||
| Acquisitions, net of cash acquired |
(563,965 | ) | (414,073 | ) | — | |||||||
| Capital expenditures |
(52,572 | ) | (48,405 | ) | (69,069 | ) | ||||||
| Proceeds from exchange of property, plant and equipment |
— | 5,943 | — | |||||||||
| Proceeds from sale of property, plant and equipment |
20 | — | — | |||||||||
| Distributions to Quicksilver for Alliance assets |
— | — | (80,276 | ) | ||||||||
|
|
|
|
|
|
|
|||||||
| Net cash used in investing activities |
(616,517 | ) | (456,535 | ) | (149,345 | ) | ||||||
|
|
|
|
|
|
|
|||||||
| Cash flows from financing activities |
||||||||||||
| Proceeds from issuance of senior notes |
151,500 | 200,000 | — | |||||||||
| Proceeds from CMLP credit facility |
411,700 | 215,200 | 426,704 | |||||||||
| Repayments of CMLP credit facility |
(517,500 | ) | (186,204 | ) | (268,600 | ) | ||||||
| Proceeds from CMM credit facility |
143,500 | — | — | |||||||||
| Repayments of CMM credit facility |
(16,500 | ) | — | — | ||||||||
| Payment of Tristate Acquisition deferred payment |
(7,839 | ) | — | — | ||||||||
| Payments on capital leases |
(2,993 | ) | (1,966 | ) | — | |||||||
| Deferred financing costs paid |
(11,322 | ) | (6,982 | ) | (13,568 | ) | ||||||
| Proceeds from issuance of Class C units, net |
— | 152,671 | — | |||||||||
| Proceeds from issuance of common units, net |
217,483 | 53,550 | 11,054 | |||||||||
| Contributions from partners |
249,680 | 8,741 | — | |||||||||
| Distributions to partners |
(103,537 | ) | (64,011 | ) | (49,699 | ) | ||||||
| Taxes paid for equity-based compensation vesting |
(406 | ) | — | (5,293 | ) | |||||||
|
|
|
|
|
|
|
|||||||
| Net cash provided by financing activities |
513,766 | 370,999 | 100,598 | |||||||||
|
|
|
|
|
|
|
|||||||
| Change in cash and cash equivalents |
(686 | ) | 795 | (744 | ) | |||||||
| Cash and cash equivalents at beginning of period |
797 | 2 | 746 | |||||||||
|
|
|
|
|
|
|
|||||||
| Cash and cash equivalents at end of period |
$ | 111 | $ | 797 | $ | 2 | ||||||
|
|
|
|
|
|
|
|||||||
| Supplemental cash flow information: |
||||||||||||
| Interest paid, net of amounts capitalized |
$ | 27,885 | $ | 20,281 | $ | 8,590 | ||||||
| (1) | Financial information has been revised to include the results of Crestwood Marcellus Midstream LLC as discussed in Note 1. |
See accompanying notes.
4
CRESTWOOD MIDSTREAM PARTNERS LP
CONSOLIDATED STATEMENTS OF CHANGES IN PARTNERS’ CAPITAL
(In thousands)
| Limited Partners | ||||||||||||||||||||
| Common | Subordinated Unitholders |
Class C Unitholders |
General Partner |
Total | ||||||||||||||||
| Partners’ capital as of December 31, 2009 |
$ | 281,239 | $ | 3,040 | $ | — | $ | 558 | $ | 284,837 | ||||||||||
| Issuance of units, net of offering costs |
11,054 | — | — | — | 11,054 | |||||||||||||||
| Conversion of subordinated note payable |
57,736 | — | — | — | 57,736 | |||||||||||||||
| Conversion of subordinated units |
(5,879 | ) | 5,879 | — | — | — | ||||||||||||||
| Net income |
22,614 | 9,732 | — | 2,526 | 34,872 | |||||||||||||||
| Equity-based compensation |
5,522 | — | — | — | 5,522 | |||||||||||||||
| Taxes paid for equity-based compensation vesting |
(5,293 | ) | — | — | — | (5,293 | ) | |||||||||||||
| Distributions to partners |
(28,648 | ) | (18,651 | ) | — | (2,400 | ) | (49,699 | ) | |||||||||||
| Distribution to Quicksilver |
(80,276 | ) | — | — | — | (80,276 | ) | |||||||||||||
|
|
|
|
|
|
|
|
|
|
|
|||||||||||
| Partners’ capital as of December 31, 2010 |
258,069 | — | — | 684 | 258,753 | |||||||||||||||
| Issuance of units, net of offering costs |
53,550 | — | 152,671 | — | 206,221 | |||||||||||||||
| Contributions by partners |
— | — | — | 8,741 | 8,741 | |||||||||||||||
| Net income |
32,553 | — | 4,715 | 7,735 | 45,003 | |||||||||||||||
| Equity-based compensation |
916 | — | — | — | 916 | |||||||||||||||
| Distributions to partners |
(58,143 | ) | — | — | (5,868 | ) | (64,011 | ) | ||||||||||||
|
|
|
|
|
|
|
|
|
|
|
|||||||||||
| Partners’ capital as of December 31, 2011 |
286,945 | — | 157,386 | 11,292 | 455,623 | |||||||||||||||
| Issuance of units, net of offering costs |
217,483 | — | — | — | 217,483 | |||||||||||||||
| Contributions from partners |
— | — | — | 249,680 | 249,680 | |||||||||||||||
| Net income(1) |
14,149 | 2,522 | 22,218 | 38,889 | ||||||||||||||||
| Equity-based compensation |
1,877 | — | — | — | 1,877 | |||||||||||||||
| Taxes paid for equity-based compensation vesting |
(406 | ) | — | — | — | (406 | ) | |||||||||||||
| Distributions to partners(1) |
(77,700 | ) | — | — | (25,837 | ) | (103,537 | ) | ||||||||||||
|
|
|
|
|
|
|
|
|
|
|
|||||||||||
| Partners’ capital as of December 31, 2012(1) |
$ | 442,348 | $ | — | $ | 159,908 | $ | 257,353 | $ | 859,609 | ||||||||||
|
|
|
|
|
|
|
|
|
|
|
|||||||||||
| (1) | Financial information has been revised to include the results of Crestwood Marcellus Midstream LLC as discussed in Note 1. |
See accompanying notes.
5
CRESTWOOD MIDSTREAM PARTNERS LP
NOTES TO CONSOLIDATED FINANCIAL STATEMENTS
1. ORGANIZATION AND DESCRIPTION OF BUSINESS
Organization
Crestwood Midstream Partners LP (CMLP) is a publicly traded Delaware limited partnership formed for the purpose of acquiring and operating midstream assets. Crestwood Gas Services GP LLC, our general partner (General Partner), is owned by Crestwood Holdings Partners LLC and its affiliates (Crestwood Holdings). Our common units are listed on the New York Stock Exchange (NYSE) under the symbol “CMLP.”
On October 1, 2010, Quicksilver Resources Inc. (Quicksilver) sold all of its ownership interests in CMLP to Crestwood Holdings (Crestwood Transaction), the terms of which included:
| • | Crestwood Holdings’ purchase of a 100% interest in our General Partner; |
| • | Crestwood Holdings’ purchase of 5,696,752 common units and 11,513,625 subordinated units; |
| • | Crestwood Holdings’ purchase of a $58 million subordinated promissory note (Subordinated Note) payable by CMLP which had a carrying value of approximately $58 million at closing; and |
| • | $701 million in cash paid to Quicksilver and conditional consideration in the form of potential additional cash payments from Crestwood Holdings in 2012 and 2013 of up to $72 million in the aggregate, depending upon achievement of certain defined average volume targets above an agreed threshold for 2011 and 2012, respectively. |
On October 4, 2010, our name changed from Quicksilver Gas Services LP to Crestwood Midstream Partners LP and our ticker symbol on the NYSE for our publicly traded common units changed from “KGS” to “CMLP.”
On October 18, 2010, subsequent to the closing of the Crestwood Transaction, the conflicts committee of our General Partner unanimously approved the conversion of our Subordinated Note payable into 2,333,712 common units in exchange for the outstanding balance of the Subordinated Note. In addition, on November 12, 2010, our subordination period ended resulting in the conversion of 11,513,625 subordinated units to common units on a one for one basis.
On February 23, 2012, we and Crestwood Holdings formed the Crestwood Marcellus Midstream LLC (CMM) joint venture. We contributed approximately $131 million for a 35% membership interest and Crestwood Holdings contributed approximately $244 million for a 65% membership interest. We utilized available capacity under our CMLP credit facility to fund our contribution to CMM. In conjunction with the formation of CMM, we and Crestwood Holdings entered into a limited liability company agreement and an operating agreement governing CMM.
On January 8, 2013, we acquired Crestwood Holdings’ 65% membership interest in CMM for approximately $258 million, which was funded through $129 million of borrowings under our CMLP credit facility, the issuance of 6,190,469 Class D units, representing limited partner interests in us to Crestwood Holdings, and the issuance of 133,060 general partner units to our General Partner. As a result of the acquisition of the additional membership interest, we have the ability to control CMM’s operating and financial decisions and policies. We accounted for this transaction as a reorganization of entities under common control and accordingly, we have consolidated CMM and have retrospectively adjusted our historical financial statements as of and for the year ended December 31, 2012 to reflect the change in reporting entity.
6
Organizational Structure
The following chart depicts our ownership structure as of December 31, 2012:
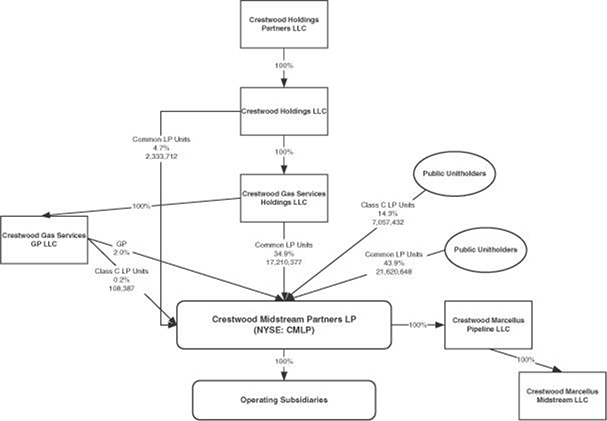
Our general partner and limited partner ownership interests as of December 31, 2012 are as follows:
| Crestwood Holdings |
Public | Total | ||||||||||
| General partner interest |
2.0 | % | — | 2.0 | % | |||||||
| Limited partner interests: |
||||||||||||
| Common unitholders |
39.6 | % | 43.9 | % | 83.5 | % | ||||||
| Class C unitholders |
0.2 | % | 14.3 | % | 14.5 | % | ||||||
|
|
|
|
|
|
|
|||||||
| Total |
41.8 | % | 58.2 | % | 100.0 | % | ||||||
|
|
|
|
|
|
|
|||||||
See Note 4. Net Income Per Limited Partner Unit for additional information concerning ownership interests.
Description of Business
We are a growth-oriented midstream master limited partnership which owns and operates predominately fee-based gathering, processing, treating and compression assets servicing natural gas producers in the Barnett Shale in north Texas, the Fayetteville Shale in northwestern Arkansas, the Granite Wash in the Texas Panhandle, the Marcellus Shale in northern West Virginia, the Avalon Shale/Bone Spring in southeastern New Mexico, and the Haynesville/Bossier Shale in western Louisiana.
We conduct all of our operations in the midstream sector in eight operating segments, four of which are reportable. Our operating segments reflect how we manage our operations and are generally reflective of the geographic areas in which we operate. Our reportable segments consist of Barnett, Fayetteville, Granite Wash and Marcellus. We operate five systems located in basins that include NGL rich gas shale plays: (i) the Cowtown System; (ii) the Granite Wash System; (iii) the Las Animas Systems; and (iv) two systems in the Marcellus segment.
7
2. BASIS OF PRESENTATION AND SUMMARY OF SIGNIFICANT ACCOUNTING POLICIES
Basis of Presentation
Our consolidated financial statements are prepared in accordance with United States generally accepted accounting principles (GAAP) and include the accounts of all consolidated subsidiaries after the elimination of all intercompany accounts and transactions. In management’s opinion, all necessary adjustments to fairly present our results of operations, financial position and cash flows for the periods presented have been made and all such adjustments are of a normal and recurring nature. In 2012, we reclassified approximately $2.7 million from goodwill to accounts receivable and other current assets to reflect the fair value of certain contracts acquired in the Frontier Gas Acquisition (as defined in Note 3. Acquisitions) that were not recorded when the purchase price allocation was finalized for the acquired assets. This reclassification had no impact on previously reported net income, earnings per unit or partners’ capital.
On January 8, 2013, we acquired Crestwood Holdings 65% membership interest in CMM and as a result, we control the operating and financial decisions of CMM. We accounted for this transaction as a reorganization of entities under common control and the accounting standards related to such transactions requires us to retroactively adjust our historical results. The following tables summarize the impact of our consolidation of CMM as of and for the year ended December 31, 2012. CMM was formed on February 23, 2012, therefore we did not adjust our historical results for periods prior to the inception date of CMM. Earnings related to the recast of our historical results due to the acquisition of our 65% membership interest in CMM were allocated to the General Partner. As a result, there was no impact to our basic or diluted earnings per limited partner unit.
| Year Ended December 31, 2012 | ||||||||||||
| As Previously Reported |
CMM | Combined | ||||||||||
| (In thousands, except per unit data) | ||||||||||||
| Operating revenues |
$ | 213,961 | $ | 25,502 | $ | 239,463 | ||||||
| Operating expenses |
(151,238 | ) | (12,365 | ) | (163,603 | ) | ||||||
|
|
|
|
|
|
|
|||||||
| Operating income |
$ | 62,723 | $ | 13,137 | $ | 75,860 | ||||||
|
|
|
|
|
|
|
|||||||
| Basic earnings per limited partner unit |
$ | 0.37 | $ | 0.37 | ||||||||
| Diluted earnings per limited partner unit |
$ | 0.37 | $ | 0.37 | ||||||||
| Weighted-average number of limited partner units: |
||||||||||||
| Basic |
45,223 | 45,223 | ||||||||||
| Diluted |
45,420 | 45,420 | ||||||||||
| As of December 31, 2012 | ||||||||||||||||
| As Previously Presented |
CMM | Eliminations | Combined | |||||||||||||
| ASSETS | ||||||||||||||||
| Current assets |
||||||||||||||||
| Cash and cash equivalents |
$ | 21 | $ | 90 | $ | — | $ | 111 | ||||||||
| Accounts receivable—related party |
23,863 | — | (108 | ) | 23,755 | |||||||||||
| Accounts receivable |
15,123 | 6,513 | — | 21,636 | ||||||||||||
| Other current assets |
4,861 | — | — | 4,861 | ||||||||||||
|
|
|
|
|
|
|
|
|
|||||||||
| Total current assets |
43,868 | 6,603 | (108 | ) | 50,363 | |||||||||||
| Investment in unconsolidated affiliate |
128,646 | — | (128,646 | ) | — | |||||||||||
| Property, plant and equipment, net |
784,371 | 155,475 | — | 939,846 | ||||||||||||
| Intangible assets, net |
163,021 | 338,359 | — | 501,380 | ||||||||||||
| Other long-term assets |
113,501 | 5,379 | — | 118,880 | ||||||||||||
|
|
|
|
|
|
|
|
|
|||||||||
| Total assets |
$ | 1,233,407 | $ | 505,816 | $ | (128,754 | ) | $ | 1,610,469 | |||||||
|
|
|
|
|
|
|
|
|
|||||||||
| LIABILITIES AND PARTNERS’ CAPITAL/MEMBERS’ EQUITY | ||||||||||||||||
| Current liabilities |
||||||||||||||||
| Accrued additions to property, plant and equipment |
$ | 3,829 | $ | 5,384 | $ | — | $ | 9,213 | ||||||||
| Other current liabilities |
6,950 | 2,634 | — | 9,584 | ||||||||||||
| Accounts payable, accrued expenses and other liabilities |
27,423 | 2,402 | (108 | ) | 29,717 | |||||||||||
|
|
|
|
|
|
|
|
|
|||||||||
| Total current liabilities |
38,202 | 10,420 | (108 | ) | 48,514 | |||||||||||
| Long-term debt |
558,161 | 127,000 | — | 685,161 | ||||||||||||
| Other long-term liabilities |
16,349 | 836 | — | 17,185 | ||||||||||||
| Partner’s capital/members’ equity |
620,695 | 367,560 | (128,646 | ) | 859,609 | |||||||||||
|
|
|
|
|
|
|
|
|
|||||||||
| Total liabilities and partners’ capital/members’ equity |
$ | 1,233,407 | $ | 505,816 | $ | (128,754 | ) | $ | 1,610,469 | |||||||
|
|
|
|
|
|
|
|
|
|||||||||
8
Principles of Consolidation
We consolidate entities when we have the ability to control or direct the operating and financial decisions of the entity or when we have a significant interest in the entity that gives us the ability to direct the activities that are significant to that entity. The determination of our ability to control, direct or exert significant influence over an entity involves the use of judgment. We do not have ownership in any variable interest entities.
Use of Estimates
The preparation of our financial statements requires the use of estimates and assumptions that affect the amounts we report as assets, liabilities, revenues and expenses and our disclosures in these financial statements. Actual results can differ from those estimates.
Cash and Cash Equivalents
We consider all highly liquid investments with an original maturity of less than three months to be cash or cash equivalents. Our cash equivalents consist primarily of temporary investments of cash in short-term money market instruments.
Accounts Receivable
Our accounts receivable are primarily due from Quicksilver and Antero Resources Appalachian Corporation (Antero). Each of our customers is reviewed as to credit worthiness prior to the extension of credit and on a regular basis thereafter. Although we do not require collateral, appropriate credit ratings are required. Receivables are generally due within 30 to 60 days. We regularly review collectability and establish an allowance as necessary using the specific identification method. At December 31, 2012 and 2011, we have recorded no allowance for uncollectible accounts receivable. During the years ended December 31, 2012, 2011 and 2010, we experienced no significant non-payment for services.
Long-Lived Assets
Our property, plant and equipment is recorded at its original cost of construction or, upon acquisition, at fair value of the assets acquired. For assets we construct, we capitalize direct costs, such as labor and materials, and indirect costs, such as overhead and interest. We capitalize major units of property replacements or improvements and expense minor items. We use the straight-line method to depreciate property, plant and equipment over the estimated useful lives of the assets.
When we retire property, plant and equipment, we charge accumulated depreciation for the original cost of the assets in addition to the cost to remove, sell or dispose of the assets, less their salvage value. We include gains or losses on dispositions of assets in operations and maintenance expense in our consolidated statements of income.
Our intangible assets consist of acquired gas gathering, compression and processing contracts. We amortize these contracts based on the projected cash flows associated with the contracts.
We evaluate our long-lived assets for impairment when events or circumstances indicate that their carrying values may not be recovered. These events include market declines that are believed to be other than temporary, changes in the manner in which we intend to use a long-lived asset, decisions to sell an asset and adverse changes in the legal or business environment such as adverse actions by regulators. If an event occurs, we evaluate the recoverability of our carrying value based on the long-lived asset’s ability to generate future cash flows on an undiscounted basis. If the undiscounted cash flows are not sufficient to recover the long-lived asset’s carrying value, or if we decide to sell a long-lived asset or group of assets, we adjust the carrying values of the asset downward, if necessary, to their estimated fair value. Our fair value estimates are generally based on assumptions market participants would use, including market data obtained through the sales process or an analysis of expected discounted cash flows.
Goodwill
Goodwill represents consideration paid in excess of the fair value of the identifiable assets acquired in a business combination. We evaluate goodwill for impairment, at a minimum, annually on December 31, or whenever facts and circumstances indicate that fair value of a reporting unit is less than its carrying amount.
When testing goodwill for impairment, we assess qualitative factors to evaluate whether it is more likely than not that the fair value of a reporting unit is less than the carrying amount as the basis to determine if a two-step quantitative impairment test is required. Under the two-step quantitative test, the first step compares the fair value of the reporting unit to its carrying value, including goodwill. If the fair value exceeds the carry amount, goodwill of the reporting unit is not considered impaired. If however, the fair value does not exceed the carrying amount the second step compares the implied fair value to the carrying value of the reporting unit. If the carrying amount of a reporting unit’s goodwill exceeds the implied fair value of that goodwill, the excess of the carrying value over the implied value is recognized as an impairment loss.
9
Deferred Financing Costs
Costs associated with obtaining long-term debt are amortized over the term of the related debt using the effective interest method.
Asset Retirement Obligations
We record a liability for legal or contractual obligations to retire our long-lived assets associated with right-of-way contracts we hold and our facilities whether owned or leased. We record a liability in the period the obligation is incurred and estimable. Our asset retirement liabilities are initially recorded at their estimated fair value with a corresponding increase to property, plant and equipment. This increase in property, plant and equipment is then depreciated over the useful life of the asset to which that liability relates. An ongoing expense is recognized for changes in the value of the liability as a result of the passage of time, which we record as depreciation, amortization and accretion expense in our consolidated statements of income.
Environmental Costs and Other Contingencies
We recognize liabilities for environmental and other contingencies when we have an exposure that indicates it is both probable that a liability has been incurred and the amount of loss can be reasonably estimated. Where the most likely outcome of a contingency can be reasonably estimated, we accrue a liability for that amount. Where the most likely outcome cannot be estimated, a range of potential losses is established and if no one amount in that range is more likely than any other, the low end of the range is accrued.
We record liabilities for environmental contingencies at their undiscounted amounts on our consolidated balance sheets as accounts payable, accrued expenses and other liabilities when environmental assessments indicate that remediation efforts are probable and costs can be reasonable estimated. Estimates of our liabilities are based on currently available facts and presently enacted laws and regulations, taking into consideration the likely effects of other societal and economic factors. Our estimates are subject to revision in future periods based on actual costs or new circumstances. We capitalize costs that benefit future periods and recognize a current period charge in operation and maintenance expense when clean-up efforts do not benefit future periods.
We evaluate potential recoveries of amounts from third parties, including insurance coverage, separately from our liability. Recovery is evaluated based on the solvency of the third party, among other factors. When recovery is assured, we record and report an asset separately from the associated liability on our consolidate balance sheet.
Revenue Recognition
We gather, process, treat, compress, transport and sell natural gas pursuant to fixed-fee and percent-of-proceeds contracts. For fixed-fee contracts, we recognize revenues based on the volume of natural gas gathered, processed and treated or compressed. For percent-of-proceeds contracts, we recognize revenues based on the value of products sold to third parties. We recognize revenues for our services and products when all of the following criteria are met:
| • | persuasive evidence of an exchange arrangement exists; |
| • | services have been rendered or products delivered; |
| • | the price for services is fixed or determinable; and |
| • | collectability is reasonably assured. |
Income Taxes
We are a partnership for income tax purposes and are not subject to either federal income taxes or generally to state income taxes. Our partners are responsible for their share of taxable income which may differ from income for financial statement purposes due to differences in the tax basis and financial reporting basis of assets and liabilities.
We are responsible for our portion of the Texas Margin tax that is included in Crestwood Holdings’ consolidated Texas franchise tax return. Our current tax liability will be assessed based on 0.7% of the gross revenue apportioned to Texas. The margin tax qualifies as an income tax under GAAP, which requires us to recognize the impact of this tax on the temporary differences between the financial statement assets and liabilities and their tax basis attributable to such tax.
Equity Based Compensation
Equity-based awards are valued at the closing market price of our common units on the date of grant, which reflects the fair value of such awards. For those awards that are settled in cash, the associated liability is remeasured at every balance sheet date through settlement, such that the vested portion of the liability is adjusted to reflect its revised fair value through compensation expense. We generally recognize the expense associated with the award over the vesting period. At the time of issuance of phantom units, management of our General Partner determines whether they will be settled in cash or settled in our common units.
10
3. ACQUISITIONS
2012 Acquisitions
Antero Acquisition
On February 24, 2012, we announced the execution of an Asset Purchase Agreement related to the acquisition of gathering assets owned by Antero in the Marcellus Shale located in Harrison and Doddridge Counties, West Virginia (Antero Acquisition), and, at closing, the planned execution of a 20 year Gas Gathering and Compression Agreement (GGA) with Antero. On March 26, 2012, CMM completed the Antero Acquisition for approximately $380 million. The assets acquired by CMM consisted of a 33 mile low pressure gathering system at the time of acquisition. The gathering pipelines deliver Antero’s Marcellus Shale production to various regional pipeline systems including Columbia, Dominion and Equitrans and Mark West Energy Partners’ Sherwood Gas Processing Plant.
The GGA with Antero provided for an area of dedication at the time of acquisition of approximately 127,000 gross acres, or 104,000 net acres, largely located in the rich gas corridor of the southwestern core of the Marcellus Shale play. As part of the GGA, Antero committed to deliver minimum annual throughput volumes to us for a seven year period from January 1, 2012 to January 1, 2019, ranging from an average of 300 MMcf/d in 2012 to an average of 450 MMcf/d in 2018. During the period ended December 31, 2012, Antero delivered less than the minimum annual throughput volumes and at December 31, 2012, we recorded a receivable and deferred revenue of approximately $2.6 million due to Antero’s potential ability to recover this amount if Antero’s 2013 throughput volumes exceed the minimum annual throughput volumes included in the GGA for 2013.
The final purchase price allocation is as follows (In thousands):
| Purchase price: |
||||
| Cash |
$ | 381,718 | ||
|
|
|
|||
| Total purchase price |
$ | 381,718 | ||
|
|
|
|||
| Purchase price allocation: |
||||
| Property, plant and equipment |
$ | 90,562 | ||
| Intangible assets |
291,218 | |||
|
|
|
|||
| Total assets |
$ | 381,780 | ||
|
|
|
|||
| Asset retirement obligation |
$ | 62 | ||
|
|
|
|||
| Total liabilities |
$ | 62 | ||
|
|
|
|||
| Total |
$ | 381,718 | ||
|
|
|
Our intangible assets recorded as result of the Antero Acquisition relate to the GGA with Antero. These intangible assets will be amortized over the life of the contract. Transaction costs for the Antero Acquisition for the year ended December 31, 2012 were approximately $0.6 million and were included in general and administrative expenses in our consolidated statement of income. For the period from the acquisition date (March 26, 2012) through December 31, 2012, we recorded approximately $26 million of operating revenues and $12 million of operating expenses related to the operations of the assets acquired from Antero.
11
Devon Acquisition
On August 24, 2012, we acquired certain gathering and processing assets in the NGL rich gas region of the Barnett Shale from Devon Energy Corporation (Devon) for approximately $87 million (Devon Acquisition). The assets acquired consist of a 74 mile low pressure natural gas gathering system, a cryogenic processing facility with capacity of 100 MMcf/d and 23,100 hp of compression equipment, and are located in Johnson County, Texas (West Johnson County System) near our Cowtown gathering system. Additionally, as part of the transaction, we entered into a 20 year, fixed-fee gathering, processing and compression agreement with Devon, under which we gather and process Devon’s natural gas production from a 20,500 acre dedication. The final purchase price allocation is pending the completion of the valuation of the assets acquired and liabilities assumed. The preliminary purchase price allocation is as follows (In thousands):
| Purchase price: |
||||
| Cash |
$ | 87,247 | ||
|
|
|
|||
| Total purchase price |
$ | 87,247 | ||
|
|
|
|||
| Preliminary purchase price allocation: |
||||
| Property, plant and equipment |
$ | 41,555 | ||
| Intangible assets |
46,959 | |||
|
|
|
|||
| Total assets |
$ | 88,514 | ||
|
|
|
|||
| Asset retirement obligation |
$ | 540 | ||
| Property tax liability |
527 | |||
| Environmental liability |
200 | |||
|
|
|
|||
| Total liabilities |
$ | 1,267 | ||
|
|
|
|||
| Total |
$ | 87,247 | ||
|
|
|
Our intangible assets recorded as a result of the Devon Acquisition relate to the 20 year fixed-fee gathering, processing and compression agreement with Devon. These intangible assets will be amortized over the life of the contract.
Transactions costs for the Devon Acquisition for the year ended December 31, 2012 were approximately $1 million are included in general and administrative expenses in our consolidated statement of income. For the period from the acquisition date (August 24, 2012) through December 31, 2012, we recorded approximately $7 million of operating revenues and $5 million of operating expenses related to the operations of the assets acquired from Devon. We did not incur any significant non-operating income or expenses related to the acquired assets during that period. We believe that it is impracticable to present financial information for the acquired assets prior to the acquisition date due to the lack of availability of historical financial information related to the acquired assets, and because the 20 year fixed-fee gathering, processing and compression agreement with Devon has significantly different terms than the historical intercompany relationships between the acquired assets and Devon.
EMAC Acquisition
On December 28, 2012, CMM acquired all of the membership interest of E. Marcellus Asset Company, LLC (EMAC) from Enerven Compression, LLC (Enerven) for approximately $95 million. We financed this acquisition through our CMM $200 million Credit Facility. EMAC’s assets consist of four compression and dehydration stations located on our gathering systems in Harrison County, West Virginia. These assets will provide compression and dehydration services to Antero under a compression services agreement through 2018. Antero has the option to renew the agreement for an additional five years upon expiration of the original agreement. The final purchase price allocation is pending the completion of the valuation of the assets acquired and liabilities assumed. The preliminary purchase price allocation is as follows (In thousands):
| Purchase price: |
||||
| Cash |
$ | 95,000 | ||
|
|
|
|||
| Total purchase price |
$ | 95,000 | ||
|
|
|
|||
| Preliminary purchase price allocation: |
||||
| Property, plant and equipment |
$ | 45,938 | ||
| Intangible assets |
49,817 | |||
|
|
|
|||
| Total assets |
$ | 95,755 | ||
|
|
|
|||
| Asset retirement obligation |
$ | 755 | ||
|
|
|
|||
| Total liabilities |
$ | 755 | ||
|
|
|
|||
| Total |
$ | 95,000 | ||
|
|
|
12
Our intangible assets recorded as result of the EMAC acquisition relate to the compression services agreements with Antero. These intangible assets will be amortized over the life of the contract. Transaction costs for the EMAC acquisition for the year ended December 31, 2012 were approximately $0.3 million and were included in general and administrative expenses in our consolidated statement of income. The acquisition of EMAC was not material to our results of operations for the period from the acquisition date (December 28, 2012) to December 31, 2012.
2011 Acquisitions
Las Animas Acquisition
On February 16, 2011, we acquired certain midstream assets in the Avalon Shale trend from a group of independent producers for approximately $5 million (Las Animas Acquisition). The assets acquired consisted of approximately 46 miles of natural gas gathering pipeline located in the Morrow/Atoka trend and the Avalon Shale trend in southeastern New Mexico. The pipelines are supported by long-term fixed-fee contracts which include existing Morrow/Atoka production and dedications of approximately 55,000 acres.
The Las Animas Acquisition was recorded in property, plant and equipment at fair value of approximately $5 million. During the year ended December 31, 2011, we recognized approximately $5 million of operating revenues and $0.1 million of operating income related to this acquisition.
Frontier Gas Acquisition
On April 1, 2011, we acquired certain midstream assets in the Fayetteville Shale and the Granite Wash from Frontier Gas Services, LLC for approximately $345 million (Frontier Gas Acquisition). We financed $338 million of the purchase price through a combination of equity and debt as described in Note 5. Financial Instruments and Note 14. Partners’ Capital.
The Fayetteville assets acquired consisted of approximately 130 miles of high pressure and low pressure gathering pipelines in northwestern Arkansas with capacity of approximately 510 MMcf/d, treating capacity of approximately 165 MMcf/d and approximately 35,000 hp compression (Fayetteville System). The Fayetteville System interconnects with multiple interstate pipelines which serve the Fayetteville Shale and are supported by long-term fixed-fee contracts with producers who dedicated approximately 100,000 acres in the core of the Fayetteville Shale to us. These contracts have initial terms that extend through 2020 and include an option, by either party to the contract, to extend the contract through 2025. The Granite Wash assets acquired consisted of a 28 mile pipeline system and a 36 MMcf/d cryogenic processing plant in the Texas Panhandle (Granite Wash System). The Granite Wash System is supported by more than 13,000 dedicated acres and long-term contracts with initial terms that extend through 2022.
During 2011, we finalized the Frontier Gas Acquisition purchase price allocation, which resulted in the recognition of approximately $94 million in goodwill, of which $77 million was allocated to the Fayetteville segment and $17 million was allocated to the Granite Wash segment. The final purchase price allocation is as follows (In thousands):
| Purchase price: |
||||
| Cash |
$ | 344,562 | ||
|
|
|
|||
| Purchase price allocation: |
||||
| Accounts receivable |
$ | 335 | ||
| Prepaid expenses and other |
750 | |||
| Property, plant and equipment |
144,505 | |||
| Intangible assets |
114,200 | |||
| Goodwill |
93,628 | |||
| Other assets |
178 | |||
|
|
|
|||
| Total assets |
$ | 353,596 | ||
|
|
|
|||
| Current portion of capital leases |
$ | 2,576 | ||
| Accounts payable, accrued expenses and other |
64 | |||
| Long-term capital leases |
6,011 | |||
| Asset retirement obligations |
383 | |||
|
|
|
|||
| Total liabilities |
$ | 9,034 | ||
|
|
|
|||
| Total |
$ | 344,562 | ||
|
|
|
13
Transactions costs for the Frontier Gas Acquisition for the year ended December 31, 2011 were approximately $5 million of which approximately $2 million was recorded in general and administrative expense and $3 million was recorded in interest expense. During the year ended December 31, 2011, we recognized approximately $59 million in operating revenues and $5 million in operating income related to this acquisition.
Tristate Acquisition
On November 1, 2011, we acquired Tristate Sabine, LLC (Tristate) from affiliates of Energy Spectrum Capital, Zwolle Pipeline, LLC, and Tristate’s management for approximately $72 million in cash consideration comprised of $64 million paid at closing plus a deferred payment of approximately $8 million, which was paid during the fourth quarter of 2012 (Tristate Acquisition).
At the time of acquisition, the Tristate assets located in Haynesville/Bossier Shale consisted of approximately 60 miles of high pressure and low pressure gathering pipelines in western Louisiana with capacity of approximately 100 MMcf/d and treating capacity of approximately 80 MMcf/d (Sabine System). The Sabine System is supported by long-term, fixed-fee contracts with producers who dedicated approximately 20,000 acres to us. These contracts have various initial terms that extend through 2019 and 2021.
During 2012, we finalized our purchase price allocation for the Tristate Acquisition, which resulted in the recognition of approximately $4 million in goodwill, primarily related to anticipated operating synergies between the assets acquired and our existing assets. The final purchase price allocation is as follows (In thousands):
| Purchase price: |
||||
| Cash |
$ | 64,359 | ||
| Deferred payment |
8,000 | |||
|
|
|
|||
| Total purchase price |
$ | 72,359 | ||
|
|
|
|||
| Purchase price allocation: |
||||
| Cash |
$ | 589 | ||
| Accounts receivable |
2,564 | |||
| Prepaid expenses and other |
364 | |||
| Property, plant and equipment |
55,568 | |||
| Intangible assets |
12,000 | |||
| Goodwill |
4,053 | |||
|
|
|
|||
| Total assets |
$ | 75,138 | ||
|
|
|
|||
| Accounts payable, accrued expenses and other |
$ | 1,915 | ||
| Asset retirement obligation |
864 | |||
|
|
|
|||
| Total liabilities |
$ | 2,779 | ||
|
|
|
|||
| Total |
$ | 72,359 | ||
|
|
|
Transaction costs of $0.3 million were recognized in general and administrative expense during 2011. During the year ended December 31, 2011, we recognized approximately $1.9 million in operating revenues and $0.9 million in operating income related to this acquisition.
Unaudited Pro Forma Information
The following table is the presentation of income for the year ended December 31, 2012 as if we had completed the EMAC acquisition on February 23, 2012, the inception date of CMM, which acquired EMAC (In thousands, except per unit data):
| Year Ended December 31, 2012 | ||||||||||||
| Crestwood Midstream Partners LP |
Proforma Adjustment (1) |
Combined | ||||||||||
| Operating revenues |
$ | 239,463 | $ | 9,950 | $ | 249,413 | ||||||
| Operating expenses |
(163,603 | ) | (7,168 | ) | (170,771 | ) | ||||||
|
|
|
|
|
|
|
|||||||
| Operating income |
$ | 75,860 | $ | 2,782 | $ | 78,642 | ||||||
|
|
|
|
|
|
|
|||||||
| Basic earnings per limited partner unit(2) |
$ | 0.37 | $ | 0.37 | ||||||||
| Diluted earnings per limited partner unit (2) |
$ | 0.37 | $ | 0.37 | ||||||||
| Weighted-average number of limited partner units: (2) |
||||||||||||
| Basic |
45,223 | 45,223 | ||||||||||
| Diluted |
45,420 | 45,420 | ||||||||||
| (1) | Represents approximately ten months of operating income for the EMAC acquisition prior to the acquisition. |
| (2) | Earnings related to the recast of our historical results due to the acquisition of our 65% membership interest in CMM were allocated to the General Partner. As a result, there was no impact to our basic or diluted earnings per limited partner unit. |
14
The following tables are the presentation of income for the years ended December 31, 2011 and 2010 as if we had completed the Las Animas, Frontier Gas and Tristate Acquisitions on January 1, 2010 (In thousands, except per unit data):
| Year Ended December 31, 2011 | ||||||||||||
| Crestwood Midstream Partners LP (1) |
Proforma Adjustment (2) |
Combined | ||||||||||
| Operating revenues |
$ | 205,820 | $ | 25,827 | $ | 231,647 | ||||||
| Operating expenses, net of gain from exchange of property, plant and equipment |
(131,949 | ) | (22,911 | ) | (154,860 | ) | ||||||
|
|
|
|
|
|
|
|||||||
| Operating income |
$ | 73,871 | $ | 2,916 | $ | 76,787 | ||||||
|
|
|
|
|
|
|
|||||||
| Basic earnings per limited partner unit: |
$ | 1.00 | $ | 0.87 | ||||||||
| Diluted earnings per limited partner unit: |
$ | 1.00 | $ | 0.87 | ||||||||
| Weighted-average number of limited partner units: |
||||||||||||
| Basic |
37,206 | 38,835 | ||||||||||
| Diluted |
37,320 | 38,949 | ||||||||||
| Year Ended December 31, 2010 | ||||||||||||
| Crestwood Midstream Partners LP |
Proforma Adjustment (3) |
Combined | ||||||||||
| Operating revenues |
$ | 113,590 | $ | 74,217 | $ | 187,807 | ||||||
| Operating expenses |
(65,718 | ) | (70,295 | ) | (136,013 | ) | ||||||
|
|
|
|
|
|
|
|||||||
| Operating income |
$ | 47,872 | $ | 3,922 | $ | 51,794 | ||||||
|
|
|
|
|
|
|
|||||||
| Basic earnings per limited partner unit: |
$ | 1.11 | $ | 0.80 | ||||||||
| Diluted earnings per limited partner unit: |
$ | 1.03 | $ | 0.75 | ||||||||
| Weighted-average number of limited partner units: |
||||||||||||
| Basic |
29,070 | 35,561 | ||||||||||
| Diluted |
31,316 | 37,807 | ||||||||||
| (1) | Includes eleven months of operating income for the Las Animas Acquisition, nine months of operating income for the Frontier Gas Acquisition and two months of operating income for the Tristate Acquisition. |
| (2) | Represents approximately one month of operating income for the Las Animas Acquisition, three months of operating income for the Frontier Gas Acquisition and ten months of operating income for the Tristate Acquisition, prior to the respective acquisition. |
| (3) | Represents operating income for the Las Animas Acquisition, the Frontier Gas Acquisition and the Tristate Acquisition for the year ended December 31, 2010. |
4. NET INCOME PER LIMITED PARTNER UNIT AND DISTRIBUTIONS
Earnings per Limited Partner Unit. Our net income is allocated to the General Partner and the limited partners, in accordance with their respective ownership percentages, after giving effect to incentive distributions paid to the General Partner. Basic earnings per unit are computed by dividing net income attributable to limited partner unitholders by the weighted-average number of limited partner units outstanding during each period. Diluted earnings per unit are computed using the treasury stock method, which considers the impact to net income and limited partner units from the potential issuance of limited partner units.
15
The tables below show the (i) allocation of net income attributable to limited partners and the (ii) net income per limited partner unit based on the number of basic and diluted limited partner units outstanding for the years ended December 31, 2012, 2011 and 2010.
Allocation of Net Income to General Partner and Limited Partners
| Year Ended December 31, | ||||||||||||
| 2012 | 2011 | 2010 | ||||||||||
| Net income |
$ | 38,889 | $ | 45,003 | $ | 34,872 | ||||||
| GP’s incentive distributions |
(14,753 | ) | (7,049 | ) | (2,016 | ) | ||||||
|
|
|
|
|
|
|
|||||||
| Net income after incentive distributions |
24,136 | 37,954 | 32,856 | |||||||||
| GP’s interest in net income after incentive distributions |
7,465 | 686 | 510 | |||||||||
|
|
|
|
|
|
|
|||||||
| LP’s interest in net income after incentive distributions |
$ | 16,671 | $ | 37,268 | $ | 32,346 | ||||||
|
|
|
|
|
|
|
|||||||
Net Income Per Limited Partner Unit
| Year Ended December 31, | ||||||||||||
| 2012 | 2011 | 2010 | ||||||||||
| Limited partners’ interest in net income |
$ | 16,671 | $ | 37,268 | $ | 32,346 | ||||||
| Weighted-average limited partner units—basic (1) |
45,223 | 37,206 | 29,070 | |||||||||
| Effect of unvested phantom units |
197 | 114 | 2,246 | |||||||||
|
|
|
|
|
|
|
|||||||
| Weighted-average limited partner units—diluted (1) |
45,420 | 37,320 | 31,316 | |||||||||
|
|
|
|
|
|
|
|||||||
| Basic earnings per unit: |
||||||||||||
| Net income per limited partner |
$ | 0.37 | $ | 1.00 | $ | 1.11 | ||||||
| Diluted earnings per unit: |
||||||||||||
| Net income per limited partner |
$ | 0.37 | $ | 1.00 | $ | 1.03 | ||||||
| (1) | Includes 6,869,268 and 4,828,093 Class C units for the years ended December 31, 2012 and 2011. |
There were no units excluded from our dilutive earnings per share as we do not have any anti-dilutive units for the years ended December 31, 2012, 2011 and 2010.
Distributions. Our Second Amended and Restated Agreement of Limited Partnership, dated February 19, 2008, as amended (Partnership Agreement), requires that, within 45 days after the end of each quarter, we distribute all of our Available Cash (as defined therein) to unitholders of record on the applicable record date, as determined by our General Partner. Our minimum quarterly distribution is $0.30 per unit, to the extent we have sufficient cash flows from operations after the establishment of cash reserve and payment of fees and expenses, including payments to our General Partner. There is no guarantee that we will pay the minimum quarterly distribution in any quarter. We are prohibited from making any distributions to unitholders if such distribution would cause an event of default or an event of default exists, under our Credit Facility or other agreements governing our long-term debt.
General Partner Interest and Incentive Distribution Rights. Our General Partner is entitled to quarterly distributions equal to its General Partner interest. As of December 31, 2012, our General Partner interest is approximately 2%, represented by 979,614 General Partner units. Our General Partner has the right, but not the obligation, to contribute a proportional amount of capital to us to maintain its current General Partner interest. The General Partner’s interest in our distributions will be reduced if we issue additional units in the future and our General Partner does not contribute a proportional amount of capital to us to maintain its General Partner interest.
Our General Partner holds incentive distribution rights (IDRs) in accordance with the Partnership Agreement. These rights pay an increasing percentage, up to a maximum of 50% of the cash we distribute from operating surplus in excess of $0.45 per unit per quarter. The maximum distribution of 50% includes distributions paid to our General Partner based on its General Partner interest and assumes that our General Partner maintains its current General Partner interest. The maximum distribution of 50% does not include any distributions that our General Partner may receive on limited partner units that it owns.
16
The following table presents distributions for 2012 and 2011 (In millions, except per unit data):
| Distribution Paid | ||||||||||||||||||||||||||||||||
| Limited Partners | General Partner | |||||||||||||||||||||||||||||||
| Payment Date |
Attributable to the Quarter Ended |
Per Unit Distribution |
Cash paid to common |
Paid-In- Kind Value to Class C unitholders |
Cash paid to General Partner and IDR |
Paid-In- Kind Value to Class C unitholders |
Total Cash |
Total Distribution |
||||||||||||||||||||||||
| 2013 |
||||||||||||||||||||||||||||||||
| February 12, 2013 |
December 31, 2012 | $ | 0.51 | $ | 21.0 | $ | 3.7 | $ | 4.1 | $ | 0.6 | $ | 25.1 | $ | 29.4 | |||||||||||||||||
| 2012 |
||||||||||||||||||||||||||||||||
| November 9, 2012 |
September 30, 2012 | $ | 0.51 | $ | 21.0 | $ | 3.5 | $ | 4.1 | $ | 0.6 | $ | 25.1 | $ | 29.2 | |||||||||||||||||
| August 10, 2012 |
June 30, 2012 | $ | 0.50 | $ | 20.6 | $ | 3.4 | $ | 3.7 | $ | 0.5 | $ | 24.3 | $ | 28.2 | |||||||||||||||||
| May 11, 2012 |
March 31, 2012 | $ | 0.50 | $ | 18.2 | $ | 3.4 | $ | 3.3 | $ | 0.5 | $ | 21.5 | $ | 25.4 | |||||||||||||||||
| February 10, 2012 |
December 31, 2011 | $ | 0.49 | $ | 17.9 | $ | 3.2 | $ | 2.8 | $ | 0.5 | $ | 20.7 | $ | 24.4 | |||||||||||||||||
| 2011 |
||||||||||||||||||||||||||||||||
| November 10, 2011 |
September 30, 2011 | $ | 0.48 | $ | 15.8 | $ | 3.1 | $ | 2.3 | $ | 0.4 | $ | 18.1 | $ | 21.6 | |||||||||||||||||
| August 12, 2011 |
June 30, 2011 | $ | 0.46 | $ | 15.2 | $ | 2.9 | $ | 1.6 | $ | 0.2 | $ | 16.8 | $ | 19.9 | |||||||||||||||||
| May 13, 2011 |
March 31, 2011 | $ | 0.44 | $ | 13.7 | $ | 2.7 | $ | 1.1 | $ | 0.2 | $ | 14.8 | $ | 17.7 | |||||||||||||||||
| February 11, 2011 |
December 31, 2010 | $ | 0.43 | $ | 13.4 | $ | — | $ | 0.9 | $ | — | $ | 14.3 | $ | 14.3 | |||||||||||||||||
Our Class C units are substantially similar in all respects to our existing common units, representing limited partner interests, except that we have the option to pay distributions to our Class C unitholders with cash or by issuing additional Paid-In-Kind Class C units based upon the volume weighted-average price of our common units for the 10 trading days immediately preceding the date the distribution is declared. We issued 633,084 and 473,731 additional Class C units in lieu of paying in cash quarterly distributions on our Class C units for the years ended December 31, 2012 and 2011. In February 2013, we issued an additional 183,995 Class C units in quarterly distributions. Additionally, in April 2013, our outstanding Class C units will convert to common units on a one-for-one basis. Quarterly distributions on these converted units will be paid with cash.
In conjunction with the acquisition of the 65% membership interest in CMM in January 2013, we issued 6,190,469 Class D units, representing limited partner interests in us to Crestwood Holdings. Our Class D units are similar in certain respects to our existing common units and Class C units, except that we have the option to pay distributions to our Class D unitholders for a period of one year with cash or by issuing additional Paid-In-Kind Class D units based upon the volume weighted-average price of our common units for the 10 trading days immediately preceding the date the distribution is declared. The Class D units issued in January 2013 will not participate in the dividend paid on February 12, 2013. In March 2014, our outstanding Class D units will convert to common units on a one-for-one basis.
5. FINANCIAL INSTRUMENTS
Fair Values
We separate the fair values of our financial instruments into three levels (Levels 1, 2 and 3) based on our assessment of the availability of observable market data and the significance of non-observable data used to determine fair value. Our assessment and classification of an instrument within a level can change over time based on the maturity or liquidity of the instrument and would be reflected at the end of the period in which the change occurs. During the years ended December 31, 2012 and 2011, there have been no changes to the inputs and valuation techniques used to measure fair value, the types of instruments, or the levels in which they are classified.
Cash and Cash Equivalents, Accounts Receivable and Accounts Payable. As of December 31, 2012 and 2011, the carrying amounts of cash and cash equivalents, accounts receivable and accounts payable represent fair value based on the short-term nature of these instruments.
Credit Facilities. The fair value of our credit facilities approximates their carrying amounts as of December 31, 2012 and 2011 due primarily to the variable nature of the interest rate of the instruments, which is considered a Level 2 fair value measurement.
17
Senior Notes. We estimated the fair value of our Senior Notes (representing a Level 2 fair value measurement) primarily based on quoted market prices for the same or similar issuances. The following table reflects the carrying value and fair value of our Senior Notes (In millions):
| As of December 31, | ||||||||||||||||
| 2012 | 2011 | |||||||||||||||
| Carrying Amount |
Fair Value |
Carrying Amount |
Fair Value |
|||||||||||||
| Senior Notes |
$ | 351 | $ | 365 | $ | 200 | $ | 197 | ||||||||
Debt
Our long-term debt consisted of the following at December 31 (In thousands):
| 2012 | 2011 | |||||||
| CMM Credit Facility, due March 2017 |
$ | 127,000 | $ | — | ||||
| CMLP Credit Facility, due November 2017 |
206,700 | 312,500 | ||||||
| Senior Notes, due April 2019 |
350,000 | 200,000 | ||||||
|
|
|
|
|
|||||
| 683,700 | 512,500 | |||||||
| Plus: Unamortized premium on Senior Notes |
1,461 | — | ||||||
|
|
|
|
|
|||||
| Total long-term debt |
$ | 685,161 | $ | 512,500 | ||||
|
|
|
|
|
|||||
Credit Facilities
CMM Credit Facility. On March 26, 2012, in conjunction with the acquisition of Antero’s gathering system assets, we entered into a credit agreement with certain lenders. The five year term credit agreement allows for revolving loans, letters of credit and swingline loans in an aggregate principal amount of up to $200 million (CMM Credit Facility). The CMM Credit Facility is secured by substantially all its assets.
Borrowings under the CMM Credit Facility bear interest at the London Interbank Offered Rate (LIBOR) plus an applicable margin or a base rate as defined in the credit agreement. Under the terms of the CMM Credit Facility, the applicable margin under LIBOR borrowings was 2.5%. The weighted-average interest rate as of December 31, 2012 was 2.8%. Our borrowings under the CMM Credit Facility were $127 million as of December 31, 2012, and based on our results through December 31, 2012, our remaining available capacity under the credit facility was $59 million. For the period from March 26, 2012 to December 31, 2012, our average and maximum outstanding borrowings were approximately $18 million and $130 million.
Our CMM Credit Facility requires us to maintain:
| • | a ratio of our trailing 12-month EBITDA (as defined in the credit agreement) to our net interest expense of not less than 2.0 to 1.0; and |
| • | a ratio of total indebtedness to trailing 12-month EBITDA (as defined in the credit agreement) of not more than 4.5 to 1.0, or not more than 5.0 to 1.0 for up to nine months following certain acquisitions. |
CMLP Credit Facility. Our senior secured credit facility, as amended (CMLP Credit Facility), allows for revolving loans, letters of credit and swingline loans in an aggregate amount of up to $550 million. Our CMLP Credit Facility matures on November 16, 2017 and is secured by substantially all of our assets and those of certain of our subsidiaries. As of December 31, 2012, our Credit Facility is guaranteed by our 100% owned subsidiaries except for CMM and its consolidated subsidiaries.
Borrowings under the CMLP Credit Facility bear interest at LIBOR plus an applicable margin or a base rate as defined in the credit agreement. Under the terms of the CMLP Credit Facility, the applicable margin under LIBOR borrowings was 2.5% and 3.0% at December 31, 2012 and 2011. The weighted-average interest rate as of December 31, 2012 and 2011 was 2.8% and 3.3%. Our borrowings under the CMLP Credit Facility were approximately $207 million and $312 million as of December 31, 2012 and 2011, and based on our results through December 31, 2012, our remaining available capacity under the CMLP Credit Facility was $167 million. For the year ended December 31, 2012 and 2011, our average outstanding borrowings were $305 million and $325 million. For the year ended December 31, 2012 and 2011, our maximum outstanding borrowings were $375 million and $282 million.
18
Our CMLP Credit Facility requires us to maintain:
| • | a ratio of our consolidated trailing 12-month EBITDA (as defined in the CMLP Credit Facility) to our net interest expense of not less than 2.5 to 1.0; and |
| • | a ratio of total indebtedness to consolidated trailing 12-month EBITDA (as defined in the CMLP Credit Facility) of not more than 5.0 to 1.0, or not more than 5.5 to 1.0 for up to nine months following certain acquisitions. |
As of December 31, 2012, we were in compliance with the financial covenants under our CMM and CMLP credit facilities.
Our credit facilities contain restrictive covenants that prohibit the declaration or payment of distributions by us if a default then exists or would result therefrom, and otherwise limits the amount of distributions that we can make. An event of default may result in the acceleration of our repayment of outstanding borrowings under the Credit Facility, the termination of the Credit Facility and foreclosure on collateral.
Senior Notes
On April 1, 2011, we issued $200 million of senior notes, which accrue interest at the rate of 7.75% per annum and mature in April 2019. On November 8, 2012, we issued an additional $150 million of these notes in a private placement offering. The $150 million senior notes have the same terms as our $200 million senior notes. The net proceeds from the offering were used to reduce our indebtedness under our Credit Facility.
Our obligations under the Senior Notes are guaranteed on an unsecured basis by certain of our current and future domestic subsidiaries. Interest is payable semi-annually in arrears on April 1 and October 1 of each year. Our Senior Notes require us to maintain a ratio of our consolidated trailing 12-month EBITDA (as defined in the indenture governing the Senior Notes) to fixed charges of at least 1.75 to 1.0. As of December 31, 2012, we were in compliance with this covenant.
Bridge Loans
In February 2011, in connection with the Frontier Gas Acquisition, we obtained commitments from multiple lenders for senior unsecured bridge loans in an aggregate amount up to $200 million. The commitment was terminated on April 1, 2011 in conjunction with the issuance of the Senior Notes described above. We incurred approximately $3 million of commitment fees during the year ended December 31, 2011, which was included in interest expense on our consolidated statement of income.
Subordinated Note
In August 2007, we executed the Subordinated Note payable to Quicksilver in the principal amount of $50 million. The Subordinated Note was assigned to Crestwood Holdings as part of the Crestwood Transaction on October 1, 2010. Our Credit Facility required us to terminate the Subordinated Note through the issuance of additional common units during 2010. The conversion into common units was determined based upon the average closing common unit price for a 20 trading-day period that ended October 15, 2010. We issued 2,333,712 of our common units to Crestwood Holding in exchange for the outstanding balance of the Subordinated Note at the time of the conversion.
6. PROPERTY, PLANT AND EQUIPMENT
The table below presents the details of our property, plant and equipment (In thousands):
| December 31, | ||||||||||||
| Depreciable Life | 2012 | 2011 | ||||||||||
| Gathering systems |
20 years | $ | 450,989 | $ | 298,207 | |||||||
| Processing plants and compression facilities |
20-25 years | 490,991 | 429,908 | |||||||||
| Rights-of-way and easements |
20 years | 60,502 | 50,085 | |||||||||
| Buildings and other |
5-40 years | 7,385 | 5,958 | |||||||||
| Land |
— | 4,698 | 4,674 | |||||||||
| Construction in progress |
— | 55,311 | 47,073 | |||||||||
|
|
|
|
|
|||||||||
| Property, plant and equipment |
1,069,876 | 835,905 | ||||||||||
| Accumulated depreciation |
(130,030 | ) | (89,860 | ) | ||||||||
|
|
|
|
|
|||||||||
| Property, plant and equipment, net |
$ | 939,846 | $ | 746,045 | ||||||||
|
|
|
|
|
|||||||||
19
We have capital lease assets of approximately $12 million and $9 million included in our property, plant and equipment at December 31, 2012 and 2011.
During the year ended December 31, 2012, we recorded an impairment of approximately $1.6 million of our property, plant and equipment to write certain of our assets down to their fair value of zero (which is a Level 3 fair value measurement) as a result of a compressor building fire that occurred on September 6, 2012 at our Corvette processing plant in our Barnett Segment. This impairment, in addition to approximately $1.3 million of other operations and maintenance costs incurred related to the incident, is recoverable under our insurance policies and is recorded in Prepaid Expenses and Other current assets on our balance sheet as of December 31, 2012.
During the year ended December 31, 2011, we recorded a gain of approximately $1 million on the exchange of property, plant and equipment under an agreement with a third party to exchange the delivery of certain processing plants that were under contract. We received proceeds of approximately $6 million on the exchange.
7. INTANGIBLE ASSETS
Our intangible assets consist of acquired gas gathering, compression and processing contracts. The following table presents the changes in our intangible assets (In thousands):
| December 31, | ||||||||
| 2012 | 2011 | |||||||
| Net intangible assets at January 1 |
$ | 127,760 | $ | — | ||||
| Additions |
383,994 | 130,200 | ||||||
| Amortization expense |
(10,374 | ) | (2,440 | ) | ||||
|
|
|
|
|
|||||
| Net intangible assets at December 31 |
$ | 501,380 | $ | 127,760 | ||||
|
|
|
|
|
|||||
Our gas gathering and processing contracts have useful lives of 5 to 20 years, as determined based upon the anticipated life of the contracts with our customers. The expected amortization of our intangible assets as of December 31, 2012 for the next five years and in total thereafter is as follows (In thousands):
| 2013 |
$ | 21,983 | ||
| 2014 |
23,832 | |||
| 2015 |
25,144 | |||
| 2016 |
26,414 | |||
| 2017 |
28,678 | |||
| Thereafter |
375,329 | |||
|
|
|
|||
| Total |
$ | 501,380 | ||
|
|
|
8. ACCOUNTS PAYABLE, ACCRUED EXPENSES AND OTHER LIABILITIES
The table below presents the details of our accounts payable, accrued expenses and other liabilities (In thousands):
| December 31, | ||||||||
| 2012 | 2011 | |||||||
| Accrued expenses |
$ | 9,608 | $ | 3,175 | ||||
| Accrued property taxes |
5,638 | 5,204 | ||||||
| Accrued product purchases payable |
2,450 | 3,594 | ||||||
| Tax payable |
2,159 | 1,545 | ||||||
| Interest payable |
7,505 | 4,788 | ||||||
| Accounts payable |
2,278 | 5,128 | ||||||
| Tristate Acquisition deferred payment (Note 3) |
— | 8,000 | ||||||
| Other |
79 | 360 | ||||||
|
|
|
|
|
|||||
| Total accounts payable, accrued expenses and other liabilities |
$ | 29,717 | $ | 31,794 | ||||
|
|
|
|
|
|||||
20
9. ASSET RETIREMENT OBLIGATIONS
We have legal obligations associated with right-of-way contracts we hold and at our facilities whether owned or leased. Where we can reasonably estimate the asset retirement obligation, we accrue a liability based on an estimate of the timing and amount of settlement. We record changes in these estimates based on changes in the expected amount and timing of payments to settle our obligations.
The following table presents the changes in the net asset retirement obligations for the years ended December 31, 2012 and 2011 (In thousands):
| December 31, | ||||||||
| 2012 | 2011 | |||||||
| Net asset retirement obligation at January 1 |
$ | 11,545 | $ | 9,877 | ||||
| Liabilities incurred |
425 | 140 | ||||||
| Acquisitions |
1,358 | 1,744 | ||||||
| Accretion expense |
696 | 508 | ||||||
| Changes in estimate |
— | (724 | ) | |||||
|
|
|
|
|
|||||
| Net asset retirement obligation at December 31 |
$ | 14,024 | $ | 11,545 | ||||
|
|
|
|
|
|||||
We did not have any material assets that were legally restricted for use in settling asset retirement obligations as of December 31, 2012 and 2011.
10. COMMITMENTS AND CONTINGENT LIABILITIES
Legal Proceedings
From time to time, we are party to certain legal or administrative proceedings that arise in the ordinary course and are incidental to our business. There are currently no such pending proceedings to which we are a party that our management believes will have a material adverse effect on our results of operations, cash flows or financial condition. However, future events or circumstances, currently unknown to management, will determine whether the resolution of any litigation or claims will ultimately have a material effect on our results of operations, cash flows or financial condition in any future reporting periods. As of December 31, 2012, we had less than $0.1 million accrued for our legal proceedings.
Regulatory Compliance
In the ordinary course of our business, we are subject to various laws and regulations. In the opinion of our management, compliance with current laws and regulations will not have a material effect on our results of operations, cash flows or financial condition.
Environmental Compliance
Our operations are subject to stringent and complex laws and regulations pertaining to health, safety, and the environment. We are subject to laws and regulations at the federal, state and local levels that relate to air and water quality, hazardous and solid waste management and disposal and other environmental matters. The cost of planning, designing, constructing and operating our facilities must incorporate compliance with environmental laws and regulations and safety standards. Failure to comply with these laws and regulations may trigger a variety of administrative, civil and potentially criminal enforcement measures. At December 31, 2012, we had accrued approximately $0.2 million for environmental matters, which is based on our undiscounted estimate of amounts we will spend on environmental compliance and remediation. We estimate that our potential liability for reasonably possible outcomes related to our environmental exposures could range from approximately $0.2 million to $0.3 million. We had no accruals for environmental matters at December 31, 2011.
Commitments and Purchase Obligations
Capital Leases. We have a compressor, treating facility and auto leases which are accounted for as capital leases. The terms of the agreements vary from 2013 until 2016. We recorded amortization of expense of approximately $3 million and $2 million for the years ended December 31, 2012 and 2011. We had no capital leases during 2010.
21
Future minimum lease payments related to our capital leases at December 31, 2012 are as follows (In thousands):
| 2013 |
$ | 4,020 | ||
| 2014 |
2,269 | |||
| 2015 |
866 | |||
| 2016 |
219 | |||
|
|
|
|||
| Total payments |
7,374 | |||
| Imputed interest |
(351 | ) | ||
|
|
|
|||
| Present value of future payments |
$ | 7,023 | ||
|
|
|
Operating Leases. We maintain operating leases in the ordinary course of our business activities. These leases include those for office buildings and other operating facilities and equipment. The terms of the agreements vary from 2013 until 2032. Future minimum annual rental commitments under our operating leases at December 31, 2012, were as follows (In thousands):
| 2013 |
$ | 936 | ||
| 2014 |
687 | |||
| 2015 |
439 | |||
| 2016 |
114 | |||
| 2017 |
47 | |||
| Thereafter |
15 | |||
|
|
|
|||
| Total |
$ | 2,238 | ||
|
|
|
Rental expense was approximately $7 million, $8 million and $1 million for the years ended December 31, 2012, 2011 and 2010.
Purchase Commitments. At December 31, 2012, we had capital commitments of approximately $11.6 million to purchase equipment related to our capital projects. We have other planned capital projects that are discretionary in nature, with no substantial contractual capital commitments made in advance of the actual expenditures.
Other. In connection with the Antero Acquisition, we agreed to pay Antero conditional consideration in the form of potential additional cash payments of up to $40 million, depending on the achievement of certain defined average annual production levels achieved during 2012, 2013 and 2014. During 2012, Antero did not meet the annual production level to earn additional payments. Based on actual volumes received in 2012 and expected volumes, we do not believe that it is probable that Antero will be able to achieve these average annual production levels in 2013 and 2014.
11. INCOME TAXES
No provision for federal or state income taxes is included in our results of operations as such income is taxable directly to the partners. Accordingly, each partner is responsible for its share of federal and state income tax. Net earnings for financial statement purposes may differ significantly from taxable income reportable to each partner as a result of differences between the tax basis and financial reporting basis of assets and liabilities.
We are responsible for our portion of the Texas Margin tax that is included in Crestwood Holdings’ consolidated Texas franchise tax return. Our current tax liability will be assessed based on 0.7% of the gross revenue apportioned to Texas. The margin tax qualifies as an income tax under GAAP, which requires us to recognize the impact of this tax on the temporary differences between the financial statement assets and liabilities and their tax basis attributable to such tax. For the years ended December 31, 2012, 2011 and 2010, there were no temporary differences recognized in our consolidated statements of income.
Prior to the closing of the Crestwood Transaction on October 1, 2010, our activity was included in Quicksilver’s Texas Franchise tax combined report. As a result, we had a deferred tax liability which represented the change in the tax basis and financial reporting basis of our assets and liabilities. During 2010, we reversed a deferred tax liability of $0.8 million as a result of the change in organization structure with the Crestwood Transaction.
22
Uncertain Tax Positions. We evaluate the uncertainty in tax positions taken or expected to be taken in the course of preparing our consolidated financial statements to determine whether the tax positions are more likely than not of being sustained by the applicable tax authority. Tax positions with respect to tax at the partnership level deemed not to meet the more likely than not threshold would be recorded as a tax benefit or expense in the current year. We believe that there are no uncertain tax positions that would impact our operations for the years ended December 31, 2012, 2011 and 2010 and that no provision for income tax is required for these consolidated financial statements. However, our conclusions regarding the evaluation are subject to review and may change based on factors including, but not limited to, ongoing analyses of tax laws, regulations and interpretations thereof.
12. EQUITY PLAN
Awards of phantom and restricted units have been granted under our Fourth Amended and Restated 2007 Equity Plan (2007 Equity Plan). The following table summarizes information regarding phantom and restricted unit activity:
| Payable In Cash | Payable In Units | |||||||||||||||
| Units | Weighted- Average Grant Date Fair Value |
Units | Weighted- Average Grant Date Fair Value |
|||||||||||||
| Unvested—December 31, 2010 |
— | $ | — | 121,526 | $ | 27.11 | ||||||||||
| Vested—phantom units |
— | — | — | — | ||||||||||||
| Granted—phantom units |
15,294 | 26.77 | 19,411 | 27.56 | ||||||||||||
| Granted—restricted units |
— | — | 10,000 | 27.70 | ||||||||||||
| Cancelled—phantom units |
(1,948 | ) | 29.31 | (22,142 | ) | 27.16 | ||||||||||
|
|
|
|
|
|||||||||||||
| Unvested—December 31, 2011 |
13,346 | $ | 26.40 | 128,795 | $ | 27.22 | ||||||||||
| Vested—phantom units |
(4,267 | ) | 26.46 | (40,929 | ) | 27.21 | ||||||||||
| Vested—restricted units |
— | — | (4,682 | ) | 27.53 | |||||||||||
| Granted—phantom units |
— | — | 126,246 | 29.90 | ||||||||||||
| Granted—restricted units |
— | — | 37,500 | 25.67 | ||||||||||||
| Canceled—phantom units |
(767 | ) | 25.63 | (24,938 | ) | 28.30 | ||||||||||
|
|
|
|
|
|||||||||||||
| Unvested—December 31, 2012 |
8,312 | $ | 26.45 | 221,992 | $ | 28.35 | ||||||||||
|
|
|
|
|
|||||||||||||
As of December 31, 2012 and 2011, we had total unamortized compensation expense of approximately $3 million and $2 million related to phantom and restricted units, which we expect will be amortized over three years (the original vesting period of these instruments), except for grants to non-employee directors of our General Partner which vest over one year. We recognized compensation expense of approximately $2 million and $1 million for the years ended December 31, 2012 and 2011, included in operating expenses on our consolidated statements of income. We granted phantom and restricted units with a grant date fair value of approximately $5 million and $0.8 million for the years ended December 31, 2012 and 2011. As of December 31, 2012 and 2011, we had 505,791 units and 633,211 units available for issuance under the 2007 Equity Plan.
Under the 2007 Equity Plan, participants who have been granted restricted units may elect to have us withhold common units to satisfy minimum statutory tax withholding obligations arising in connection with the vesting of non-vested common units. Any such common units withheld are returned to the 2007 Equity Plan on the applicable vesting dates, which correspond to the times at which income is recognized by the employee. When we withhold these common units, we are required to remit to the appropriate taxing authorities the fair value of the units withheld as of the vesting date. The number of units withheld is determined based on the closing price per common unit as reported on the NYSE on such dates. For the year ended December 31, 2012, we withheld 1,405 common units to satisfy employee tax withholding obligations. The withholding of common units by us could be deemed a purchase of the common units. There were no common units withheld to satisfy employee tax withholding obligations for the years ended December 31, 2011 and 2010.
23
13. TRANSACTIONS WITH RELATED PARTIES
Affiliate Revenues and Expenses
Our General Partner is owned by Crestwood Holdings. The affiliates of Crestwood Holdings and its owners are considered our related parties, including Sabine Oil and Gas LLC, and Mountaineer Keystone, LLC. In addition, under the agreements governing the Crestwood Transaction, Quicksilver is entitled to appoint a director to our General Partner’s board of directors until the later of the second anniversary of the closing or such time as Quicksilver generates less than 50% of our consolidated revenue in any fiscal year. As such, Quicksilver, qualifies as a related party.
We enter into transactions with our affiliates within the ordinary course of business and the services are based on the same terms as non-affiliates, including gas gathering and processing services under long-term contracts, product purchases and various operating agreements.
We do not have any employees. We are managed and operated by the directors and officers of our General Partner. We have an omnibus agreement with Crestwood Holdings and our General Partner under which we reimburse Crestwood Holdings for the provision of various general and administrative services for our benefit and for direct expenses incurred by Crestwood Holdings on our behalf. Crestwood Holdings bills us directly for certain general and administrative costs and allocates a portion of its general and administrative costs to us. Prior to the closing of the Crestwood Transaction, employees of Quicksilver provided general and administrative services for our benefit. The allocations from Crestwood Holdings and Quicksilver were based on the estimated level of effort devoted to our operations.
The table below shows overall revenues, expenses and reimbursements from our affiliates for the years ended December 31, 2012, 2011 and 2010 (In millions):
| Year Ended December 31, | ||||||||||||
| 2012 | 2011 | 2010 | ||||||||||
| Operating revenues |
$ | 114 | $ | 131 | $ | 105 | ||||||
| Operating expenses |
35 | 18 | 21 | |||||||||
| Reimbursements of operating expenses |
1 | 2 | — | (1) | ||||||||
| (1) | Amount was less than $1 million. |
Distributions
Prior to Quicksilver’s sale of us to Crestwood Holdings on October 1, 2010, we paid cash distributions to Quicksilver in 2010 of approximately $80 million, including the conversion of the Subordinated Note Payable to common units for approximately $50 million.
14. PARTNERS’ CAPITAL
During 2012 and 2011, we completed public offerings of common units, representing limited partner interests. The net proceeds from these offerings were used to reduce indebtedness under our Credit Facility and to fund our acquisitions.
In April 2011, we issued Class C units, representing limited partner interests, in a private placement offering. The net proceeds from the April 2011 offering were used to finance a portion of our Frontier Gas Acquisition. The Class C units will convert into common units on a one-for-one basis on the second anniversary of the date of issuance.
The table below presents our common unit and Class C unit issuances during 2012 and 2011 (In millions, except units and per unit data):
| Issuance Date |
Units | Per Unit Gross Price |
Per Unit Net Price (1) |
Net Proceeds |
||||||||||||
| April 1, 2011 |
6,243,000 | (2) | $ | 24.50 | $ | — | $ | 153 | ||||||||
| May 4, 2011 |
1,800,000 | $ | 30.65 | $ | 29.75 | 53 | ||||||||||
| January 13, 2012 |
3,500,000 | $ | 30.73 | $ | 29.50 | 103 | ||||||||||
| July 25, 2012 |
4,600,000 | (3) | $ | 26.00 | $ | 24.97 | 115 | |||||||||
| (1) | Price is net of underwriting discounts. |
| (2) | Represents Class C units. |
| (3) | Includes 600,000 units that were issued in August 2012. |
24
During 2012, our General Partner made additional capital contributions of approximately $6 million in exchange for the issuance of an additional 215,722 general partner units. During 2011, our General Partner made an additional capital contribution of approximately $9 million in exchange for the issuance of an additional 293,948 general partner units.
In January 2013, we issued 6,190,469 Class D units, representing limited partner interests in us, to Crestwood Holdings in connection with our acquisition of Crestwood Holdings’ 65% membership interest in CMM. Our Class D units are similar in certain respects to our existing common units and Class C units, except that we have the option to pay distributions to our Class D unitholders with cash or by issuing additional Paid-In-Kind Class D units based upon the volume weighted-average price of our common units for the 10 trading days immediately preceding the date the distribution is declared. In March 2014, our outstanding Class D units will convert to common units.
15. SEGMENT INFORMATION
Our operations include four reportable operating segments. These operating segments reflect the way we internally report the financial information used to make decisions and allocate resources in connection with our operations. We evaluate the performance of our operating segments based on EBITDA, which represents operating income plus, depreciation, amortization and accretion expense.
Our reportable segments reflect the primary geographic areas in which we operate and consist of Barnett, Fayetteville, Granite Wash and Marcellus, all of which are located within the United States. Our reportable segments are engaged in the gathering, processing, treating, compression, transportation and sales of natural gas and delivery of NGLs. Our Other operating segment consists of those operating segments or reporting units that did not meet quantitative reporting thresholds.
As of December 31, 2012, we managed 849 miles of natural gas gathering pipelines and approximately 259,000 hp of compression equipment. For the years ended December 31, 2012, 2011 and 2010, one of our customers in the Barnett segment, which is a related party, accounted for 47%, 64% and 93% of our total revenues. In addition, in our Fayetteville and Marcellus segments, one customer in each respective segment accounted for 11% of our total revenues for the year ended December 31, 2012.
The following table is a reconciliation of Net Income to EBITDA (In thousands):
| For the Year Ended December 31, | ||||||||||||
| 2012 | 2011 | 2010 | ||||||||||
| Net income |
$ | 38,889 | $ | 45,003 | $ | 34,872 | ||||||
| Add: |
||||||||||||
| Interest and debt expense |
35,765 | 27,617 | 13,550 | |||||||||
| Income tax expense (benefit) |
1,206 | 1,251 | (550 | ) | ||||||||
| Depreciation, amortization and accretion expense |
51,908 | 33,812 | 22,359 | |||||||||
|
|
|
|
|
|
|
|||||||
| EBITDA |
$ | 127,768 | $ | 107,683 | $ | 70,231 | ||||||
|
|
|
|
|
|
|
|||||||
The following tables reflect our segment results as of and for the years ended December 31, 2012, 2011 and 2010 (In thousands):
| Year Ended December 31, 2012 | ||||||||||||||||||||||||||||
| Barnett (1) | Fayetteville | Granite Wash |
Marcellus (2) | Other | Corporate | Total | ||||||||||||||||||||||
| Operating revenues |
$ | 20,396 | $ | 27,498 | $ | 39,450 | $ | 25,502 | $ | 12,874 | $ | — | $ | 125,720 | ||||||||||||||
| Operating revenues—related party |
112,637 | — | 1,106 | — | — | — | 113,743 | |||||||||||||||||||||
| Product purchases |
125 | 523 | 20,543 | — | 2,662 | — | 23,853 | |||||||||||||||||||||
| Product purchases—related party |
— | — | 15,152 | — | — | — | 15,152 | |||||||||||||||||||||
| Operations and maintenance expense |
26,881 | 8,537 | 2,250 | 2,491 | 2,949 | — | 43,108 | |||||||||||||||||||||
| General and administrative expense |
— | — | — | — | — | 29,582 | 29,582 | |||||||||||||||||||||
|
|
|
|
|
|
|
|
|
|
|
|
|
|
|
|||||||||||||||
| EBITDA |
$ | 106,027 | $ | 18,438 | $ | 2,611 | $ | 23,011 | $ | 7,263 | $ | (29,582 | ) | $ | 127,768 | |||||||||||||
|
|
|
|
|
|
|
|
|
|
|
|
|
|
|
|||||||||||||||
| Goodwill |
$ | — | $ | 76,767 | $ | 14,211 | $ | — | $ | 4,053 | $ | — | $ | 95,031 | ||||||||||||||
| Total assets |
$ | 618,647 | $ | 300,593 | $ | 80,876 | $ | 505,816 | $ | 81,862 | $ | 22,675 | $ | 1,610,469 | ||||||||||||||
| Capital expenditures |
$ | 13,903 | $ | 10,954 | $ | 4,787 | $ | 17,079 | $ | 4,797 | $ | 1,052 | $ | 52,572 | ||||||||||||||
| (1) | Includes four months of operating income from the Devon Acquisition, from August 24, 2012 to December 31, 2012, subsequent to acquisition. |
| (2) | Includes nine months of operating income from the Antero Acquisition, from March 26, 2012 to December 31, 2012, subsequent to acquisition. |
25
| Year Ended December 31, 2011 | ||||||||||||||||||||||||||||
| Barnett | Fayetteville (1) | Granite Wash (1) |
Marcellus | Other (2) (3) | Corporate | Total | ||||||||||||||||||||||
| Operating revenues |
$ | 8,859 | $ | 20,800 | $ | 38,213 | $ | — | $ | 6,723 | $ | — | $ | 74,595 | ||||||||||||||
| Operating revenues—related party |
131,225 | — | — | — | — | — | 131,225 | |||||||||||||||||||||
| Product purchases |
— | 1,302 | 33,245 | — | 4,240 | — | 38,787 | |||||||||||||||||||||
| Operations and maintenance expense |
25,147 | 8,992 | 1,499 | — | 665 | — | 36,303 | |||||||||||||||||||||
| General and administrative expense |
— | — | — | — | — | 24,153 | 24,153 | |||||||||||||||||||||
| Gain from exchange of property, plant and equipment |
— | — | — | — | — | 1,106 | 1,106 | |||||||||||||||||||||
|
|
|
|
|
|
|
|
|
|
|
|
|
|
|
|||||||||||||||
| EBITDA |
$ | 114,937 | $ | 10,506 | $ | 3,469 | $ | — | $ | 1,818 | $ | (23,047 | ) | $ | 107,683 | |||||||||||||
|
|
|
|
|
|
|
|
|
|
|
|
|
|
|
|||||||||||||||
| Goodwill |
$ | — | $ | 76,767 | $ | 16,861 | $ | — | $ | — | $ | — | $ | 93,628 | ||||||||||||||
| Total assets |
$ | 545,656 | $ | 300,338 | $ | 77,313 | $ | — | $ | 85,307 | $ | 18,278 | $ | 1,026,892 | ||||||||||||||
| Capital expenditures |
$ | 19,999 | $ | 17,757 | $ | 7,960 | $ | — | $ | 2,041 | $ | 648 | $ | 48,405 | ||||||||||||||
| (1) | Includes nine months of operating income for Fayetteville and Granite Wash, from April 1, 2011 to December 31, 2011, subsequent to acquisition. |
| (2) | Includes approximately eleven months of operating income for Las Animas System, from February 16, 2011 to December 31, 2011, subsequent to acquisition. |
| (3) | Includes two months of operating income for Sabine System, from November 1, 2011 to December 31, 2011, subsequent to acquisition. |
| Year Ended December 31, 2010 | ||||||||||||||||||||||||||||
| Barnett | Fayetteville | Granite Wash |
Marcellus | Other | Corporate | Total | ||||||||||||||||||||||
| Operating revenues |
$ | 8,355 | $ | — | $ | — | $ | — | $ | — | $ | — | $ | 8,355 | ||||||||||||||
| Operating revenues—related party |
105,235 | — | — | — | — | — | 105,235 | |||||||||||||||||||||
| Operations and maintenance expense |
25,702 | — | — | — | — | — | 25,702 | |||||||||||||||||||||
| General and administrative expense |
— | — | — | — | — | 17,657 | 17,657 | |||||||||||||||||||||
|
|
|
|
|
|
|
|
|
|
|
|
|
|
|
|||||||||||||||
| EBITDA |
$ | 87,888 | $ | — | $ | — | $ | — | $ | — | $ | (17,657 | ) | $ | 70,231 | |||||||||||||
|
|
|
|
|
|
|
|
|
|
|
|
|
|
|
|||||||||||||||
| Total assets |
$ | 557,163 | $ | — | $ | — | $ | — | $ | — | $ | 13,464 | $ | 570,627 | ||||||||||||||
| Capital expenditures |
$ | 69,069 | $ | — | $ | — | $ | — | $ | — | $ | — | $ | 69,069 | ||||||||||||||
26
16. CONDENSED CONSOLIDATING FINANCIAL STATEMENTS
CMLP’s (Issuer) Credit Facility and Senior Notes are fully and unconditionally guaranteed, jointly and severally, by our present and future direct and indirect 100% owned subsidiaries (the Guarantor Subsidiaries), except for CMM and its consolidated subsidiaries (the Non-Guarantor Subsidiaries). CMLP issued the Senior Notes together with Crestwood Midstream Finance Corporation (Co-Issuer). The Co-Issuer is our 100% owned subsidiary and has no material assets, operations, revenues or cash flows other than those related to its services as co-issuer of our Senior Notes. Accordingly, it has no ability to service obligations on our debt securities. We have revised our condensed consolidating financial statements to present the co-issuer column, which did not have a material impact to our previous condensed consolidating financial statements.
The following reflects condensed consolidating financial information of the Issuer, Co-Issuer, Guarantor Subsidiaries, Non-Guarantor Subsidiaries, eliminating entries to combine the entities and the consolidated results of CMLP as of and for the year ended December 31, 2012. We have not reflected condensed consolidating financial information as of and for the year ended December 31, 2011 or 2010 because CMM was formed during the first quarter of 2012 and, prior to CMM’s formation, all of CMLP’s 100% owned subsidiaries fully and unconditionally guaranteed CMLP’s Credit Facility and Senior Notes and CMLP had no independent assets or operations.
| For the Year Ended December 31, 2012 | ||||||||||||||||||||||||
| Issuer | Co- Issuer |
Guarantor Subsidiaries |
Non- Guarantor Subsidiaries |
Eliminations | Consolidated | |||||||||||||||||||
| (In thousands) | ||||||||||||||||||||||||
| Operating revenues |
$ | — | $ | — | $ | 213,961 | $ | 25,502 | $ | — | $ | 239,463 | ||||||||||||
| Operating expenses |
607 | — | 150,631 | 12,365 | — | 163,603 | ||||||||||||||||||
|
|
|
|
|
|
|
|
|
|
|
|
|
|||||||||||||
| Operating income (loss) |
(607 | ) | — | 63,330 | 13,137 | — | 75,860 | |||||||||||||||||
| Interest and debt expense |
(33,388 | ) | — | (230 | ) | (2,147 | ) | — | (35,765 | ) | ||||||||||||||
|
|
|
|
|
|
|
|
|
|
|
|
|
|||||||||||||
| Income (loss) before income tax |
(33,995 | ) | — | 63,100 | 10,990 | — | 40,095 | |||||||||||||||||
| Income tax expense |
— | — | 1,206 | — | — | 1,206 | ||||||||||||||||||
|
|
|
|
|
|
|
|
|
|
|
|
|
|||||||||||||
| Income (loss) before earnings from consolidated subsidiaries |
(33,995 | ) | — | 61,894 | 10,990 | — | 38,889 | |||||||||||||||||
| Earnings (loss) from consolidated subsidiaries |
72,884 | — | — | — | (72,884 | ) | — | |||||||||||||||||
|
|
|
|
|
|
|
|
|
|
|
|
|
|||||||||||||
| Net income (loss) |
38,889 | — | 61,894 | 10,990 | (72,884 | ) | 38,889 | |||||||||||||||||
| General partner’s interest in net income |
22,218 | — | — | — | — | 22,218 | ||||||||||||||||||
|
|
|
|
|
|
|
|
|
|
|
|
|
|||||||||||||
| Limited partner’s interest in net income (loss) |
$ | 16,671 | $ | — | $ | 61,894 | $ | 10,990 | $ | (72,884 | ) | $ | 16,671 | |||||||||||
|
|
|
|
|
|
|
|
|
|
|
|
|
|||||||||||||
| As of December 31, 2012 | ||||||||||||||||||||||||
| Issuer | Co-Issuer | Guarantor Subsidiaries |
Non-Guarantor Subsidiaries |
Eliminations | Consolidated | |||||||||||||||||||
| (In thousands) | ||||||||||||||||||||||||
| ASSETS | ||||||||||||||||||||||||
| Current assets |
||||||||||||||||||||||||
| Cash and cash equivalents |
$ | 21 | $ | — | $ | — | $ | 90 | $ | — | $ | 111 | ||||||||||||
| Accounts receivable |
608 | — | 14,515 | 6,513 | — | 21,636 | ||||||||||||||||||
| Accounts receivable—related party |
366,405 | 1 | 22,587 | — | (365,238 | ) | 23,755 | |||||||||||||||||
| Insurance receivable |
— | — | 2,920 | — | — | 2,920 | ||||||||||||||||||
| Prepaid expenses and other |
584 | — | 1,357 | — | — | 1,941 | ||||||||||||||||||
|
|
|
|
|
|
|
|
|
|
|
|
|
|||||||||||||
| Total current assets |
367,618 | 1 | 41,379 | 6,603 | (365,238 | ) | 50,363 | |||||||||||||||||
| Investment in consolidated affiliates |
1,041,936 | — | — | — | (1,041,936 | ) | — | |||||||||||||||||
| Property, plant and equipment—net |
8,519 | — | 775,852 | 155,475 | — | 939,846 | ||||||||||||||||||
| Intangible assets—net |
— | — | 163,021 | 338,359 | — | 501,380 | ||||||||||||||||||
| Goodwill |
— | — | 95,031 | — | — | 95,031 | ||||||||||||||||||
| Deferred financing costs, net |
17,149 | — | — | 5,379 | — | 22,528 | ||||||||||||||||||
| Other assets |
20 | — | 1,301 | — | — | 1,321 | ||||||||||||||||||
|
|
|
|
|
|
|
|
|
|
|
|
|
|||||||||||||
| Total assets |
$ | 1,435,242 | $ | 1 | $ | 1,076,584 | $ | 505,816 | $ | (1,407,174 | ) | $ | 1,610,469 | |||||||||||
|
|
|
|
|
|
|
|
|
|
|
|
|
|||||||||||||
| LIABILITIES AND PARTNERS’ CAPITAL/MEMBERS’ EQUITY |
||||||||||||||||||||||||
| Current liabilities |
||||||||||||||||||||||||
| Accrued additions to property, plant and equipment |
$ | — | $ | — | $ | 3,829 | $ | 5,384 | $ | — | $ | 9,213 | ||||||||||||
| Capital leases |
429 | — | 3,433 | — | — | 3,862 | ||||||||||||||||||
| Deferred revenue |
— | — | — | 2,634 | — | 2,634 | ||||||||||||||||||
| Accounts payable—related party |
536 | — | 367,682 | 108 | (365,238 | ) | 3,088 | |||||||||||||||||
| Accounts payable, accrued expenses and other liabilities |
15,547 | — | 11,876 | 2,294 | — | 29,717 | ||||||||||||||||||
|
|
|
|
|
|
|
|
|
|
|
|
|
|||||||||||||
| Total current liabilities |
16,512 | — | 386,820 | 10,420 | (365,238 | ) | 48,514 | |||||||||||||||||
| Long-term debt |
558,161 | — | — | 127,000 | — | 685,161 | ||||||||||||||||||
| Long-term capital leases |
960 | — | 2,201 | — | — | 3,161 | ||||||||||||||||||
| Asset retirement obligations |
— | — | 13,188 | 836 | — | 14,024 | ||||||||||||||||||
| Partners’/members’ equity |
859,609 | 1 | 674,375 | 367,560 | (1,041,936 | ) | 859,609 | |||||||||||||||||
|
|
|
|
|
|
|
|
|
|
|
|
|
|||||||||||||
| Total liabilities and partners’ capital/members’ equity |
$ | 1,435,242 | $ | 1 | $ | 1,076,584 | $ | 505,816 | $ | (1,407,174 | ) | $ | 1,610,469 | |||||||||||
|
|
|
|
|
|
|
|
|
|
|
|
|
|||||||||||||
27
| For the Year Ended December 31, 2012 | ||||||||||||||||||||||||
| Issuer | Co-Issuer | Guarantor Subsidiaries |
Non-Guarantor Subsidiaries |
Eliminations | Consolidated | |||||||||||||||||||
| (In thousands) | ||||||||||||||||||||||||
| Net cash provided by (used in) operating activities |
$ | (23,613 | ) | $ | — | $ | 112,880 | $ | 16,645 | $ | (3,847 | ) | $ | 102,065 | ||||||||||
|
|
|
|
|
|
|
|
|
|
|
|
|
|||||||||||||
| Investing activities: |
||||||||||||||||||||||||
| Acquisitions, net of cash acquired |
(87,247 | ) | — | — | (476,718 | ) | — | (563,965 | ) | |||||||||||||||
| Capital expenditures |
(1,052 | ) | — | (34,441 | ) | (17,079 | ) | — | (52,572 | ) | ||||||||||||||
| Acquisition of interest in CMM |
(131,250 | ) | — | — | — | 131,250 | — | |||||||||||||||||
| Capital distribution from consolidated affiliate |
2,604 | — | — | — | (2,604 | ) | — | |||||||||||||||||
| Proceeds from sale of property, plant and equipment |
— | — | 20 | — | 20 | |||||||||||||||||||
| Change in advances to affiliates, net |
75,825 | — | — | — | (75,825 | ) | — | |||||||||||||||||
|
|
|
|
|
|
|
|
|
|
|
|
|
|||||||||||||
| Net cash provided by (used in) investing activities |
(141,120 | ) | — | (34,421 | ) | (493,797 | ) | 52,821 | (616,517 | ) | ||||||||||||||
|
|
|
|
|
|
|
|
|
|
|
|
|
|||||||||||||
| Financing activities: |
||||||||||||||||||||||||
| Proceeds from issuance of senior notes |
151,500 | — | — | — | — | 151,500 | ||||||||||||||||||
| Proceeds from revolving credit facility |
411,700 | — | — | 143,500 | — | 555,200 | ||||||||||||||||||
| Repayment of revolving credit facility |
(517,500 | ) | — | — | (16,500 | ) | — | (534,000 | ) | |||||||||||||||
| Payment of Tristate Acquisition deferred payment |
(7,839 | ) | — | — | — | — | (7,839 | ) | ||||||||||||||||
| Payments on capital leases |
(359 | ) | — | (2,634 | ) | — | — | (2,993 | ) | |||||||||||||||
| Deferred financing costs paid |
(4,994 | ) | — | — | (6,328 | ) | — | (11,322 | ) | |||||||||||||||
| Proceeds from issuance of common units, net |
217,483 | — | — | — | — | 217,483 | ||||||||||||||||||
| Contributions received |
5,930 | — | — | 375,000 | (131,250 | ) | 249,680 | |||||||||||||||||
| Distributions paid |
(91,558 | ) | — | (18,430 | ) | 6,451 | (103,537 | ) | ||||||||||||||||
| Change in advances from affiliates, net |
— | — | (75,825 | ) | — | 75,825 | — | |||||||||||||||||
| Taxes paid for equity-based compensation vesting |
(406 | ) | — | — | — | — | (406 | ) | ||||||||||||||||
|
|
|
|
|
|
|
|
|
|
|
|
|
|||||||||||||
| Net cash provided by (used in) financing activities |
163,957 | — | (78,459 | ) | 477,242 | (48,974 | ) | (513,766 | ) | |||||||||||||||
|
|
|
|
|
|
|
|
|
|
|
|
|
|||||||||||||
| Change in cash and cash equivalents |
(776 | ) | — | — | 90 | — | (686 | ) | ||||||||||||||||
| Cash and cash equivalents at beginning of period |
797 | — | — | — | — | 797 | ||||||||||||||||||
|
|
|
|
|
|
|
|
|
|
|
|
|
|||||||||||||
| Cash and cash equivalents at end of period |
$ | 21 | $ | — | $ | — | $ | 90 | $ | — | $ | 111 | ||||||||||||
|
|
|
|
|
|
|
|
|
|
|
|
|
|||||||||||||
28
Supplemental Selected Quarterly Financial Information (Unaudited)
Financial information by quarter is summarized below (In thousands).
| Quarters Ended | ||||||||||||||||
| March 31 | June 30 | September 30 | December 31 | |||||||||||||
| 2012 |
||||||||||||||||
| Operating revenues |
$ | 53,733 | $ | 55,229 | $ | 63,013 | $ | 67,488 | ||||||||
| Operating income |
17,665 | 15,862 | 23,766 | 18,567 | ||||||||||||
| Net income |
9,805 | 6,624 | 14,555 | 7,905 | ||||||||||||
| Basic income per unit: |
||||||||||||||||
| Net income per limited partner unit |
$ | 0.15 | $ | 0.06 | $ | 0.15 | $ | 0.01 | ||||||||
| Diluted income per unit: |
||||||||||||||||
| Net income per limited partner unit |
$ | 0.15 | $ | 0.06 | $ | 0.15 | $ | 0.01 | ||||||||
| 2011 |
||||||||||||||||
| Operating revenues |
$ | 32,380 | $ | 55,535 | $ | 58,615 | $ | 59,290 | ||||||||
| Operating income |
12,604 | 20,375 | 20,505 | 20,387 | ||||||||||||
| Net income |
9,376 | 10,227 | 13,058 | 12,342 | ||||||||||||
| Basic income per unit: |
||||||||||||||||
| Net income per limited partner unit |
$ | 0.27 | $ | 0.22 | $ | 0.27 | $ | 0.24 | ||||||||
| Diluted income per unit: |
||||||||||||||||
| Net income per limited partner unit |
$ | 0.27 | $ | 0.22 | $ | 0.27 | $ | 0.24 | ||||||||
29