Attached files
| file | filename |
|---|---|
| 8-K - 8-K - GRAY TELEVISION INC | d611898d8k.htm |
| EX-99.2 - EX-99.2 - GRAY TELEVISION INC | d611898dex992.htm |
 Exhibit 99.1
Historical Financial Data as of June 30, 2013
Select Other Data as of September 2013
NYSE: GTN
Investor Presentation |
 2
Gray Television, Inc.
Agenda
Company Overview
Gray Television is a Dominant Mid-Market TV Platform with Significant
Upside Industry Overview
Strong Industry Fundamentals and Growing Revenue Streams
Financial Overview
Strong Momentum in the Core Business with Record Political and Retransmission
Growth |
 3
Gray Television, Inc.
Highly Experienced Senior Management
Focused on maximizing potential of existing portfolio, while prudently pursuing
strategic growth opportunities Name
Years at
Gray TV
Years in
Industry
Background and Notable Achievements
Hilton H Howell, Jr.
Director, Vice Chairman,
President & CEO
20
20
CEO since 2008, Vice Chairman since 2002 and director since 1993
Served as President and CEO of Atlantic American Corporation since 1995
Served as EVP and General Counsel of Delta Life Insurance Company and Delta Fire
& Casualty Insurance Company since 1991
James C. Ryan
SVP & CFO
15
28
CFO since 1998 and additionally serves as SVP of Finance
Served as SVP since 2002 and as VP from 1998 to 2002
Served
as
the
CFO
of
Busse
Broadcasting
Corporation
from
1987
to
1998
Kevin P. Latek
SVP –
Business Affairs
2
16
Joined Gray in 2012, after spending 15 years representing television broadcasters
in FCC regulatory and transactional matters with law firm Dow Lohnes
Member of the CBS Affiliate Association; former member of, and previously counsel
to, Fox Affiliate Board of Governors
Nick Waller
SVP –
Mid-Atlantic &
South
13
13
Joined Gray in 2000, after spending 20 years with Datasouth Computer Corporation,
first as CFO and eventually as President
Director of the Florida Association of Broadcasters
Bob Smith
SVP –
Midwest & West
27
27
Started as an account executive at Gray TV in Eau Claire, Wisconsin in 1986
Serves
as
SVP
since
July
2013
and
served
in
various
roles
from
1986
–
2013
at
Gray
TV
Has served on the Boards of Directors of the Wisconsin Broadcaster Association,
among others Jason Effinger
SVP –
Media &
Technology
12
22
Joined Gray TV in 2001 as a station manager
Serves
as
SVP
since
July
2013
and
served
as
Regional
VP
prior
to
that
Serves as Vice Chair of the Nebraska Broadcasters Association
|
 Company Overview |
 5
Gray Television, Inc.
A Leading Television Broadcaster in Diverse Mid Markets with Dominant Market
Positions #1 or #2 market share in 29 out of 31 markets
Improving Advertising Market and Diversification of Revenue Mix
Strategic Acquisition and Duopoly Opportunities
Large Political Upside in Election Years with Presence in Key States
Strong Growth in Net Retransmission Revenue and Increasing Leverage With
Networks Successful New Media Initiatives and Spectrum Upside
Robust Free Cash Flow Generation Over a Two Year Cycle
Experienced Management Team With Healthy Track Record of Equity Value
Creation Key Investment Highlights |
 6
Gray Television, Inc.
Other
Gray Television is a Dominant Mid-Market
TV Platform
Primary Channels by Affiliate: 46
1
2012 Revenue by Affiliate: $405 mm
(1)
Certain additional channels are affiliated with more than one network
simultaneously. As a result, Gray has 42 additional channels with 49 affiliations
88 total channels of programming spread
across 31 attractive markets
46 channels affiliated with a “Big 4”
network
and
42
additional
channels
1
Reaches 6.2% of U.S. TV households,
significantly below FCC cap
#1 news rating in 23 markets and leading
franchises
#1 channel in 22 markets
Strong market and network diversification
17 collegiate markets and 8 state capitals
provide stability
Dominance in political revenue through
presence in key states
22
48%
11
24%
8
17%
5
11%
2%
2%
15%
42%
Gray Television, Inc.
39% |
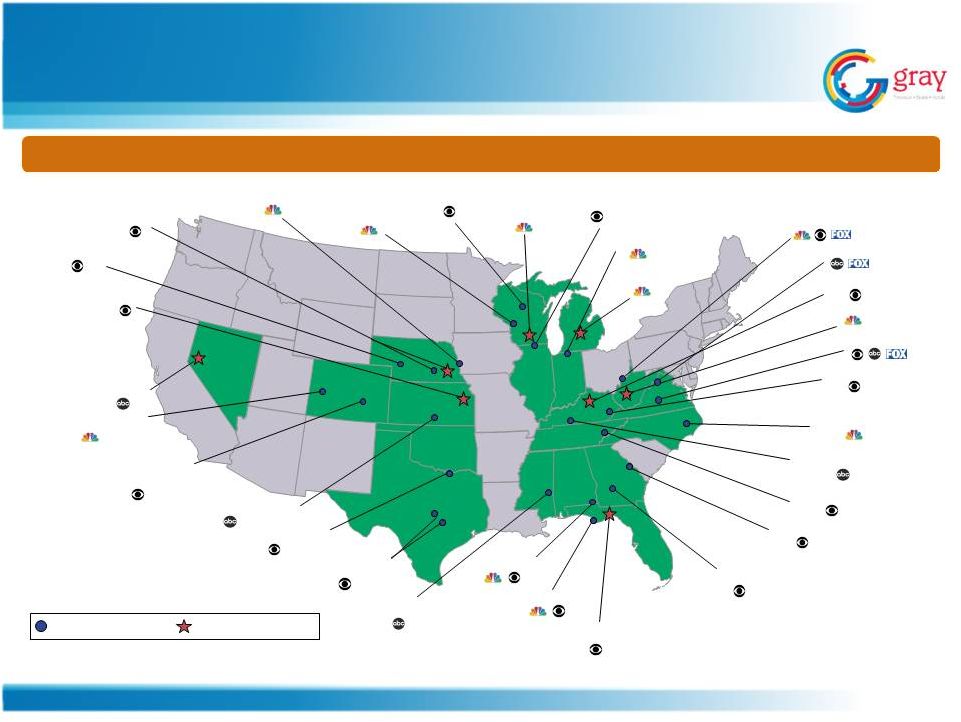 Gray
Has a Diverse and National Footprint Reno, NV
Lincoln
-
Hastings
-
Kearney, NE
Topeka, KS
Omaha, NE
La Crosse -
Eau Claire, WI
Madison, WI
Rockford, IL
Lansing, MI
Parkersburg, WV
Harrisonburg, VA
Lexington, KY
Hazard, KY
Greenville
-
New
Bern
-
Washington, NC
Bowling Green, KY
Knoxville, TN
Augusta, GA
Tallahassee, FL -
Thomasville, GA
Panama City, FL
Dothan, AL
Meridian, MS
Waco-Temple -
Bryan, TX
Sherman, TX -
Ada, OK
Wichita -
Hutchinson, KS
Colorado Springs -
Pueblo, CO
Charlottesville, VA
Grand Junction, CO
Wausau -
Rhinelander, WI
Charleston-Huntington, WV
South Bend, IN
Albany, GA
31 markets reaching approximately 6.2% of US TV households
North Platte, NE
State Capital in DMA
Gray TV Station
7
Gray Television, Inc. |
 Key
Recent Developments and Strategic Initiatives
Appointed new management structure in July 2013, with significant industry
experience, to increase focus on:
Strategic growth: Kevin Latek
Station operations and performance: Nick Waller and Bob Smith
Digital media strategy: Jason Effinger
Launched “Big Four”
affiliated channels on the Syncbak Internet Platform on September 4, 2013
Constructed and launched seven entirely new television stations since September
2012 Back office services agreement with Excalibur with anticipated closing
of October 31, 2013 Acquisition of KSNB (MyTV) from Colins Broadcasting
Corporation on February 25, 2013 Launched new and modern looking logo and
website in September 2013, emphasizing Gray TV’s focus on local market
dominance 8
Gray Television, Inc. |
 The
Importance of Being #1 Dominate local and political revenue with
highly-rated news platforms
Greater purchasing power and leverage
with MVPDs, networks and programmers
Partner
of
choice
–
duopoly
opportunities
Deliver high margins
Maximize free cash flow
Attract and retain high quality talent
Long
History
of
Being
#1
in
the
Market
1
Dominant
News
Franchises
Drive Traffic
Price
Leadership
Network and
News
Ratings
Reinvest
in
Business
Reinvest
in
Business
CBS National Ranking
1
1
2
1
1
1
1
(1)
Number of Gray stations ranked #1
NBC National Ranking
3
4
4
4
4
4
3
ABC National Ranking
2
2
3
2
2
2
2
4
4
4
4
3
3
4
'05/'06
'06/'07
'07/'08
'08/'09
'09/'10
'10/'11
'11/'12
8
7
5
5
8
7
7
'05/'06
'06/'07
'07/'08
'08/'09
'09/'10
'10/'11
'11/'12
11
12
12
12
12
12
11
'05/'06
'06/'07
'07/'08
'08/'09
'09/'10
'10/'11
'11/'12
Gray Television, Inc.
9 |
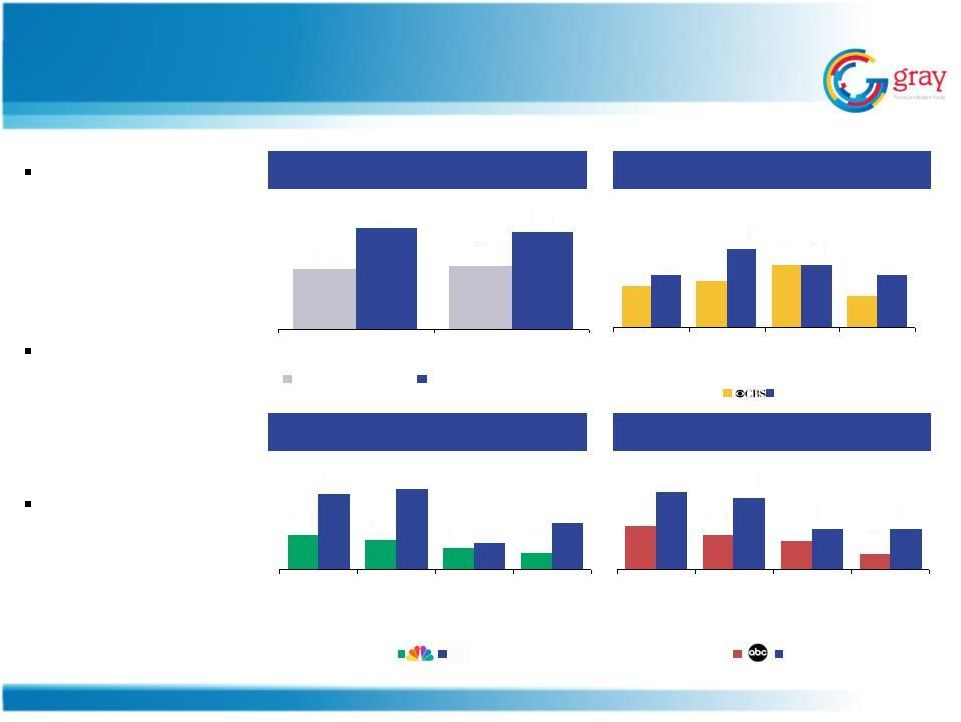 National Average vs. Gray
November ’12 Household Share
Gray’s Stations Dominate Local News
and Information
NBC vs. Gray
November ’12 Household Share
ABC vs. Gray
November ’12 Household Share
CBS vs. Gray
November ’12 Household Share
Gray’s Early Evening
newscasts
outperform the
national average by
71%
Gray’s late local
news outperforms
the national average
by 53%
Better than national
average for all major
affiliate news
programs
8
9
12
6
10
15
12
10
The Early
Show
Network
News
Prime
(Mon-Sun)
The Late
Show
Gray
13
11
8
6
28
30
10
17
The Today
Show
Network
News
Prime
(Mon–Sun)
The
Tonight
Show
14
11
9
5
25
23
13
13
Good
Morning
America
Network
News
Prime
(Mon-Sun)
Nightline /
Jimmy
Kimmel
Gray
14
15
24
23
Early Evening News
Late News
NSI National Average
Gray Average of All Stations
10
Gray Television, Inc.
Gray |
 Stable
Markets
–
Concentration
on
DMAs
61-208
With Focus on State Capitals / Collegiate Presence
Note: Shading indicates DMA includes state capital. Enrollment in
thousands. Gray stations cover 8 state capitals and
17 university towns, representing
enrollment of approximately 474,000
students
Why university towns and state capitals?
Better demographics
More stable economies
Affinity between station and university
sports teams
Approximate
Approximate
Market
College(s)
Enrollment
Market
College(s)
Enrollment
Waco, TX
62
Lincoln, NE
24
Topeka, KS
53
Bowling Green, KY
21
Lansing, MI
49
Charlottesville, VA
21
Tallahassee, FL
44
Harrisonburg, VA
20
Madison, WI
43
Reno,
NV
18
Knoxville, TN
30
Charleston-Huntington, WV
14
Lexington, KY
29
South Bend,
IN
12
Greenville, NC
28
Colorado Springs, CO
4
Parkersburg, WV
2
11
Gray Television, Inc. |
 Operational Strategy Focused on
Market Leadership and Growth
Maintain and grow our market
leadership position
Continue to prudently invest in
local content and news,
syndicated programs, top talent
and community relationships
Seek new media opportunities –
currently operates web, mobile
and desktop applications in all
of our markets
Monetize digital spectrum
through growth in spectrum
channels
Pursue selective strategic
transactions
Drive free cash flow generation
Core Advertising Growth
Political Revenue
Retransmission Revenue
Internet and Socialization
Accretive Partnerships
Monetize Spectrum
Maintain
Leadership
and Grow
Free
Cash
Flow
12
Gray Television, Inc. |
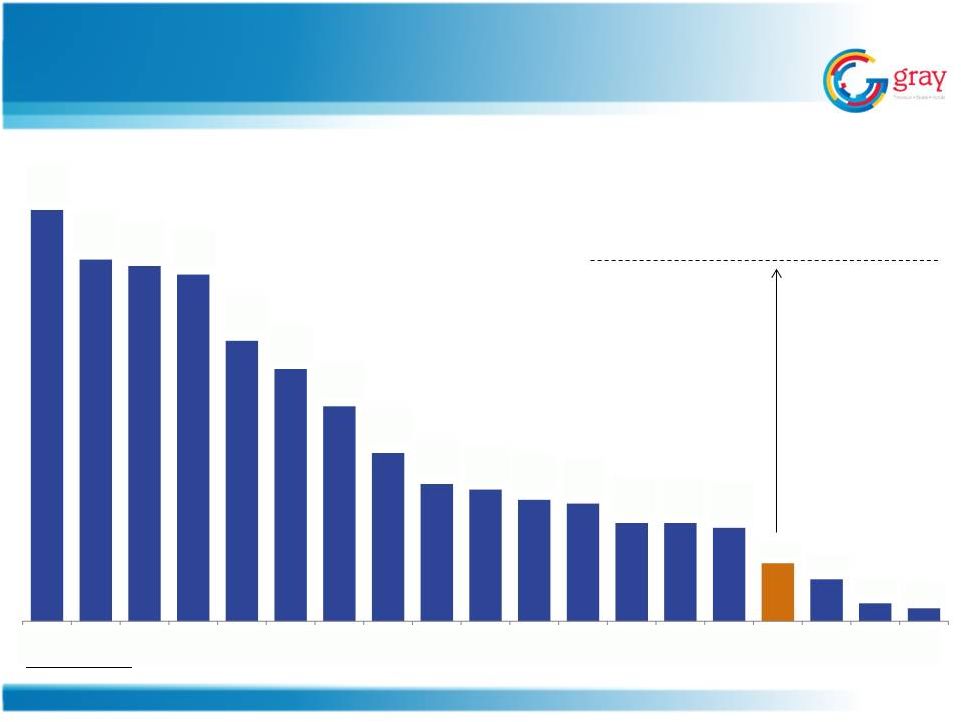 Gray
TV has Significant Opportunity to Grow Source: Company filings, BIA Investing
in Television 2013 and SNL Kagan FCC U.S. TV Household Cap of 39%
44%
39%
38%
37%
30%
27%
23%
18%
15%
14%
13%
13%
11%
11%
10%
6%
4%
2%
1%
Tribune
Sinclair
CBS
FOX
Gannett
NBC
ABC
Hearst
Media
General
Nexstar
EW
Scripps
Raycom
Cox
LIN TV
Meredith
Gray
Journal
Quincy
Hoak
13
Gray Television, Inc. |
 Strategic Acquisitions and Duopoly Opportunities
Industry continues to consolidate rapidly
Gray TV’s strategic transactions should
not be impacted by proposed regulatory
thresholds
Gray TV is focused on prudently
increasing its scale through accretive
acquisitions and partnerships
In discussions with several partners
across our markets for duopoly, JSA /
SSA opportunities
Increase in scale adds to operating
leverage and negotiation power
Growth in free cash flow generation
Illustrative Stock Price Accretion
Source: Company filings
Potential for Equity Value Creation Through Accretive Acquisitions /
Duopolies Blended Buyer’s Multiple
Acquisitions /
Duopolies
0.0%
5.0%
10.0%
15.0%
8.0x
7.5x
7.0x
14
Gray Television, Inc. |
 Revenue Mix Continues to Diversify
2008 Net Revenue Mix: $327 mm
2012 Net Revenue Mix: $405 mm
Growth in Net Revenue, driven by core revenue, political, retransmission and
internet Revenue mix continues to diversify from traditional ad-based
sources to new media ad-based –
Internet, and subscriber driven –
Retransmission
Lowers overall revenue volatility
Local
57%
National
21%
Political
15%
Internet
4%
Retransmission
1%
Other
3%
Local
47%
National
14%
Political
21%
Internet
6%
Retransmission
8%
Other
3%
15
Gray Television, Inc. |
 All Secondary
Channels & Other
All Secondary Channels
& Other
Diversification Across Networks and Markets
46
Big
4
Affiliates:
22 CBS
11 NBC
8 ABC
5 FOX
42
Additional
Channels
(2)
with
49
Affiliations:
8 CW
17 MyNetwork TV
7 ME TV
5 Antenna TV
3 This TV Network
1 Live Well Network
8 Local News/Weather
88
channels
of
programming:
Current Station Mix
2012
1
BCF:
Top
10
Markets
2012
1
BCF
by
Affiliate:
$192.5
mm
3
(1)
LTM 2012 –
Last 12 months ended December 31, 2012.
(2)
Certain additional channels are affiliated with more than one network simultaneously. As a result, Gray
has 42 additional channels with 49 affiliations. (3) Excludes corporate
expenses. 2012
1
Revenue: Top 10 Markets
2012
1
Revenue by Affiliate: $405 mm
Charleston /
Huntington, WV
10%
Omaha, NE
7%
Madison, WI
7%
Reno, NV
6%
Lexington, KY
5%
Eau Claire, WI
5%
Tallahassee, FL
5%
Greenville, NC
5%
Lansing, MI
5%
Wausau, WI
5%
Other
43%
Lexington, KY
5%
Omaha, NE
6%
Waco -
Bryan, TX
5%
Madison, WI
5%
Reno, NV
5%
Tallahassee, FL
4%
Lansing, MI
4%
Other
50%
Charleston /
Huntington, WV
8%
South Bend, IN
4%
Eau Claire, WI
3%
45%
36%
14%
3%
2%
42%
39%
15%
2%
2%
16
Gray Television, Inc. |
 Gray
is the Leading Beneficiary of Political Revenue with Large Upside
$86
Million
in
2012
–
New
Record
2011 Odd Year Record $13.5 million
Gray operates in key battleground states
#1 stations can capture over 50% of the political budget for a
market
Supreme Court decision to remove limits on corporate and union
spending on political campaigns helps drive political revenue for
Gray
Revenue from issue-based political advertising expected to
further drive growth
Local news is a key medium for political advertisers to connect
with potential voters
2012 Political as % of Total Net Revenue
Gray TV Political Commentary
Gray TV Political Revenue
Strong
Presence
in
Key
Election
States
1
$86
($ in millions)
Note: Based on as reported financials per Company filings
CAGRs
’08-’12:
16%
’06-’10: 7%
Source: Politico, Electoral-vote.com and University of Virginia Center for
Politics (1) Represents key swing states for presidential, senate and
gubernatorial elections 21.2%
15.1%
13.8%
10.4%
9.6%
Gray TV
Media
General
Lin TV
Nexstar
Sinclair
$58
$48
$53
$43
2006PF
2008
2010
2012
2004PF
GTN Overlap with Key Elections
New
Record
New
Record
17
Gray Television, Inc. |
 18
Gray Television, Inc.
Automotive Ad Spending on TV Continues to
Grow and Still Below Peak Levels
Gray TV continues to benefit from the growth in auto ad spending
Auto for the first half of 2013 is up ~10%
In 2012, ~18% of Gray TV’s total broadcast advertising revenue was derived
from automotive customers TV auto ad spending growth of $0.4 billion or 16%
from 2011 to 2012 but still below peak TV Ad Spending in the Automotive
Sector ($ in billions)
SAAR of U.S. Light Vehicle Sales
(in millions)
Source: TVB and U.S. Bureau of Economic Analysis (2009A-2012A); National
Automobile Dealers Association (2013E) $3.7
$2.9
$1.7
$2.7
$2.7
$3.1
2007A
2008A
2009A
2010A
2011A
2012A
16.1
13.2
10.4
11.6
12.7
14.4
15.4
2007A
2008A
2009A
2010A
2011A
2012A
2013E |
 Strong Growth in Retransmission Revenue
Over 50% of MVPD subscriber base
renewed at year-end 2011 at
significant increases
Approximately 2 million subs
re-pricing in two deals in Q4 2013
Remaining 4.5 million subs re-pricing
between 12/31/14 and 3/31/15
Anticipate significant price increase
in each case
Gray TV Retransmission Revenue
% of Total
Revenue 0.4%
0.5% 0.8% 0.9%
5.8%
5.4% 6.6% 8.3%
($ in millions)
Long
Term
Affiliate
Contracts
with
“Big
4”
Networks
17
# of
Channels
Renewal
Date
3
12-31-14
12-31-16
10
# of
Channels
Renewal
Date
1
12-31-15
1-1-16
8
# of
Channels
Renewal
Date
12-31-13
5
# of
Channels
Renewal
Date
6-30-14
2
8-31-18
22
11
19
Gray Television, Inc.
$1.0
$1.6
$2.4
$3.0
$15.6
$18.8
$20.2
$33.8
2005
2006
2007
2008
2009
2010
2011
2012 |
 20
Gray Television, Inc.
Operate web and mobile
applications in all markets
Focused on local content: news,
weather, sports
Demonstrated strong growth in page
views: ‘05 to ’12: +746%
(30.6% CAGR)
All sites already converted to
responsive design
Launched live video streaming in all
markets in September 2013 through
Syncbak
Owns Moms Everyday digital
vertical; deployed in each Gray TV
market and continues to expand to
other markets
Successful Digital Media Initiatives
% of Total
Revenue 2.4%
2.3% 3.1% 3.6%
4.2% 3.9% 6.5% 6.0%
Gray TV Digital Media Revenue
($ in millions)
$6.4
$7.6
$9.5
$11.9
$11.4
$13.4
$20.1
25.0
2005
2006
2007
2008
2009
2010
2011
2012 |
 21
Gray Television, Inc.
Significant Potential Upside from the Monetization of Spectrum
Unlocking the Value of Spectrum
42
additional
channels
of
programming
(including
49
affiliations
1
)
with
key
networks
including CW, MyNetwork TV, MeTv and Antenna TV
$14.9 million in 2012 Revenue
$8.2
million
in
BCF
2
–
55%
Margin
Opportunity
to
monetize
digital
spectrum
through
more
efficient
use
of
spectrum
Converting spectrum to a Content Delivery Network via Broadcast Overlay
Technology Leasing it to wireless carriers
Limited to no near-term interference from potential broadcast spectrum auction
and regulatory rulings
(1)
Certain additional channels are affiliated with more than one network
simultaneously. As a result, Gray has 42 additional channels with 49 affiliations
(2)
Excludes corporate expenses |
 Industry Overview |
 23
Gray Television, Inc.
Television Continues to be the #1 Choice for
Critical Mass Reach Among Advertisers
Source: TVB Media Comparison Study 2012
Program
Broadcast
Cable
Rank
Stations
TV
Total
1-25
24
1
25
26-50
24
1
25
51-75
24
1
25
76-100
24
1
25
Total
96
4
100
TV is the Most Influential Local Media
96 of the Top 100 Rated Programs are
Broadcast Programs (P18-49)
88%
73%
59%
36%
28%
25%
12%
Television
Internet
Radio
Newspaper
Mobile Phone
Magazines
Tablet
Primary
Source
of
News
Broadcast
TV
52.2%
Cable News
Networks
20.6%
Internet
22.7%
Newspapers
0.6%
Radio
3.9%
Most
Influential
of
All
Media
Television
52.1%
Newspapers
10.5%
Radio
3.8%
Magazines
8.9%
Internet
11.4%
Mobile
0.5%
Outdoor
0.5%
Other
12.3%
Source
of
Local
Weather,
Traffic
and
Sports
Broadcast TV
49.7%
Internet
17.1%
Radio
6.5%
Public TV
6.7%
Cable News
Networks
3.6%
Newspapers
2.4%
Mobile / Other
14.0%
Note: Based on 2013 season NTI Live + Same Day estimates. Ranked by average
audience % (ratings); in the event of a tie, impressions (000's) are used as a tiebreaker.
Ad-Supported Subscription television only. Programming under 5 minutes excluded
Source: TVB
TV Reaches More People than Any Other
Medium |
 Strong Growth on Other Key Revenue Streams
Industry-wide
Political
Spend
on
Local
TV
1
(1) Based on Local Broadcast TV political advertising only (excludes Local Cable
TV) Source: Magna Global and SNL Kagan
Strong Growth in Retransmission Revenue
Changing Composition of Television Revenue
Ad Revenue
Gross Retrans Revenue
Online Revenue
Other Revenue
($ in billions)
CAGR
19%
14%
Gross Retrans
Net Retrans
Record level of political in 2012 and estimates for
2014 and 2016 project continued growth
TV broadcasting captures 35% of viewers but
only 7% of Retransmission Fees
$1.5
$1.7
$2.1
$2.8
$3.2
$3.7
2006A
2008A
2010A
2012A
2014E
2016E
($ in billions)
Net Retransmission Revenue as % of Gross Retransmission Revenue:
92%
79%
75%
71%
68%
68%
67%
67%
$1.8
$2.4
$3.0
$3.6
$4.3
$4.9
$5.5
$6.1
$1.6
$1.9
$2.3
$2.6
$2.9
$3.3
$3.7
$4.0
2011A
2012E
2013E
2014E
2015E
2016E
2017E
2018E
96%
1%
2%
1%
2006A
85%
9%
5%
2012A
77%
16%
6%
2016E
24
Gray Television, Inc. |
 25
Gray Television, Inc.
Significant Asset Value and Transaction
Synergies for Television Broadcasters
Source: Company filings, SNL Kagan and Wall Street research
Average Blended Seller EBITDA Multiple of ~9.3x
10.0x
10.1x
8.3x
10.0x
8.3x
10.0x
10.1x
10.4x
6.2x
7.8x
12.4x
7.9x
8.9x
7.9x
9.2x
10.5x
10.2x
8.5x
9.7x
Sinclair /
Four Points
(9/2011)
Scripps /
McGraw-Hill
(10/2011)
Sinclair /
Freedom
(11/2011)
LIN /
New Vision
(9/2012)
Nexstar /
Newport
(7/2012)
Sinclair /
Newport
(7/2012)
Cox Media /
Newport
(7/2012)
Journal /
Landmark
(9/2012)
Sinclair /
Cox
(2/2013)
Sinclair /
Barrington
(2/2013)
Sinclair /
Fisher
(4/2013)
Nexstar /
CCA
(4/2013)
Sinclair /
Titan
(4/2013)
Media
General /
Young
(6/2013)
Gannett /
Belo
(6/2013)
Tribune /
Local TV
(7/2013)
Sinclair /
Allbritton
(7/2013)
Nexstar /
Citadel &
Stainless
(9/2013)
Sinclair /
New Age
(9/2013)
Stage 1: “Low hanging fruit”
Stage 2: “Merger of smaller equals”
Stage 3: “Merger of larger equals”
Stage 4: “Station Swaps”
TV broadcasting M&A activity has ramped up considerably
Sizeable individual transactions in 2013 at attractive valuations
Significant transaction synergies
M&A
Consolidation
Stages |
   Financial Overview |
 27
Gray Television, Inc.
(1)
Operating Cash Flow as defined in Senior Credit Facility
(2)
Net of proceeds from asset sales or dispositions and insurance proceeds
Historical
Financial
Overview
–
Continued
Growth
Net Revenue
Operating Cash Flow
1
Capital Expenditures
2
% Margin
32% 36% 26% 39%
32%
43% % of Rev
8% 5%
7% 5%
7% 6%
YOY Growth
($ in millions)
($ in millions)
($ in millions)
)
$307
$327
$270
$346
$307
$405
2007
2008
2009
2010
2011
2012
$99
$119
$71
$136
$97
$174
2007
2008
2009
2010
2011
2012
$25
$16
$18
$19
$21
$23
2007
2008
2009
2010
2011
2012
(12%)
6%
14%
17%
6%
(17%)
2YOY Growth
32%
28%
(11%) |
 28
Gray Television, Inc.
% of OCF
8%
42%
N/M
37%
19%
54%
FCF/Share²
$0.17
$1.04
N/M
$0.92
$0.32
$1.64
$8
$50
($15)
$50
$18
$94
2007
2008
2009
2010
2011
2012
Free Cash Flow
1
($ and shares in millions)
Record Free Cash Flow in 2012
(1) Free Cash Flow defined as Operating Cash Flow less cash interest, cash taxes
and capital expenditures (2) Based on weighted average basic shares
outstanding Record free cash flow of $94
million in 2012
2012 OCF conversion rate into
FCF: 54%
Equity value creation through
strong free cash flow generation
Significant NOLs expected to
shield cash taxes in the near-term
Trades at a discount to peers on
a free cash flow basis with
significant potential upside |
 29
Gray Television, Inc.
Net Debt
$770
$794
$828
$832
$824
$812
Net Debt +
Preferred
$870
$913
$881
$872
$824
$812
L8QA OCF
$109
$95
$104
$117
$136
$139
7.1x
8.4x
8.0x
7.1x
6.1x
5.8x
8.0x
9.6x
8.5x
7.5x
6.1x
5.8x
2008
2009
2010
2011
2012
6/30/2013
Net Debt / OCF
Net Debt + Preferred / OCF
De-levered by over $100 million (~3.8x) between December 2009 and June
2013 Consistently reduced weighted average cost of debt
Gray now generates significant free cash flow in both political and
non-political years ($ in millions)
Financial Leverage at Five Year Low
(1) Leverage shown on a two year blended basis to account for biennial shifts in
political revenues Net Financial Leverage
1
|
 30
Gray Television, Inc.
Prudent Cost Management and Increasing Margins
Increasing Operating Cash Flow Margins
Gray TV continues to grow
operating margins through
identified operational
efficiencies
As of December 31, 2012,
reduced total number of
employees by 367, or 15%,
since December 31, 2007
Decreased operating costs by
converting to digital
1.23% TV Expense CAGR from
2007 –
2012
36%
39%
43%
2008
2010
2012 |
 31
Gray Television, Inc.
$43
$51
YTD 2011
YTD 2013
($5)
$13
YTD 2011
YTD 2013
YTD 6/30/2013 Operating Performance Update
Strength in revenue driven by automotive and
retransmission, etc.
Local revenue +3% vs. 2012 and +6% vs. 2011
National Revenue +4% vs. 2012 and +8% vs. 2011
OCF +28% from 2010 to 2012 and +18% from
YTD 2011 to YTD 2013
Net Revenue
YTD 2013 Highlights
Operating Cash Flow
($ in millions)
($ in millions)
($ in millions)
Free Cash Flow
(1) YTD signifies year to date June 30th
$146
$163
YTD 2011
YTD 2013 |
 32
32
Gray Television, Inc.
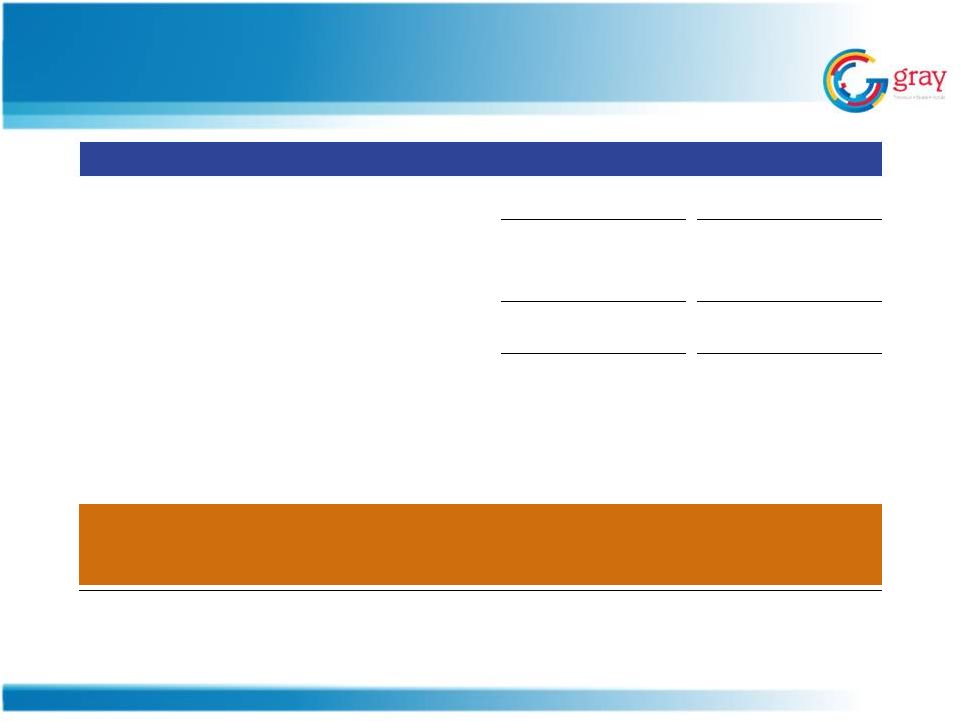
Capitalization Overview
Current and Pro Forma Capitalization
($ in Millions)
Actual
Pro Forma
1
6/30/2013
6/30/2013
Cash and Cash Equivalents
$23.4
$23.4
$40MM Revolver due 2017
$0.0
$0.0
Term Loan B due 2019 (L+350
2
/ 1.0% LIBOR Floor)
535.0
159.0
Total First Lien Debt
$535.0
$159.0
7.500% Senior Unsecured Notes due 2020
300.0
675.0
Total Debt
$835.0
$834.0
Net Debt
$811.6
$810.6
Market Capitalization
3
$484.1
$484.1
Total Capitalization
$1,319.1
$1,318.1
6/30/2013 L8QA OCF
4
$139.5
$139.5
6/30/2013 LTM OCF
5
$158.9
$158.9
Total First Lien Debt, Net Cash / L8QA OCF
3.7x
1.0x
Total Debt, Net Cash / L8QA OCF
5.8x
5.8x
Total First Lien Debt, Net Cash / LTM OCF
3.2x
0.9x
Total Debt, Net Cash / LTM OCF
5.1x
5.1x
(1)
Pro forma for October 2013 $375 million add-on to the 7.500% Senior
Notes (2)
Step down from L+375 at 6/30/13A due to paydown of Term Loan B
(3)
Based on 10/11/2013 GTN share price of $8.33 and 58.1 million shares outstanding
(combines GTN and GTN.A) (4)
OCF as defined in the existing Credit Agreement for the last eight quarters on an
annualized basis (5)
OCF as defined in the existing Credit Agreement for the last twelve months
|
 33
Gray Television, Inc.
SAFE-HARBOR
Certain statements in this presentation constitute “forward-looking
statements”
within the meaning of and subject to the protections the
Private Securities Litigation Reform Act of 1995 and other federal and
state securities laws. Such forward-looking statements involve known and
unknown risks, uncertainties and other factors which may cause the actual
results, performance or achievements of the Company to be materially
different from any future results, performance or achievements expressed
or implied by such “forward-looking statements.”
See
the
Company’s
website
www.gray.tv
for
reconciliations
of
GAAP
to
non-
GAAP data. Reconciliations of broadcast cash flow, broadcast cash flow
less cash corporate expenses and free cash flow to GAAP data is
included in the financial
reports
section
of
the
www.gray.tv
website. |