QuickLinks -- Click here to rapidly navigate through this document
UNITED STATES
SECURITIES AND EXCHANGE COMMISSION
Washington, DC 20549
FORM 8-K
CURRENT REPORT
Pursuant to Section 13 or 15(d) of the Securities Exchange Act of 1934
Date of Report: October 7, 2013
Date of Earliest Event Reported: October 7, 2013
Commission file no. 333-133184-12
Neiman Marcus Group LTD Inc.
(Exact name of registrant as specified in its charter)
| Delaware (State or other jurisdiction of incorporation or organization) |
20-3509435 (I.R.S. Employer Identification No.) |
|
One Marcus Square 1618 Main Street Dallas, Texas (Address of principal executive offices) |
75201 (Zip code) |
Registrant's telephone number, including area code: (214) 743-7600
Not Applicable
(Former name or former address, if changed since last report)
Check the appropriate box below if the Form 8-K filing is intended to simultaneously satisfy the filing obligation of the registrant under any of the following provisions (see General Instruction A.2. below):
- o
- Written
communications pursuant to Rule 425 under the Securities Act (17 CFR 230.425)
- o
- Soliciting
material pursuant to Rule 14a-12 under the Exchange Act (17 CFR 240.14a-12)
- o
- Pre-commencement
communications pursuant to Rule 14d-2(b) under the Exchange Act (17 CFR 240.14d-2(b))
- o
- Pre-commencement communications pursuant to Rule 13e-4(c) under the Exchange Act (17 CFR 240.13e-4(c))
Item 7.01 Regulation FD Disclosure
On September 9, 2013, Neiman Marcus Group LTD Inc., a Delaware corporation (the "Company"), entered into an Agreement and Plan of Merger (the "Merger Agreement") with NM Mariposa Holdings, Inc., a Delaware corporation ("Parent"), and Mariposa Merger Sub LLC, a Delaware limited liability company ("Mariposa") and an indirect wholly owned subsidiary of Parent. Under the terms of the Merger Agreement, Mariposa will be merged with and into the Company, with the Company continuing as the surviving corporation and an indirect wholly owned subsidiary of Parent (the "Merger" or the "Acquisition" and together with the related financing transactions, the "Transactions"). Parent is owned by private investment funds affiliated with Ares Management LLC ("Ares") and the Canada Pension Plan Investment Board ("CPPIB," and together with Ares, the "Sponsors"). At the effective time of the Acquisition, each outstanding share of common stock of the Company, other than any shares owned by the Company, Parent or Mariposa or any of their respective direct or indirect wholly owned subsidiaries, will be cancelled and converted into the right to receive cash, without interest. In connection with the Acquisition, we will:
- •
- enter into our new senior secured credit facilities consisting of (a) a new senior secured term loan facility of
$2,950.0 million (the "new term loan facility") and (b) a new senior secured asset-based revolving credit facility, subject to a borrowing base, with commitments of $800.0 million
(the "new revolving credit facility"), which we expect will have drawings of approximately $75.0 million on the closing date; and
- •
- issue $960.0 million in aggregate principal amount of the senior cash pay notes due 2021 (the "Cash Pay Notes") and $600.0 million in aggregate principal amount of the senior PIK toggle notes due 2021 (the "PIK Toggle Notes" and, together with the Cash Pay Notes, the "Notes").
The information in this Current Report on Form 8-K is being furnished pursuant to Item 7.01 of Form 8-K and shall not be deemed to be "filed" for the purposes of Section 18 of the Securities Exchange Act of 1934, as amended, or Section 11 of the Securities Act of 1933, as amended, or otherwise subject to the liabilities of those sections.
Special Note Regarding Forward-Looking Statements
Any statements made in this Current Report on Form 8-K that are not statements of historical fact, including statements about our beliefs and expectations, are forward-looking statements within the meaning of the Private Securities Litigation Reform Act of 1995, as amended, and should be evaluated as such. Forward-looking statements include information concerning possible or assumed future results of operations, including descriptions of our business plan and strategies. These statements often include words such as "anticipate," "expect," "suggests," "plan," "believe," "intend," "estimates," "targets," "projects," "should," "could," "would," "may," "will," "forecast" and other similar expressions. These forward-looking statements are contained throughout this Current Report on Form 8-K. We base these forward-looking statements on our current expectations, plans and assumptions that we have made in light of our experience in the industry, as well as our perceptions of historical trends, current conditions, expected future developments and other factors we believe are appropriate under the circumstances and at such time. As you read and consider this Current Report on Form 8-K, you should understand that these statements are not guarantees of performance or results. The forward-looking statements and projections are subject to and involve risks, uncertainties and assumptions and you should not place undue reliance on these forward-looking statements. Although we believe that these forward-looking statements are based on reasonable assumptions at the time they are made, you should be aware that many factors could affect our actual financial results or results of operations and could cause actual results to differ materially from those expressed in the forward-looking statements and projections. These cautionary statements should not be construed by you to be exhaustive and are made only as of the date of this Current Report on Form 8-K. All forward-looking statements attributable to us or to persons acting on our behalf are expressly qualified in their entirety by the foregoing cautionary statements. We undertake no obligation to update or revise any forward-looking statements, whether as a result of new information, future events or otherwise, except as otherwise required by law.
With a history of over 100 years in retailing, the Neiman Marcus and Bergdorf Goodman brands are recognized as synonymous with fashion, luxury and style. We are one of the largest luxury, multi-branded, omni-channel fashion retailers in the world and a leading fashion authority among luxury consumers. Furthermore, we are a premier retail partner to many of the world's most exclusive designers and as a result can offer distinctive merchandise to our highly loyal and affluent customer base. In the fiscal year ended August 3, 2013 ("Fiscal 2013"), we generated revenues of $4.6 billion and Pro Forma Adjusted EBITDA of $671.5 million, or 14.4% of revenues.
In our omni-channel retailing model, we operate in both the in-store and online retail channels to provide our customers with the ability to shop "anytime, anywhere, any device." We believe this omni-channel model maximizes the recognition of our brands and strengthens our customer relationships. We are investing, and plan to continue to invest, resources to enhance further the customer's seamless shopping experience across channels, which is consistent with our customers' expectations as well as our core value of exceptional customer service. We report our store operations as our "Specialty Retail Stores" segment and our direct-to-consumer operations as our "Online" segment.
We carry luxury apparel and accessories from many of the world's most exclusive designers. Our luxury-branded fashion vendors include, among others, Chanel, Gucci, Prada, David Yurman, Giorgio Armani, Akris, Brioni, Ermenegildo Zegna, Christian Louboutin, Van Cleef & Arpels and Tom Ford. Luxury and fashion brands intentionally maintain limited distribution of their merchandise to maximize brand exclusivity and to facilitate the sale of their goods at premium prices. Through our omni-channel model, we offer our designers a distinctive distribution channel that adheres to their standards with respect to brand image and customer service. Many of our vendor relationships span more than 25 years. We believe these relationships enable us to obtain a better brand selection than our competitors, including in some instances merchandise and brands that are exclusive to us. As a result, we believe we are the largest worldwide partner to many luxury brands. Additionally, we often work with less mature brands that are emerging in the fashion and luxury industry. We have a long history of identifying, developing and nurturing these emerging brands. This combination of established and new designers distinguishes our merchandise assortment and customer shopping experience.
Specialty Retail Stores (78% of our revenues in Fiscal 2013):
We currently operate 41 Neiman Marcus full-line stores in prime retail locations in major U.S. markets, including U.S. gateway cities that draw customers from all over the world. In addition, we operate two Bergdorf Goodman stores in landmark locations on Fifth Avenue in New York City. Neiman Marcus and Bergdorf Goodman cater to a highly affluent customer, offering distinctive luxury women's and men's apparel and accessories, handbags, cosmetics, shoes and designer and precious jewelry. In addition, we operate 36 off-price, smaller format stores under the brand Last Call®, catering to an aspirational, price-sensitive yet fashion-minded customer. We also operate six smaller format stores under the brand CUSP®, catering to a younger customer focused on contemporary fashion.
We have a highly profitable and productive store base. The combined store productivity of our Neiman Marcus and Bergdorf Goodman stores, which was $552 per square foot for Fiscal 2013, has consistently outperformed other U.S. luxury and premium multi-branded retailers over the last 10 years. Our shopping experience is highly differentiated. We offer our customers a curated selection of merchandise tailored to local aesthetics. Each of our stores is individually designed by market and provides an upscale shopping environment with high-end finishings, artwork and, in most cases, in-store restaurants. When combined with our strong selling culture, our stores provide our customers with a luxurious and enjoyable shopping experience.
Through Bergdorf Goodman, we believe we are the premier luxury multi-branded retailer in New York City, providing our customers with a shopping experience that we believe is unlike any other. We
believe Bergdorf Goodman represents an iconic shopping destination in Manhattan for both U.S. and international customers. The stores offer ultra luxury merchandise and provide a desirable showcase for both established and emerging fashion brands. With sales per square foot of approximately 3.5 times that of our total full-line stores, the Bergdorf Goodman stores are our most productive.
Online (22% of our revenues in Fiscal 2013):
We complement our in-store operations with direct-to-consumer sales through our Online business, which currently generates annual revenues of just over $1 billion, primarily through our e-commerce websites under the brands Neiman Marcus®, Bergdorf Goodman®, Last Call, CUSP and Horchow®. We also use our Online operation as a selling and marketing tool to increase the visibility and exposure of our brands and generate customer traffic within our retail stores. We have experienced significant growth in our Online segment since its launch in 1999 as one of the first major luxury fashion retail sites. We believe we are the sixth largest online retailer of clothing and accessories. The size and scale of our Online operation enables us to provide our customers with an assortment of luxury merchandise that we believe is unmatched by other U.S. luxury and premium multi-branded retailers, with over 750 luxury brands currently offered through our online channel. Our well-established Online operation expands the reach of our brands internationally and beyond the trading area of our U.S. retail stores. Almost 40% of our Online Neiman Marcus customers for Fiscal 2013 were located outside of the trade areas of our existing full-line store locations. Recently we have taken steps to further globalize our Neiman Marcus brand through our Online business. In 2012, we launched international shipping to over 100 countries, including Canada, Japan, Australia, Russia and several countries in the Middle East. In addition, we launched a full-price, Mandarin language e-commerce website for the Neiman Marcus brand to cater to the growing affluent population in China. We believe our Online segment comprises a larger portion of our revenues (22% of our Fiscal 2013 revenues) than those of Saks Fifth Avenue and Nordstrom.
One of the largest luxury, multi-branded, omni-channel retailers. We are one of the largest luxury, multi-branded, omni-channel fashion retailers in the world with what we believe to be two of the most globally recognized and reputable luxury brands—Neiman Marcus and Bergdorf Goodman. With a history of over 100 years in retailing, our iconic brands are recognized as synonymous with fashion, luxury and style. With approximately $4.6 billion in revenues in Fiscal 2013, we are significantly larger than many other North American and European luxury, multi-branded retailers. We believe that our size, our reach, our reputation and our long-term relationships with designers allow us to obtain a better brand selection and a higher allocation of top merchandise.
We have an extensive omni-channel platform across our brands. Our significant investment in our omni-channel model enables our customers to shop "anytime, anywhere, any device." We have a highly profitable and productive store base in many of the country's most prestigious locations. The combined store productivity of our Neiman Marcus and Bergdorf Goodman stores, which was $552 per square foot for Fiscal 2013, has consistently outperformed other U.S. luxury and premium multi-branded retailers over the last 10 years. Our Online operation enables us to reach the world's wealthiest consumers, which is critical to addressing the needs of our evolving global, fashion-conscious luxury consumers, and provides us with enhanced selling and marketing tools to increase the visibility and exposure of our brands and generate customer traffic within our retail stores. We believe the combination of our retail stores and our online presence is the primary reason that our omni-channel customers spend, on average, more than our single-channel customers. For example, for the Neiman Marcus brand, on average, our omni-channel customers spend over four times more than our single-channel customers.
Leader in luxury online retailing with the largest assortment of luxury brands. We believe that we were one of the first major luxury fashion online retailers in the world, which positions us as a leader in this evolving channel. Our Online operation currently accounts for annual revenues of just over $1 billion, which we believe makes it one of the largest luxury, multi-branded online platforms.
From our fiscal year ended August 1, 2009 ("Fiscal 2009") through Fiscal 2013, our Online business has grown revenues at a compounded annual growth rate ("CAGR") of 12.1%. We believe that our scale and success allow us to provide our customers with an assortment of luxury merchandise online that is unmatched by other U.S. luxury and premium multi-branded retailers. We currently offer over 750 luxury brands through our Online channel. Furthermore, our online data analytics capabilities allow us to tailor our marketing and provide our customers with a highly personalized shopping experience. At approximately 22% of our total revenues in Fiscal 2013, our Online retailing operation represents a critical element of our omni-channel strategy and comprises a larger portion of our revenues than those of Saks Fifth Avenue and Nordstrom.
Exceptional real estate locations with favorable terms for full-line stores. Our stores are located in prime locations in metropolitan markets, including U.S. gateway cities that draw customers from around the world such as New York City, Miami, Los Angeles, San Francisco and Las Vegas, resulting in a footprint that would be challenging for a competitor to replicate. In Fiscal 2013, we generated approximately 58% of our full-line store revenue from stores located in gateway cities. Our full-line stores are situated among the highest-end luxury boutiques and upscale retailers in the most prestigious shopping centers, malls and other metropolitan shopping destinations that are frequented by the wealthiest of customers. We believe that our brand, reputation and strength in the luxury market have allowed us to obtain our premier locations on favorable terms. Over 90% of our full-line store real estate leases have maturities over 25 years, including renewal options, providing us with substantial operating stability for our store base. Our real estate strategy with respect to our full-line stores allows us to obtain favorable pricing, resulting in an attractive rent structure.
Leading portfolio of fashion brands and long-standing partnerships with vendors. As a leading fashion authority among luxury consumers, we carry many of the world's most exclusive designers. Our highly skilled merchandising teams enable us to optimize assortments for each channel. We offer curated assortments that are customized at the store level based on our extensive local market knowledge and online data analytics. We offer a broad selection of highly differentiated and distinctive luxury merchandise to fully address our customers' lifestyle needs. We have long-standing, 25+ year relationships with most of our largest vendors. In addition, we have an extensive history of identifying, developing and nurturing emerging design talent. We believe that these relationships with both established and emerging designers allow us to obtain a better brand selection, including in some instances merchandise and brands that are exclusive to us, and superior allocation of merchandise, providing our customers with a distinctive shopping experience. Our vendor base is diverse, with no single vendor representing more than 7% of the cost of our total purchases in Fiscal 2013. The breadth of our sourcing helps mitigate risks associated with a single brand or designer.
Customer service led organization fosters strong customer relationships and loyalty and drives sales. We maintain superior customer service initiatives that enable us to engage with our customers and cultivate long-term relationships and customer loyalty to increase sales.
InCircle® Loyalty Program: We believe we were among the first retailers to adopt a customer loyalty program, and we believe that our InCircle loyalty program helps drive incremental sales, as our InCircle members visit our stores more frequently and spend significantly more than other customers. In Fiscal 2013, our 143,000 reward status InCircle members spent, on average, 17 times more than our non-loyalty members. Our InCircle program focuses on our most active customers to drive engagement, resulting in an increased number of transactions and sales by offering attractive member benefits such as private in-store events, special exclusive offers and the ability to earn gift cards.
Our Sales Associates: Our sales associates provide exceptional and differentiated customer service, instilling and reinforcing our culture of relationship-based service recognized by our customers. Our commission-based sales associates have an average tenure of over seven years and are highly productive. We have empowered our sales force with technology by providing them with approximately 7,000 smart phones and tablets, which further enhances customer communication and engagement. Our emphasis is on building long-term customer relationships rather than transactional-based results, which has led to consistently strong customer service scores.
Attractive financial profile with strong free cash flow generation. Our business model has allowed us to achieve strong financial results, marked by increased comparable revenue, growth in our Online segment, Adjusted EBITDA margin expansion and steady cash flow generation. Our total revenues and Online revenues have grown at CAGRs of 6.3% and 12.1%, respectively, from Fiscal 2009 to Fiscal 2013. During this same period, we grew our Adjusted EBITDA at a CAGR of 23.6%. Our Adjusted EBITDA margins and disciplined capital expenditures drive significant generation of "Free Cash Flow", which we define as Adjusted EBITDA less net capital expenditures. Since Fiscal 2009, 79.8% of our Adjusted EBITDA has been converted to Free Cash Flow. For a discussion of Adjusted EBITDA and Free Cash Flow, see "Summary Unaudited Pro Forma Consolidated Financial Information and Other Data."
We have experienced an annual increase in comparable revenues during 18 of the past 21 fiscal years, with average annual comparable revenue growth of 4.1%. We believe that our quick recovery and strong financial performance since Fiscal 2009 illustrate the strength of our competitive position and the resilient nature of our business model, which is due in part to the relative affluence of our customer base. In addition, we believe that our prudent and flexible approach to capital spending and operational focus on enhancing the profitability of our existing store base has benefited our financial performance. Furthermore, we operate under a model in which approximately 55% of selling, general and administrative expense is variable, allowing us to optimize costs in response to changing market and industry conditions. For example, we were able to decrease selling, general and administrative expense in Fiscal 2009 by $163 million, or approximately 16%, compared to Fiscal 2008. As a result, we have consistently generated positive Free Cash Flow through various macroeconomic and industry cycles.
Exceptional management team with world-class execution skills and strong sponsorship. Our senior leadership team has deep experience across a broad range of disciplines in the retail industry including sales, marketing, merchandising, operations, logistics, information technology, e-commerce, real estate and finance. We are led by a deep bench of senior executives with an average of 22 years of experience in the retail industry, and an average of 13 years with us. Karen Katz, our President and Chief Executive Officer, joined Neiman Marcus in 1985 and has led a variety of our business units, including leading both the Neiman Marcus Stores and Neiman Marcus Direct (which operates our Online business) businesses during her tenure. James Skinner, our Executive Vice President, Chief Operating Officer and Chief Financial Officer, brings over 20 years of retail experience to Neiman Marcus and has held multiple senior leadership positions with us since joining in 2000. James Gold, our President of Specialty Retail, joined us in 1991 and, prior to assuming his current role, was the Chief Executive Officer of Bergdorf Goodman from May 2004 to October 2010. While many of our executives have deep-rooted experience at Neiman Marcus in a variety of management positions, we have also hired executives who bring fresh, outside perspectives and expertise to our organization. In June 2011, we hired John Koryl as the President of Neiman Marcus Direct. Mr. Koryl brings meaningful online experience, including a total of six years at Williams-Sonoma and eBay. In May 2012, we hired Joshua Schulman as the President of Bergdorf Goodman. Mr. Schulman was the Chief Executive Officer of Jimmy Choo for five years and held various senior executive roles at Kenneth Cole, Gap and Gucci. Our management team has demonstrated a successful track record of delivering strong growth and increased profitability. As a result, we believe that we are well-positioned to execute our strategy and continue to deliver superior financial results. Our Sponsors are among the most active sponsors in the consumer products and retail sectors, with substantial experience and a long history of success.
Continue to expand omni-channel capabilities. We believe we are on the forefront of omni-channel retailing, and we intend to continue to expand our omni-channel capabilities in order to drive sales and provide a seamless customer experience across channels. We are focused on offering additional capabilities to enhance our customers' ability to shop "anytime, anywhere, any device." These include improving our inventory visibility and delivery across our in-store and online channels, migrating all brands and channels to a single merchandising platform and increasing the personalized shopping experience. Providing our customers with access to inventory across channels enables us to realize more efficient purchasing, improved inventory turns and higher customer satisfaction.
Continue to grow our Online business in the United States and abroad. We intend to maintain our leadership position in online luxury retailing. We plan to grow our Online business domestically and internationally by highly personalizing the shopping experience through customer recognition and delivering a highly individualized "MyNM" experience, improving sales conversion through sophisticated web analytics and expanding our global online capabilities. In addition, in an effort to enhance the online shopping experience, we recently announced that we are offering free shipping and returns. Our international Online business represents a significant opportunity, which we intend to pursue by implementing focused marketing programs to build global brand awareness and by focusing on key geographies with strong affluent customer demographics.
Continue to drive comparable revenue momentum. We have historically invested capital in our business very efficiently, with a return on invested capital that has outperformed other luxury/premium multi-branded U.S. retailers over the last five years. We expect to continue to increase our comparable revenue by making focused, high-return capital investments to drive traffic, increase our selling opportunities and enhance customer service. Such investments, among others, include continued reinvestment in:
- •
- the store base, with significant ongoing remodeling projects;
- •
- our designer shops located within our stores to deepen our relationships with our designers; and
- •
- technology to support our omni-channel efforts and improve the overall in-store customer experience.
Further expand small format retail stores. We intend to leverage our expertise in omni-channel retailing to further expand our small format concepts, Last Call and CUSP, both through store expansion and increased online penetration.
Last Call: Currently there are 36 Last Call locations. We believe Last Call represents a meaningful growth opportunity relative to the number of off-price retail locations of other luxury and premium multi-branded U.S. retailers. Over the next five years, we believe there is an opportunity to significantly increase our Last Call store count. Combined with lastcall.com, we believe there is an opportunity to enhance our existing, nationwide, omni-channel experience for the aspirational, price-sensitive yet fashion-minded customer.
CUSP: Currently there are six standalone CUSP locations. Combined with our 41 CUSP departments located in our Neiman Marcus stores and our established CUSP.com online business, we believe there is an opportunity to further leverage the brand and enhance our omni-channel experience for the younger customer focused on contemporary fashion. We believe there is an opportunity to take advantage of the attractive market trends in the U.S. women's contemporary apparel market, which we estimate to be approximately $10 billion in size.
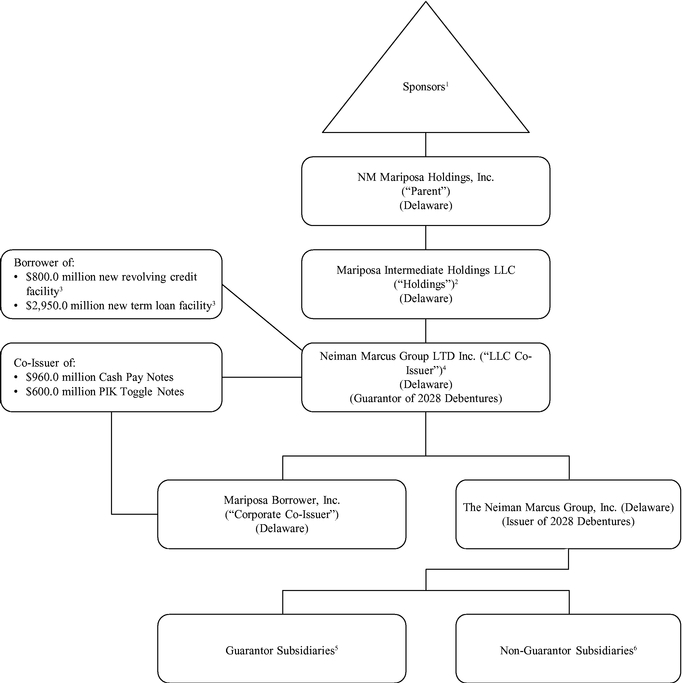
The following chart summarizes our corporate structure and principal indebtedness after giving effect to the Transactions. This chart is provided for illustrative purposes only and does not represent all legal entities affiliated with, or all obligations of, Parent and its subsidiaries (including the Company):
- (1)
- The
Sponsors, certain co-investors and senior management will contribute approximately $1,603.0 million (including approximately $30 million
of rollover contributions to be made by our senior management) to the equity of Parent. The total amount of the equity contribution may be adjusted in certain circumstances.
- (2)
- Holdings will guarantee borrowings under our new senior secured credit facilities but will not guarantee the Notes.
- (3)
- Our
new senior secured credit facilities at closing will consist of (a) a new $2,950.0 million term loan facility with a seven-year maturity
and (b) a new $800.0 million revolving credit facility, subject to a borrowing base, with a five-year maturity.
- (4)
- We
expect that the Company will be converted into a limited liability company after consummation of the Transactions.
- (5)
- Our
current and future wholly owned restricted subsidiaries that guarantee our new senior secured credit facilities will guarantee the Notes. These
guarantees will be in effect only upon the closing of the Acquisition (the "Closing Date"). Certain of these guarantors pledge certain of their respective assets to secure the obligations under our
existing 7.125% senior debentures due 2028 (the "2028 Debentures"), which assets will also secure our new senior secured credit facilities.
- (6)
- For Fiscal 2013, our subsidiaries that will become guarantors of the Notes accounted for substantially all of our revenues and our Adjusted EBITDA. As of August 3, 2013, our subsidiaries that will become guarantors of the Notes held substantially all of our net assets and our total liabilities.
The following table summarizes the estimated sources and uses of funds on the Closing Date, after giving effect to the Transactions. The amounts set forth in the table and the accompanying footnotes will vary from actual amounts on the Closing Date depending on several factors, including differences between our actual and estimated fees and expenses. You should read the following together with the information included under "Unaudited Pro Forma Condensed Consolidated Financial Information" included below.
Sources of Funds ($ in millions) |
Amount | Uses of Funds ($ in millions) |
Amount | ||||||
|---|---|---|---|---|---|---|---|---|---|
New senior secured credit facilities: |
Equity consideration(6) |
$ | 3,390.6 | ||||||
New revolving credit facility(1) |
$ | 75.0 | Repay existing credit facilities(7) |
2,578.1 | |||||
New term loan facility(2) |
2,950.0 | Estimated fees and expenses(8) |
249.3 | ||||||
Notes: |
Rollover of 2028 Debentures(4) |
125.0 | |||||||
Cash Pay Notes |
960.0 | Cash and cash equivalents to balance sheet(9) |
32.0 | ||||||
PIK Toggle Notes |
600.0 | ||||||||
Equity contribution(3) |
1,603.0 | ||||||||
Rollover of 2028 Debentures(4) |
125.0 | ||||||||
Cash and cash equivalents(5) |
62.0 | ||||||||
Total Sources |
$ | 6,375.0 | Total Uses |
$ | 6,375.0 | ||||
- (1)
- As
a result of our seasonal working capital requirements, we anticipate that at closing we will utilize approximately $75.0 million of the borrowing
capacity under our new revolving credit facility. Our working capital requirements are greatest in the first and second fiscal quarters as a result of higher seasonal requirements. We anticipate
repaying these borrowings in the second quarter of the fiscal year ended August 2, 2014 ("Fiscal 2014").
- (2)
- On
the Closing Date, we expect to enter into our new term loan facility in an aggregate principal amount of $2,950.0 million with a maturity of seven
years, the full amount of which will be borrowed on the Closing Date.
- (3)
- Represents
the approximate equity contribution to be made by the Sponsors, certain co-investors and approximately $30 million of rollover
contributions to be made by our senior management.
- (4)
- Reflects
the outstanding principal amount of the 2028 Debentures. Upon the closing of the Transactions, we expect our 2028 Debentures to remain outstanding
and be secured debt to the extent required by the terms of the indenture governing the 2028 Debentures, sharing on an equal and ratable basis a first priority lien on certain of the collateral that
will secure our new term loan facility.
- (5)
- Represents
estimated cash and cash equivalents immediately prior to the closing of the Transactions. As of August 3, 2013, our cash and cash
equivalents balance was $136.7 million. During the first quarter of Fiscal 2014, we used cash and cash equivalents to make a voluntary prepayment of our existing term loan facility and for
working capital purposes.
- (6)
- Represents
total cash consideration to be paid in connection with the Transactions (including a cash payment of $83.0 million for certain anticipated
tax benefits) to holders of all of the issued and outstanding common stock and holders of outstanding stock options issued pursuant to our stock option plans, whether or not vested or exercisable.
- (7)
- Our
$700.0 million existing revolving credit facility and our existing term loan facility will terminate and outstanding borrowings will be repaid
upon closing of the Transactions.
- We expect to have $145.0 million of outstanding borrowings under our $700.0 million existing revolving credit facility immediately prior to the closing of the Transactions. As of August 3, 2013,
we had $15.0 million of outstanding borrowings under this facility. During the first quarter of Fiscal 2014, we borrowed an additional $130.0 million to fund a portion of a voluntary term loan prepayment and for working capital purposes.
- We
expect to have $2,433.1 million outstanding under the existing term loan facility immediately prior to the closing of the
Transactions. As of August 3, 2013, we had $2,560.0 million outstanding. On August 29, 2013, we made a voluntary prepayment of $126.9 million, which was funded with cash
and borrowings under our existing revolving credit facility.
- (8)
- Reflects
estimated debt issuance costs, accrued interest on our existing senior secured credit facilities and estimated fees and expenses associated with
the Transactions. An additional $52.0 million of expenses primarily related to employee compensation plans and approximately $17.0 million of transfer taxes, both of which we expect to
pay within 30 days of the Closing Date, are not included in the number set forth above. An increase in actual fees and expenses will result in a corresponding increase in the equity
contribution or decrease in cash on the balance sheet.
- (9)
- Represents the expected cash and cash equivalents on the balance sheet immediately after the closing of the Transactions.
SUMMARY UNAUDITED PRO FORMA CONSOLIDATED FINANCIAL
INFORMATION AND OTHER DATA
The following table sets forth our summary historical consolidated financial information and summary unaudited pro forma consolidated financial information for the periods and dates indicated.
The summary historical consolidated financial information as of July 30, 2011, July 28, 2012 and August 3, 2013, and for each of the fiscal years ended July 30, 2011 ("Fiscal 2011") and July 28, 2012 ("Fiscal 2012") and Fiscal 2013 have been prepared in accordance with generally accepted accounting principles in the United States ("GAAP"). Each of Fiscal 2011 and Fiscal 2012 consists of 52 weeks; Fiscal 2013 consists of 53 weeks. The differing length of certain fiscal years may affect the comparability of the data provided. The balance sheet data as of July 30, 2011, July 28, 2012 and August 3, 2013 and the statement of operations and cash flow data for each of Fiscal 2011, Fiscal 2012 and Fiscal 2013 have been derived from our audited consolidated financial statements. Our historical results are not necessarily indicative of results for any future reporting period.
The summary unaudited pro forma consolidated financial information for Fiscal 2013 has been derived from our audited consolidated financial statements. The summary unaudited pro forma consolidated statement of operations data have been adjusted to give effect to the Transactions as if these events occurred on July 29, 2012. The summary unaudited pro forma consolidated balance sheet data have been adjusted to give effect to the Transactions as if these events occurred as of August 3, 2013. The pro forma information presented, including allocations of purchase price, is based on preliminary estimates of the fair values of assets acquired and liabilities assumed, available information and assumptions and will be revised as additional information becomes available. The actual adjustments to our audited consolidated financial statements upon the closing of the Transactions will depend on a number of factors, including additional information available and our net assets on the Closing Date. Therefore, the actual adjustments will differ from the pro forma adjustments and the differences may be material.
The summary unaudited pro forma consolidated financial information is for information purposes only and does not purport to present what our results of operations and financial condition would have been had the Transactions actually occurred as of the assumed dates, nor does it project our results of operations for any future period or our financial condition at any future date. This information is only a summary and should be read in conjunction with "Unaudited Pro Forma Condensed Consolidated Financial Information."
| |
Fiscal Year Ended | Pro Forma Fiscal Year Ended August 3, 2013(1) |
|||||||||||
|---|---|---|---|---|---|---|---|---|---|---|---|---|---|
($ in millions, except sales per square foot)
|
July 30, 2011 |
July 28, 2012 |
August 3, 2013(1) |
||||||||||
Statement of operations data: |
|||||||||||||
Revenues |
$ | 4,002.3 | $ | 4,345.4 | $ | 4,648.2 | $ | 4,648.2 | |||||
Cost of goods sold including buying and occupancy costs (excluding depreciation) |
2,589.3 | 2,794.7 | 2,995.4 | 3,115.1 | |||||||||
Selling, general and administrative expenses |
934.3 | 1,016.9 | 1,057.8 | 1,036.5 | |||||||||
Income from credit card program |
(46.0 | ) | (51.6 | ) | (53.4 | ) | (53.4 | ) | |||||
Depreciation and amortization |
194.9 | 180.2 | 188.9 | 247.1 | |||||||||
Operating earnings |
329.7 | 403.6 | 446.4 | 289.8 | |||||||||
Earnings (loss) before income taxes |
49.3 | (2) | 228.3 | 277.4 | (3) | (4.6 | ) | ||||||
Net earnings (loss) |
31.6 | (2) | 140.1 | 163.7 | (3) | (7.2 | ) | ||||||
Balance sheet data (at end of period): |
|||||||||||||
Cash and cash equivalents |
$ | 321.6 | $ | 49.3 | $ | 136.7 | $ | 36.2 | |||||
Merchandise inventories |
839.3 | 939.8 | 1,018.8 | 1,130.7 | |||||||||
Working capital(4) |
319.0 | 369.3 | 372.6 | 525.9 | |||||||||
Property and equipment, net |
873.2 | 894.5 | 901.8 | 1,130.7 | |||||||||
Total assets |
5,364.8 | 5,201.9 | 5,300.2 | 8,760.6 | |||||||||
Total debt |
2,681.7 | 2,781.9 | 2,697.1 | 4,710.6 | |||||||||
Cash flow data: |
|||||||||||||
Net cash provided by (used in): |
|||||||||||||
Operating activities |
$ | 272.4 | $ | 259.8 | $ | 349.4 | |||||||
Investing activities |
(94.2 | ) | (182.3 | ) | (156.5 | ) | |||||||
Financing activities |
(277.6 | ) | (349.9 | ) | (105.4 | ) | |||||||
Selected operating data: |
|||||||||||||
Number of full-line stores open at period end |
43 | 44 | 43 | 43 | |||||||||
Sales per square foot(5) |
$ | 505 | $ | 535 | $ | 552 | $ | 552 | |||||
Change in Specialty Retail Stores comparable revenues(5) |
7.5 | % | 6.0 | % | 2.2 | % | 2.2 | % | |||||
Change in comparable revenues(6) |
8.1 | % | 7.9 | % | 4.9 | % | 4.9 | % | |||||
Rent expense and related occupancy costs(7) |
87.6 | 91.9 | 96.7 | 104.6 | |||||||||
Other financial data: |
|||||||||||||
Revenues by Operating Segment |
|||||||||||||
Specialty Retail Stores |
$ | 3,245.2 | $ | 3,466.6 | $ | 3,616.9 | $ | 3,616.9 | |||||
Online |
757.1 | 878.8 | 1,031.3 | 1,031.3 | |||||||||
Net capital expenditures(8) |
83.7 | 142.2 | 139.3 | 139.3 | |||||||||
Adjusted EBITDA(9) |
538.6 | 608.4 | 673.6 | 671.5 | |||||||||
Adjusted net total debt (at Closing Date)(10) |
4,603.0 | ||||||||||||
Cash interest expense(11) |
273.9 | ||||||||||||
Ratio of adjusted net total debt (at Closing Date) to Adjusted EBITDA(9)(10) |
6.9 | x | |||||||||||
Ratio of Adjusted EBITDA to cash interest expense(9)(11) |
2.5 | x | |||||||||||
- (1)
- Each
of Fiscal 2012 and Fiscal 2011 consists of 52 weeks; Fiscal 2013 consists of 53 weeks. The differing length of certain fiscal years may
affect the comparability of the data provided.
- (2)
- For Fiscal 2011, earnings before income taxes and net earnings include a loss on debt extinguishment of $70.4 million, which included (1) costs of $37.9 million related to the tender for and redemption of our 9.0%/9.75% senior notes due 2015 existing prior to the Transactions and (2) the write-off of $32.5 million of debt issuance costs related to the extinguished debt facilities. The total loss on debt extinguishment was recorded as a component of interest expense.
- (3)
- For
Fiscal 2013, earnings before income taxes and net earnings include a loss on debt extinguishment of $15.6 million, which included
(1) costs of $10.7 million related to the tender for and redemption of our 10.375% senior subordinated notes due 2015 existing prior to the Transactions and (2) the write-off of
$4.9 million of debt issuance costs related to the extinguished debt facilities. The total loss on debt extinguishment was recorded as a component of interest expense.
- (4)
- Working
capital is calculated as current assets, excluding cash, minus current liabilities, excluding indebtedness.
- (5)
- Sales
per square foot is calculated as Neiman Marcus stores and Bergdorf Goodman stores net sales divided by weighted average square footage. Weighted
average square footage includes a percentage of year-end square footage for new and closed stores equal to the percentage of the year during which they were open. Our small format stores (Last Call
and CUSP) are not included in this calculation. Sales per square foot for Fiscal 2013 are based on revenues for the 52 weeks ended July 27, 2013.
- (6)
- Comparable
revenues include (1) revenues derived from our retail stores open for more than 52 weeks, including stores that have been relocated
or expanded and (2) revenues from our Online operation. Comparable revenues exclude revenues of closed stores. We closed our Neiman Marcus store in Minneapolis in January 2013. The calculation
of the change in comparable revenues for Fiscal 2013 is based on revenues for the 52 weeks ended July 27, 2013 compared to revenues for the 52 weeks ended July 28, 2012.
- (7)
- Rent
expense and related occupancy costs on a pro forma basis exclude the amortization of our historical deferred real estate credits that will be
eliminated in connection with purchase accounting.
- (8)
- Net
capital expenditures reflects capital expenditures less developer contributions of $10.5 million, $10.6 million and $7.2 million
for Fiscal 2011, Fiscal 2012 and Fiscal 2013, respectively.
- (9)
- EBITDA
consists of net earnings (loss) before interest, income taxes, depreciation and amortization. Adjusted EBITDA consists of EBITDA adjusted to
eliminate (i) equity in the loss of a foreign e-commerce retailer, (ii) the impact of non-cash stock-based compensation expense, (iii) advisory and other fees primarily related to
investment in a foreign e-commerce retailer and the strategic review of our business and growth opportunities and (iv) the annual management fee paid to the current sponsors. Adjusted EBITDA
presented on a pro forma basis is also adjusted to eliminate (i) the historical amortization of deferred real estate credits, (ii) historical amortization of previously unrecognized
actuarial losses related to certain long-term benefit plans and (iii) the increase in cost of sales for the step-up in the carrying value of our merchandise inventories pursuant to purchase
accounting. You are encouraged to evaluate each adjustment and the reasons we consider them appropriate for supplemental analysis. We believe the presentation of EBITDA and Adjusted EBITDA gives
investors meaningful information to help them understand our operating results and to analyze our financial and business trends on a period-to-period basis. Presentations of these measures on a pro
forma basis take into account the impact of the Transactions as though they had occurred on July 29, 2012.
- EBITDA and Adjusted EBITDA and the related ratio data are not calculated or presented in accordance with GAAP and other companies in our industry may calculate EBITDA and Adjusted EBITDA differently than we do. As a result, these financial measures have limitations as analytical and comparative tools and you should not consider these items in isolation, or as a substitute for analysis of our results as reported under GAAP. We compensate for these limitations by relying primarily on our GAAP results and using EBITDA and Adjusted EBITDA only as a supplement to our GAAP results. EBITDA and Adjusted EBITDA should not be considered as measures of discretionary cash available to us to invest in the growth of our business. In evaluating these financial measures, you should be aware that in the future we may incur expenses similar to those eliminated in this presentation. Our presentation of EBITDA and Adjusted EBITDA should not
be construed as an inference that our historical results were not and future results will not be affected by similar and/or other unusual or non-recurring items.
- The following table reconciles net earnings (loss) to EBITDA and Adjusted EBITDA for the periods presented:
| |
Fiscal Year Ended | Pro Forma Fiscal Year Ended August 3, 2013 |
|||||||||||
|---|---|---|---|---|---|---|---|---|---|---|---|---|---|
(dollars in millions)
|
July 30, 2011 |
July 28, 2012 |
August 3, 2013 |
||||||||||
Net earnings (loss) |
$ | 31.6 | $ | 140.1 | $ | 163.7 | $ | (7.2 | ) | ||||
Income tax expense |
17.7 | 88.3 | 113.7 | 2.5 | |||||||||
Interest expense, net |
280.5 | 175.2 | 169.0 | 294.4 | |||||||||
Depreciation expense |
132.4 | 130.1 | 141.5 | 171.1 | |||||||||
Amortization of intangible assets and favorable lease commitments |
62.5 | 50.1 | 47.4 | 76.0 | |||||||||
EBITDA |
$ | 524.7 | $ | 583.8 | $ | 635.3 | $ | 536.8 | |||||
Equity in loss of foreign e-commerce retailer(a) |
— | 1.5 | 13.1 | 13.1 | |||||||||
Non-cash stock-based compensation expense(b) |
3.9 | 6.9 | 9.7 | 9.7 | |||||||||
Advisory and other fees(c) |
— | 6.2 | 5.4 | — | |||||||||
Management fee paid to current sponsors(d) |
10.0 | 10.0 | 10.0 | — | |||||||||
Non-cash expense attributable to inventory step-up |
— | — | — | 111.9 | |||||||||
Adjusted EBITDA(e) |
$ | 538.6 | $ | 608.4 | $ | 673.6 | $ | 671.5 | |||||
- (a)
- In
the third quarter of Fiscal 2012, we purchased a non-controlling interest in a foreign e-commerce retailer. This amount represents the non-cash charges
attributable to our proportionate share of the losses generated by the foreign e-commerce retailer recorded pursuant to the equity method of accounting.
- (b)
- We
incurred non-cash stock-based compensation expense related to our stock option plan.
- (c)
- We
incurred advisory and other fees primarily related to our international investment in a foreign e-commerce retailer in Fiscal 2012 and our strategic
review of our business and growth opportunities in Fiscal 2013.
- (d)
- Pursuant
to a management services agreement with our current sponsors, and in exchange for consulting and management advisory services, the current sponsors
received an aggregate annual management fee equal to the lesser of (i) 0.25% of our consolidated annual revenues or (ii) $10.0 million. This management fee will cease to be
payable upon consummation of the Acquisition. Following the closing of the Transactions, a new management services agreement will be entered into, under which the Sponsors have the ability to charge a
similar fee.
- (e)
- The table below reflects the adjustments made to Adjusted EBITDA to show Adjusted EBITDA calculated on a pro forma basis:
Adjusted EBITDA |
$ | 673.6 | ||
Elimination of historical amortization of deferred real estate credits(i) |
(7.9 | ) | ||
Reduction in expenses related to long-term benefit plans(ii) |
5.8 | |||
Adjusted EBITDA on a pro forma basis |
$ | 671.5 | ||
- (i)
- Reflects the reversal of the reduction in rent expense related to the amortization of historical allowances received from developers in connection with the construction of our stores.
- (ii)
- Reflects the reversal of the amortization of previously unrecognized actuarial losses related to certain long-term benefit plans.
- (10)
- Adjusted
net total debt includes (i) the principal amount of our new term loan facility of $2,950.0 million, (ii) the Notes of
$1,560.0 million, (iii) the outstanding principal amount of the 2028 Debentures of $125.0 million, and is net of the expected cash and cash equivalents on the balance sheet
immediately after the closing of the Transactions of $32.0 million. Adjusted net total debt excludes anticipated outstanding borrowings under our new revolving credit facility at closing. As a
result of our seasonal working capital requirements, we anticipate that at closing we will utilize approximately $75.0 million of the borrowing capacity under this facility. We anticipate
repaying these borrowings in the second quarter of Fiscal 2014.
- (11)
- Cash interest expense is presented on a pro forma basis and reflects interest expense resulting from our new senior secured credit facilities, the Notes and the 2028 Debentures. The cash interest assumes certain interest rates on our new senior secured credit facilities and the Notes. See "Unaudited Pro Forma Condensed Consolidated Financial Information."
The following table sets forth as of August 3, 2013, our cash and cash equivalents and capitalization on:
- •
- an actual basis; and
- •
- an as adjusted basis to give effect to the Transactions as if they had occurred on August 3, 2013.
This table should be read in conjunction with the information presented under the captions "Summary Unaudited Pro Forma Consolidated Financial Information and Other Data," "Sources and Uses" and "Unaudited Pro Forma Condensed Consolidated Financial Information."
| |
As of August 3, 2013 | ||||||
|---|---|---|---|---|---|---|---|
($ in millions)
|
Actual | As Adjusted | |||||
Cash and cash equivalents |
$ | 136.7 | $ | 36.2 | (1) | ||
Debt: |
|||||||
Existing senior secured credit facilities, consisting of the following: |
|||||||
Existing term loan facility |
$ | 2,560.0 | $ | — | |||
Existing revolving credit facility |
15.0 | — | |||||
2028 Debentures(2) |
122.1 | 125.6 | |||||
New senior secured credit facilities, consisting of the following(3): |
|||||||
New term loan facility |
— | 2,950.0 | |||||
New revolving credit facility(4) |
— | 75.0 | |||||
Notes, consisting of the following(5): |
|||||||
Cash Pay Notes |
— | 960.0 | |||||
PIK Toggle Notes |
— | 600.0 | |||||
Total debt |
2,697.1 | 4,710.6 | |||||
Total stockholders' equity |
831.0 | 1,603.0 | (6) | ||||
Total capitalization |
$ | 3,528.1 | $ | 6,313.6 | |||
- (1)
- We
estimate that cash and cash equivalents on the balance sheet immediately after the closing of the Transactions will be $32.0 million.
- (2)
- $125.0 million
in aggregate principal amount of the 2028 Debentures are outstanding as of August 3, 2013. The difference between the
August 3, 2013 balance and the pro forma balance is due to an increase in fair value as a result of purchase accounting.
- (3)
- Our
new senior secured credit facilities will consist of (a) a new $2,950.0 million term loan facility with a seven-year maturity and
(b) a new $800.0 million revolving credit facility with a five-year maturity.
- (4)
- We
expect that our new revolving credit facility will have drawings of approximately $75.0 million on the Closing Date for seasonal working capital
requirements. Our working capital requirements are greatest in the first and second fiscal quarters as a result of higher seasonal requirements. We anticipate repaying these borrowings in the second
quarter of Fiscal 2014. Had the Transactions closed on August 3, 2013, the amount of borrowings under our new revolving credit facility would have been less than this amount.
- (5)
- Represents
the aggregate principal amount of the Notes at the Closing Date.
- (6)
- Represents the cash equity contribution by the Sponsors, certain co-investors and rollover equity by certain members of senior management. The pro forma amount may be adjusted to the extent that the fees and expenses related to the offering are greater or less than estimated.
UNAUDITED PRO FORMA CONDENSED CONSOLIDATED FINANCIAL INFORMATION
We prepared the following unaudited pro forma condensed consolidated financial information by applying pro forma adjustments to the historical audited consolidated financial statements of The Neiman Marcus Group LTD Inc. The unaudited pro forma condensed consolidated statement of operations gives effect to the Transactions as if they had occurred on July 29, 2012. The unaudited pro forma condensed consolidated balance sheet gives effect to the Transactions as if they had occurred on August 3, 2013.
We based the unaudited pro forma adjustments upon available information and certain assumptions that we believe are reasonable under the circumstances. The assumptions underlying the pro forma adjustments are described in the accompanying notes, which should be read in conjunction with the unaudited pro forma condensed consolidated financial information. The pro forma information presented, including allocations of purchase price, is based on preliminary estimates of the fair values of assets acquired and liabilities assumed, available information and assumptions and will be revised as additional information becomes available. The actual adjustments to our audited consolidated financial statements upon the closing of the Transactions will depend on a number of factors, including additional information available and our net assets on the Closing Date. Therefore, the actual adjustments will differ from the pro forma adjustments and the differences may be material.
The Merger will be accounted for using purchase accounting. Under the purchase method of accounting, the total consideration paid is allocated to our tangible and intangible assets and liabilities based on their estimated fair values as of the date of the Transactions. As of the date of this Current Report on Form 8-K, we have not completed the valuation studies necessary to estimate the fair values of the assets acquired and liabilities assumed and the related allocation of purchase price. In presenting the pro forma financial information, we have allocated the total estimated purchase price, calculated as described in Note (1) to the Unaudited Pro Forma Condensed Consolidated Balance Sheet, to the assets acquired and liabilities assumed based on preliminary estimates of their fair values. A final determination of these fair values will reflect our consideration of valuations prepared by third-party appraisers. These final valuations will be based on the actual net tangible and intangible assets that exist as of the Closing Date. Any final adjustment will change the allocations of purchase price, which could affect the fair values assigned to the assets and liabilities and could result in changes to the unaudited pro forma condensed consolidated financial information, including a change to goodwill.
We are providing the unaudited pro forma condensed consolidated financial information for informational purposes only. The unaudited pro forma condensed consolidated financial information does not purport to represent what our results of operations or financial condition would have been had the Transactions actually occurred on the dates assumed, nor does it purport to project our results of operations or financial condition for any future period or as of any future date. You should read the unaudited pro forma condensed consolidated financial information in conjunction with "Use of Proceeds" and "Capitalization."
NEIMAN MARCUS GROUP LTD INC.
Unaudited Pro Forma Condensed Consolidated Balance Sheet
August 3, 2013
($ in thousands)
|
Historical | Adjustments for the Transactions |
Pro Forma | |||||||
|---|---|---|---|---|---|---|---|---|---|---|
ASSETS |
||||||||||
Current assets: |
||||||||||
Cash and cash equivalents |
$ | 136,676 | $ | (100,433 | )(1) | $ | 36,243 | |||
Merchandise inventories |
1,018,839 | 111,852 | (2) | 1,130,691 | ||||||
Deferred income taxes |
27,645 | — | 27,645 | |||||||
Other current assets |
102,817 | 22,023 | (2) | 124,840 | ||||||
Total current assets |
1,285,977 | 33,442 | 1,319,419 | |||||||
Property and equipment, net |
901,844 | (94,954 | )(2) | 1,130,680 | ||||||
|
323,790 | (2) | ||||||||
Goodwill |
1,263,433 | (1,263,433 | )(2) | 2,668,374 | ||||||
|
2,668,374 | (2) | ||||||||
Tradenames |
1,231,405 | (1,231,405 | )(2) | 1,909,478 | ||||||
|
1,909,478 | (2) | ||||||||
Customer lists |
210,690 | (210,690 | )(2) | 484,704 | ||||||
|
484,704 | (2) | ||||||||
Favorable lease commitments |
340,053 | (340,053 | )(2) | 1,067,522 | ||||||
|
1,067,522 | (2) | ||||||||
Debt issuance costs |
— | 147,375 | (3) | 147,375 | ||||||
Other assets |
66,839 | (33,804 | )(2) | 33,035 | ||||||
Total assets |
$ | 5,300,241 | $ | 3,460,346 | $ | 8,760,587 | ||||
LIABILITIES AND STOCKHOLDERS' EQUITY |
||||||||||
Current liabilities |
||||||||||
Accounts payable |
$ | 386,538 | $ | — | $ | 386,538 | ||||
Accrued liabilities |
390,168 | (19,411 | )(4) | 370,757 | ||||||
Total current liabilities |
776,706 | (19,411 | ) | 757,295 | ||||||
Long-term liabilities |
||||||||||
Existing revolving credit facility |
15,000 | (15,000 | )(3) | — | ||||||
Existing term loan facility |
2,560,000 | (2,560,000 | )(3) | — | ||||||
2028 Debentures |
122,077 | 3,548 | (2) | 125,625 | ||||||
New revolving credit facility |
— | 75,000 | (3) | 75,000 | ||||||
New term loan facility |
— | 2,950,000 | (3) | 2,950,000 | ||||||
Cash Pay Notes |
— | 960,000 | (3) | 960,000 | ||||||
PIK Toggle Notes |
— | 600,000 | (3) | 600,000 | ||||||
Deferred real estate credits |
104,366 | (104,366 | )(2) | — | ||||||
Other long-term liabilities |
251,673 | (16,270 | )(4) | 235,403 | ||||||
Deferred income taxes |
639,381 | 814,916 | (2) | 1,454,297 | ||||||
Total long-term liabilities |
3,692,497 | 2,707,828 | 6,400,325 | |||||||
Common stock |
— | 1,602,967 | (3) | 1,602,967 | ||||||
Stockholders' equity prior to the Transactions |
831,038 | (831,038 | )(5) | — | ||||||
Total stockholders' equity |
831,038 | 771,929 | 1,602,967 | |||||||
Total liabilities and stockholders' equity |
$ | 5,300,241 | $ | 3,460,346 | $ | 8,760,587 | ||||
NEIMAN MARCUS GROUP LTD INC.
Notes to Unaudited Pro Forma Condensed Consolidated Balance Sheet
(tables present dollars in millions)
- (1)
- Reflects
the reduction in available cash to fund a portion of the cash requirements to effect the Transactions.
- (2)
- Reflects the estimated allocation of the purchase price paid to our assets. Under the purchase method of accounting, the total consideration paid is allocated to our tangible and intangible assets and liabilities based on their estimated fair values as of the date of the Transactions. The purchase price has been allocated based on preliminary estimates of fair values of the acquired assets and assumed liabilities by independent third parties, as well as our experience with acquired businesses and their related valuations and purchase price allocations. The allocation is subject to revisions as additional information becomes available and such revisions could be material.
Consideration paid |
$ | 3,358.0 | |||||
Non-cash equity investment by management |
32.6 | ||||||
Capitalized transaction costs |
37.6 | ||||||
Total consideration |
3,428.2 | ||||||
Net assets acquired at historical cost |
$ | 831.0 | |||||
Less: cash payments due in connection with the Transactions(a) |
(102.2 | ) | |||||
Adjusted net assets acquired |
728.8 | ||||||
Adjustments to state acquired assets at fair value: |
|||||||
1) Increase carrying value of merchandise inventories(b) |
111.9 | ||||||
2) Increase carrying value of property and equipment |
323.8 | ||||||
3) Record intangible assets acquired: |
|||||||
Tradenames |
1,909.5 | ||||||
Customer lists |
484.7 | ||||||
Favorable lease commitments(c) |
1,067.5 | ||||||
4) Increase carrying value of 2028 Debentures at fair value(d) |
(3.5 | ) | |||||
5) Write-off deferred lease credits(e) |
104.4 | ||||||
6) Write-off other assets, primarily debt issue costs |
(33.8 | ) | |||||
7) Write-off valuation adjustments recorded in connection with the prior acquisition: |
|||||||
Historical property and equipment |
(95.0 | ) | |||||
Historical goodwill |
(1,263.4 | ) | |||||
Historical tradenames |
(1,231.4 | ) | |||||
Historical customer lists |
(210.7 | ) | |||||
Historical favorable lease commitments |
(340.0 | ) | |||||
8) Tax impact of valuation adjustments and other tax benefits(f) |
(793.0 | ) | |||||
Net assets acquired at fair value |
759.8 | ||||||
Excess purchase price recorded as goodwill |
$ | 2,668.4 | |||||
- (a)
- As a direct result of the change in control of the Company in connection with the Acquisition, we will incur the following liabilities which will be charged to earnings immediately prior to the Acquisition:
Amounts due to employees pursuant to incentive compensation plans |
$ | 31.7 | ||
Amounts due to current sponsors |
48.6 | |||
Expensed transaction costs |
21.9 | |||
Total costs |
$ | 102.2 | ||
- (b)
- In
connection with purchase accounting, we will step-up the carrying value of our merchandise inventories at the Closing Date to fair value.
- (c)
- In
connection with purchase accounting, we will evaluate our lease obligations related to our leased assets to determine whether our contractual obligations
are above or below prevailing market values as of the date of the Transactions. We will record intangible assets for those leases for which the contractual commitments are below market rates. We will
amortize these intangible assets over the remaining lease terms of the favorable lease commitments.
- (d)
- Upon
the closing of the Transactions, we expect our 2028 Debentures to remain outstanding and be secured debt to the extent required by the terms of the
indenture governing such 2028 Debentures, sharing on an equal and ratable basis, a first priority lien on certain of the collateral that will secure our new term loan facility. In connection with
purchase accounting, the 2028 Debentures are recorded at fair value.
- (e)
- We
receive allowances from developers related to the construction of our stores. We record these allowances as deferred real estate credits which, prior to
the Transactions, were recognized as a reduction to rent expense on a straight-line basis over the applicable lease term. The unamortized balance of the deferred real estate credits was
$104.4 million at August 3, 2013. In connection with the purchase accounting, the deferred historical real estate credits are eliminated.
- (f)
- In connection with the purchase accounting, deferred taxes are established for the differences between the book bases of our assets (except goodwill) and our liabilities, after giving effect to purchase accounting adjustments, and the tax bases of our assets and our liabilities.
- (3)
- Reflects
the net proceeds from the debt and equity financing used to complete the Acquisition consisting
of:
- •
- debt issuance costs of $147.4 million related to the indebtedness incurred and credit facilities executed in
connection with the Transactions;
- •
- $2,950.0 million from the proceeds of our new term loan facility;
- •
- $960.0 million from the proceeds of the Cash Pay Notes;
- •
- $600.0 million from the proceeds of the PIK Toggle Notes; and
- •
- $1,603.0 million equity contributions by the Sponsors and our senior management in the form of the rollover of a portion of their existing equity interests.
As a result of our seasonal working capital requirements, we anticipate that at the closing of the Transactions we will utilize approximately $75.0 million of our borrowing capacity under the new revolving credit facility to finance working capital and have assumed this for purposes of the Pro Forma Condensed Consolidated Balance Sheet. Our working capital requirements are greatest in the first and second fiscal quarters as a result of higher seasonal working capital requirements. We anticipate repaying these borrowings in the second quarter of Fiscal 2014. Had the Transactions closed on August 3, 2013, the amount of borrowings under the new revolving credit facility would have been less than this amount.
Our $700.0 million existing revolving credit agreement will terminate and outstanding borrowings repaid upon closing of the Transactions. We had $15.0 million outstanding under this facility as of August 3, 2013.
In addition, our existing term loan facility will terminate and outstanding borrowings repaid upon closing of the Transactions. We had $2,560.0 million outstanding under this facility as of August 3, 2013, of which we expect $2,433.1 million to be outstanding as of the Closing Date due to a voluntary prepayment of $126.9 million made on August 29, 2013.
- (4)
- Reflects
the following payments and other items to be incurred in connection with the Transactions:
- •
- payment of $2.3 million of accrued liabilities relating to costs incurred by us in connection with the Transactions
and the payment of $17.1 million of accrued interest in connection with the repayment of our existing senior secured credit facilities; and
- •
- payments aggregating $16.3 million of existing deferred compensation obligations under deferred compensation plans.
In addition, other payments to be made at the Closing Date aggregate $139.7 million, consisting primarily of change-in-control payments due to employees and our current sponsors and transaction costs, which will be accrued in connection with the Transactions.
- (5)
- Reflects the elimination of historical stockholders' equity.
NEIMAN MARCUS GROUP LTD INC.
Unaudited Pro Forma Consolidated Statement of Operations
For the Fiscal Year Ended August 3, 2013
($ in thousands)
|
Historical | Adjustments for the Transactions |
Pro Forma | |||||||
|---|---|---|---|---|---|---|---|---|---|---|
Revenues |
$ | 4,648,249 | $ | — | $ | 4,648,249 | ||||
Cost of goods sold including buying and occupancy costs (excluding depreciation) |
2,995,363 | 111,852 | (1) | 3,115,115 | ||||||
|
7,900 | (2) | ||||||||
Selling, general and administrative expenses |
1,057,796 | (21,251 | )(2) | 1,036,545 | ||||||
Income from credit card program |
(53,373 | ) | — | (53,373 | ) | |||||
Depreciation expense |
141,515 | 29,595 | (3) | 171,110 | ||||||
Amortization of intangible assets |
29,559 | 5,069 | (4) | 34,628 | ||||||
Amortization of favorable lease commitments |
17,877 | 23,469 | 41,346 | |||||||
Equity in loss of foreign e-commerce retailer |
13,125 | — | 13,125 | |||||||
Operating earnings |
446,387 | (156,634 | ) | 289,753 | ||||||
Interest expense, net |
168,955 | 125,446 | (5) | 294,401 | ||||||
Earnings (loss) before income taxes |
277,432 | (282,080 | ) | (4,648 | ) | |||||
Income tax expense |
113,733 | (111,139 | )(6) | 2,594 | ||||||
Net earnings (loss) |
$ | 163,699 | $ | (170,941 | ) | $ | (7,242 | ) | ||
NEIMAN MARCUS GROUP LTD INC.
Notes to Unaudited Pro Forma Condensed Consolidated Statement of Operations
(tables present dollars in millions)
- (1)
- To
give effect to the increase in cost of goods sold for the step-up in the carrying value of our merchandise inventories at the Closing Date to be recorded
pursuant to purchase accounting. All acquired inventories are assumed to be sold within 12 months of the Closing Date.
- (2)
- To give effect to the following increases/(decreases) in expenses:
Buying and occupancy expenses: |
||||
Elimination of historical amortization of deferred real estate credits(a) |
$ | 7.9 | ||
Selling, general and administrative expenses: |
||||
Elimination of management fees to the current sponsors |
$ | (10.0 | ) | |
Elimination of costs incurred in contemplation of the Transactions |
(5.5 | ) | ||
Reduction in expenses related to long-term benefit plans(b) |
(5.8 | ) | ||
Pro forma reduction in selling, general and administrative expenses |
$ | (21.3 | ) | |
- (a)
- Our
historical buying and occupancy costs are reduced by the amortization of deferred real estate credits arising from allowances received related to the
construction of our stores. We amortize the deferred lease credits on a straight-line basis over the applicable lease term. In connection with purchase accounting, our historical deferred real estate
credits will be eliminated.
- (b)
- A portion of our historical selling, general and administrative expenses represents the amortization of previously unrecognized actuarial losses related to certain long-term benefit plans over future years as permitted by GAAP. In connection with the allocation of the purchase price paid to our assets and liabilities pursuant to purchase accounting, the obligations related to these long-term benefit plans will be adjusted to fair value, thereby eliminating the previously unrecognized losses as of the Closing Date.
- (3)
- To
reflect the increase in depreciation resulting from recording our property and equipment at fair value pursuant to purchase accounting.
- (4)
- To reflect the amortization associated with intangible assets recorded pursuant to the purchase method of accounting as follows:
| |
Amortization Period |
Pro Forma Amortization |
|||||
|---|---|---|---|---|---|---|---|
Goodwill |
Indefinite life | — | |||||
Tradenames |
Indefinite life | — | |||||
Customer lists and other relationship-based intangibles assets |
12 to 16 years | $ | 34.6 | ||||
Favorable lease commitments |
16 to 36 years | $ | 41.3 | ||||
- Both
goodwill and tradenames are indefinite-lived intangible assets. As a result, goodwill and tradenames will not be amortized but will be
evaluated for impairment at least annually.
- This unaudited pro forma condensed consolidated financial information reflects our preliminary allocation of the purchase price to tangible assets, liabilities, goodwill and other intangible assets. The final purchase price allocation may result in a different allocation for tangible and intangible assets than that presented in this unaudited pro forma condensed consolidated financial information. An increase or decrease in the amount of purchase price allocated to amortizable assets would impact the amount of annual amortization expense. Identifiable intangible assets have been amortized on a straight-line basis in the unaudited pro forma condensed consolidated statements of operations. The following table shows the decrease to pro forma operating earnings
for every $100.0 million of purchase price allocated to amortizable intangibles at a range of weighted-average useful lives:
Weighted Average Life
|
Decrease to pro forma earnings |
|||
|---|---|---|---|---|
Four years |
$ | (25.0 | ) | |
Six years |
(16.7 | ) | ||
Eight years |
(12.5 | ) | ||
Ten years |
(10.0 | ) | ||
Twelve years |
(8.3 | ) | ||
- (5)
- To reflect interest expense resulting from our new debt structure upon completion of the Transactions (using an applicable one-month LIBOR of 0.18% at October 2, 2013 in the case of the new senior secured credit facilities):
New revolving credit facility(a) |
$ | 1.1 | ||
New term loan facility(b) |
132.8 | |||
Cash Pay Notes(c) |
76.8 | |||
PIK Toggle Notes(d) |
52.5 | |||
Commitment fee on unused new revolving credit facility(a) |
1.8 | |||
Total cash interest expense(e) |
265.0 | |||
Amortization of capitalized debt issuance costs(f) |
20.4 | |||
Elimination of interest on existing term loan facility and existing revolving credit facility(g) |
(160.0 | ) | ||
Pro forma adjustment to annual interest expense |
$ | 125.4 | ||
- (a)
- The $800.0 million new revolving credit facility, which is expected to bear interest at a rate equal to a one-month LIBOR for the interest period relevant to such borrowing plus 1.25% to 1.75% subject to a utilization-based grid. For purposes of preparing the unaudited pro forma condensed consolidated statement of operations, we have assumed that the borrowings under the new revolving credit facility are outstanding for the entire year and that:
Weighted average outstanding borrowings |
$ | 75.0 million | ||
Effective interest rate on borrowings (one-month LIBOR plus 1.25%) |
1.43 | % | ||
Weighted average available unused balance |
$ | 725.0 million | ||
Commitment fee rate on unused balance |
0.25 | % |
- (b)
- Reflects
interest on the $2,950.0 million new term loan facility that is expected to bear interest at a rate equal to the three-month LIBOR, subject
to a LIBOR floor of 1.00%, for the interest period relevant to such borrowing plus 3.50%. We estimate this rate to be 4.50% (1.00% LIBOR floor plus 3.50%) and we have assumed the full amount of the
new term loan facility to be outstanding in the preparation of the unaudited pro forma condensed consolidated financial statements.
- (c)
- Reflects
interest on the $960.0 million Cash Pay Notes at an assumed rate of 8.00%. A 0.25% increase or decrease in the actual interest rate on the
Cash Pay Notes would result in a corresponding $2.4 million increase or decrease in pro forma interest expense.
- (d)
- Reflects
interest on the $600.0 million senior unsecured PIK Toggle Notes at an assumed rate of 8.75%, which assumes the PIK Toggle Notes are cash
pay for the entire period presented. A 0.25% increase or decrease in the actual interest rate on the PIK Toggle Notes would result in a corresponding $1.5 million increase or decrease in pro
forma interest expense.
- (e)
- Based upon the current LIBOR of 0.18%, each 0.25% increase in LIBOR would increase total pro forma interest by $0.2 million up to the time that LIBOR exceeds 1.00%. Should
LIBOR exceed 1.00%, each 0.25% increase in LIBOR would increase pro forma interest expense by $7.6 million.
- (f)
- Represents
amortization of debt issuance costs incurred in connection with the debt incurred and the new senior secured credit facilities consummated in
connection with the Transactions.
- (g)
- Represents the elimination of historical interest expense on the existing term loan facility and existing revolving credit facility to be repaid upon the closing of the Transactions, interest on other indebtedness repaid prior to the Transactions, and other interest costs which will not be incurred subsequent to the Closing Date.
- (6)
- To reflect the tax effect of the above adjustments assuming a tax rate of 39.4%.
On April 30, 2010, a Class Action Complaint for Injunction and Equitable Relief was filed in the United States District Court for the Central District of California by Sheila Monjazeb, individually and on behalf of other members of the general public similarly situated, against the Company, Newton Holding, LLC, TPG Capital, L.P. and Warburg Pincus, LLC. On July 12, 2010, all defendants except for the Company were dismissed without prejudice, and on August 20, 2010, this case was refiled in the Superior Court of California for San Francisco County. This complaint, along with a similar class action lawsuit originally filed by Bernadette Tanguilig in 2007, alleges that the Company has engaged in various violations of the California Labor Code and Business and Professions Code, including without limitation (1) asking employees to work "off the clock," (2) failing to provide meal and rest breaks to its employees, (3) improperly calculating deductions on paychecks delivered to its employees and (4) failing to provide a chair or allow employees to sit during shifts. On October 24, 2011, the court granted the Company's motion to compel Ms. Monjazeb and a co-plaintiff to participate in the Company's Mandatory Arbitration Agreement, foreclosing a class action in that case. The court then determined that Ms. Tanguilig could not represent employees who are subject to our Mandatory Arbitration Agreement, thereby limiting the putative class action to those associates who were employed between December 2004 and July 15, 2007 (the effective date of our Mandatory Arbitration Agreement). Ms. Monjazeb filed a demand for arbitration as a class action, which is prohibited under the Mandatory Arbitration Agreement. In response to Ms. Monjazeb's demand for arbitration as a class action, the American Arbitration Association (AAA) referred the resolution of such request back to the arbitrator. We filed a motion to stay the decision of the AAA pending a ruling by the trial court; the trial court determined that the arbitration agreement was unenforceable due to a recent California case. We asserted that the trial court does not have jurisdiction to change its earlier determination of the enforceability of the arbitration agreement and have appealed the court's decision. While the appeal process has stayed most of claims in both cases, the trial court has asked the parties to address issues regarding certain civil penalty claims asserted by Ms. Tanguilig, based on Labor Code violations alleged in the compliant, in a case management conference set for November 8, 2013, We believe these claims are subject to the stay, but will provide the information requested by the court. In addition, the National Labor Relations Board ("NLRB") has issued a complaint alleging that the Mandatory Arbitration Agreement's class action prohibition violates employees' rights to engage in concerted activity, which will be submitted to the administrative law judge in the near future for determination, unless the NLRB in Washington, D.C., dismisses the matter entirely based upon our previous settlement of the issues surrounding the 2007 Arbitration Agreement with the NLRB. We will continue to vigorously defend our interests in these matters. Currently, we cannot reasonably estimate the amount of loss, if any, arising from these matters. We will continue to evaluate these matters based on subsequent events, new information and future circumstances.
We are currently involved in various other legal actions and proceedings that arose in the ordinary course of business. With respect to the matter described above as well as all other current outstanding litigation involving us, we believe that any liability arising as a result of such litigation will not have a material adverse effect on our financial position, results of operations or cash flows.
Pursuant to the requirements of the Securities Exchange Act of 1934, the registrant has duly caused this Report to be signed on its behalf by the undersigned hereunto duly authorized.
NEIMAN MARCUS GROUP LTD INC. |
||||
Date: October 7, 2013 |
||||
By: |
/s/ TRACY M. PRESTON |
|||
| Name: | Tracy M. Preston | |||
| Title: | Senior Vice President and General Counsel | |||
SUMMARY
Our Company
Our Competitive Strengths
Our Strategy
CORPORATE STRUCTURE
SOURCES AND USES
SUMMARY UNAUDITED PRO FORMA CONSOLIDATED FINANCIAL INFORMATION AND OTHER DATA
CAPITALIZATION
UNAUDITED PRO FORMA CONDENSED CONSOLIDATED FINANCIAL INFORMATION
NEIMAN MARCUS GROUP LTD INC. Unaudited Pro Forma Condensed Consolidated Balance Sheet August 3, 2013
NEIMAN MARCUS GROUP LTD INC. Notes to Unaudited Pro Forma Condensed Consolidated Balance Sheet (tables present dollars in millions)
NEIMAN MARCUS GROUP LTD INC. Unaudited Pro Forma Consolidated Statement of Operations For the Fiscal Year Ended August 3, 2013
NEIMAN MARCUS GROUP LTD INC. Notes to Unaudited Pro Forma Condensed Consolidated Statement of Operations (tables present dollars in millions)
LEGAL PROCEEDINGS
SIGNATURES