Attached files
| file | filename |
|---|---|
| 8-K - FORM 8-K - ENCORE CAPITAL GROUP INC | d598382d8k.htm |
 ENCORE CAPITAL GROUP, INC.
THE 4TH ANNUAL CREDIT SUISSE SMALL/MID
CAP CONFERENCE
September 18, 2013
Exhibit 99.1 |
 PROPRIETARY
CAUTIONARY NOTE ABOUT FORWARD-LOOKING STATEMENTS
2
The statements in this presentation that are not historical facts, including, most
importantly, those statements preceded by, or that include, the words
“will,” “may,”
“believe,”
“projects,”
“expects,”
“anticipates”
or the negation thereof, or similar
expressions, constitute “forward-looking statements”
within the meaning of the Private
Securities Litigation Reform Act of 1995 (the “Reform Act”).
These statements may
include, but are not limited to, statements regarding our future
operating results,
earnings per share, and growth.
For all “forward-looking statements,”
the Company
claims the protection of the safe harbor for forward-looking statements
contained in the Reform Act.
Such forward-looking statements involve risks, uncertainties and other
factors which may cause actual results, performance or achievements of the Company
and its subsidiaries to be materially different from any future results,
performance or achievements expressed or implied by such forward-looking
statements. These risks, uncertainties and other factors are discussed in
the reports filed by the Company with the Securities and Exchange
Commission, including the most recent reports on Forms 10-K and
10-Q, as they may be amended from time to time. The Company disclaims
any intent or obligation to update these forward-looking statements.
|
 PROPRIETARY
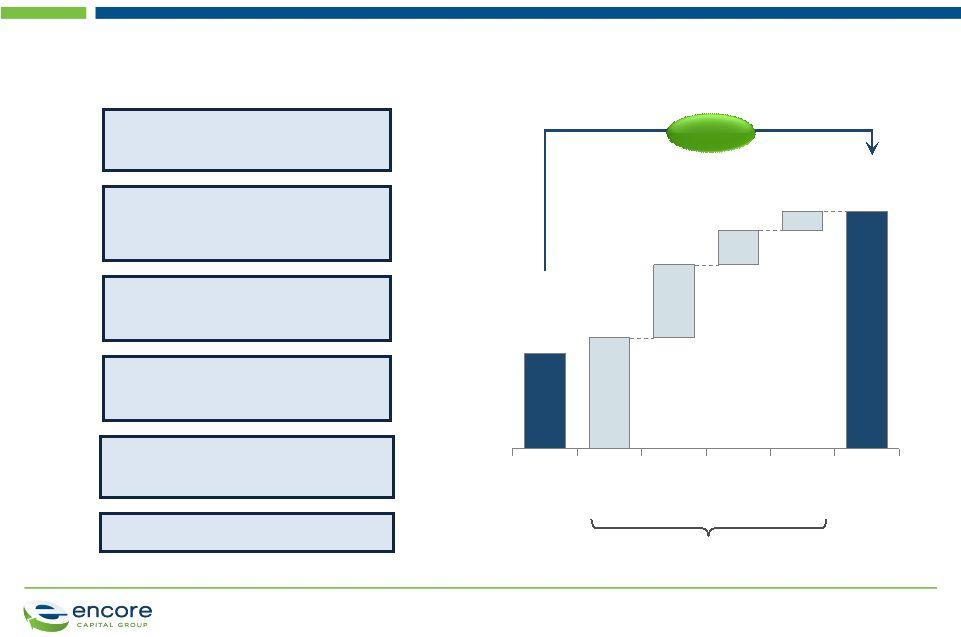
ENCORE IS A LEADING PLAYER IN THE CONSUMER DEBT BUYING
AND RECOVERY INDUSTRY
3
We deploy capital to acquire
delinquent consumer receivables...
... and generate predictable cash
flows over a multi-year time horizon
Total Cash
Collections
Portfolio
Purchase
Price
Illustrative cash collections
2-3x
Years
1-2
Years
3-4
Years
5-6
Years
7-8
1
in
7
American
consumers
have accounts with us
3.1
million
consumers
have
satisfied their obligations
$2.7
billion
in
estimated
remaining collections
27%
Adjusted
EBITDA
†
5-year
compound annual growth rate
3,530
employees
worldwide
$1
billion
collected
in
the
last
twelve months
†
Adjusted EBITDA is a non-GAAP number which the Company considers to be and
utilizes as a meaningful indicator of operating performance. See Reconciliation of Adjusted
EBITDA to GAAP Net Income at the end of this presentation.
|
 PROPRIETARY
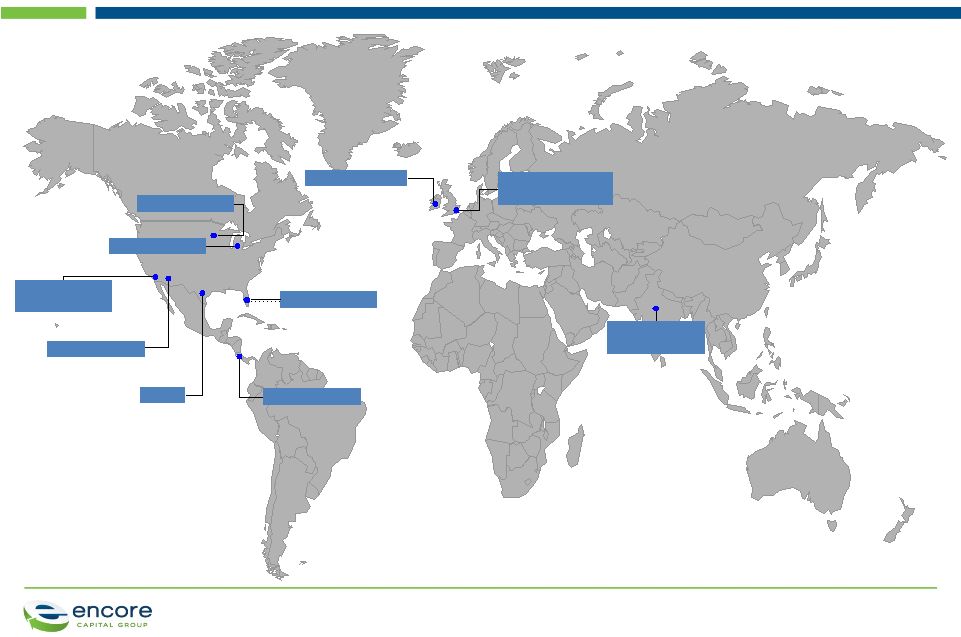
WITH A STRONG DOMESTIC AND INTERNATIONAL PRESENCE
4
St Cloud, MN
Phoenix, AZ
New Delhi, India
Call Center /
Technology Site
Call Center Site
Call Center Site
San Diego, CA
Headquarters /
Call Center Site
Call Center Site
Costa Rica
San Antonio, TX
Propel
Cabot HQ /
Call Center Sites
West Malling, UK
Stratford-upon-Avon, UK
Call Center Site
Dublin, Ireland
Tampa, FL
Call Center Site
Warren, MI
Call Center Site |
 PROPRIETARY
Contingency
collection agency
Collection
time frame
•
4-6 months
Consumer
experience
Pressure
•
Artificial deadlines
•
Multiple
exchanges of
sensitive data
•
Counterproductive
incentives
Outcome
•
Consumer is
confused and
frustrated
ENCORE PROVIDES A PRINCIPLED AND ESSENTIAL SERVICE
5
•
84 months to
recover financially
Partnership
•
Create partnership
strategy and set goals
•
Tailor solutions to
individuals
•
Single point of contact
•
Maximizes repayment
likelihood, and
ensures fair treatment
Relationship is
transactional
•
Attempt to collect during
initial delinquency cycle
•
Consumer is “charged-
off”
by issuer on day
181 of cycle
•
No longer considered a
“customer”
by creditor
Original creditor |
 PROPRIETARY
OUR BUSINESS PRINCIPLES ARE BUILT ON TREATING CONSUMERS
FAIRLY AND WITH RESPECT
6
Understanding
our consumers
•
Acknowledging limitations of our consumers’
household balance sheets to align recovery plans
•
Deploying specialized surveys to test consumer
satisfaction
Making focused
investments
•
Built specialized non-collections work groups to serve
consumer needs
•
Established Consumer Credit Research Institute to
better understand the financially stressed consumer
Improving
consumer
experience
•
Living the Consumer Bill of Rights
•
Creating resources and directing financially stressed
consumers to best external references
•
Founded Consumer Experience Council |
 PROPRIETARY
ENCORE HAS DELIVERED A TRACK RECORD OF STRONG,
SUSTAINABLE FINANCIAL RESULTS
7
1. Cost to Collect is Adjusted Operating Expenses / Dollar Collected. See
Reconciliation of Adjusted Operating Expenses to GAAP Total Operating
Expenses at the end of this presentation. 2. Adjusted EBITDA is a
non-GAAP number which the Company considers to be and utilizes as a meaningful indicator of operating performance. See Reconciliation of Adjusted EBITDA to GAAP Net
Income at the end of this presentation. 3. Per Fully Diluted Share from Continuing
Operations Note:
Growth
rate
percentages
for
Cash
Collections,
Adjusted
EBITDA,
and
EPS
signify
compounded
annual
growth
rate
from
2007
-
2012
Strong business
fundamentals...
Cash Collections ($M)
12
948
11
761
10
604
09
487
08
398
07
355
+22%
Cost to Collect
1
(%)
12
40.4
11
42.2
10
43.7
09
47.6
08
50.2
07
51.5
-1100 BPS
...driving
profitable
growth
Adjusted EBITDA
2
($M)
12
577
11
444
10
343
09
260
08
205
07
175
+27%
Earnings Per Share
3
($)
+42%
12
3.04
11
2.36
10
1.89
09
1.28
08
0.55
07
0.52 |
 PROPRIETARY
AND HAS CONTINUED TO BUILD UPON THIS PERFORMANCE WITH
STRONG RESULTS THIS YEAR
H1 2013
H1 2012
Increase/
(Decrease)
Collections
$549
$472
16%
Revenue
$301
$268
12%
Cost to collect
1
37.7%
38.9%
(120 bps)
Adjusted EBITDA
2
$352
$292
21%
Adjusted EPS
3
$1.70
$1.54
10%
8
1. Cost
to
Collect
is
Adjusted
Operating
Expenses
/
Dollar
Collected.
See
Reconciliation
of
Adjusted
Operating
Expenses
to
GAAP
Total
Operating
Expenses
at
the
end
of
this
presentation.
2.
Adjusted EBITDA is a non-GAAP number which the Company considers to be and
utilizes as a meaningful indicator of operating performance. See Reconciliation of Adjusted EBITDA to GAAP
Net Income at the end of this presentation. 3. See reconciliation of Adjusted EPS
to GAAP EPS at the end of this presentation. Year over year financial
results |
 PROPRIETARY
Estimated Remaining Collections in core receivables
ENCORE HAS RAPIDLY GAINED SCALE AND POSITIONED ITSELF
FOR SUSTAINED GROWTH
9
($M) |
 PROPRIETARY
THIS SCALE HAS BEEN CREATED BY MARKET LEADING INVESTMENTS
10
Capital deployed in core receivables |
 PROPRIETARY
ENCORE HAS DELIVERED INDUSTRY LEADING TOTAL SHAREHOLDER
RETURN OVER THE PAST 5+ YEARS
11
Total Shareholder Return (Dec. 2007-
Aug. 2013)
2%
NASDAQ
Financial 100:
30%
Encore Capital:
8%
S&P SmallCap 600:
(%)
6%
Russell 2000: |
 PROPRIETARY
New asset
classes
Bankrupt
accounts
Outsourcing
services
International
Secured
assets
Performing
assets
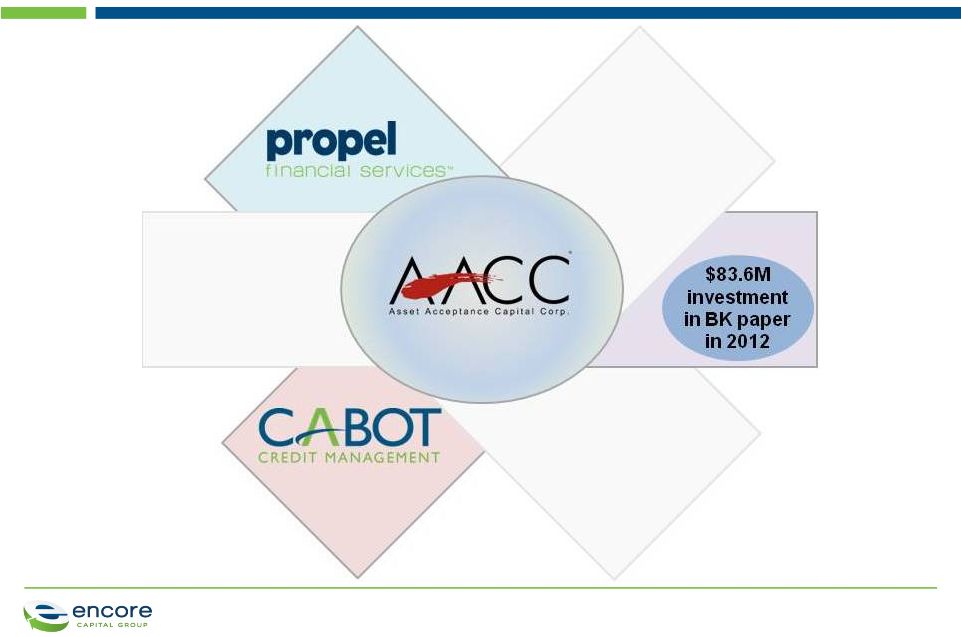
WE HAVE PURSUED DEALS AND INITIATIVES THAT ALIGN WITH
OUR CORE BUSINESS
12
Expand
geographically
Focus on
bankruptcy
Cover
different
type of debt |
 PROPRIETARY
Largely satisfies our 2013
purchasing goals with
attractive returns
13
THE ASSET ACCEPTANCE DEAL IS WELL ALIGNED WITH OUR
STRATEGY AND ADDS $1 BILLION TO OUR ERC
Allows us to be selective in
purchases for the remainder
of the year
Able to leverage best
practices across the two
platforms to drive synergies |
 PROPRIETARY
WE HAVE MADE SIGNIFICANT PROGRESS EXECUTING OUR PLANS
FOR PROPEL
14
Our plan
Existing
market
•
Working to penetrate the
80% of the Texas market
that doesn't use tax lien
transfers
1
What we've delivered
•
Developed & implemented
model for direct mailing
•
Started outbound calling
w/existing Encore facilities
New
markets
•
Lobbying to introduce
legislation in other states
that will create new markets
2
•
Successfully worked with
Nevada to pass legislation
•
Advancing legislative push
to other states
•
Purchased tax lien
certificates in three states
New
opportunities
•
Exploring alternative tax lien
models that will allow us to
expand into new markets
3 |
 PROPRIETARY
Market leader in U.K. debt management
•
Over 14 years of collections growth
•
Operations in Great Britain and Ireland
Specializes in higher balance, “semi-
performing”
(i.e., paying) accounts
•
Favorable repayment characteristics
Key statistics as of June 30, 2013:
•
£8.4B face-value of debt acquired for
£761M
•
Statutory ERC of £1,043M
•
3.8M customer accounts
•
2013 H1 collections of £81M
•
2013 H1 capital deployment of
£84M
CABOT IS THE LEADING PURCHASER OF DEBT IN THE U.K.
15
Leverage
Encore's
operations
and know-
how
•
Enhance collections by
leveraging Encore's efficient
operations, including our
operations in India
•
Leverage Encore's experience
in secondary and tertiary debt
to pursue new investments in
the U.K.
•
Leverage Encore’s favorable
financing to fund growth
Leverage
Encore's
analytics
•
Deploy Encore's superior
analytical capabilities to the
Cabot platform
•
Focus on improving account
segmentation and specialized
collection strategies |
 PROPRIETARY
WE ARE WELL POSITIONED TO MAINTAIN OUR MOMENTUM AND
CONTINUE DELIVERING TOP QUARTILE TSR
16
Management Team •
Learning Organization •
Principled Intent
Growth, Margin Expansion, Free Cash Flow, PE Multiple Expansion
Top Quartile Total Shareholder Return
•
Specialized call
centers
•
Efficient international
operations
•
Internal legal
platform
Operational Scale
& Cost Leadership
2
Strong Capital
Stewardship
3
•
Consumer
intelligence
•
Data driven,
predictive modeling
•
Portfolio valuation at
consumer level
•
Consumer Credit
Research Institute
Superior
Analytics
1
•
Uniquely scalable
platform
•
Strategic investment
opportunities in
geographic and
paper type
adjacencies
Extendable
Business Model
4 |
 PROPRIETARY
17
APPENDIX |
 PROPRIETARY
RECONCILIATION OF ADJUSTED EBITDA
Reconciliation of Adjusted EBITDA to GAAP Net Income
(Unaudited, In Thousands)
Three Months Ended
Note: The periods 3/31/07 through 12/31/08 have been adjusted to
reflect the retrospective application of ASC 470-20. All periods have been
adjusted to show discontinued ACG operations. PROPRIETARY
18 |
 PROPRIETARY
RECONCILIATION OF ADJUSTED EPS TO GAAP EPS
Six Months Ended June 30,
2013
2012
$
Per Diluted
Share
$
Per Diluted
Share
Net income from continuing operations
30,460
$1.24
37,096
$1.44
Adjustments:
Convertible notes non-cash interest and issuance
cost amortization, net of tax
1,000
$0.04
Acquisition related legal and advisory fees, net of
tax
4,980
$0.20
2,567
$0.10
Acquisition related integration and severance
costs, and consulting fees, net of tax
3,304
$0.13
Acquisition related other expenses, net of tax
2,198
$0.09
Adjusted income from continuing operations
41,942
$1.70
39,663
$1.54
19 |
 PROPRIETARY
RECONCILIATION OF ADJUSTED OPERATING EXPENSES
2007
2008
2009
2010
2011
2012
H1
2012
H1
2013
GAAP total operating expenses, as
reported
$201,849
$216,900
249,782
$269,952
$328,566
$401,696
$194,203
$232,110
Adjustments:
Ascension Operating Costs
(14,801)
(13,369)
(13,218)
Stock-based compensation
expense
(4,287)
(3,564)
(4,384)
(6,010)
(7,709)
(8,794)
(4,805)
(5,180)
Tax lien business segment
operating expenses
(5,681)
(1,513)
(6,526)
Acquisition related legal and
advisory fees
(4,263)
(4,263)
(8,224)
Acquisition related integration and
severance costs, and consulting
fees
(5,455)
Adjusted operating expenses
$182,761
$199,967
$232,180
$263,942
$320,857
$382,958
$183,622
$206,725
20
Reconciliation of Adjusted Operating Cost to GAAP Operating Expenses
(Unaudited, In Thousands) |