Attached files
| file | filename |
|---|---|
| 8-K - FORM 8-K - Atlantic Union Bankshares Corp | v353351_8k.htm |

Investor Presentation August 2013
Overview StellarOne Corporation Acquisition Financial Performance Near - Term Outlook 2

Forward - Looking Statement Certain statements in this report may constitute “forward - looking statements” within the meaning of the Private Securities Litigation Reform Act of 1995. Forward - looking statements are statements that include projections, predictions, expectations or beliefs about future events or results or otherwise and are not statements of historical fact. Such statements are often characterized by the use of qualified words (and their derivatives) such as “expect,” “believe,” “estimate,” “plan,” “project,” “anticipate” or other statements concerning opinions or judgment of the Company and its management about future events. Although the Company believes that its expectations with respect to forward - looking statements are based upon reasonable assumptions within the bounds of its existing knowledge of its business and operations, there can be no assurance that actual results, performance or achievements of the Company will not differ materially from any future results, performance or achievements expressed or implied by such forward - looking statements. Actual future results and trends may differ materially from historical results or those anticipated depending on a variety of factors, including, but not limited to, the effects of and changes in: general economic and bank industry conditions, the interest rate environment, legislative and regulatory requirements, competitive pressures, new products and delivery systems, inflation, changes in the stock and bond markets, accounting standards or interpretations of existing standards, mergers and acquisitions, technology, and consumer spending and savings habits. The Company does not update any forward - looking statements that may be made from time to time by or on behalf of the Company. 3
Company Overview One of the largest financial services organizations headquartered in Virginia Holding company formed in 1993 – Banking history in our communities goes back more than 100 years Assets of $4.1 Billion Comprehensive financial services provider offering commercial and retail banking, mortgage, investment, trust and insurance products and services 4
Union First Market’s Strengths Excellent branch network, competitive banking products and services and a loyal client base Well positioned for organic growth given commercial activity, household income levels and population growth in its footprint Strong balance sheet and solid capital base Conservative lender with improving asset quality metrics Experienced management team Successful acquirer and integrator Proven financial performance in both good and bad economic climates 5
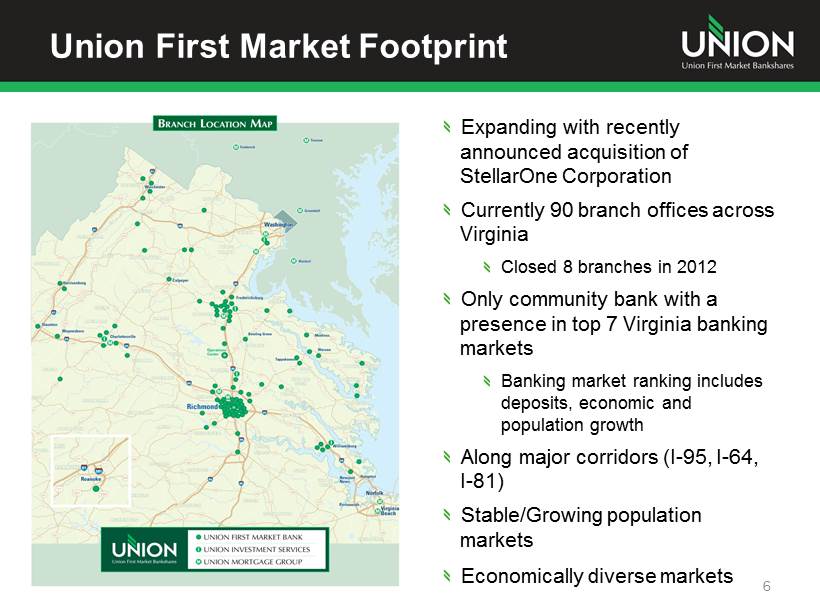
Union First Market Footprint 6 Expanding with recently announced acquisition of StellarOne Corporation Currently 90 branch offices across Virginia Closed 8 branches in 2012 Only community bank with a presence in top 7 Virginia banking markets Banking market ranking includes deposits, economic and population growth Along major corridors (I - 95, I - 64, I - 81) Stable/Growing population markets Economically diverse markets

7 Acquisition Announced on June 10, 2013 The Next Great Virginia Bank StellarOne Acquisition
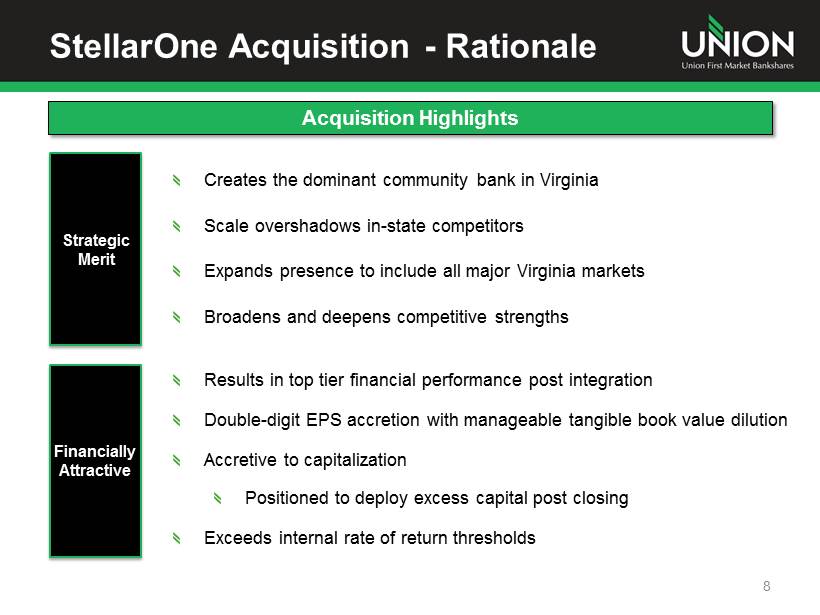
Creates the dominant community bank in Virginia Scale overshadows in - state competitors Expands presence to include all major Virginia markets Broadens and deepens competitive strengths StellarOne Acquisition - Rationale 8 Acquisition Highlights Strategic Merit Results in top tier financial performance post integration Double - digit EPS accretion with manageable tangible book value dilution Accretive to capitalization Positioned to deploy excess capital post closing Exceeds internal rate of return thresholds Financially Attractive
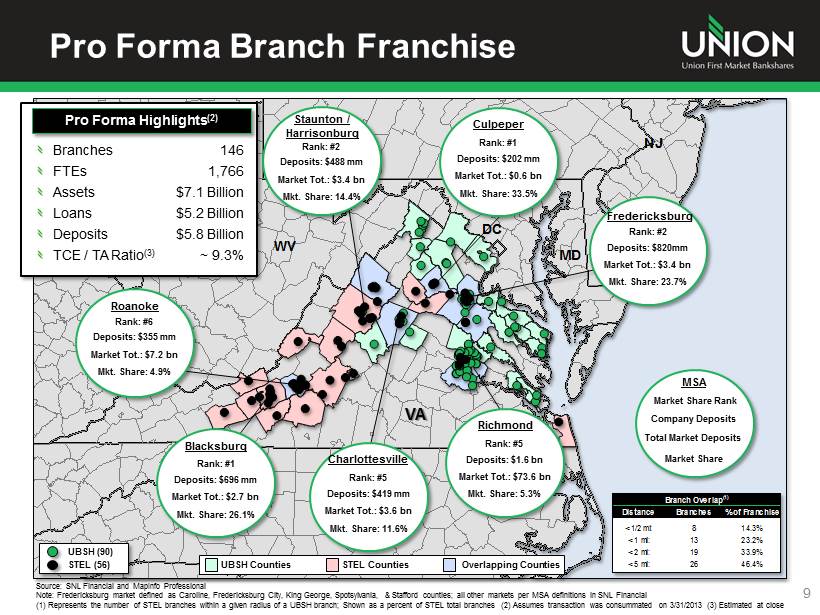
Pro Forma Branch Franchise 9 Source: SNL Financial and MapInfo Professional Note: Fredericksburg market defined as Caroline, Fredericksburg City, King George, Spotsylvania, & Stafford counties; all oth er markets per MSA definitions in SNL Financial (1) Represents the number of STEL branches within a given radius of a UBSH branch; Shown as a percent of STEL total branches (2 ) Assumes transaction was consummated on 3/31/2013 (3) Estimated at close NC DC VA AL CT DE GA IL IN KY MA MD MI MS NJ NY OH RI SC TN WV UBSH Counties STEL Counties Overlapping Counties UBSH (90) STEL (56) Richmond Rank: #5 Deposits: $1.6 bn Market Tot.: $73.6 bn Mkt. Share: 5.3% Blacksburg Rank: #1 Deposits: $696 mm Market Tot.: $2.7 bn Mkt. Share: 26.1% Staunton / Harrisonburg Rank: #2 Deposits: $488 mm Market Tot.: $3.4 bn Mkt. Share: 14.4% Branch Overlap(1) Distance Branches % of Franchise < 1/2 mi: 8 14.3% < 1 mi: 13 23.2% < 2 mi: 19 33.9% < 5 mi: 26 46.4% Culpeper Rank: #1 Deposits: $202 mm Market Tot.: $0.6 bn Mkt. Share: 33.5% MSA Market Share Rank Company Deposits Total Market Deposits Market Share Roanoke Deposits: $355 mm Market Tot.: $7.2 bn Mkt. Share: 4.9% Rank : #6 Charlottesville Rank: #5 Deposits: $419 mm Market Tot.: $3.6 bn Mkt. Share: 11.6% VA Fredericksburg Rank: #2 Deposits: $820mm Market Tot.: $3.4 bn Mkt. Share: 23.7% Pro Forma Highlights (2) Branches FTEs Assets Loans Deposits TCE / TA Ratio (3) 146 1,766 $7.1 Billion $5.2 Billion $5.8 Billion ~ 9.3%
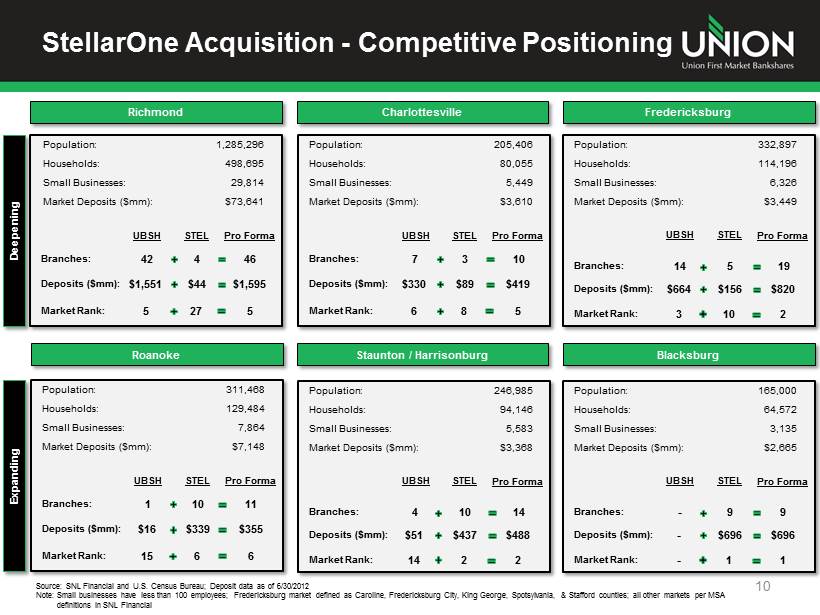
StellarOne Acquisition - Competitive Positioning 10 Richmond Charlottesville Source: SNL Financial and U.S. Census Bureau; Deposit data as of 6/30/2012 Note: Small businesses have less than 100 employees; Fredericksburg market defined as Caroline, Fredericksburg City, King Geo rge , Spotsylvania, & Stafford counties; all other markets per MSA definitions in SNL Financial Staunton / Harrisonburg Population: Households: Small Businesses: Market Deposits ($mm): UBSH Branches: Deposits ($mm): Pro Forma 42 4 46 $1,551 $44 $1,595 1,285,296 498,695 29,814 $73,641 STEL Population: Households: Small Businesses: Market Deposits ($mm): UBSH Branches: Deposits ($mm): Pro Forma 7 3 10 $330 $89 $419 205,406 80,055 5,449 $3,610 STEL Population: Households: Small Businesses: Market Deposits ($mm): UBSH Branches: Deposits ($mm): Pro Forma 4 10 14 $51 $437 $488 246,985 94,146 5,583 $3,368 STEL Market Rank: 5 27 5 Market Rank: 6 8 5 Roanoke Population: Households: Small Businesses: Market Deposits ($mm): UBSH Branches: Deposits ($mm): Pro Forma 1 10 11 $16 $339 $355 311,468 129,484 7,864 $7,148 STEL Market Rank: 15 6 6 Blacksburg Population: Households: Small Businesses: Market Deposits ($mm): UBSH Branches: Deposits ($mm): Pro Forma - 9 9 - $696 $696 165,000 64,572 3,135 $2,665 STEL Market Rank: - 1 1 Market Rank: 14 2 2 Fredericksburg Population: Households: Small Businesses: Market Deposits ($mm): UBSH Branches: Deposits ($mm): Pro Forma 14 5 19 $664 $156 $820 332,897 114,196 6,326 $3,449 STEL Market Rank: 3 10 2 Deepening Expanding
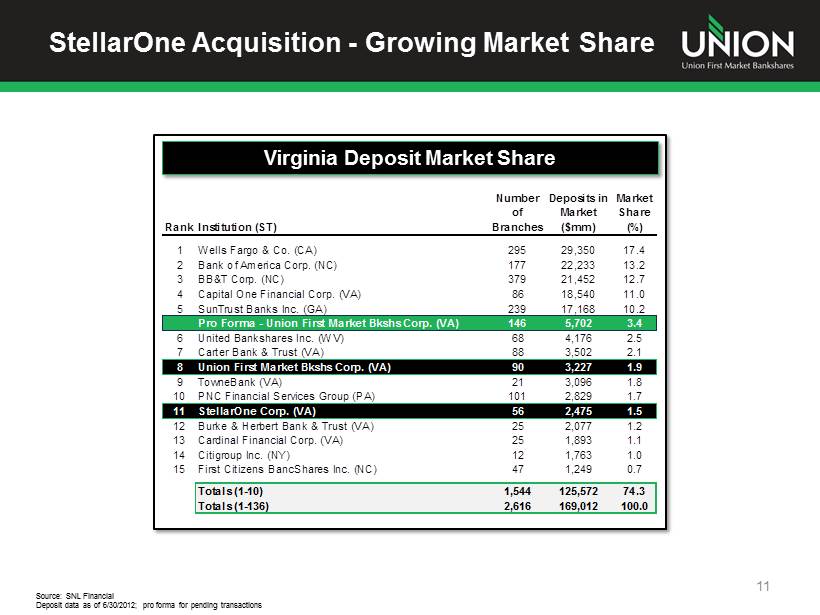
RankInstitution (ST) Number of Branches Deposits in Market ($mm) Market Share (%) 1 Wells Fargo & Co. (CA) 295 29,350 17.4 2 Bank of America Corp. (NC) 177 22,233 13.2 3 BB&T Corp. (NC) 379 21,452 12.7 4 Capital One Financial Corp. (VA) 86 18,540 11.0 5 SunTrust Banks Inc. (GA) 239 17,168 10.2 Pro Forma - Union First Market Bkshs Corp. (VA) 146 5,702 3.4 6 United Bankshares Inc. (WV) 68 4,176 2.5 7 Carter Bank & Trust (VA) 88 3,502 2.1 8 Union First Market Bkshs Corp. (VA) 90 3,227 1.9 9 TowneBank (VA) 21 3,096 1.8 10 PNC Financial Services Group (PA) 101 2,829 1.7 11 StellarOne Corp. (VA) 56 2,475 1.5 12 Burke & Herbert Bank & Trust (VA) 25 2,077 1.2 13 Cardinal Financial Corp. (VA) 25 1,893 1.1 14 Citigroup Inc. (NY) 12 1,763 1.0 15 First Citizens BancShares Inc. (NC) 47 1,249 0.7 Totals (1-10) 1,544 125,572 74.3 Totals (1-136) 2,616 169,012 100.0 StellarOne Acquisition - Growing Market Share 11 Virginia Deposit Market Share Source: SNL Financial Deposit data as of 6/30/2012; pro forma for pending transactions

StellarOne Acquisition - Integration Update Merger Steering Committee formed and integration teams established Focused on building organizational structure to manage and grow a $7 billion bank StellarOne EVP, CFO Jeff Farrar will join Union after close as EVP for Wealth Management, Insurance and Mortgage StellarOne Chief Risk Officer David Bilko will become Chief Risk Officer for Union Form S - 4 filed with the SEC on August 15 Remain on track to close on January 1, 2014 12
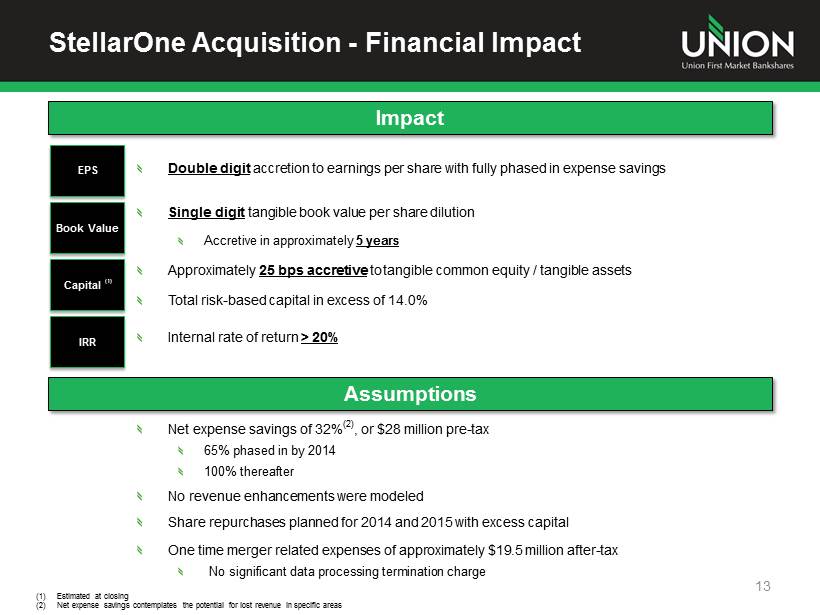
StellarOne Acquisition - Financial Impact 13 Impact Assumptions Net expense savings of 32% (2) , or $28 million pre - tax 65% phased in by 2014 100% thereafter No revenue enhancements were modeled Share repurchases planned for 2014 and 2015 with excess capital One time merger related expenses of approximately $19.5 million after - tax No significant data processing termination charge (1) Estimated at closing (2) Net expense savings contemplates the potential for lost revenue in specific areas EPS Book Value Capital (1) IRR Double digit accretion to earnings per share with fully phased in expense savings Single digit tangible book value per share dilution Accretive in approximately 5 years Approximately 25 bps accretive to tangible common equity / tangible assets Total risk - based capital in excess of 14.0% Internal rate of return > 20%
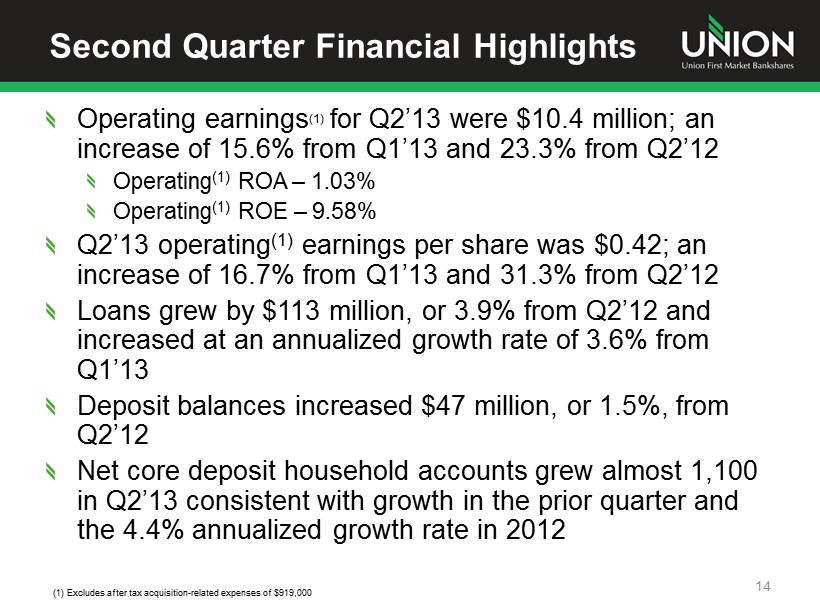
Second Quarter Financial Highlights Operating earnings (1) for Q2’13 were $10.4 million; an increase of 15.6% from Q1’13 and 23.3% from Q2’12 Operating (1) ROA – 1.03% Operating (1) ROE – 9.58% Q2’13 operating (1) earnings per share was $0.42; an increase of 16.7% from Q1’13 and 31.3% from Q2’12 Loans grew by $113 million, or 3.9% from Q2’12 and increased at an annualized growth rate of 3.6% from Q1’13 Deposit balances increased $47 million, or 1.5%, from Q2’12 Net core deposit household accounts grew almost 1,100 in Q2’13 consistent with growth in the prior quarter and the 4.4% annualized growth rate in 2012 14 (1) Excludes after tax acquisition - related expenses of $919,000
Second Quarter Financial Highlights Asset Quality continued to improve as Q2’13 net charge - offs were at a four year low and nonperforming assets declined by 17.1% from Q2’12 to $62 million Current quarterly dividend payable on August 30 th was increased to $.14 cents per share – a 40% increase over the prior year 15
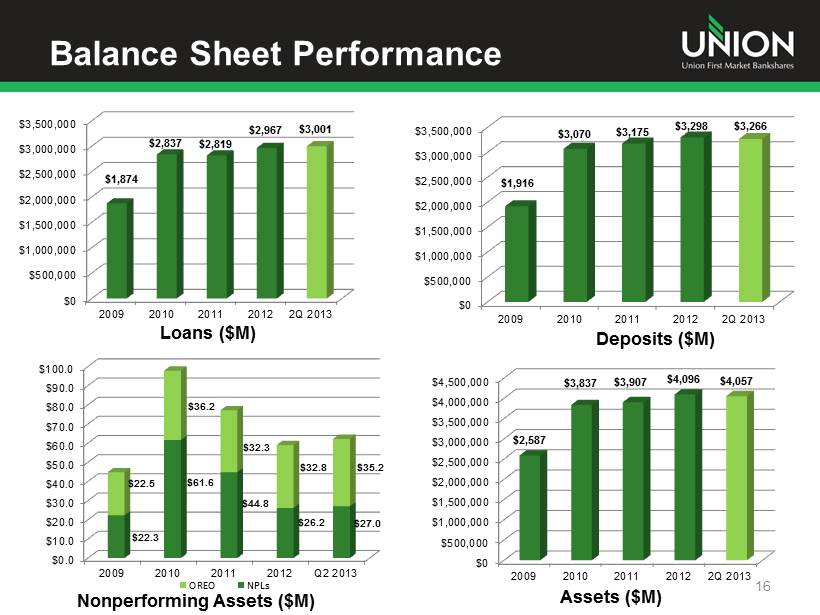
$0 $500,000 $1,000,000 $1,500,000 $2,000,000 $2,500,000 $3,000,000 $3,500,000 $4,000,000 $4,500,000 2009 2010 2011 2012 2Q 2013 $ 2,587 $ 3,837 $ 3,907 $ 4,096 $ 4,057 Balance Sheet Performance 16 Assets ($M) Deposits ($M) Loans ($M) $0 $500,000 $1,000,000 $1,500,000 $2,000,000 $2,500,000 $3,000,000 $3,500,000 2009 2010 2011 2012 2Q 2013 $ 1,874 $ 2,837 $ 2,819 $ 2,967 $ 3,001 $0 $500,000 $1,000,000 $1,500,000 $2,000,000 $2,500,000 $3,000,000 $3,500,000 2009 2010 2011 2012 2Q 2013 $ 1,916 $ 3,070 $ 3,175 $ 3,298 $ 3,266 Nonperforming Assets ($M) $0.0 $10.0 $20.0 $30.0 $40.0 $50.0 $60.0 $70.0 $80.0 $90.0 $100.0 2009 2010 2011 2012 Q2 2013 $22.3 $61.6 $44.8 $26.2 $27.0 $22.5 $36.2 $32.3 $32.8 $35.2 OREO NPLs
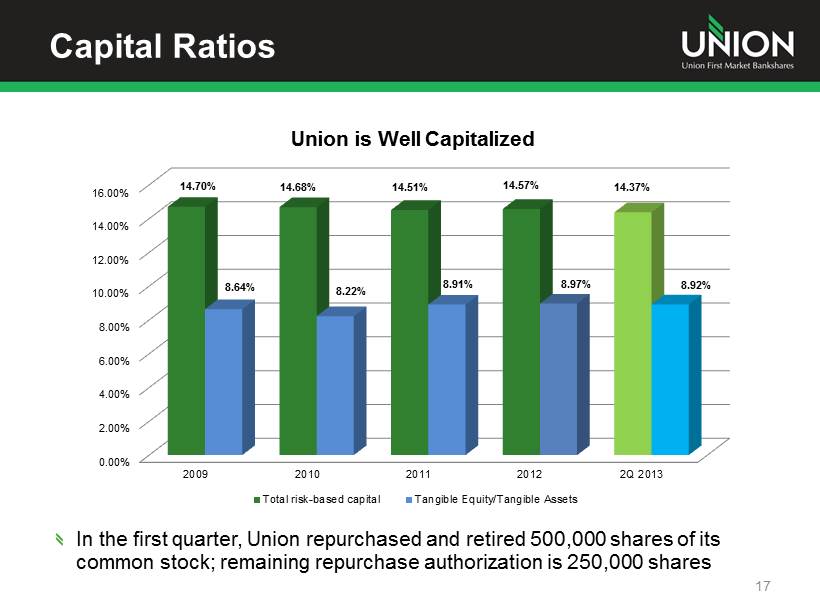
Capital Ratios 17 In the first quarter, Union repurchased and retired 500,000 shares of its common stock; remaining repurchase authorization is 250,000 shares 0.00% 2.00% 4.00% 6.00% 8.00% 10.00% 12.00% 14.00% 16.00% 2009 2010 2011 2012 2Q 2013 14.70% 14.68% 14.51% 14.57% 14.37% 8.64% 8.22% 8.91% 8.97% 8.92% Union is Well Capitalized Total risk-based capital Tangible Equity/Tangible Assets
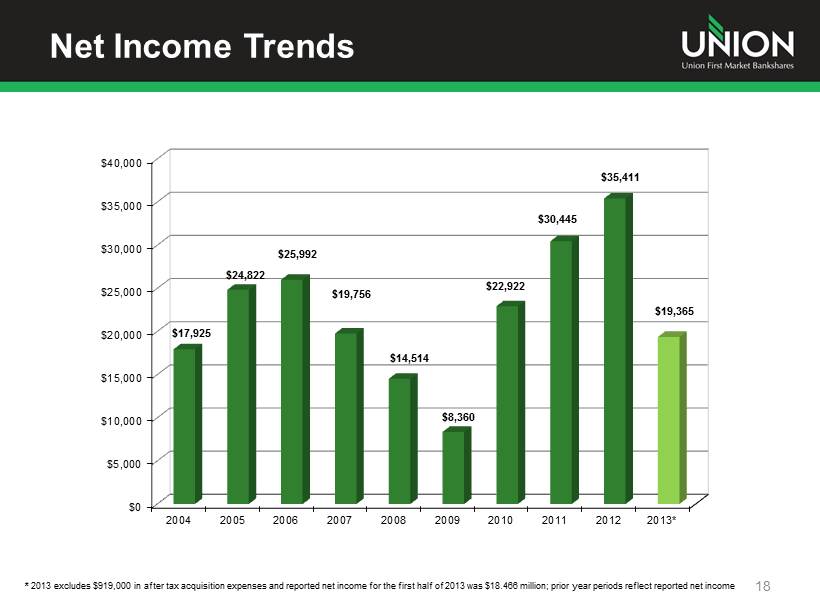
Net Income Trends 18 $0 $5,000 $10,000 $15,000 $20,000 $25,000 $30,000 $35,000 $40,000 2004 2005 2006 2007 2008 2009 2010 2011 2012 2013* $17,925 $24,822 $25,992 $19,756 $14,514 $8,360 $22,922 $30,445 $35,411 $19,365 * 2013 excludes $919,000 in after tax acquisition expenses and reported net income for the first half of 2013 was $18.466 milli on ; prior year periods reflect reported net income
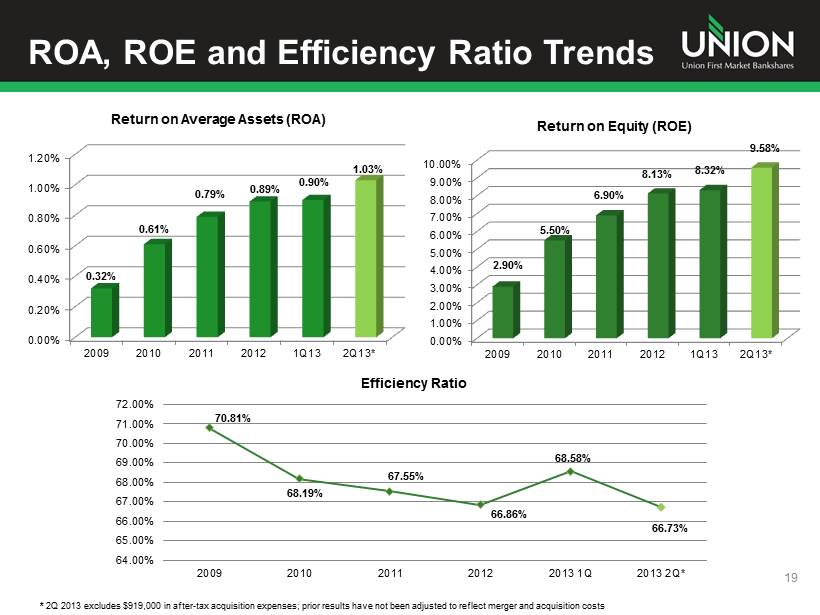
ROA, ROE and Efficiency Ratio Trends 19 0.00% 0.20% 0.40% 0.60% 0.80% 1.00% 1.20% 2009 2010 2011 2012 1Q13 2Q13* 0.32% 0.61% 0.79% 0.89% 0.90% 1.03% Return on Average Assets (ROA) 0.00% 1.00% 2.00% 3.00% 4.00% 5.00% 6.00% 7.00% 8.00% 9.00% 10.00% 2009 2010 2011 2012 1Q13 2Q13* 2.90% 5.50% 6.90% 8.13% 8.32% 9.58% Return on Equity (ROE) 70.81% 68.19% 67.55% 66.86% 68.58% 66.73% 64.00% 65.00% 66.00% 67.00% 68.00% 69.00% 70.00% 71.00% 72.00% 2009 2010 2011 2012 2013 1Q 2013 2Q* Efficiency Ratio * 2Q 2013 excludes $919,000 in after - tax acquisition expenses; prior results have not been adjusted to reflect merger and acquisi tion costs
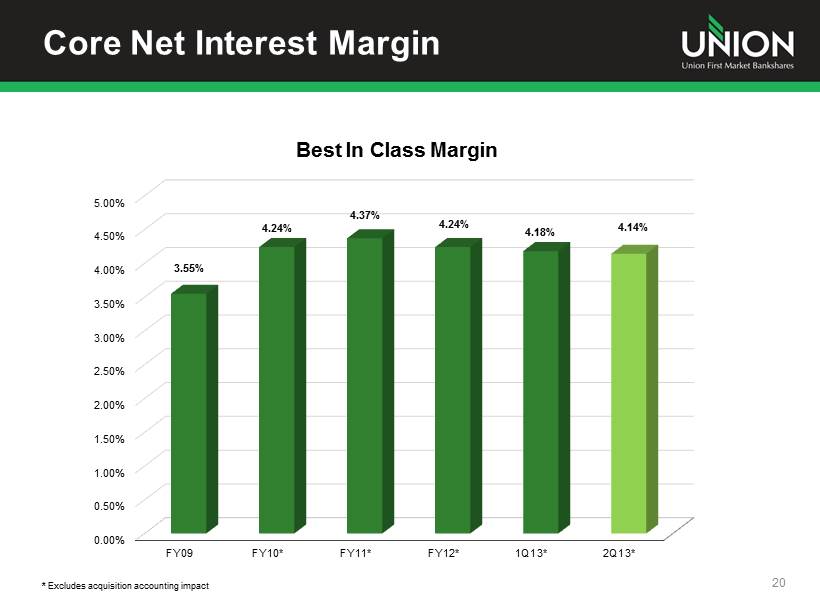
Core Net Interest Margin 20 * Excludes acquisition accounting impact 0.00% 0.50% 1.00% 1.50% 2.00% 2.50% 3.00% 3.50% 4.00% 4.50% 5.00% FY09 FY10* FY11* FY12* 1Q13* 2Q13* 3.55% 4.24% 4.37% 4.24% 4.18% 4.14% Best In Class Margin
Mortgage Segment Union Mortgage Group’s net income of $294,000 in the quarter declined year over year but increased on a linked quarter basis Q2’13 originations increased by $30 million to $298 million from Q1’13, and $41 million or 16% from Q2’12 Refinance versus Purchase volume was 38% to 62% for Q2’13 UMG is implementing a new loan origination system that will enhance and automate current end to end processes, increase productivity, provide efficiencies and improve information flow for decision - making UMG is relocating headquarters from Northern Virginia to Richmond 21
Top - Tier Financial Performance Focus Union is committed to achieving top tier financial performance and providing our shareholders with above average returns on their investment In 2012, Union developed key financial performance metrics benchmarked against top quartile peers Minimum targets were set for ROA (>1%), ROE (>10%) and efficiency ratio (<65%) StellarOne acquisition will accelerate the achievement of top tier financial metrics 22
2013 Second Half Outlook Stable to growing economy in footprint Low mid - single digit loan growth Modest margin compression Continued asset quality improvement Improving ROA, ROE and Efficiency Ratio Focus on integration of StellarOne 23
Value Proposition Expanding franchise through StellarOne acquisition Branch footprint is a competitive advantage and brings a unique franchise value Strong balance sheet and capital base Best in class net interest margin Experienced management team Successful acquirer and integrator Commitment to top tier financial performance Focused on shareholder returns 24

THANK YOU!
Additional Information Additional Information and Where to Find It In connection with the proposed merger, Union will file with the Securities and Exchange Commission (the “SEC”) a registration statement on Form S - 4 to register the shares of Union common stock to be issued to the stockholders of StellarOne . The registration statement will include a joint proxy statement/prospectus which will be sent to the stockholders of Union and StellarOne seeking their approval of the merger and related matters . In addition, each of Union and StellarOne may file other relevant documents concerning the proposed merger with the SEC . Investors and stockholders of both companies are urged to read the registration statement on Form S - 4 and the joint proxy statement/prospectus included within the registration statement and any other relevant documents to be filed with the SEC in connection with the proposed merger because they will contain important information about Union, StellarOne and the proposed transaction . Investors and stockholders may obtain free copies of these documents through the website maintained by the SEC at www . sec . gov . Free copies of the joint proxy statement/prospectus also may be obtained by directing a request by telephone or mail to Union First Market Bankshares Corporation, 1051 East Cary Street, Suite 1200 , Richmond, Virginia 23219 , Attention : Investor Relations (telephone : ( 804 ) 633 - 5031 ), or StellarOne Corporation, 590 Peter Jefferson Pkwy, Suite 250 , Charlottesville, Virginia 22911 , Attention : Investor Relations (telephone : ( 434 ) 964 - 2217 ), or by accessing Union’s website at www . bankatunion . com under “Investor Relations” or StellarOne’s website at www . stellarone . com under “Investor Relations . ” The information on Union’s and StellarOne’s websites is not, and shall not be deemed to be, a part of this presentation or incorporated into other filings either company makes with the SEC . Union and StellarOne and their respective directors and executive officers may be deemed to be participants in the solicitation of proxies from the stockholders of Union and/or StellarOne in connection with the merger . Information about the directors and executive officers of Union is set forth in the proxy statement for Union’s 2013 annual meeting of stockholders filed with the SEC on April 23 , 2013 . Information about the directors and executive officers of StellarOne is set forth in the proxy statement for StellarOne’s 2013 annual meeting of stockholders filed with the SEC on April 9 , 2013 . Additional information regarding the interests of these participants and other persons who may be deemed participants in the merger may be obtained by reading the joint proxy statement/prospectus regarding the merger when it becomes available . 26
APPENDIX
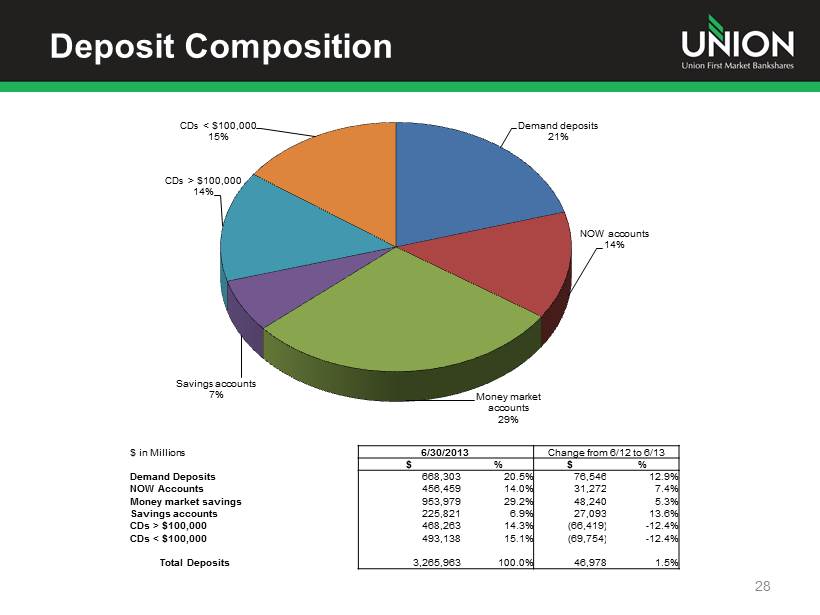
Deposit Composition 28 $ in Millions 6/30/2013 Change from 6/12 to 6/13 $ % $ % Demand Deposits 668,303 20.5% 76,546 12.9% NOW Accounts 456,459 14.0% 31,272 7.4% Money market savings 953,979 29.2% 48,240 5.3% Savings accounts 225,821 6.9% 27,093 13.6% CDs > $100,000 468,263 14.3% (66,419) - 12.4% CDs < $100,000 493,138 15.1% (69,754) - 12.4% Total Deposits 3,265,963 100.0% 46,978 1.5% Demand deposits 21% NOW accounts 14% Money market accounts 29% Savings accounts 7% CDs > $100,000 14% CDs < $100,000 15%
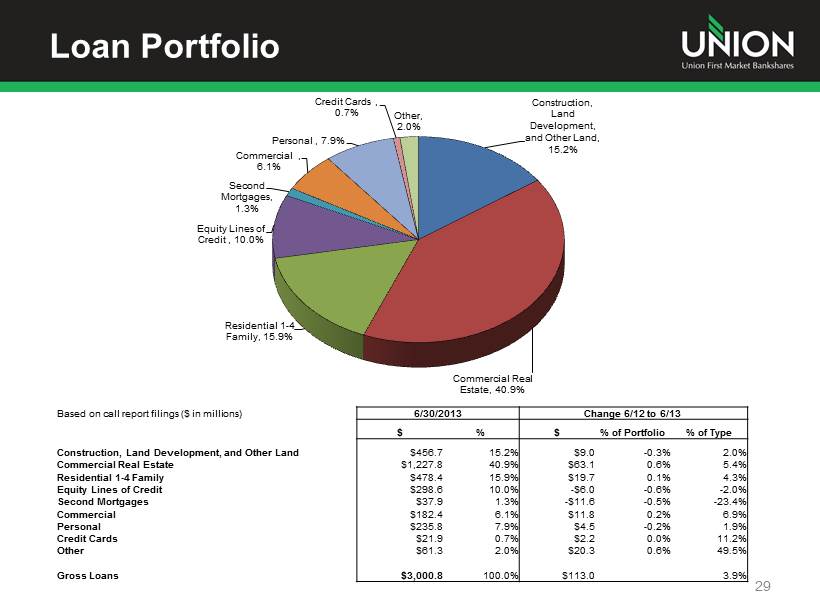
Loan Portfolio 29 Construction, Land Development, and Other Land, 15.2% Commercial Real Estate, 40.9% Residential 1 - 4 Family, 15.9% Equity Lines of Credit , 10.0% Second Mortgages, 1.3% Commercial , 6.1% Personal , 7.9% Credit Cards , 0.7% Other, 2.0% Based on call report filings ($ in millions) 6/30/2013 Change 6/12 to 6/13 $ % $ % of Portfolio % of Type Construction, Land Development, and Other Land $456.7 15.2% $9.0 - 0.3% 2.0% Commercial Real Estate $1,227.8 40.9% $63.1 0.6% 5.4% Residential 1 - 4 Family $478.4 15.9% $19.7 0.1% 4.3% Equity Lines of Credit $298.6 10.0% - $6.0 - 0.6% - 2.0% Second Mortgages $37.9 1.3% - $11.6 - 0.5% - 23.4% Commercial $182.4 6.1% $11.8 0.2% 6.9% Personal $235.8 7.9% $4.5 - 0.2% 1.9% Credit Cards $21.9 0.7% $2.2 0.0% 11.2% Other $61.3 2.0% $20.3 0.6% 49.5% Gross Loans $3,000.8 100.0% $113.0 3.9%
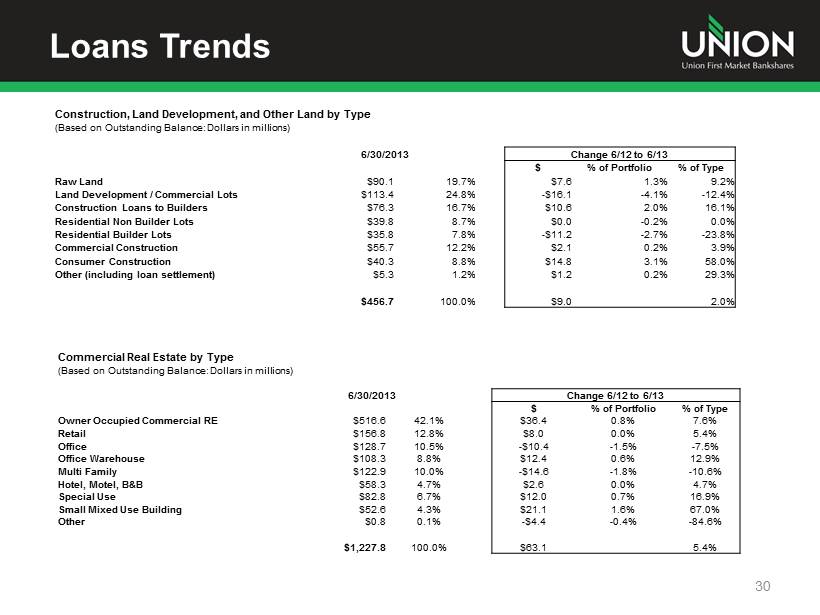
Loans Trends 30 Construction, Land Development, and Other Land by Type (Based on Outstanding Balance: Dollars in millions) 6/30/2013 Change 6/12 to 6/13 $ % of Portfolio % of Type Raw Land $90.1 19.7% $7.6 1.3% 9.2% Land Development / Commercial Lots $113.4 24.8% - $16.1 - 4.1% - 12.4% Construction Loans to Builders $76.3 16.7% $10.6 2.0% 16.1% Residential Non Builder Lots $39.8 8.7% $0.0 - 0.2% 0.0% Residential Builder Lots $35.8 7.8% - $11.2 - 2.7% - 23.8% Commercial Construction $55.7 12.2% $2.1 0.2% 3.9% Consumer Construction $40.3 8.8% $14.8 3.1% 58.0% Other (including loan settlement) $5.3 1.2% $1.2 0.2% 29.3% $456.7 100.0% $9.0 2.0% Commercial Real Estate by Type (Based on Outstanding Balance: Dollars in millions) 6/30/2013 Change 6/12 to 6/13 $ % of Portfolio % of Type Owner Occupied Commercial RE $516.6 42.1% $36.4 0.8% 7.6% Retail $156.8 12.8% $8.0 0.0% 5.4% Office $128.7 10.5% - $10.4 - 1.5% - 7.5% Office Warehouse $108.3 8.8% $12.4 0.6% 12.9% Multi Family $122.9 10.0% - $14.6 - 1.8% - 10.6% Hotel, Motel, B&B $58.3 4.7% $2.6 0.0% 4.7% Special Use $82.8 6.7% $12.0 0.7% 16.9% Small Mixed Use Building $52.6 4.3% $21.1 1.6% 67.0% Other $0.8 0.1% - $4.4 - 0.4% - 84.6% $1,227.8 100.0% $63.1 5.4%
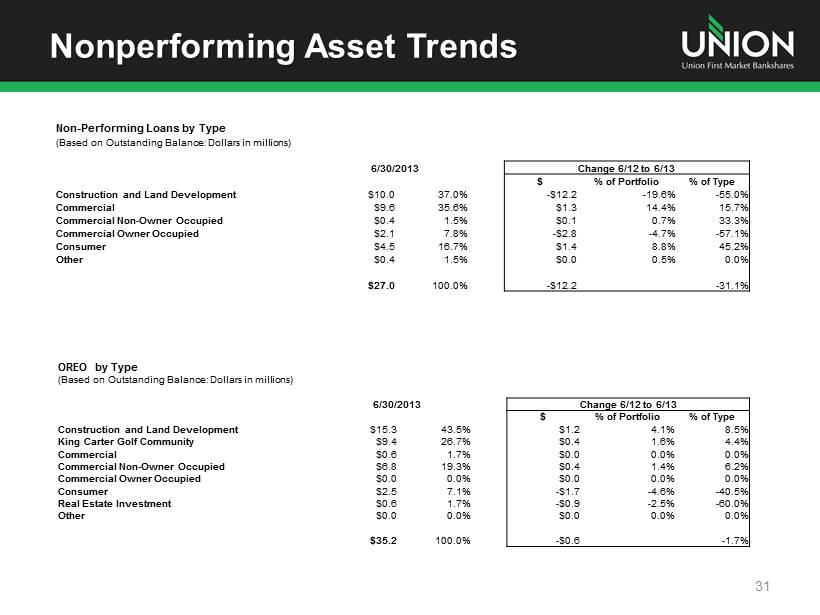
Nonperforming Asset Trends 31 Non - Performing Loans by Type (Based on Outstanding Balance: Dollars in millions) 6/30/2013 Change 6/12 to 6/13 $ % of Portfolio % of Type Construction and Land Development $10.0 37.0% - $12.2 - 19.6% - 55.0% Commercial $9.6 35.6% $1.3 14.4% 15.7% Commercial Non - Owner Occupied $0.4 1.5% $0.1 0.7% 33.3% Commercial Owner Occupied $2.1 7.8% - $2.8 - 4.7% - 57.1% Consumer $4.5 16.7% $1.4 8.8% 45.2% Other $0.4 1.5% $0.0 0.5% 0.0% $27.0 100.0% - $12.2 - 31.1% OREO by Type (Based on Outstanding Balance: Dollars in millions) 6/30/2013 Change 6/12 to 6/13 $ % of Portfolio % of Type Construction and Land Development $15.3 43.5% $1.2 4.1% 8.5% King Carter Golf Community $9.4 26.7% $0.4 1.6% 4.4% Commercial $0.6 1.7% $0.0 0.0% 0.0% Commercial Non - Owner Occupied $6.8 19.3% $0.4 1.4% 6.2% Commercial Owner Occupied $0.0 0.0% $0.0 0.0% 0.0% Consumer $2.5 7.1% - $1.7 - 4.6% - 40.5% Real Estate Investment $0.6 1.7% - $0.9 - 2.5% - 60.0% Other $0.0 0.0% $0.0 0.0% 0.0% $35.2 100.0% - $0.6 - 1.7%