Attached files
| file | filename |
|---|---|
| 8-K - 8-K - SCANSOURCE, INC. | a2013-q4form8xk.htm |
| EX-99.1 - EARNINGS RELEASE - SCANSOURCE, INC. | a2013-q4exhibit991.htm |
Q4 FY 2013 FINANCIAL RESULTS CONFERENCE CALL August 22, 2013 at 5:00 pm ET Exhibit 99.2
Safe Harbor This presentation may contain certain comments, which are “forward-looking” statements that involve plans, strategies, economic performance and trends, projections, expectations, or beliefs about future events and other statements that are not descriptions of historical facts, may be forward-looking statements within the meaning of the Private Securities Litigation Reform Act of 1995, Section 27A of the Securities Act of 1933 and Section 21E of the Securities Exchange Act of 1934. Forward-looking information is inherently subject to risks and uncertainties; these statements are subject to the safe harbor created by the Private Securities Litigation Reform Act of 1995. Any number of factors could cause actual results to differ materially from anticipated results. For more information concerning factors that could cause actual results to differ from anticipated results, see the “Risk Factors” included in the Company’s prior Forms 10-Q and annual report on Form 10-K for the fiscal year ended June 30, 2012 filed with the Securities and Exchange Commission (“SEC”). Although ScanSource believes the expectations reflected in its forward-looking statements are reasonable, it cannot guarantee future results, levels of activity, performance or achievements. ScanSource disclaims any intentions or obligation to update or revise any forward-looking statements, whether as a result of new information, future events, or otherwise, except as may be required by law. In addition to disclosing results that are determined in accordance with United States Generally Accepted Accounting Principles (“GAAP”), the Company also discloses certain non-GAAP measures, including adjusted net income and adjusted diluted EPS, return on invested capital (“ROIC”) and the percentage change in net sales excluding the impact of foreign currency exchange rates. A reconciliation of the Company's non-GAAP financial information to GAAP financial information is provided in the Company’s Form 8-K, filed with the SEC, with the quarterly earnings press release for the period indicated. 2

Highlights – Q4 FY13 • Fourth quarter 2013 net sales of $713 million, below our expected range – Lack of big deals in our POS & Barcode business – Weaker-than-planned sales from ScanSource Catalyst • Record sales quarters for North America Communications, Security, and Mexico – Second highest sales quarter in Brazil, in local currency, since 2011 acquisition • Reduced inventory and best quarter all year for inventory turns • Fourth quarter return on invested capital of 17.2% adjusted for impairment charges • New management structure to enhance worldwide technology markets focus and growth strategy • Fourth quarter 2013 non-cash impairment charges for ERP project and goodwill 3

New Segments Enhance Technology Focus 4 Worldwide Barcode and Security Segment Worldwide Communications and Services Segment President: Buck Baker Technologies: POS and Barcode Physical Security Business Units: President: Mike Ferney Technologies: Communications Services Business Units:

Q4 FY13 Non-Cash Impairment Charges Operating Income Net Income Diluted EPS GAAP measure $(20.4) $(13.3) $(0.48) Adjustments: Impairment charges – ERP* 28.2 18.0 0.64 Impairment charges – goodwill* 20.6 15.2 0.54 Non-GAAP measure* $28.4 $19.9 $0.71 % of net sales 3.98% In millions, except EPS * Diluted EPS calculated using 28.1 million weighted average diluted shares outstanding. 5

Income Statement Highlights Q4 FY13 GAAP Non-GAAP* Q4 FY12 Net sales $712.7 $712.7 $754.5 Gross margin % (of net sales) 10.6% 10.6% 9.8% SG&A expenses 46.8 46.8 46.6 Impairment charges 48.8 -- -- Change in FV of contingent consideration 0.4 0.4 (1.1) Operating income (20.4) 28.4 28.3 Operating income % (of net sales) (2.86)% 3.98% 3.75% Net income (loss) $(13.3) $19.9 $19.8 Diluted EPS $(0.48) $0.71 $0.71 In millions, except EPS * Excluding impairment changes; see preceding slide for reconciliation of GAAP to non-GAAP measures. 6

Q4 FY13 Sales Mix By Segment By Geography Q4 FY13 Net Sales: $712.7 million Q4 FY13 Net Sales: $712.7 million 74% North America* Barcode & Security = Worldwide Barcode and Security Communications & Services = Worldwide Communications and Services As a % of net sales * Includes the United States and Canada 62% Barcode & Security 75% North America* 25% International 38% Communications & Services 7

$454 $445 4Q FY12 4Q FY13 WW Barcode & Security Segment Net Sales, $ in millions Down (2.1%) Excluding FX, Down (2.0%) Q4 FY13 Q4 FY12 Gross profit $43.3 $42.6 Gross margin 9.7% 9.4% Operating income (loss) $(1.7) $17.2 Impairment charge - goodwill 15.1 -- Adjusted operating income $13.5 $17.2 Operating income % 3.0% 3.8% $ in millions 8

$1,837 $1,828 FY12 FY13 WW Barcode & Security Segment Net Sales, $ in millions Down (0.5%) Excluding FX, Up 1.4% FY13 FY12 Gross profit $168.1 $169.1 Gross margin 9.2% 9.2% Operating income (loss) $34.7 $56.7 Impairment charge - goodwill 15.1 -- Adjusted operating income $49.8 $56.7 Operating income % 2.7% 3.1% $ in millions 9
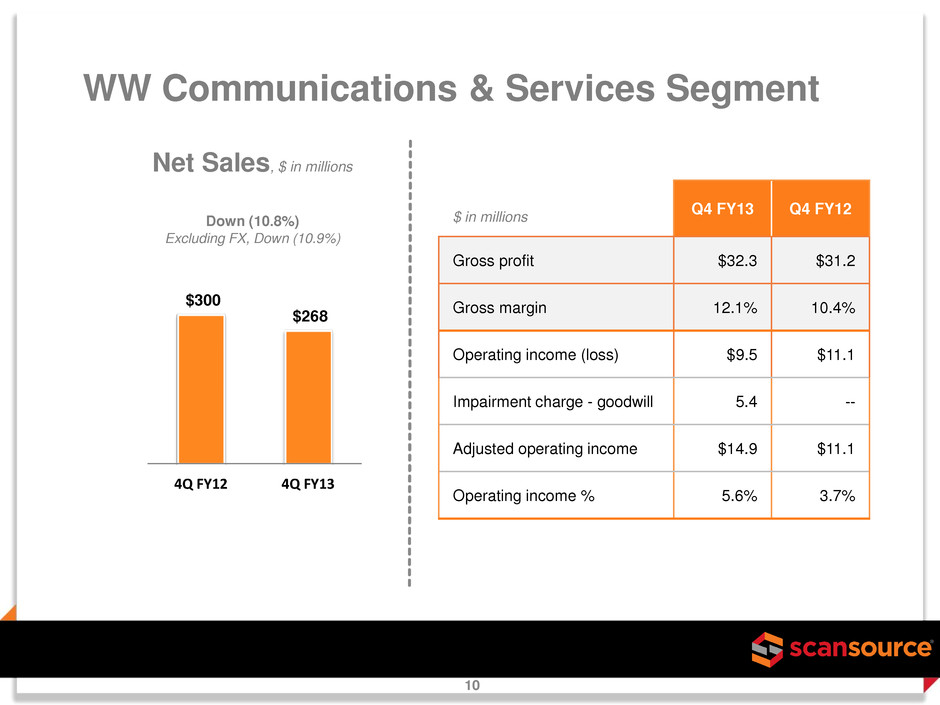
$300 $268 4Q FY12 4Q FY13 WW Communications & Services Segment Q4 FY13 Q4 FY12 Gross profit $32.3 $31.2 Gross margin 12.1% 10.4% Operating income (loss) $9.5 $11.1 Impairment charge - goodwill 5.4 -- Adjusted operating income $14.9 $11.1 Operating income % 5.6% 3.7% $ in millions Net Sales, $ in millions Down (10.8%) Excluding FX, Down (10.9%) 10
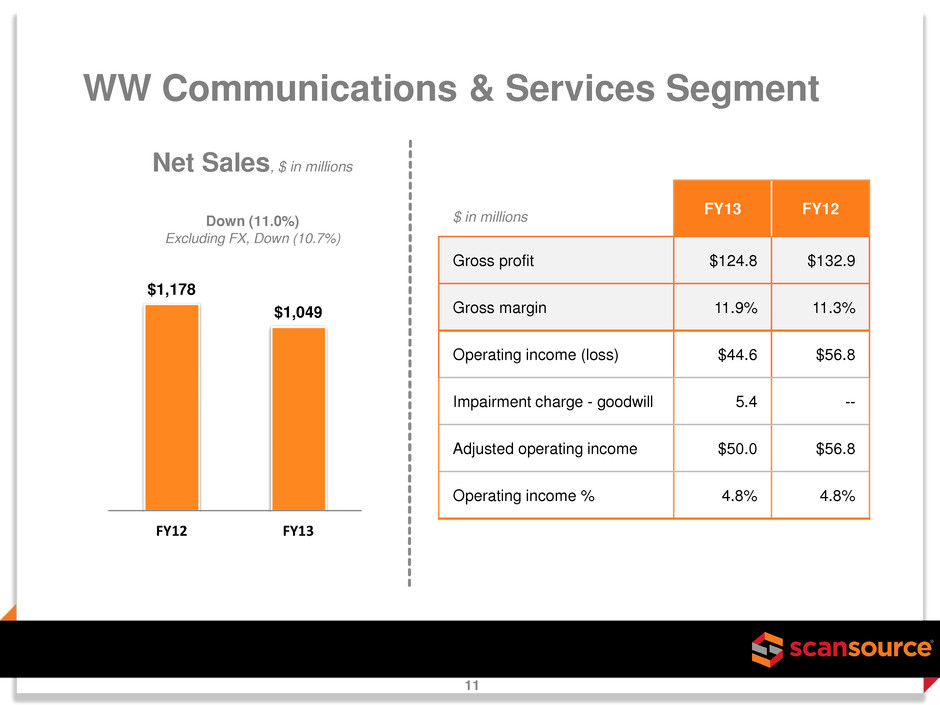
$1,178 $1,049 FY12 FY13 WW Communications & Services Segment FY13 FY12 Gross profit $124.8 $132.9 Gross margin 11.9% 11.3% Operating income (loss) $44.6 $56.8 Impairment charge - goodwill 5.4 -- Adjusted operating income $50.0 $56.8 Operating income % 4.8% 4.8% $ in millions Net Sales, $ in millions Down (11.0%) Excluding FX, Down (10.7%) 11

Q4 FY13 Key Measures Q4 FY13 Q3 FY13 Q4 FY12 Return on invested capital (“ROIC”)* 17.2% 13.3% 18.1% Cash and cash equivalents (Q/E) $148.2 $93.9 $29.2 Operating cash flow $53.4 $86.0 $34.9 Days sales outstanding in receivables 55 55 55 Inventory (Q/E) $402.3 $418.0 $487.9 Inventory turns 6.2 5.4 5.4 Paid for inventory days 5.7 13.5 9.0 * See Appendix for calculation of ROIC, a non-GAAP measure. $ in millions 12

$454 $445 4Q FY12 4Q FY13 WW Barcode & Security Highlights Net Sales, $ in millions Down (2.1%) Excluding FX, Down (2.0%) • 62% of overall sales • POS & Barcode in North America and Europe declined year-over-year – Lack of big deals – More aggressive competitive landscape • Second highest sales quarter in Brazil, in local currency, since 2011 acquisition • Latin America sales varied country-by- country – Record sales quarter in Mexico – Difficulties in Venezuela and Argentina, including scarcity of U.S. dollars for payments • Record sales quarter for Security – Driven by Cisco physical security business and a record networking quarter 13
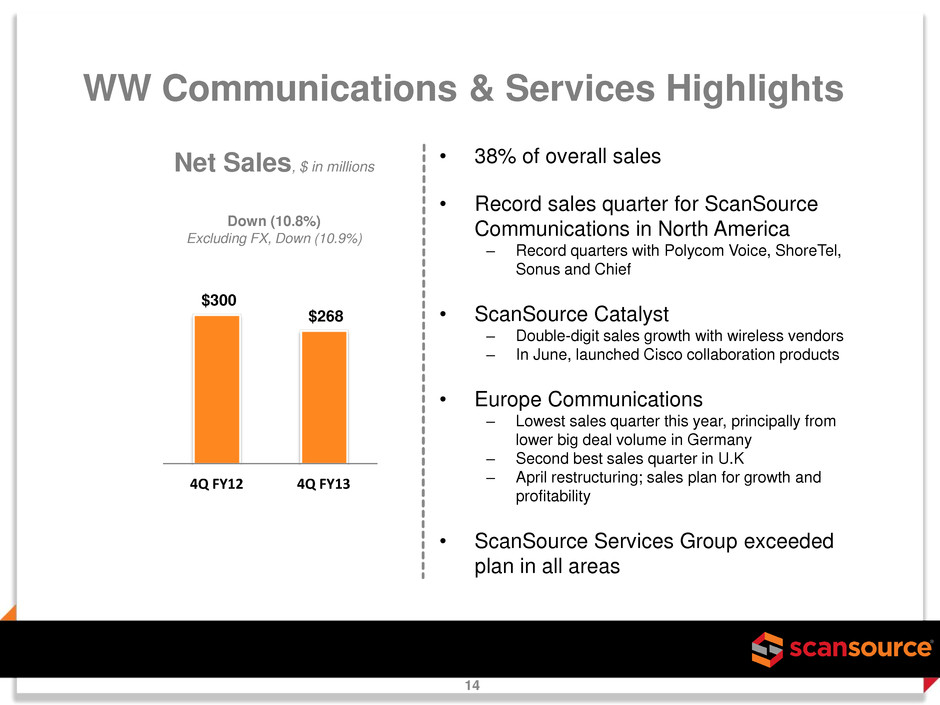
$300 $268 4Q FY12 4Q FY13 WW Communications & Services Highlights Net Sales, $ in millions Down (10.8%) Excluding FX, Down (10.9%) • 38% of overall sales • Record sales quarter for ScanSource Communications in North America – Record quarters with Polycom Voice, ShoreTel, Sonus and Chief • ScanSource Catalyst – Double-digit sales growth with wireless vendors – In June, launched Cisco collaboration products • Europe Communications – Lowest sales quarter this year, principally from lower big deal volume in Germany – Second best sales quarter in U.K – April restructuring; sales plan for growth and profitability • ScanSource Services Group exceeded plan in all areas 14

Q1 FY14 Outlook For the Quarter Ending September 30, 2013: Net Sales Diluted Earnings Per Share • Range from $715 million to $735 million • Range midpoint: $725 million • Range from $0.56 to $0.58 per share • Range midpoint: $0.57 Outlook as of August 22, 2013 15

Appendix: Non-GAAP Financial Information 16 Q4 FY13 Q3 FY13 Q4 FY12 Return on invested capital (ROIC), annualized (a) 17.2% 13.3% 18.1% Reconciliation of Net Income (Loss) to EBITDA Net income (loss) - GAAP $ (13,315) $ 13,978 $ 19,785 Plus: Income taxes (6,352) 7,202 8,846 Plus: Interest expense 419 102 150 Plus: Depreciation and amortization 1,594 2,274 2,242 EBITDA (17,654) 23,556 31,023 Adjustments: Impairment charges, including ERP & goodwill 48,772 - - Adjusted EBITDA (numerator for ROIC)(non-GAAP) $ 31,118 $ 23,556 $ 31,023 Invested Capital Calculation Equity - beginning of the quarter $ 709,912 $ 696,960 $ 642,450 Equity - end of quarter 695,956 709,912 652,311 Add: Impairment charges, including ERP & goodwill, net of tax 33,216 - - Average equity 719,542 703,436 647,381 Average funded debt (b) 5,429 15,675 41,324 Invested capital (denominator for ROIC)(non-GAAP) $ 724,971 $ 719,111 $ 688,705 Notes: (a) Calculated as net income plus interest expense, income taxes, depreciation and amortization (EBITDA), annualized and divided by invested capital. EBITDA excludes non-cash impairment charges. (b) Average daily amounts outstanding on our short-term and long-term interest-bearing debt.

Appendix: Non-GAAP Financial Information 17 Worldwide Barcode & Security Net sales, excluding impact of foreign exchange (FX) - Y/Y Change: Q4 2013 net sales $ 444.8 Fx impact 0.3 Q4 2013 net sales, excluding Fx impact $ 445.1 International Q4 2012 sales $ 454.1 % Change -2.0% FY 2013 net sales $ 1,828.2 Fx impact 34.5 FY 2013 net sales, excluding Fx impact $ 1,862.7 International FY 2012 sales $ 1,837.3 % Change 1.4% Worldwide Communications & Services Net sales, excluding impact of foreign exchange (FX) - Y/Y Change: Q4 2013 net sales $ 267.9 Fx impact (0.3) Q4 2013 net sales, excluding Fx impact $ 267.6 International Q4 2012 sales $ 300.4 % Change -10.9% FY 2013 net sales $ 1,048.7 Fx impact 2.7 FY 2013 net sales, excluding Fx impact $ 1,051.4 International FY 2012 sales $ 1,178.0 % Change -10.7%
