Attached files
| file | filename |
|---|---|
| 8-K - CURRENT REPORT OF MATERIAL EVENTS OR CORPORATE CHANGES - Emerge Energy Services LP | a13-19111_18k.htm |
Exhibit 99.1
|
|
www.emergelp.com PAGE 1 Emerge Energy Services LP Investor Presentation August 2013 |
|
|
www.emergelp.com PAGE 2 Forward Looking Statements This presentation contains forward-looking statements. These statements can be identified by the use of forward-looking terminology including “may,” “believe,” “will,” “expect,” “anticipate,” or “estimate.” These forward-looking statements involve risks and uncertainties, and there can be no assurance that actual results will not differ materially from those expected by management of Emerge Energy Services LP. When considering these forward-looking statements, you should keep in mind the risk factors and other cautionary statements in the registration statement filed with the SEC. The risk factors and other factors noted in our prospectus could cause our actual results to differ materially from those contained in any forward-looking statement. Except as required by law, Emerge Energy Services LP does not undertake any obligation to update or revise such forward-looking statements to reflect events or circumstances that occur after the date hereof. In this presentation, we present Adjusted EBITDA, a non-GAAP financial measure. Adjusted EBITDA is used as a supplemental financial measure by our management and external users of our financial statements, such as investors and commercial banks, to assess the financial performance of our assets without regard to the impact of financing methods, capital structure or historical cost basis of our assets; the viability of capital expenditure projects and the overall rates of return on alternative investment opportunities; our liquidity position and the ability of our assets to generate cash sufficient to make debt payments and to make distributions; and our operating performance as compared to those of other companies in our industry without regard to the impact of financing methods and capital structure. We believe that Adjusted EBITDA provides useful information to investors because, when viewed with our GAAP results and the accompanying reconciliations, it provides a more complete understanding of our performance than GAAP results alone. We also believe that external users of our financial statements benefit from having access to the same financial measures that management uses in evaluating the results of our business. We define Adjusted EBITDA generally as: net income (loss) plus interest expense, income tax expense, depreciation, depletion and amortization expense, non-cash charges and selected losses that are unusual or non-recurring less interest income, income tax benefits and selected gains that are unusual or non-recurring. We report Adjusted EBITDA (which as defined includes certain other adjustments, none of which impacted the calculation of Adjusted EBITDA herein) to our lenders under our new credit facility in determining compliance with the interest coverage ratio test and certain senior consolidated indebtedness to Adjusted EBITDA tests thereunder. Adjusted EBITDA should not be considered as an alternative to net income, operating income, cash flow from operating activities or any other measure of financial performance presented in accordance with GAAP. |
|
|
www.emergelp.com PAGE 3 Partnership Overview Sand Fuel • Primarily consists of processing & selling transportation mixture (“transmix”) • Also includes wholesale, terminal, and biodiesel operations • Operations in Dallas / Fort Worth and Birmingham, Alabama • Located adjacent to major common carrier pipelines • Leading manufacturer of Northern White silica sand, ~ 99% sold as a proppant for hydraulic fracturing • Attractive customer base and contract mix • Three sand plants backed by several mines with high quality reserves • Advantaged rail access on two Class I railroads, with numerous logistics and transload solutions Together, these segments provide significant EBITDA scale and balance, while giving EMES diversification benefits as the market evolves |

|
|
www.emergelp.com PAGE 4 Our MLP Structure • We have a simplified MLP structure – All units are Common Units – Non-economic General Partner – No Incentive Distribution Rights (IDRs) – No Minimum Quarterly Distributions (MQD) • Our Sponsor, Insight Equity, which owns 49% of the Common Units, has fully aligned its financial interests with our Public Unitholders • EMES pays out 100% of its Available Cash to Common Unit Holders – We seek to capture cash flow stability through long term contracts, a low-cost operating structure, and indexed pricing – Unlike a typical “variable rate” MLP, our gross margins are not based on the spread between two commodities that may or may not be correlated – Our current credit facility allows us to borrow at favorable rates, and we are well within our financial covenants • We anticipate that our near term growth opportunities, mainly using excess capacity at our Barron facility and filling our transmix tower in Birmingham, AL, require negligible capital • We believe that the capital requirements for our near-term organic growth opportunities will return the capital invested quickly and can be financed using our credit facility • We do not need new equity financing at this time, nor do we plan to withhold cash from our unitholders in order to avoid raising new capital |
|
|
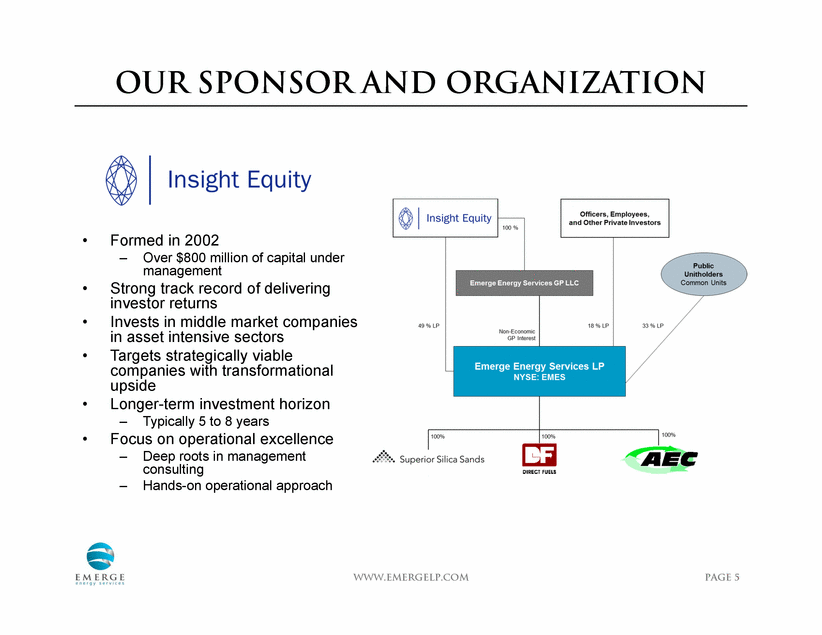
www.emergelp.com PAGE 5 Our Sponsor and Organization • Formed in 2002 – Over $800 million of capital under management • Strong track record of delivering investor returns • Invests in middle market companies in asset intensive sectors • Targets strategically viable companies with transformational upside • Longer-term investment horizon – Typically 5 to 8 years • Focus on operational excellence – Deep roots in management consulting – Hands-on operational approach |
|
|
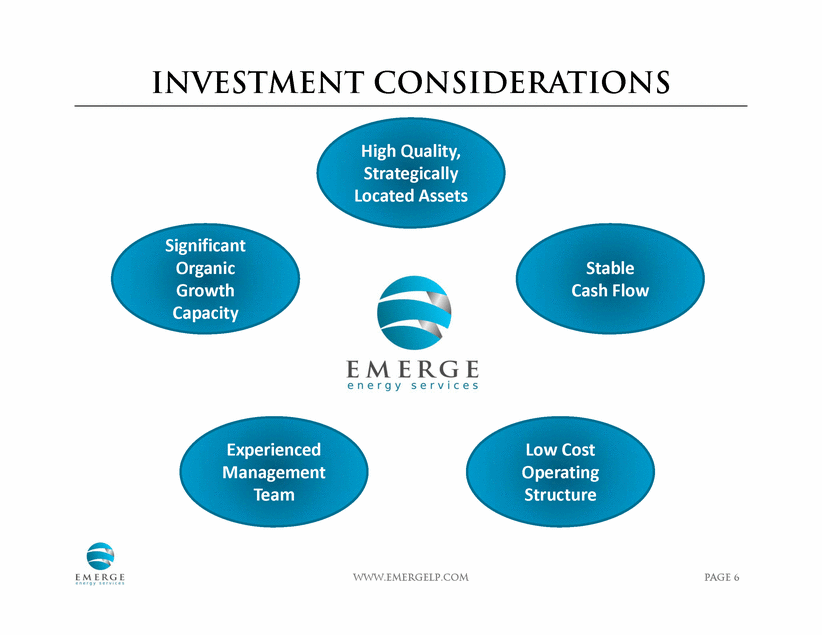
www.emergelp.com PAGE 6 Investment Considerations Low Cost Operating Structure Experienced Management Team Significant Organic Growth Capacity High Quality, Strategically Located Assets Stable Cash Flow |
|
|
www.emergelp.com PAGE 7 Our Business Objective And Strategies • Sand segment has long-term contracts with creditworthy counterparties • Fuel segment contracts designed to generate stable margins • Continue to seek additional relationships and contracts with similar terms for both segments • Newly built Barron plant quickly building volumes and running well over 50% utilization • Significant coarse Northern White reserves • Multiple opportunities to contract additional transmix supplies, increase wholesale volumes, and add throughput and terminalling accounts • Actively pursue additional sales in emerging shale plays • Expand logistics capabilities and footprint through a combination of Emerge-owned and partner transload sites • Addition of additive blending at fuel terminals expected to increase terminal business • Actively pursue acquisitions along current and complementary business lines • Leverage expertise into other geographies • Take advantage of industry consolidation opportunities • Sufficient capital to pursue growth strategy through acquisitions, organic growth, and asset optimization • Attractive current financial and credit profiles • Commitment to maximizing total distributions Seek Contractual Cash Flow Stability Capitalize on Organic Growth Opportunities Access New and Adjacent Markets Pursue Accretive Strategic Acquisitions Maintain Financial Strength and Flexibility Our primary business objective is to generate cash flow that is predictable and steadily grows over time |
|
|
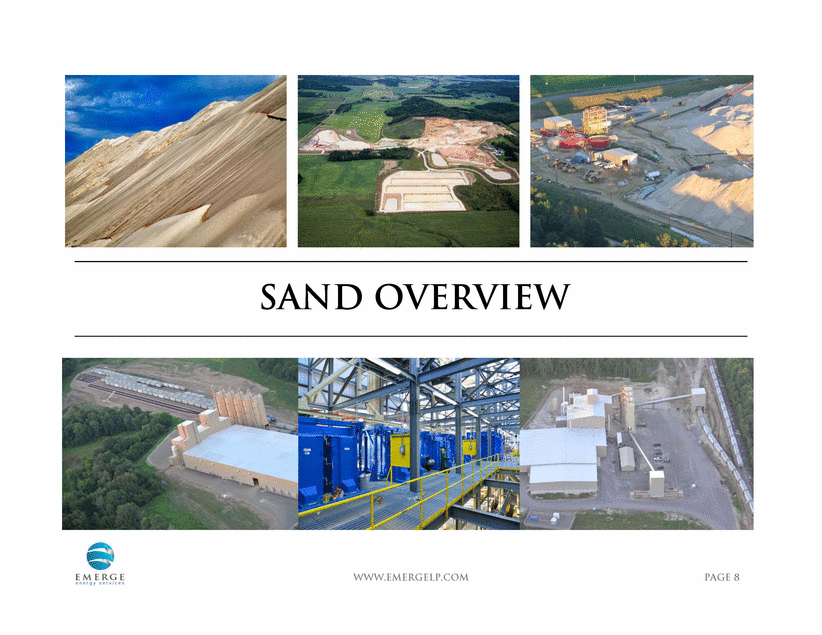
www.emergelp.com PAGE 8 SAND OVERVIEW |
|
|
www.emergelp.com PAGE 9 Proppants & Hydraulic Fracturing • Frac sand, or “proppant,” is used to prop open fissures in hydraulic fracturing • Demand expected to approximately double by 2021 Hydraulic Fracturing 2011 Proppant Consumption Historical & Projected Proppant Demand Source: The Freedonia Group millions of tons Sand 77% Resin Coated Sand 13% Ceramic Proppant 9% Other 1% 0 5 10 15 20 25 30 35 40 45 2001 2006 2011 2016 2021 Raw Frac Sand Resin-Coated Sand Ceramics Other |

|
|
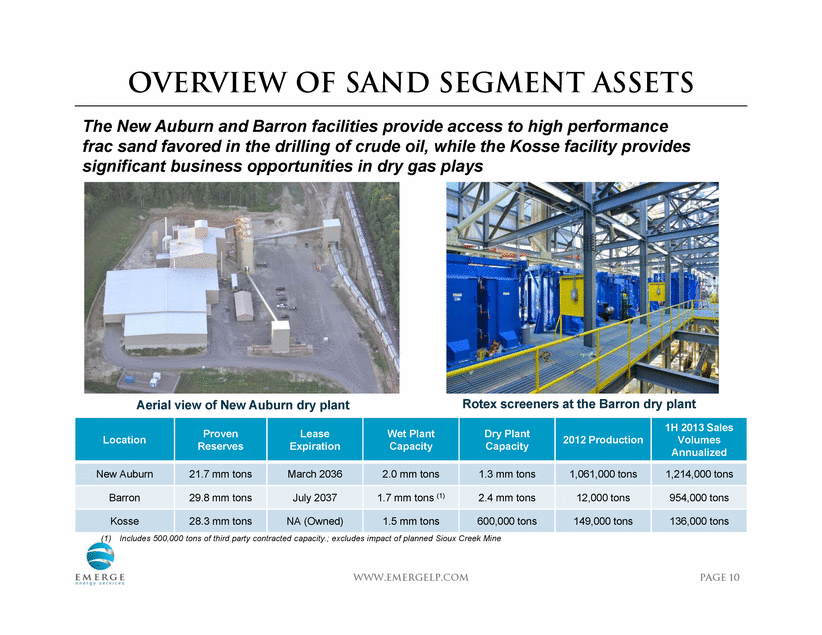
www.emergelp.com PAGE 10 Overview of Sand Segment Assets The New Auburn and Barron facilities provide access to high performance frac sand favored in the drilling of crude oil, while the Kosse facility provides significant business opportunities in dry gas plays Location Proven Reserves Lease Expiration Wet Plant Capacity Dry Plant Capacity 2012 Production 1H 2013 Sales Volumes Annualized New Auburn 21.7 mm tons March 2036 2.0 mm tons 1.3 mm tons 1,061,000 tons 1,214,000 tons Barron 29.8 mm tons July 2037 1.7 mm tons (1) 2.4 mm tons 12,000 tons 954,000 tons Kosse 28.3 mm tons NA (Owned) 1.5 mm tons 600,000 tons 149,000 tons 136,000 tons Aerial view of New Auburn dry plant Rotex screeners at the Barron dry plant (1) Includes 500,000 tons of third party contracted capacity.; excludes impact of planned Sioux Creek Mine |
|
|
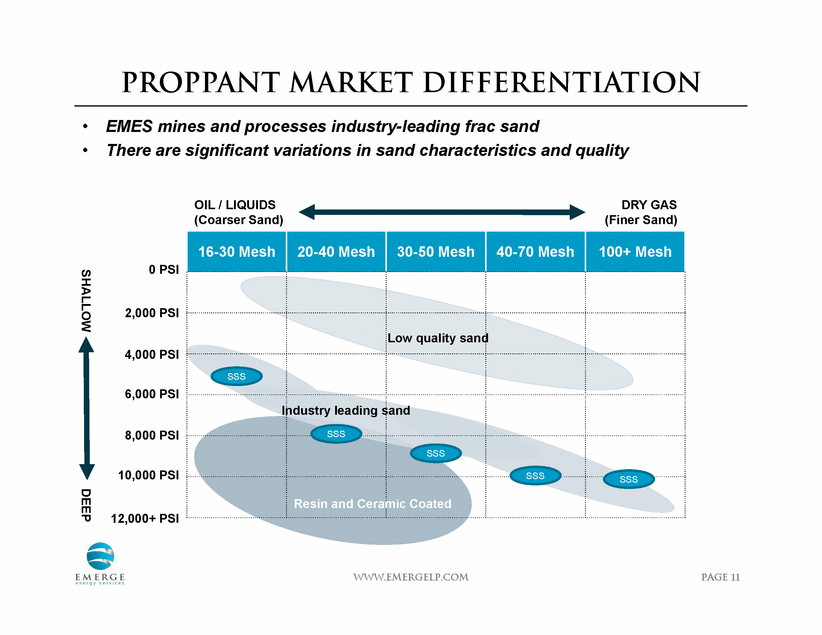
www.emergelp.com PAGE 11 16-30 Mesh 20-40 Mesh 30-50 Mesh 40-70 Mesh 100+ Mesh Proppant Market Differentiation • EMES mines and processes industry-leading frac sand • There are significant variations in sand characteristics and quality OIL / LIQUIDS (Coarser Sand) DRY GAS (Finer Sand) 0 PSI 2,000 PSI 4,000 PSI 6,000 PSI 8,000 PSI 10,000 PSI 12,000+ PSI SHALLOW DEEP SSS SSS SSS SSS SSS Low quality sand Industry leading sand Resin and Ceramic Coated |
|
|
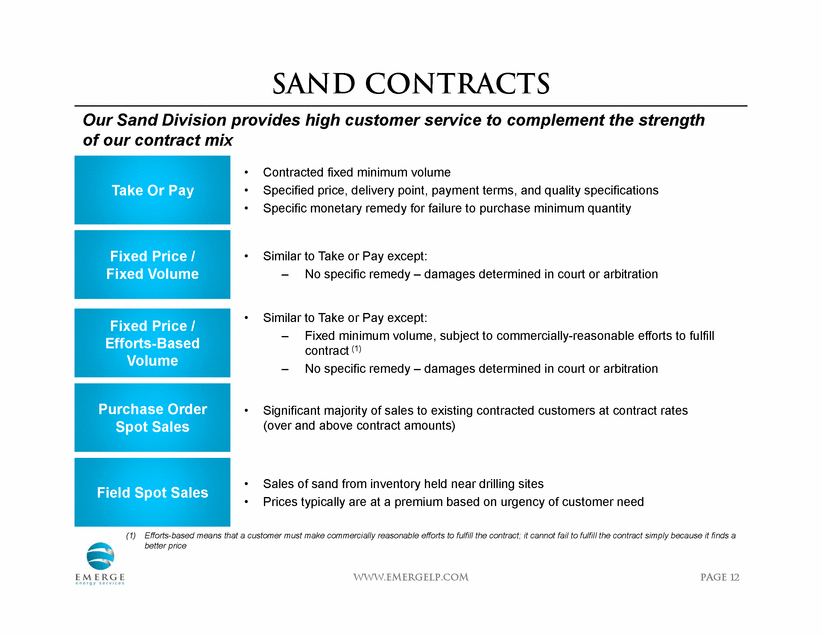
www.emergelp.com PAGE 12 Sand Contracts • Contracted fixed minimum volume • Specified price, delivery point, payment terms, and quality specifications • Specific monetary remedy for failure to purchase minimum quantity • Similar to Take or Pay except: – No specific remedy – damages determined in court or arbitration • Similar to Take or Pay except: – Fixed minimum volume, subject to commercially-reasonable efforts to fulfill contract (1) – No specific remedy – damages determined in court or arbitration • Significant majority of sales to existing contracted customers at contract rates (over and above contract amounts) • Sales of sand from inventory held near drilling sites • Prices typically are at a premium based on urgency of customer need Take Or Pay Fixed Price / Fixed Volume Fixed Price / Efforts-Based Volume Purchase Order Spot Sales Field Spot Sales Our Sand Division provides high customer service to complement the strength of our contract mix (1) Efforts-based means that a customer must make commercially reasonable efforts to fulfill the contract; it cannot fail to fulfill the contract simply because it finds a better price |
|
|
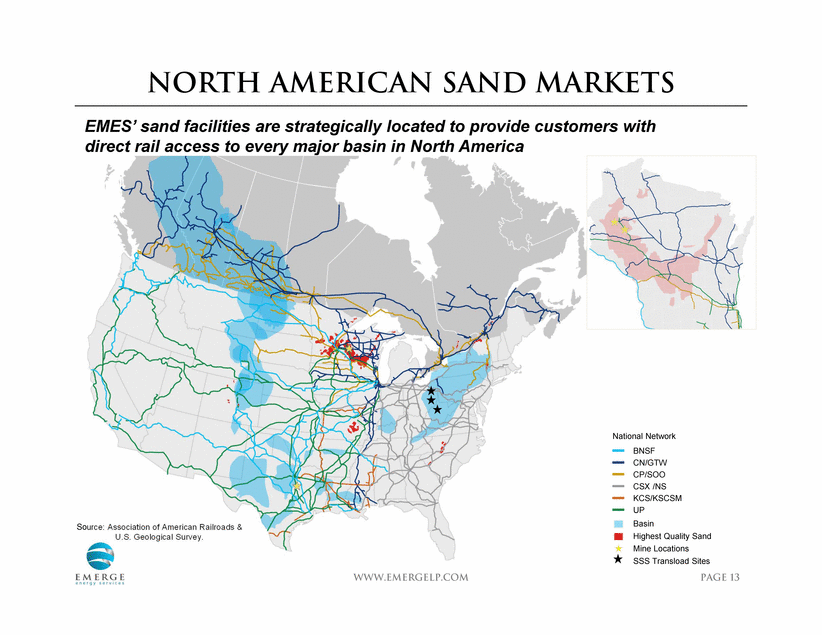
www.emergelp.com PAGE 13 North American Sand Markets EMES’ sand facilities are strategically located to provide customers with direct rail access to every major basin in North America Source: Association of American Railroads & U.S. Geological Survey. Basin Highest Quality Sand Mine Locations SSS Transload Sites BNSF CN/GTW CP/SOO CSX /NS KCS/KSCSM UP National Network |
|
|
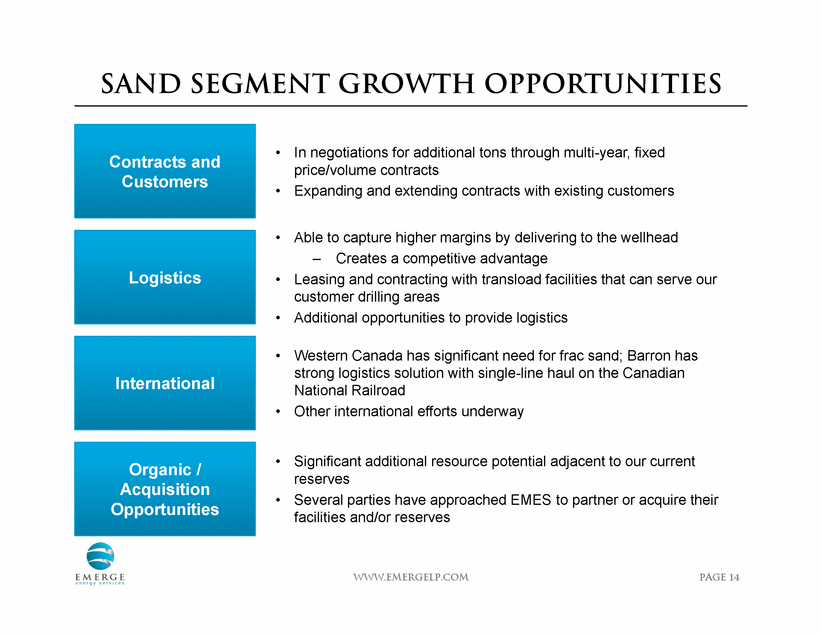
www.emergelp.com PAGE 14 Sand Segment Growth Opportunities Contracts and Customers • In negotiations for additional tons through multi-year, fixed price/volume contracts • Expanding and extending contracts with existing customers Logistics • Able to capture higher margins by delivering to the wellhead – Creates a competitive advantage • Leasing and contracting with transload facilities that can serve our customer drilling areas • Additional opportunities to provide logistics International • Western Canada has significant need for frac sand; Barron has strong logistics solution with single-line haul on the Canadian National Railroad • Other international efforts underway Organic / Acquisition Opportunities • Significant additional resource potential adjacent to our current reserves • Several parties have approached EMES to partner or acquire their facilities and/or reserves |
|
|
www.emergelp.com PAGE 15 FUEL SEGMENT OVERVIEW |
|
|
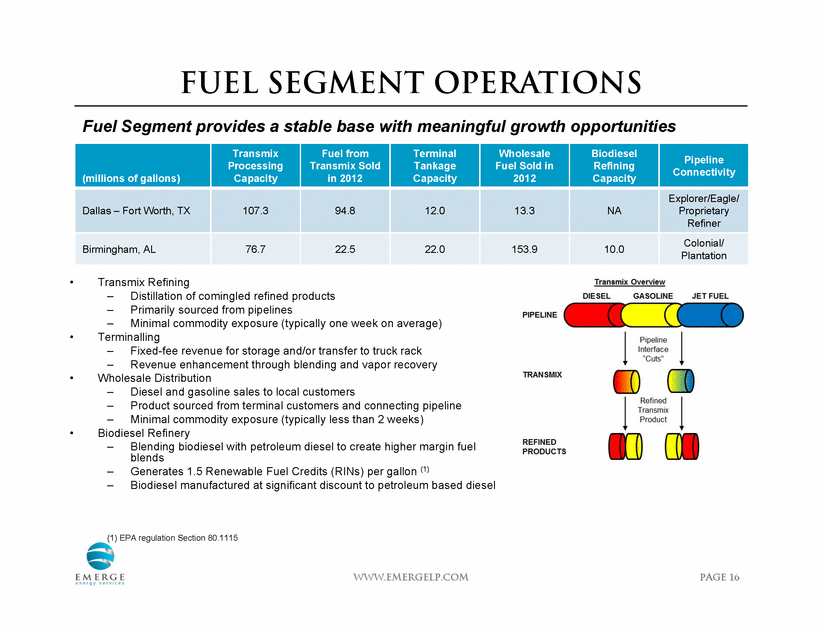
www.emergelp.com PAGE 16 Fuel Segment Operations Fuel Segment provides a stable base with meaningful growth opportunities (millions of gallons) Transmix Processing Capacity Fuel from Transmix Sold in 2012 Terminal Tankage Capacity Wholesale Fuel Sold in 2012 Biodiesel Refining Capacity Pipeline Connectivity Dallas – Fort Worth, TX 107.3 94.8 12.0 13.3 NA Explorer/Eagle/ Proprietary Refiner Birmingham, AL 76.7 22.5 22.0 153.9 10.0 Colonial/ Plantation • Transmix Refining – Distillation of comingled refined products – Primarily sourced from pipelines – Minimal commodity exposure (typically one week on average) • Terminalling – Fixed-fee revenue for storage and/or transfer to truck rack – Revenue enhancement through blending and vapor recovery • Wholesale Distribution – Diesel and gasoline sales to local customers – Product sourced from terminal customers and connecting pipeline – Minimal commodity exposure (typically less than 2 weeks) • Biodiesel Refinery – Blending biodiesel with petroleum diesel to create higher margin fuel blends – Generates 1.5 Renewable Fuel Credits (RINs) per gallon (1) – Biodiesel manufactured at significant discount to petroleum based diesel (1) EPA regulation Section 80.1115 |
|
|
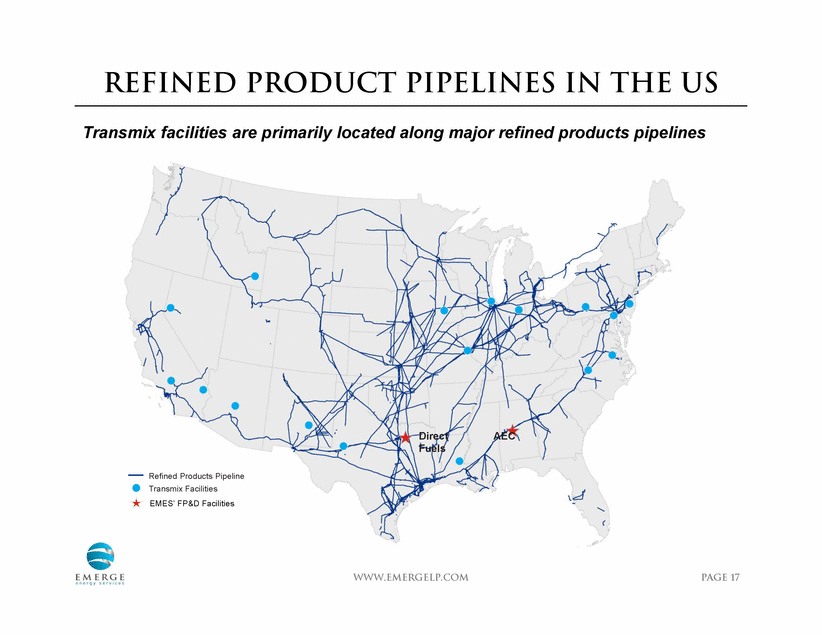
www.emergelp.com PAGE 17 Refined Product Pipelines in the US Transmix facilities are primarily located along major refined products pipelines Refined Products Pipeline Transmix Facilities EMES’ FP&D Facilities Direct Fuels AEC |
|
|
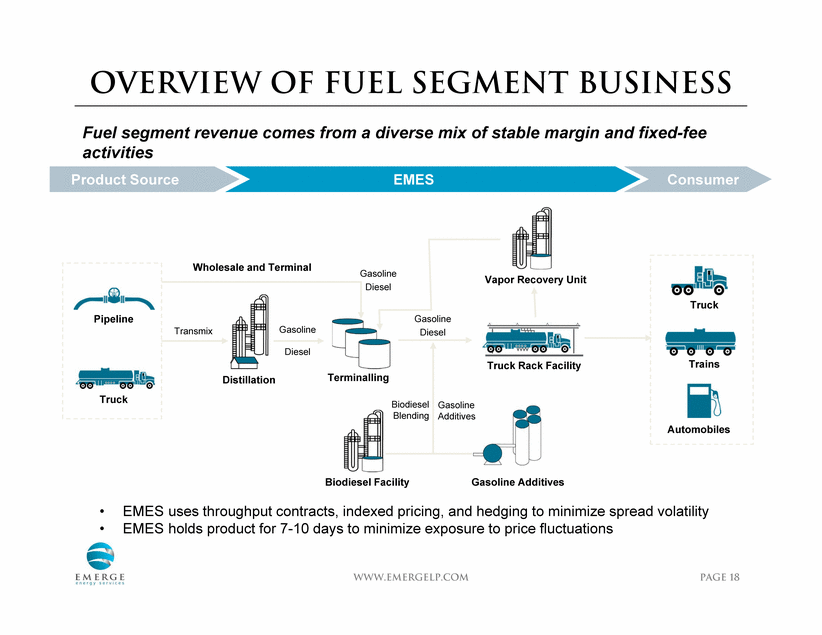
www.emergelp.com PAGE 18 Overview of Fuel Segment Business Fuel segment revenue comes from a diverse mix of stable margin and fixed-fee activities Truck Pipeline Distillation Terminalling Automobiles Trains Truck Biodiesel Blending Gasoline Additives Biodiesel Facility Gasoline Additives Truck Rack Facility Diesel Transmix Product Source EMES Consumer Gasoline Gasoline Diesel Gasoline Diesel • EMES uses throughput contracts, indexed pricing, and hedging to minimize spread volatility • EMES holds product for 7-10 days to minimize exposure to price fluctuations Wholesale and Terminal Vapor Recovery Unit |
|
|
www.emergelp.com PAGE 19 Fuel Segment Growth Opportunities Transmix and Throughput • Leverage strong relationships and existing pipeline connectivity • Expand into adjacent geographies • Birmingham facility has significant unused capacity • Biodiesel facility recently restarted • Renewable Identification Numbers (“RINs”) provide significant value potential • EMES putting additive systems in place at both terminals, allowing us to terminal and sell branded as well as unbranded petroleum products • EMES has received shipper status on Colonial and status pending on Plantation, which will provide additional gross margin opportunities • Opportunity to acquire additional transmix operations and terminal sites • Space for expansion at both sites Biodiesel Terminalling Opportunities Organic Growth and Acquisitions |

|
|
www.emergelp.com PAGE 20 FINANCIAL OVERVIEW |

|
|
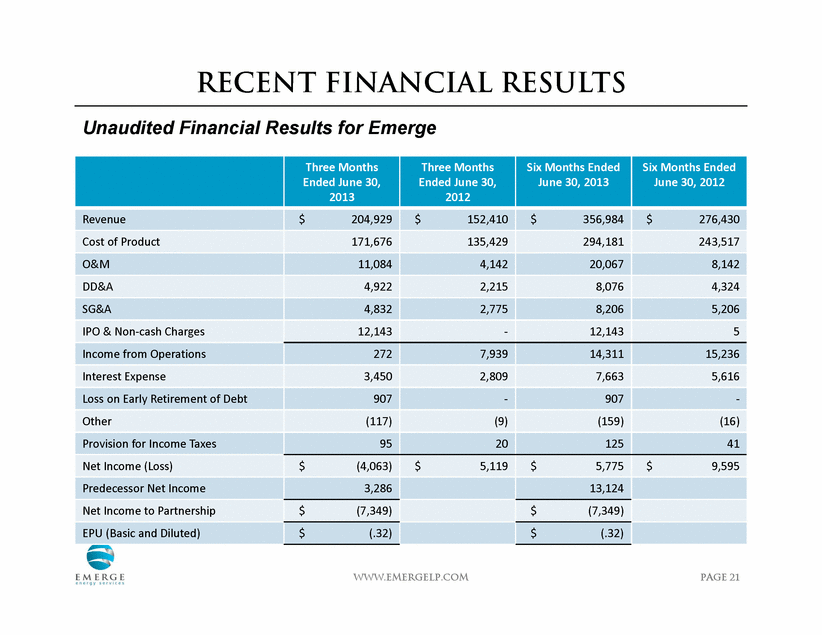
www.emergelp.com PAGE 21 Recent Financial Results Unaudited Financial Results for Emerge Three Months Ended June 30, 2013 Three Months Ended June 30, 2012 Six Months Ended June 30, 2013 Six Months Ended June 30, 2012 Revenue $ 204,929 $ 152,410 $ 356,984 $ 276,430 Cost of Product 171,676 135,429 294,181 243,517 O&M 11,084 4,142 20,067 8,142 DD&A 4,922 2,215 8,076 4,324 SG&A 4,832 2,775 8,206 5,206 IPO & Non-cash Charges 12,143 - 12,143 5 Income from Operations 272 7,939 14,311 15,236 Interest Expense 3,450 2,809 7,663 5,616 Loss on Early Retirement of Debt 907 - 907 - Other (117) (9) (159) (16) Provision for Income Taxes 95 20 125 41 Net Income (Loss) $ (4,063) $ 5,119 $ 5,775 $ 9,595 Predecessor Net Income 3,286 13,124 Net Income to Partnership $ (7,349) $ (7,349) EPU (Basic and Diluted) $ (.32) $ (.32) |
|
|
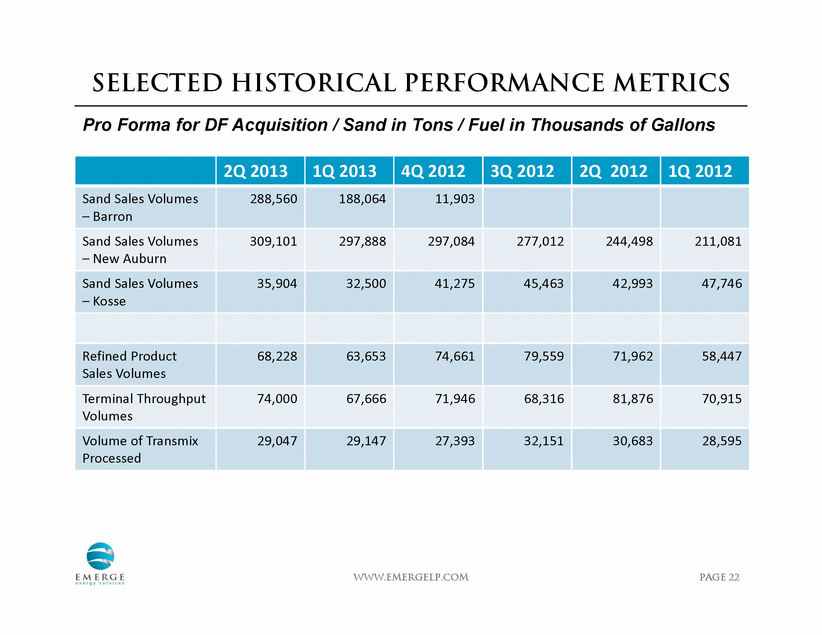
www.emergelp.com PAGE 22 Selected Historical Performance Metrics Pro Forma for DF Acquisition / Sand in Tons / Fuel in Thousands of Gallons 2Q 2013 1Q 2013 4Q 2012 3Q 2012 2Q 2012 1Q 2012 Sand Sales Volumes – Barron 288,560 188,064 11,903 Sand Sales Volumes – New Auburn 309,101 297,888 297,084 277,012 244,498 211,081 Sand Sales Volumes – Kosse 35,904 32,500 41,275 45,463 42,993 47,746 Refined Product Sales Volumes 68,228 63,653 74,661 79,559 71,962 58,447 Terminal Throughput Volumes 74,000 67,666 71,946 68,316 81,876 70,915 Volume of Transmix Processed 29,047 29,147 27,393 32,151 30,683 28,595 |
|
|
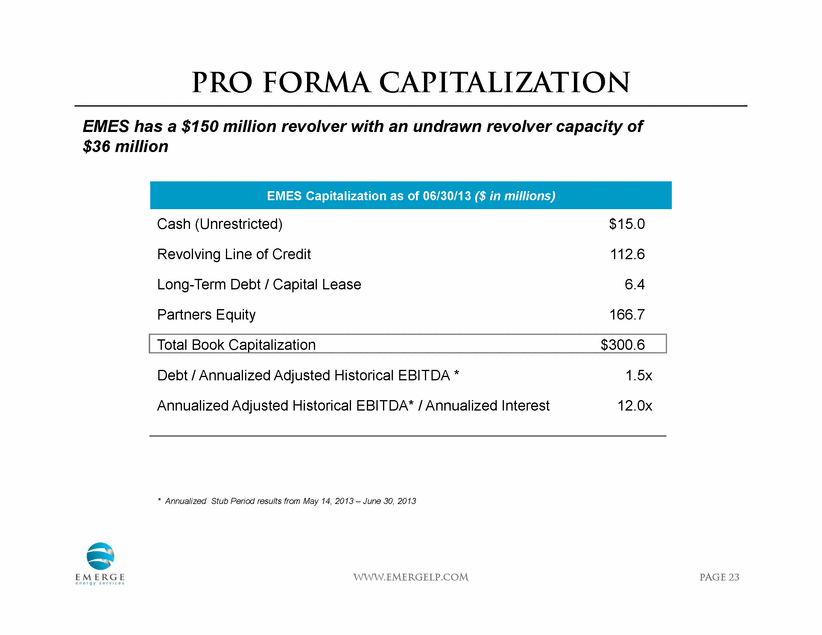
www.emergelp.com PAGE 23 Pro Forma Capitalization EMES has a $150 million revolver with an undrawn revolver capacity of $36 million EMES Capitalization as of 06/30/13 ($ in millions) Cash (Unrestricted) $15.0 Revolving Line of Credit 112.6 Long-Term Debt / Capital Lease 6.4 Partners Equity 166.7 Total Book Capitalization $300.6 Debt / Annualized Adjusted Historical EBITDA * 1.5x Annualized Adjusted Historical EBITDA* / Annualized Interest 12.0x * Annualized Stub Period results from May 14, 2013 – June 30, 2013 |
|
|
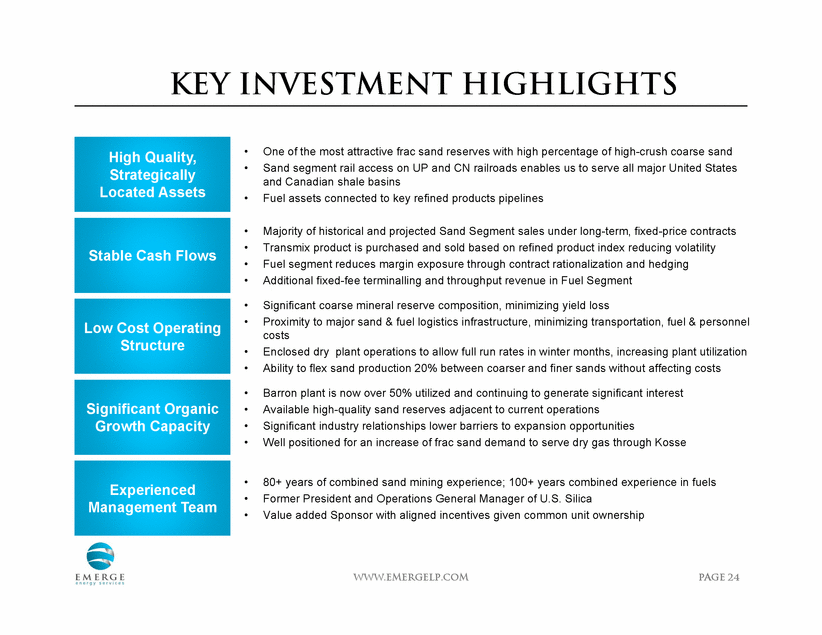
www.emergelp.com PAGE 24 • One of the most attractive frac sand reserves with high percentage of high-crush coarse sand • Sand segment rail access on UP and CN railroads enables us to serve all major United States and Canadian shale basins • Fuel assets connected to key refined products pipelines • Majority of historical and projected Sand Segment sales under long-term, fixed-price contracts • Transmix product is purchased and sold based on refined product index reducing volatility • Fuel segment reduces margin exposure through contract rationalization and hedging • Additional fixed-fee terminalling and throughput revenue in Fuel Segment • Significant coarse mineral reserve composition, minimizing yield loss • Proximity to major sand & fuel logistics infrastructure, minimizing transportation, fuel & personnel costs • Enclosed dry plant operations to allow full run rates in winter months, increasing plant utilization • Ability to flex sand production 20% between coarser and finer sands without affecting costs • Barron plant is now over 50% utilized and continuing to generate significant interest • Available high-quality sand reserves adjacent to current operations • Significant industry relationships lower barriers to expansion opportunities • Well positioned for an increase of frac sand demand to serve dry gas through Kosse • 80+ years of combined sand mining experience; 100+ years combined experience in fuels • Former President and Operations General Manager of U.S. Silica • Value added Sponsor with aligned incentives given common unit ownership High Quality, Strategically Located Assets Stable Cash Flows Low Cost Operating Structure Significant Organic Growth Capacity Experienced Management Team Key Investment Highlights |
|
|
www.emergelp.com PAGE 25 APPENDIX |
|
|
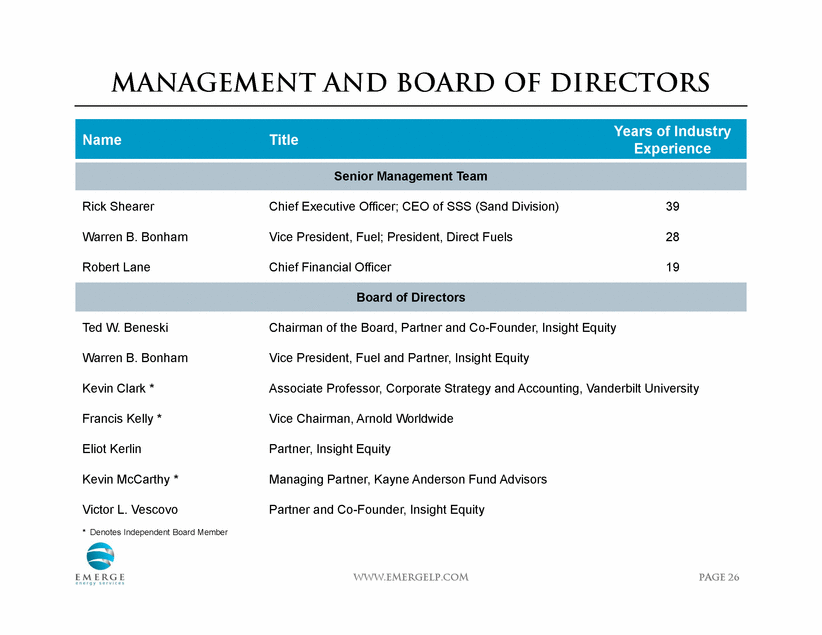
www.emergelp.com PAGE 26 Management and Board of Directors Name Title Years of Industry Experience Senior Management Team Rick Shearer Chief Executive Officer; CEO of SSS (Sand Division) 39 Warren B. Bonham Vice President, Fuel; President, Direct Fuels 28 Robert Lane Chief Financial Officer 19 Board of Directors Ted W. Beneski Chairman of the Board, Partner and Co-Founder, Insight Equity Warren B. Bonham Vice President, Fuel and Partner, Insight Equity Kevin Clark * Associate Professor, Corporate Strategy and Accounting, Vanderbilt University Francis Kelly * Vice Chairman, Arnold Worldwide Eliot Kerlin Partner, Insight Equity Kevin McCarthy * Managing Partner, Kayne Anderson Fund Advisors Victor L. Vescovo Partner and Co-Founder, Insight Equity * Denotes Independent Board Member |
|
|
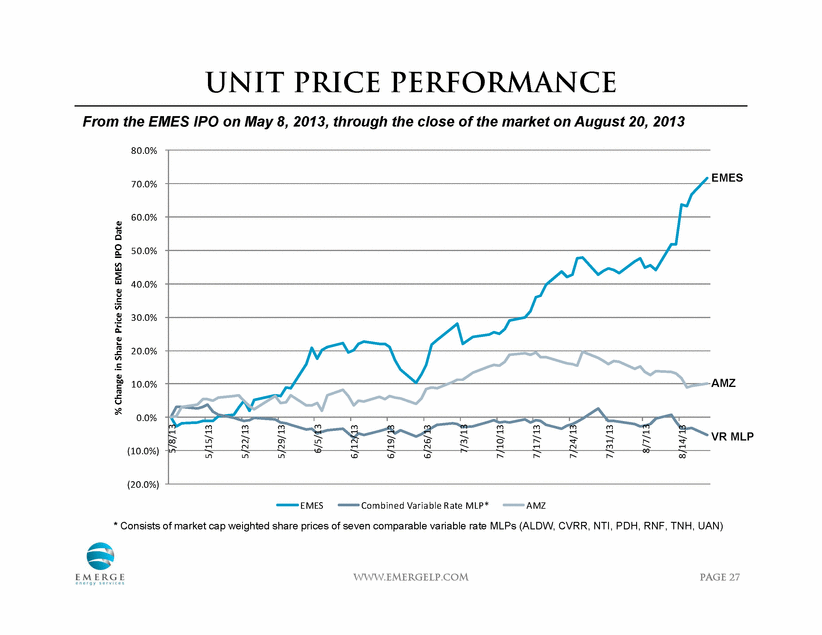
www.emergelp.com PAGE 27 Unit Price Performance * Consists of market cap weighted share prices of seven comparable variable rate MLPs (ALDW, CVRR, NTI, PDH, RNF, TNH, UAN) EMES AMZ VR MLP (20.0%) (10.0%) 0.0% 10.0% 20.0% 30.0% 40.0% 50.0% 60.0% 70.0% 80.0% 5/8/13 5/15/13 5/22/13 5/29/13 6/5/13 6/12/13 6/19/13 6/26/13 7/3/13 7/10/13 7/17/13 7/24/13 7/31/13 8/7/13 8/14/13 % Change in Share Price Since EMES IPO Date EMES Combined Variable Rate MLP* AMZ From the EMES IPO on May 8, 2013, through the close of the market on August 20, 2013 |
|
|
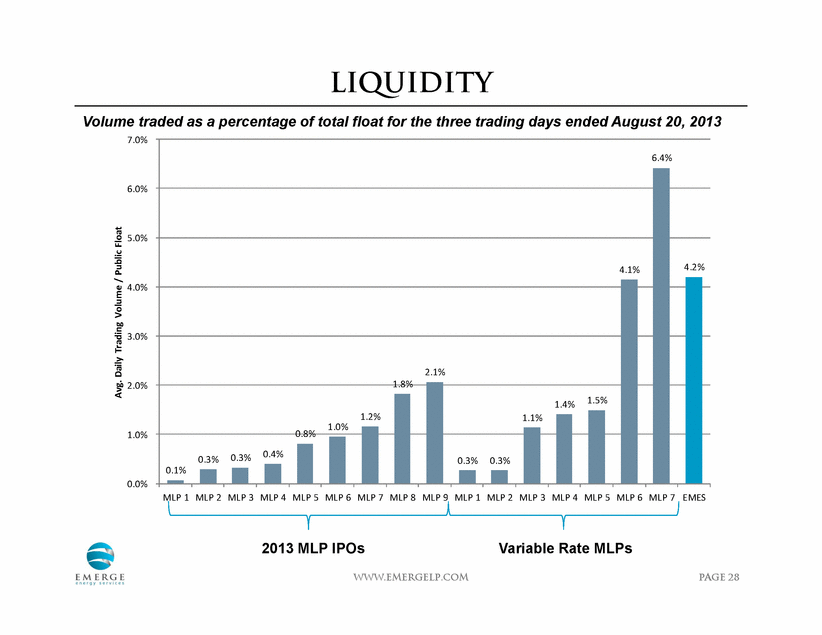
www.emergelp.com PAGE 28 Liquidity 2013 MLP IPOs Variable Rate MLPs 0.1% 0.3% 0.3% 0.4% 0.8% 1.0% 1.2% 1.8% 2.1% 0.3% 0.3% 1.1% 1.4% 1.5% 4.1% 6.4% 4.2% 0.0% 1.0% 2.0% 3.0% 4.0% 5.0% 6.0% 7.0% MLP 1 MLP 2 MLP 3 MLP 4 MLP 5 MLP 6 MLP 7 MLP 8 MLP 9 MLP 1 MLP 2 MLP 3 MLP 4 MLP 5 MLP 6 MLP 7 EMES Avg. Daily Trading Volume / Public Float Volume traded as a percentage of total float for the three trading days ended August 20, 2013 |
|
|
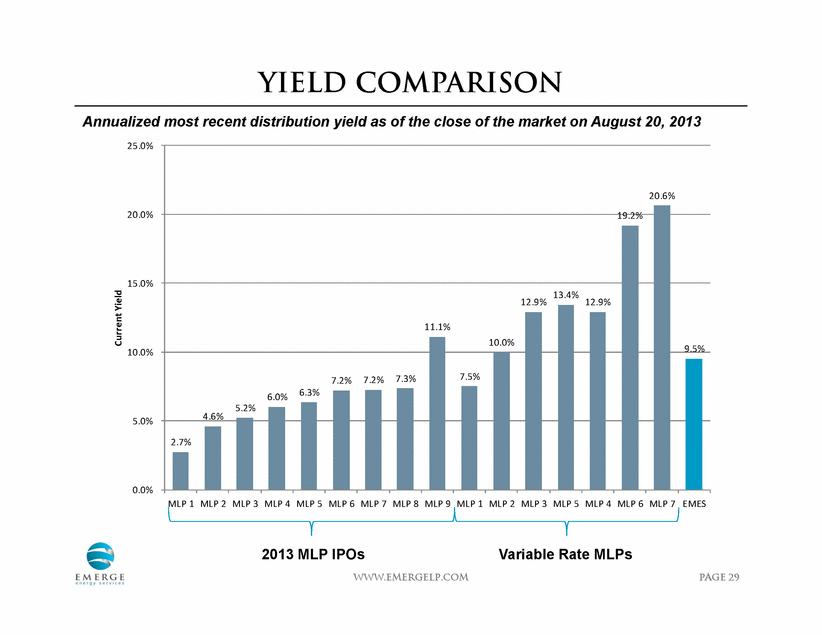
www.emergelp.com PAGE 29 Yield Comparison 2013 MLP IPOs Variable Rate MLPs 2.7% 4.6% 5.2% 6.0% 6.3% 7.2% 7.2% 7.3% 11.1% 7.5% 10.0% 12.9% 13.4% 12.9% 19.2% 20.6% 9.5% 0.0% 5.0% 10.0% 15.0% 20.0% 25.0% MLP 1 MLP 2 MLP 3 MLP 4 MLP 5 MLP 6 MLP 7 MLP 8 MLP 9 MLP 1 MLP 2 MLP 3 MLP 5 MLP 4 MLP 6 MLP 7 EMES Current Yield Annualized most recent distribution yield as of the close of the market on August 20, 2013 |
|
|
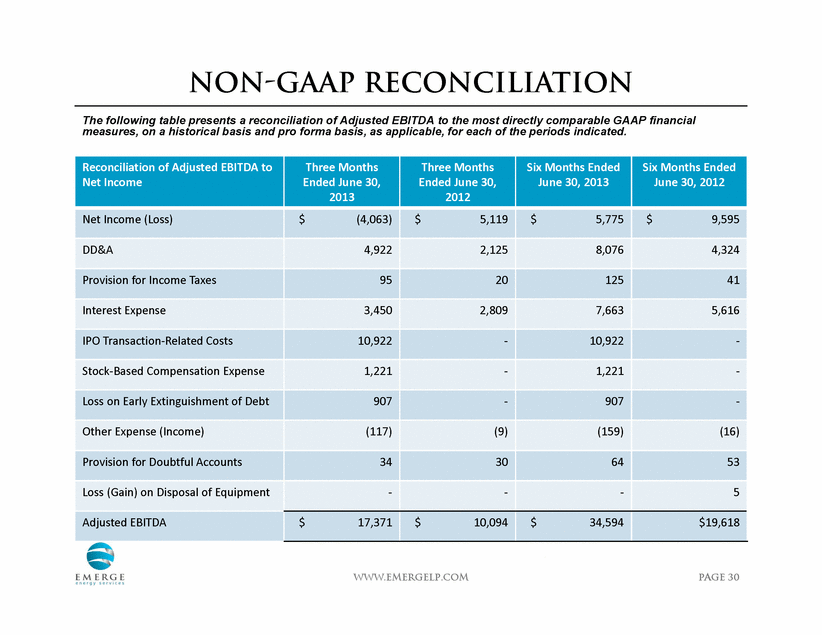
www.emergelp.com PAGE 30 Non-GAAP Reconciliation The following table presents a reconciliation of Adjusted EBITDA to the most directly comparable GAAP financial measures, on a historical basis and pro forma basis, as applicable, for each of the periods indicated. Reconciliation of Adjusted EBITDA to Net Income Three Months Ended June 30, 2013 Three Months Ended June 30, 2012 Six Months Ended June 30, 2013 Six Months Ended June 30, 2012 Net Income (Loss) $ (4,063) $ 5,119 $ 5,775 $ 9,595 DD&A 4,922 2,125 8,076 4,324 Provision for Income Taxes 95 20 125 41 Interest Expense 3,450 2,809 7,663 5,616 IPO Transaction-Related Costs 10,922 - 10,922 - Stock-Based Compensation Expense 1,221 - 1,221 - Loss on Early Extinguishment of Debt 907 - 907 - Other Expense (Income) (117) (9) (159) (16) Provision for Doubtful Accounts 34 30 64 53 Loss (Gain) on Disposal of Equipment - - - 5 Adjusted EBITDA $ 17,371 $ 10,094 $ 34,594 $19,618 |
|
|
www.emergelp.com PAGE 31 Emerge Energy Services LP Investor Presentation August 2013 |