Attached files
| file | filename |
|---|---|
| 8-K - 8-K - Delek US Holdings, Inc. | a8kinvestorpresentation8-1.htm |
Delek US Holdings, Inc. Investor Presentation August 2013

Safe Harbor Provision 2 Delek US Holdings and Delek Logistics Partners, LP are traded on the New York Stock Exchange in the United States under the symbols “DK” and ”DKL” respectively, and, as such, are governed by the rules and regulations of the United States Securities and Exchange Commission. This presentation may contain forward-looking statements that are based upon current expectations and involve a number of risks and uncertainties. Statements concerning our current estimates, expectations and projections about our future results, performance, prospects and opportunities and other statements, concerns, or matters that are not historical facts are “forward-looking statements,” as that term is defined under United States securities laws. Investors are cautioned that the following important factors, among others, may affect these forward-looking statements. These factors include but are not limited to: risks and uncertainties with the respect to the quantities and costs of crude oil, the costs to acquire feedstocks and the price of the refined petroleum products we ultimately sell; management's ability to execute its strategy through acquisitions and transactional risks in acquisitions; our competitive position and the effects of competition; the projected growth of the industry in which we operate; changes in the scope, costs, and/or timing of capital projects; losses from derivative instruments; general economic and business conditions, particularly levels of spending relating to travel and tourism or conditions affecting the southeastern United States; potential conflicts of interest between our majority unitholder and other unitholders; and other risks contained in our filings with the United States Securities and Exchange Commission. Forward-looking statements should not be read as a guarantee of future performance or results and will not be accurate indications of the times at, or by which such performance or results will be achieved. Forward-looking information is based on information available at the time and/or management’s good faith belief with respect to future events, and is subject to risks and uncertainties that could cause actual performance or results to differ materially from those expressed in the statements. Neither Delek US nor Delek Logistics Partners undertakes any obligation to update or revise any such forward- looking statements.

Delek US Holdings Overview Integrated Downstream Energy Company Operates 140,000 BPD of combined refined production capacity in Texas and Arkansas Refining Segment ) Owned crude/product terminals and pipeline assets in Texas, Arkansas and Tennessee Logistics Segment (1) Approximately 370 convenience stores -- primarily in Tennessee, Alabama and Georgia Retail Segment 3 60,000 BPD 9.5 complexity (1) Delek Logistics Partners , LP (NYSE:DKL) began operating on Nov. 7, 2012 and 100% of its performance is reported as a segment of Delek US beginning 4Q12. Delek US and its affiliates own approximately 62%, including the 2.0% general partner interest, of DKL. Tyler Refinery 80,000 BPD 9.0 complexity El Dorado Refinery Strategically Located Refineries Allow For Broad Wholesale and Retail Product Distribution Opportunities Longview Crude Oil Hub Strategic crude oil supply point that allows our refining system access to domestic inland and Gulf Coast feedstock 370 Stores Locations in 7 states Retail Delek Logistics (1) 6 Terminals Approx. 1,000 miles of pipelines 3.7 million bbls crude oil storage capacity

WTI - Midland 92% East Texas 8% Gulf Coast 2% Inland / Local 71% Rail 27% Well Positioned Mid-Continent Refining System 4 Strategically Located Assets Provide Access to Cost-Advantaged Feedstocks Tyler Crude Source (2Q13) El Dorado Crude Source (2Q13) Permian Eagle Ford Woodford 75% of 2013 Crude Slate Expected to Consist of Price-Advantaged Domestic Crudes Up to 45,000 bpd Rail Capacity at El Dorado (1) (1) Rail supplied light crude capability consists of 25,000 bpd of light crude or 12,000 bpd heavy crude offloading that is available at a company owned facility at the El Dorado refinery . In addition, 20,000 bpd light crude capability is currently available via a third party facility adjacent to the El Dorado refinery.
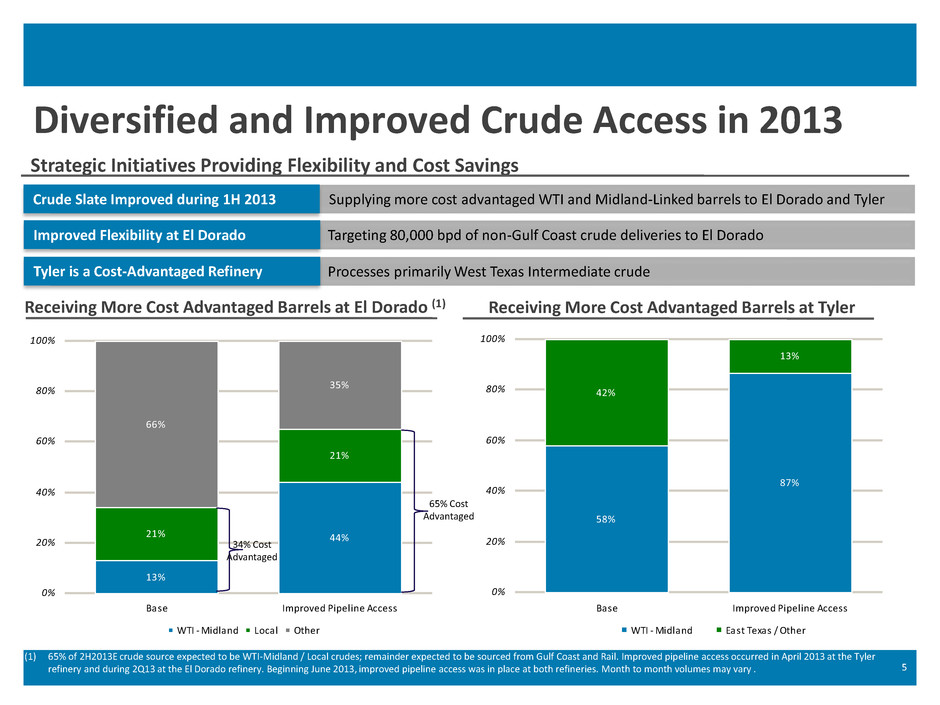
Diversified and Improved Crude Access in 2013 5 Receiving More Cost Advantaged Barrels at El Dorado (1) Receiving More Cost Advantaged Barrels at Tyler (1) 65% of 2H2013E crude source expected to be WTI-Midland / Local crudes; remainder expected to be sourced from Gulf Coast and Rail. Improved pipeline access occurred in April 2013 at the Tyler refinery and during 2Q13 at the El Dorado refinery. Beginning June 2013, improved pipeline access was in place at both refineries. Month to month volumes may vary . Supplying more cost advantaged WTI and Midland-Linked barrels to El Dorado and Tyler Crude Slate Improved during 1H 2013 Targeting 80,000 bpd of non-Gulf Coast crude deliveries to El Dorado Improved Flexibility at El Dorado Processes primarily West Texas Intermediate crude Tyler is a Cost-Advantaged Refinery Strategic Initiatives Providing Flexibility and Cost Savings 58% 87% 42% 13% 0% 20% 40% 60% 80% 100% Base Improved Pipeline Access WTI - Midland East Texas / Other 13% 44%21% 21% 35% 66% 0% 20% 40% 60% 80% 100% Base Improved Pipeline Access WTI - Midland Local Other 65% Cost Advantaged 34% Cost Advantaged

Refining Segment Operational Update

($30.00) ($20.00) ($10.00) $0.00 $10.00 $20.00 $30.00 $40.00 $50.00 J a n -1 0 F e b -1 0 M a r- 1 0 A pr -1 0 M a y -1 0 J u n -1 0 J u l- 1 0 A u g -1 0 S e p -1 0 O c t- 1 0 No v -1 0 De c -1 0 J a n -1 1 F e b -1 1 M a r- 1 1 A pr -1 1 M a y -1 1 J u n -1 1 J u l- 1 1 A u g -1 1 S e p -1 1 O c t- 1 1 No v -1 1 De c -1 1 J a n -1 2 F e b -1 2 M a r- 1 2 A pr -1 2 M a y -1 2 J u n -1 2 J u l- 1 2 A u g -1 2 S e p -1 2 O c t- 1 2 No v -1 2 De c -1 2 J a n -1 3 F e b -1 3 M a r- 1 3 A pr -1 3 M a y -1 3 J u n -1 3 J u l- 1 3 A u g -1 3 Brent-WTI Cushing Spread Per Barrel WTI 5-3-2 Gulf Coast Crack Spread Per Barrel LLS 5-3-2 Gulf Coast Crack Spread Per Barrel U.S. Refining Environment Trends(1) 7 Refined Product Margins and WTI-Linked Feedstock Favor Delek US (1) Source: Platts; 2013 data is as of August 15, 2013 (2) Crack Spreads: (+/-) Contango/Backwardation 1Q10 2Q10 3Q10 4Q10 1Q11 2Q11 3Q11 4Q11 1Q12 2Q12 3Q12 4Q12 1Q13 (1) (2) (2) WTI 5-3-2 Gulf Coast Crack Spread Per Barrel $24.06 $25.88 $30.39 $27.20 $27.38 $20.19 2Q13 3Q13 $13.74
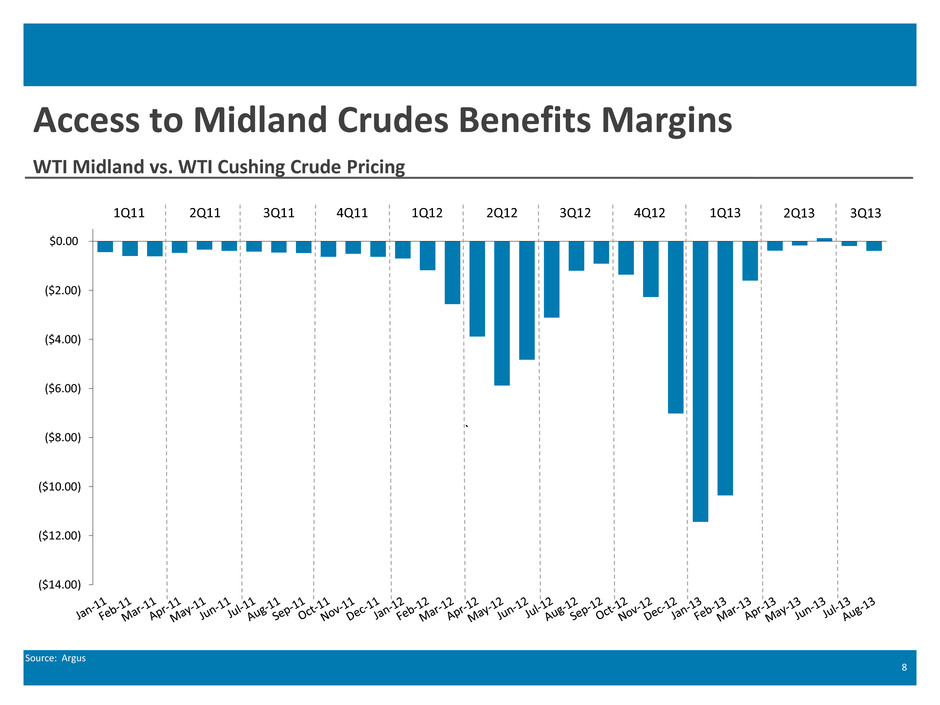
WTI Midland vs. WTI Cushing Crude Pricing ($14.00) ($12.00) ($10.00) ($8.00) ($6.00) ($4.00) ($2.00) $0.00 ` Access to Midland Crudes Benefits Margins 8 Source: Argus 1Q11 2Q11 3Q11 4Q11 1Q12 2Q12 3Q12 4Q12 1Q13 2Q13 3Q13

35,000 52,000 25,000 8,000 0 10,000 20,000 30,000 40,000 50,000 60,000 70,000 1Q13 2Q13 - Improved Pipeline Access WTI - Midland East Texas / Other Gasoline 54% LPGs 5% Diesel / Jet 38% Other 3% WTI-Midland 92% East Texas 8% Tyler Refinery Overview 9 Inland PADD III refinery located in East Texas 60,000 bpd, 9.5 complexity Ran consistently at 64,000 bpd in 2Q13 Primarily processes inland light sweet crudes (100% in 2Q13) 92% yield of gasoline, diesel and jet fuel in 2Q13 Cost advantaged refinery primarily processing Midland sourced crude (92% in 2Q13) Substantial savings potentially created by replacing higher priced East Texas and other crude with Midland sourced crudes 2Q13 Crude Source 2Q13 Production 64,439 bpd 69,360 bpd Improved Access to WTI Based Crude Supply in April 2013 Tyler Refinery Crude Slate Pricing Change B ar re ls p e r D ay Crude Throughput Total Production 56,028 56,426 0 10,000 20,000 30,000 40,000 50,000 60,000 70,000 2011 2012 32,407 33,045 22,521 21,883 4,769 4,257 0 10,000 20,000 30,000 40,000 50,000 60,000 70,000 80,000 90,000 2011 2012 Gasoline Diesel Petro/Other
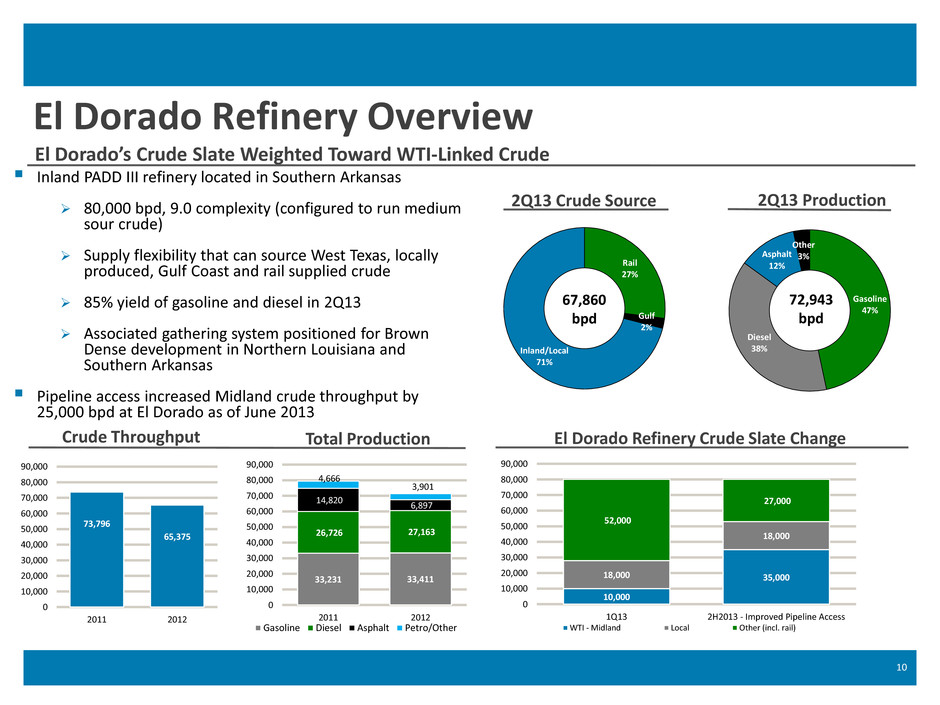
El Dorado’s Crude Slate Weighted Toward WTI-Linked Crude Gasoline 47% Diesel 38% Asphalt 12% Other 3% Rail 27% Gulf 2% Inland/Local 71% El Dorado Refinery Overview 10 Inland PADD III refinery located in Southern Arkansas 80,000 bpd, 9.0 complexity (configured to run medium sour crude) Supply flexibility that can source West Texas, locally produced, Gulf Coast and rail supplied crude 85% yield of gasoline and diesel in 2Q13 Associated gathering system positioned for Brown Dense development in Northern Louisiana and Southern Arkansas Pipeline access increased Midland crude throughput by 25,000 bpd at El Dorado as of June 2013 2Q13 Crude Source 2Q13 Production 67,860 bpd 72,943 bpd 10,000 35,000 18,000 18,000 52,000 27,000 0 10,000 20,000 30,000 40,000 50,000 60,000 70,000 80,000 90,000 1Q13 2H2013 - Improved Pipeline Access WTI - Midland Local Other (incl. rail) El Dorado Refinery Crude Slate Change 73,796 65,375 0 10,000 20,000 30,000 40,000 50,000 60,000 70,000 80,000 90,000 2011 2012 33,231 33,411 26,726 27,163 14,820 6,897 4,666 3,901 0 10,000 20,000 30,000 40,000 50,000 60,000 70,000 80,000 90,000 2011 2012 Gasoline Diesel Asphalt Petro/Other Crude Throughput Total Production
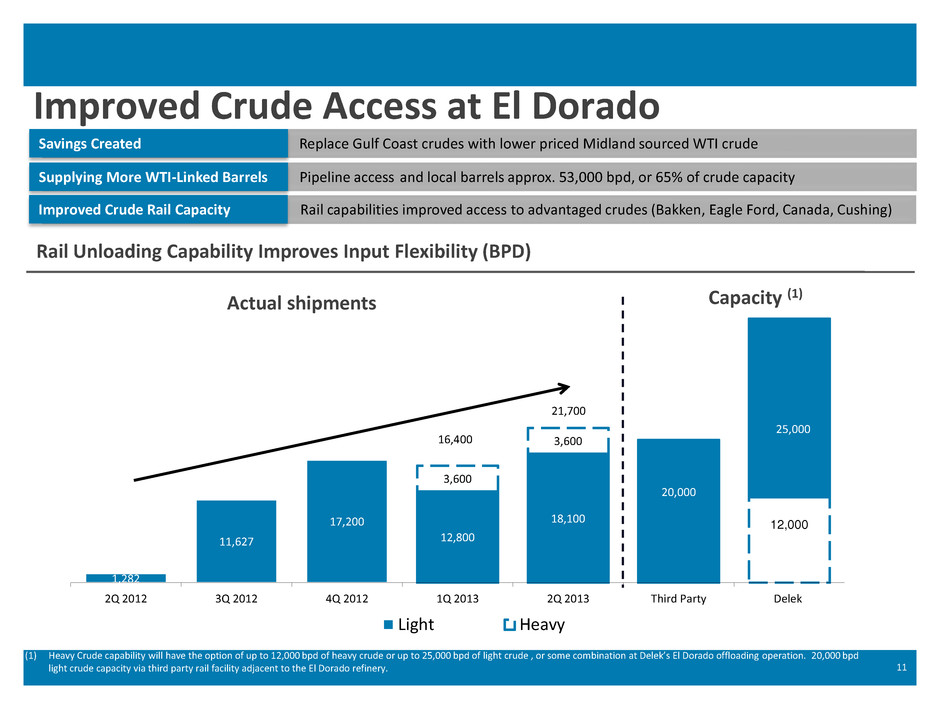
Improved Crude Access at El Dorado 11 (1) Heavy Crude capability will have the option of up to 12,000 bpd of heavy crude or up to 25,000 bpd of light crude , or some combination at Delek’s El Dorado offloading operation. 20,000 bpd light crude capacity via third party rail facility adjacent to the El Dorado refinery. Replace Gulf Coast crudes with lower priced Midland sourced WTI crude Savings Created ) Pipeline access and local barrels approx. 53,000 bpd, or 65% of crude capacity Supplying More WTI-Linked Barrels ) Rail capabilities improved access to advantaged crudes (Bakken, Eagle Ford, Canada, Cushing) Improved Crude Rail Capacity 1,282 11,627 17,200 12,800 18,100 3,600 3,600 12,000 20,000 25,000 2Q 2012 3Q 2012 4Q 2012 1Q 2013 2Q 2013 Third Party Delek Light Heavy 16,400 21,700 Rail Unloading Capability Improves Input Flexibility (BPD) Actual shipments Capacity (1)

Significant Organic Growth / Margin Enhancement Opportunities 12 El Dorado: LSR/Sat Gas Project (LSR) Improve liquid recovery of Butane & Propane at El Dorado Tyler: Vacuum Tower Bottoms Project (VTB) Convert El Dorado asphalt to light product via Coker at Tyler (1) Subject to market pricing economics. Contribution margin is defined as net sales less cost of goods sold, operating expenses and other one-time expenses, excluding depreciation and amortization. El Dorado: DHT Revamp – Phases I & II Increase ULSD production from 30,000 bpd to 34,000 bpd; (Phase 1 increased to 33,000 bpd) El Dorado: Replace Alky Refrigeration Compressor Further optimize FCC unit and increase gasoline production Completed low-cost, high-return capital projects at El Dorado and Tyler Additional quick-hit capital projects identified SCOPE COST BENEFIT (1) TIMING $14.5 million $5.7 million $3.0 million $4.2 million $15-18 million $10 million Phase 1: $6 m Phase 2:$2 m $8 million $4 + million Complete Complete Phase 1: Compl. Phase 2: 2014 July 2013 El Dorado: Crude Pre-flash Tower Debottleneck crude pre-flash tower to increase ability to process lighter crudes El Dorado: Gasoline Hydrotreater Expand throughput capacity to support lighter crude runs at the refinery $12.0 million $20 Million 1Q2014 (Turnaround) 1Q2014 (Turnaround) El Dorado & Tyler: FCC Reactor Revamp Replace FCC Reactor and Catalyst Stripper with state-of-the-art technology to increase unit conversion; FCC Reactors have been purchased and are in storage $18.0 million $30 million 2014 (Turnaround)

Logistics and Retail Operational Update

Delek Logistics Partners, LP Overview (NYSE: DKL) 14 DKL Asset Overview First Drop Down July 2013 – Incremental $10.5 million EBITDA expected from Tyler storage and terminal assets ~400 miles of crude and product transportation pipelines, including the 185 mile crude oil pipeline from Longview to Nederland, TX 600 mile crude oil gathering system Storage facilities with 3.7 million barrels of crude oil active shell capacity supporting Delek US’ El Dorado and Tyler refineries Wholesale and marketing business in Texas Six light product terminals: Texas: Tyler, Abilene, Big Sandy, San Angelo Tennessee: Nashville and Memphis Several Visible Pathways to Growth Dropdowns Organic Acquisitions ROFO on one terminal and two million barrels of storage capacity Logistics assets under construction or recently completed: 300,000 bbl Tyler crude oil tank 25,000 bpd Lion rail project at El Dorado refinery $15-20 million estimated EBITDA from remaining drop downs Expected to be completed within 18 months Paline Pipeline fee increase in 2013, plus ability to re- contract at higher market-based rate after 2014 Increasing Brown Dense / Arkansas production, driving growth in gathering system Asset optimization and expansion Ability to partner with Delek US to make acquisitions Low consolidated cost-of-capital Future drop-downs from Delek US acquisitions or construction projects Third Party Opportunities for Growth

Midstream MLP with long-term contracts providing stable, growing cash flow Supports Delek US’ profitable and strategically located inland refining system Unlocks value of marketing and logistics assets Strategic vehicle for growth Visible asset dropdown opportunities Partner for future acquisitions and organic growth projects Reduces consolidated cost-of-capital 25% 50% 75% 100% 125% 150% 175% 11/1/2012 2/4/2013 5/10/2013 8/13/2013 DKL Alerian MLP Index DKL: Strong Performance & Value Creation Since IPO Performance Since IPO 15 (1) Current yield reflects NTM anticipated distribution of $1.58 per unit and equity value based on market capitalization as of August 15, 2013. (2) Per company filings. (3) Effective June 2013, a 1.4% interest in the general partner will be owned by three members of senior management of Delek US. The remainder will be indirectly held by Delek US +43.1% +8.5% A Powerful Strategic Partner DKL Value Accrues to Delek US Shareholders IPO Date: November 2, 2012 IPO Price: $21.00 per unit Current Yield (1): 5.26% Current Price (1): $30.03 per unit LP Equity Value (1): $720.7 million DK Ownership of DKL (2): 60.4% LP interest; 2% GP interest & IDRs

946 990 1,039 1,082 278 291 2009 2010 2011 2012 2Q12 2Q13 $840 $897 $951 $1,011 $266 $270 2009 2010 2011 2012 2Q12 2Q13 Strong Retail Presence 16 Expanding Market Footprint in Markets Capable of Being Supplied by El Dorado Fuel Gallons Sold Per Store (000’s) Merchandise Sales Per Store ($000’s) Tennessee 202 locations Virginia 8 locations Kentucky and Mississippi 5 locations Arkansas 11 locations Tyler Georgia 56 locations El Dorado Red border indicates region for future growth Alabama 88 locations Markets gasoline, diesel and merchandise through a network of retail fuel and convenience stores throughout the southeastern U.S. Operates 370 stores throughout seven states Currently undergoing multi-year store enhancement initiative 52% of stores re-imaged or newly constructed Targeting 10-12 new large-format stores in 2013
Financial Update
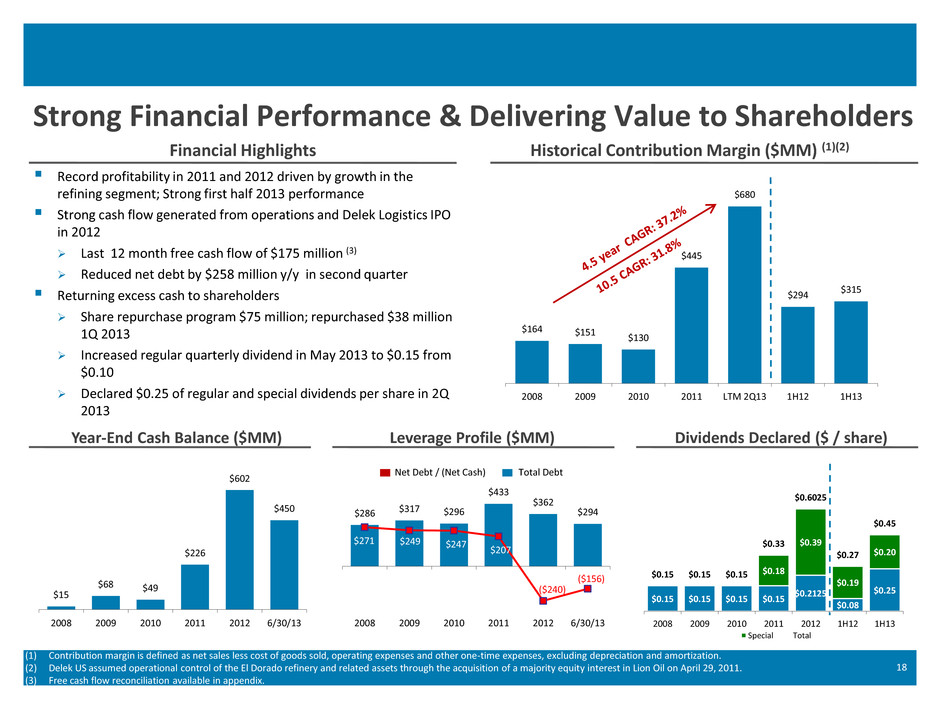
Financial Highlights $164 $151 $130 $445 $680 $294 $315 2008 2009 2010 2011 LTM 2Q13 1H12 1H13 Record profitability in 2011 and 2012 driven by growth in the refining segment; Strong first half 2013 performance Strong cash flow generated from operations and Delek Logistics IPO in 2012 Last 12 month free cash flow of $175 million (3) Reduced net debt by $258 million y/y in second quarter Returning excess cash to shareholders Share repurchase program $75 million; repurchased $38 million 1Q 2013 Increased regular quarterly dividend in May 2013 to $0.15 from $0.10 Declared $0.25 of regular and special dividends per share in 2Q 2013 $286 $317 $296 $433 $362 $294 $271 $249 $247 $207 ($240) ($156) 2008 2009 2010 2011 2012 6/30/13 Year-End Cash Balance ($MM) Strong Financial Performance & Delivering Value to Shareholders 18 (1) Contribution margin is defined as net sales less cost of goods sold, operating expenses and other one-time expenses, excluding depreciation and amortization. (2) Delek US assumed operational control of the El Dorado refinery and related assets through the acquisition of a majority equity interest in Lion Oil on April 29, 2011. (3) Free cash flow reconciliation available in appendix. $15 $68 $49 $226 $602 $450 2008 2009 2010 2011 2012 6/30/13 Leverage Profile ($MM) Net Debt / (Net Cash) Total Debt Dividends Declared ($ / share) Historical Contribution Margin ($MM) (1)(2) $0.15 $0.15 $0.15 $0.15 $0.2125 $0.08 $0.25 $0.18 $0.39 $0.19 $0.20 $0.15 $0.15 $0.15 $0.33 $0.6025 $0.27 $0.45 2008 2009 2010 2011 2012 1H12 1H13 Special Total

Going Forward

Significant Organic Growth / Margin Enhancement Opportunities 20 Crude Slate improvement- Increased Access to Midland sourced crude Quick Hit Capital projects – completed (1) Benefit reflects annualized impact on contribution margin and is subject to market pricing economics. Contribution margin is defined as net sales less cost of goods sold, operating expenses and other one-time expenses, excluding depreciation and amortization. Based on market conditions July 2013. Changes in crude oil price differentials affect crude slate margin improvement economics month to month. (2) Benefit reflects annualized impact on EBITDA and is subject to market pricing economics. Quick Hit Refinery Projects –Alky compressor FCC Reactors Revamp – Tyler and El Dorado We anticipate continued growth in our business in 2013 and beyond ADDITIONAL MARGIN IMPROVEMENT BENEFIT (1) TIMING Now 87k bpd of 140k bpd capacity Efficiency/ synergies added $4+ million $30 million 2Q13 1H 2013 July 2013 2014 Drop Downs from DK Paline Pipeline Recontracting 2013 - 2015 2015 $15 – 20 million TBD DKL GROWTH BENEFIT (2) TIMING $20 Million 1Q 2014 Pre Flash Tower/Gasoline Hydrotreater – El Dorado STRATEGIC INITIATIVES COMPLETED BENEFIT TIMING DHT Revamp – El Dorado (Phase 2) $2 million 1Q 2014
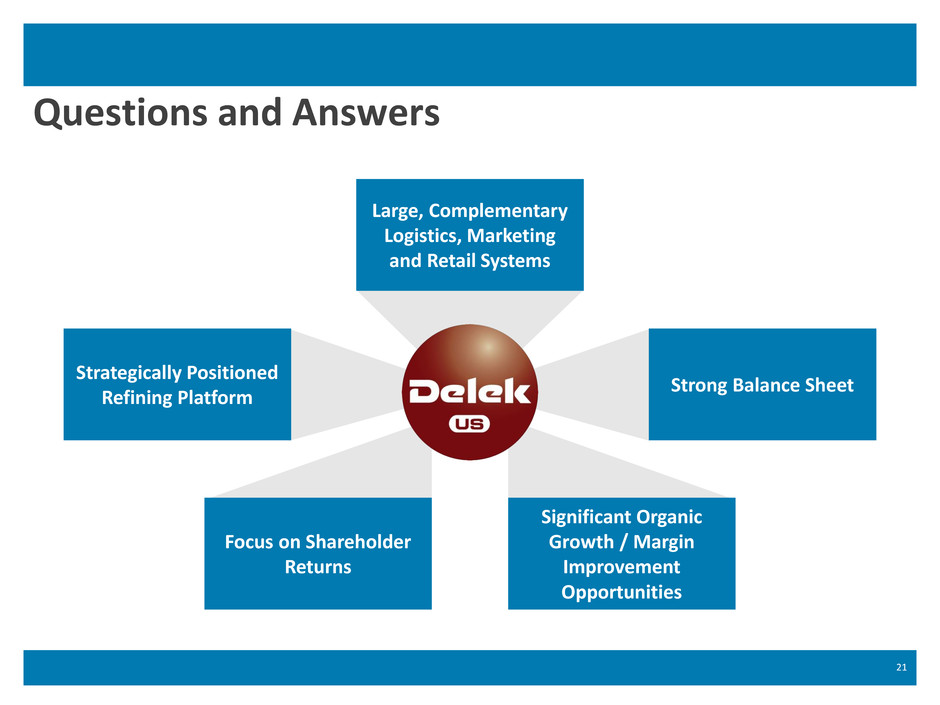
21 Large, Complementary Logistics, Marketing and Retail Systems Significant Organic Growth / Margin Improvement Opportunities Focus on Shareholder Returns Strong Balance Sheet Strategically Positioned Refining Platform Questions and Answers
Appendix Additional Data

$42.3 $36.0 $65.9 $108.9 $14.5 $45.0 $66.1 $65.6 2010A 2011A 2012A 2013E Refining Retail, Logistics, Marketing and Other Historical and Projected Capital Spending 23 $56.8mm $81.0mm $132.0mm $174.5mm Source: Company filings.

Non-GAAP Reconciliation 24 Source: Company 10-K filings. ($ in millions) 2008 2009 2010 2011 2012 LTM 2Q13 2Q12 2Q13 Net sales $4,723.7 $2,666.7 $3,755.6 $7,198.2 $8,726.7 $8,993.8 $4,304.6 $4,571.7 Cost of goods sold 4,308.1 2,394.1 3,412.9 6,429.9 7,704.4 7,931.0 3,836.1 4,062.7 Operating expenses 240.8 219.0 229.5 320.9 363.3 382.8 174.5 194.0 Impairment of goodwill 11.2 7.0 0.0 2.2 0.0 0.0 0.0 0.0 Insurance proceeds - business interruption 0.0 (64.1) (12.8) 0.0 0.0 0.0 0.0 0.0 Property damage proceeds, net 0.0 (40.3) (4.0) 0.0 0.0 0.0 0.0 0.0 Contribution margin $163.6 $151.0 $130.0 $445.2 $659.0 $680.0 $294.0 $315.0 Year Ended 12/31 YTD 6/30/13 Delek US Contribution Margin Reconciliation ($ in millions) 2012 LTM 2Q13 2Q12 2Q13 Net cash provided by operating activities $462.9 $325.5 $190.5 $53.1 Purchase of property, plant and equipment 132.0 150.8 50.4 69.2 Free cash flow $330.9 $174.7 $140.1 ($16.1) Delek US Free Cash Flow Reconciliation Year Ended 12/31 Year to Date

Investor Relations Contact: Assi Ginzburg Keith Johnson Chief Financial Officer Vice President of Investor Relations 615-435-1452 615-435-1366
