Attached files
| file | filename |
|---|---|
| 8-K - FORM 8-K - DORAL FINANCIAL CORP | d585848d8k.htm |
 Doral Financial Corporation
Q2 2013 Investor Presentation
August 16, 2013
Exhibit 99.1 |
 Disclaimer
2
This presentation may include forward-looking statements as defined in the
Private Securities Litigation Reform Act of 1995 (the
“PSLRA”). These include comments with respect to our objectives and
strategies, and the results of our operations and our business.
Forward-looking statements can be identified by the fact that they do not relate strictly to historical or current facts.
They
often
include
words
such
as
“expects,”
“anticipates,”
“intends,”
“plans,”
“believes,”
“seeks,”
“estimates,”
or
words
of
similar
meaning,
or
future
or
conditional
verbs
such
as
“will,”
“would,”
“should,”
“could”
or
“may.”
We
intend
these
forward-looking
statements to be covered by the safe harbor provisions of the PSLRA.
Forward-looking statements provide our expectations or predictions of future
conditions, events or results. They are, by their nature, subject to risks
and uncertainties. They are not guarantees of future performance, and actual results may differ materially.
By their nature, these forward-looking statements involve numerous assumptions
and uncertainties, both general and specific, including those discussed in
Doral Financial Corporation’s 2012 Annual Report on Form 10-K and other filings we make with the
Securities and Exchange Commission. Risk factors and uncertainties that could cause
the Company's actual results to differ materially from those described in
forward-looking statements can be found in the Company's 2012 Annual Report on Form 10-K,
which
is
available
in
the
Company's
website
at
www.doralfinancial.com,
as
they
may
be
updated
from
time
to
time
in
the
Company’s periodic and other reports filed with the Securities and Exchange
Commission. The statements in this presentation speak only as of the date
they are made. We do not undertake to update forward-looking
statements
to
reflect
the
impact
of
circumstances
or
events
that
arise
after
the
date
the
forward-looking
statements
were
made,
other than as required by law, including requirements of applicable securities
laws. |
 Q2
2013 Overview 3
Q2 results improved by $2MM versus Q1
US Business continues to fuel growth, grew loans to $2.5B
PR Mortgage franchise is a significant profit contributor
Maintaining Capital in excess of regulatory requirements
Doral Recovery strategy is producing benefits as NPAs fell $54MM during the quarter
|
 Doral
Financial Corporation Profile 4
Company Overview
$8.5B Asset PR Mortgage & US Commercial Lender
Capital Ratios continue to exceed required levels:
o
Tier-1 Leverage Ratio:
9.0%
o
Total Risk-Based Capital Ratio: 12.5%
Book Value of $68.26 per share
o
Completed 1:20 reverse split on 6/28/2013
o
A valuation allowance against Doral’s remaining deferred
tax asset represents an additional $ 44.56 per share ($296.4MM)
Doral operates two segments:
1.
Doral Growth : Profitable Mortgage & Commercial bank
o
PR Growth: $2.6B Mortgage & Retail Bank
o
US: $2.6B Commercial & Retail Bank
2.
Doral Recovery:
$1.9B Special Servicing Portfolio
o
PR Residential Mortgage & OREO
o
PR Commercial Loans & OREO
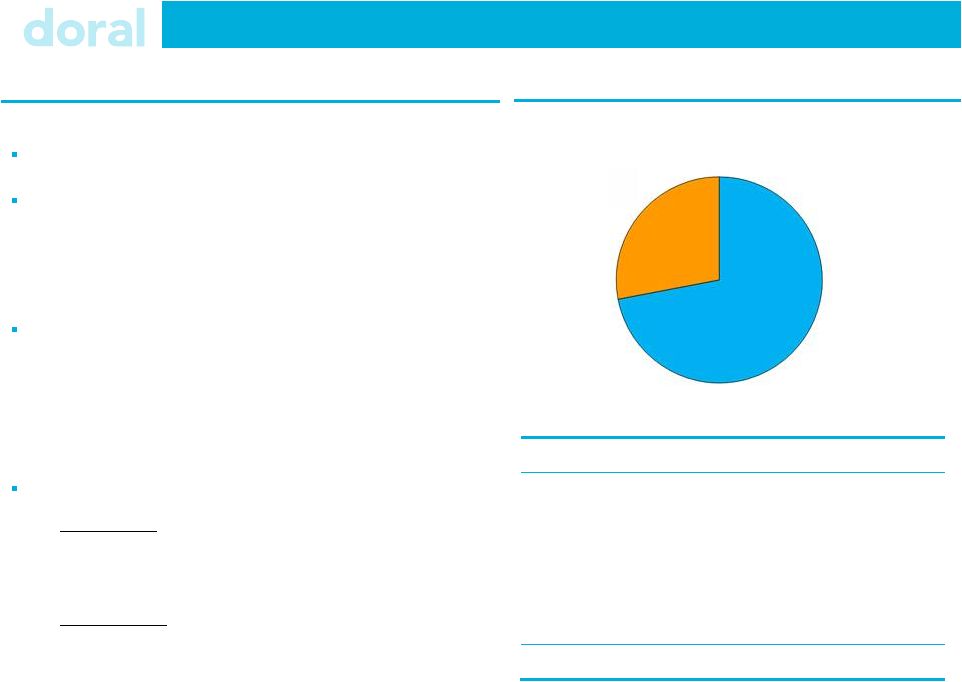
Loan Portfolio Composition ($6.7B)
Doral Growth
(73%)
Doral Recovery
(27%)
Loan Portfolio
$ MM
Loan Category
Growth
Recovery
Total
Residential
$2,310
$1,089
$3,399
CRE
691
490
1,181
C&I
1,537
118
1,655
Construction & Land
308
141
449
Consumer / Other
21
-
21
Total
$4,867
$1,838
$6,705 |
 5
Doral Operating Segments
Two Operating Segments: High Margin Bank & Special Servicing Group
Puerto Rico Mortgage & Retail Banking
o
$2.6B Residential Mortgage Portfolio
o
#2 Mortgage Originator in Puerto Rico
o
A $11.1B Mortgage Servicer
o
$1.7B of deposits
US Commercial & Retail Banking
o
$2.6B High NIM Specialty Commercial Lender
o
8 branches with $1.2B of deposits
62% of Loans are Performing.
$1.1B of Puerto Rico Residential Mortgages
o
TDRs and Defaulted Loans (180 days past due)
o
65% of loans are Performing
$0.7B of Puerto Rico Commercial Loans
o
CRE, Small Business and Construction & Land
o
58% of loans are Performing
$0.1B of OREO & Other
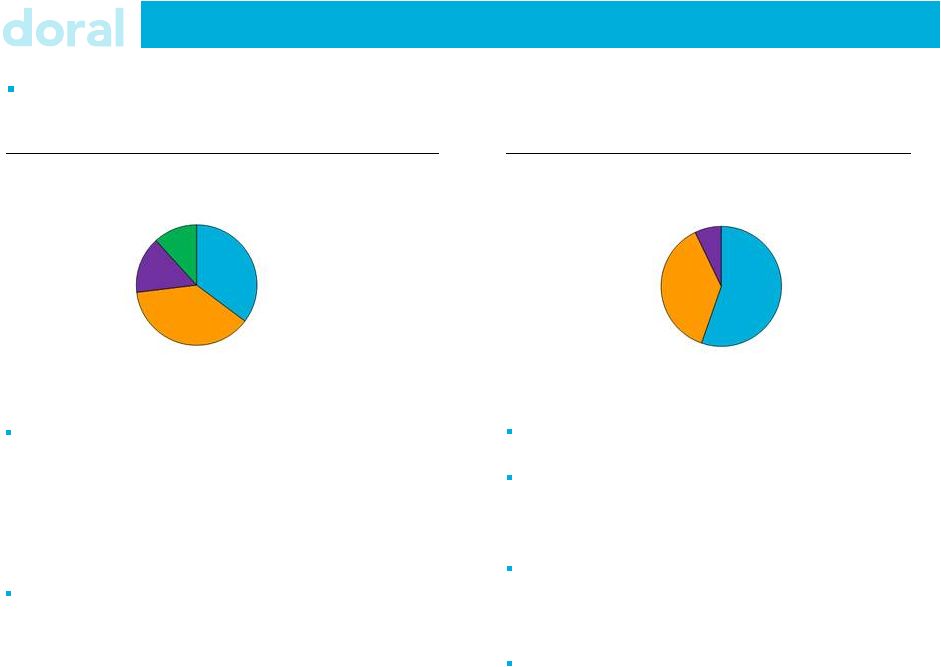
1. Doral Growth: A $6.6B Mortgage & Commercial Bank
2. Doral Recovery: A $1.9B Special Servicing Group
Puerto Rico Loans
(35%)
US Loans
(38%)
OREO & Other
(7%)
Cash & Securities
(16%)
Commercial
(39%)
Residential Mortgage
(54%)
Taxes & Other
(11%) |
 Q2
Results Net Loss ($MM)
2Q ’13
Net Interest Income
$50.5
Non Interest Income
16.8
Total Net Revenue
67.3
Non-Interest Expense
73.9
Pre-Tax, Pre-Provision Income
(6.6)
Credit Provision
5.5
Pre-Tax Income
(12.1)
Tax Expense (Benefit)
(1.8)
Reported Net Loss
$(10.4)
Ratios:
NIM (bps)
270
Average Assets
$8,418
Improved Net Loss by $2.0MM vs. Q1’13
NIM run-rate exceeds 300 bps
Non-Interest Income impacted by rate sensitive fair
value assets
Improved Q2 delinquency
Lower Q2 Provision on improved credit quality
6
Credit Provision Distribution by Reason
($MM)
Charge-off /
Valuation
Delinquency
Total
$5.7
$(0.2)
$5.5
1
includes correction of the loan modification process
o
~$5MM MSR and related hedge positions
o
~$3MM I/O
o
Doral Recovery: Significant improvement to non-performing
assets in both residential and commercial portfolios
o
PR Mortgage: Mature and stable $2.3B portfolio
o
US: Continued exceptional performance with less than
20 bps of delinquency
1 |
 Doral
Growth 7
Segment Results
1
Overview
Doral
Growth
generated
$10MM
in
Pre-Tax
Income
NIM remained strong at 340bps
Non-Interest Income declined as Quarter end rate
increases negatively impacted rate sensitive fair
value assets
Non-Interest Expense includes $2MM related to a
PR Revenue Tax implemented in Q2
Continued strong US growth
($MM)
2Q 13
Net Interest Income
$48.4
Non Interest Income
18.9
Total Net Revenue
67.3
Non-Interest Expense
56.8
Pre-Tax, Pre-Provision Income
10.5
Credit Provision
0.5
Pre-Tax Income
$10.0
Ratios:
NIM (bps)
340
Efficiency Ratio
84%
Average Assets
$6,461
Pre-Tax ROAA
0.7%
1
Includes Allocation of Administrative Expenses ( Corporate and Treasury)
(for additional details see exhibit B)
Loan Portfolio
$ MM
Loan Category
PR
US
Total
Residential
$2,299
$11
$2,310
CRE
1
690
691
C&I
13
1,524
1,537
Construction & Land
-
308
308
Consumer / Other
21
-
21
Total
$2,334
$2,533
$4,867
o
Loans increased by $202MM to $2.5B
o
Retail
deposits
grew
by
$237MM
to
$1,195MM |
 Doral
Recovery 8
Segment Results
($MM)
2Q 13
Net Interest Income
$2.0
Non Interest Income
(2.1)
Total Net Revenue
(0.1)
Non-Interest Expense
17.1
Pre-Tax, Pre-Provision Income
(17.2)
Credit Provision
5.0
Pre-Tax Income
$(22.2)
Ratios:
NIM (bps)
44
Average Assets
$1,957
Non-Performing Loans
$660
NPL %
38%
Overview
Net Loss improved by $5.2MM in the quarter
Lower provisions on stronger NPL performance
o
Q2 Provision driven by charge-off / valuation
adjustments
62% of Recovery Loans are Performing
o
65% of Mortgage loans are performing
o
58% of Commercial loans are performing
1
Includes Allocation of Administrative Expenses (Corporate and Treasury)
(for additional details see exhibit B)
Loan Portfolio
$ MM
Loan Category
Total
NPL
% NPL
Residential
$1,015
$360
35%
Commercial Real Estate
447
191
43%
Commercial
118
5
4%
Land & Construction
141
105
74%
Total
$1,721
$660
38%
2
NIM of 173 bps exclusive of correction of loan modification process
3
Excludes Loans HFS
1
2
3 |
 Asset
Quality 9
1
Excludes Loans Held for Sale & FHA / VA Loans
2
UPB-
Partial Charge Offs
3
Reflects correction of the loan modification process
4
Adjusted Coverage ratio, (ALLL+Partial Charge Offs)/UPB
NPL: Adjusted Coverage Ratios
$ MM
UPB
Partial Charge-Offs,
Deferred Fees and
Discounts
Recorded
Investment
ALLL
ALLL + Partial
Charge-Offs
Adjusted
Coverage
Ratio
4
Residential
478.4
68.7
409.7
80.8
149.5
31.3%
Commercial &
Consumer
435.9
132.1
303.7
31.7
163.8
37.5%
Total
$914.3
$200.8
$713.4
$112.5
$313.3
34.3%
Increased NPL Coverage Ratios to 34%
NPL & NPA: Q1 vs. Q2
NPL
NPA
$ MM
Q1
Q2
Change
Q1
Q2
Change
Residential
436.7
409.7
(27.0)
545.1
527.1
(18.0)
Commercial
337.8
303.7
(34.1)
386.7
350.4
(36.3)
Total
$774.5
$713.4
$(61.1)
$931.8
$877.5
$(54.3)
1
2
3
1
Recovery efforts drove a $54MM reduction in NPAs |
 10
Executive Summary
Doral Recovery efforts resulted in improved payment performance and lower NPAs
US operation provides attractive asset substitution opportunities
PR Mortgage franchise is a leader in fixed-rate, affordable mortgages
Opportunity to create additional value in PR Mortgage through simplification
Leverage ratio of 9% continues to be in excess of regulatory requirements
|
 Investor Relations Contact and Conference Replay Details
11
Investor Relations:
Christopher Poulton
212 / 329-3794
christopher.poulton@doralfinancial.com
Media:
Lucienne Gigante –
SVP Public Relations
787 / 474-6298
lucienne.gigante@doralbank.com
Conference Call:
10.00 AM EDT August 16, 2013
(800) 288-8968 or (612) 332-0345
Conference Call Replay:
August 16, 2013 –
September 16, 2013
(800) 475-6701 or (320) 365-3844
Replay Code: 299763 |
 Exhibits |
 Exhibit A –
Financial Summary
13
($ MM)
30-June-13
31-Mar-13
31-Dec-12
30-Sep-12
30-Jun-12
Income Statement
Net Interest Income
50.5
60.7
56.8
56.2
54.8
Provision for Credit Losses
5.5
18.7
21.3
34.4
5.2
NII After Provisions
45.0
42.0
35.5
21.8
49.6
Non-Interest Income
16.8
24.4
29.1
19.7
20.1
Non-Interest Expense
73.9
74.9
86.5
73.5
70.5
Pre-Tax Income
(12.1)
(8.5)
(21.9)
(32.0)
(0.8)
Taxes
(1.8)
3.9
(50.2)
0.5
0.8
Net Income
(10.4)
(12.4)
28.3
(32.5)
(1.6)
Pre-Tax Pre-Provision Income
(6.6)
10.2
(0.6)
2.4
4.4
Balance Sheet
Total Gross Loans (incl. HFS)
$6,705
$6,614
$6,613
$6,611
$6,487
Loan Loss Reserves
112
125
135
146
153
Total Deposits
4,972
4,783
4,629
4,614
4,538
Total Assets
8,521
8,369
8,479
8,371
8,345
Profitability Metrics
Net Interest Margin
2.70%
3.31%
2.97%
2.95%
2.95%
Capital & Credit Ratios
NPL
/
Loans
11.6%
12.6%
12.2%
11.5%
11.4%
Leverage Ratio
8.98%
9.26%
9.39%
9.32%
9.92%
1
Excludes Loans Held for Sale and Residential loans guaranteed by FHA / VA
1 |
 14
($ MM)
PR
US
Doral Growth
Recovery
Corporate
Treasury
Total
Income Statement
Net Interest Income
$25.7
$23.7
$49.4
$2.0
$(0.1)
$(0.9)
$50.5
Non-Interest Income
20.0
2.0
22.0
(2.1)
0.0
(3.1)
16.8
Total Net Revenue
45.7
25.7
71.4
(0.1)
(0.1)
(3.9)
67.3
Non-Interest Expense
36.8
12.4
49.2
14.7
8.7
1.3
73.9
Pre-Tax , Pre Provision Income
8.9
13.3
22.2
(14.8)
(8.8)
(5.3)
(6.6)
Credit Provision
(0.1)
0.6
0.5
5.0
0.0
0.0
5.5
Pre-Tax Income
$9.0
$12.7
$21.7
$(19.8)
$(8.8)
$(5.3)
$(12.1)
Allocation of Corporate & Treasury
Adjusted Revenue
(3.8)
0.0
0.1
3.9
0.0
Adjusted Non Interest Expense
7.6
2.4
(8.7)
(1.3)
0.0
Adjusted Pre-Tax Income
$10.0
$(22.2)
$0.0
$0.0
$(12.1)
Exhibit B –
Segment Reconciliation
1
Doral Growth is the sum of PR and US Segments
1 |