Attached files
| file | filename |
|---|---|
| 8-K - CURRENT REPORT OF MATERIAL EVENTS OR CORPORATE CHANGES - TIER REIT INC | a13-18729_18k.htm |
Exhibit 99.1
|
|
August 15, 2013 Quarterly Update Second Quarter 2013 |

|
|
Forward-Looking Statements This presentation contains forward-looking statements, including discussion and analysis of the financial condition of us and our subsidiaries and other matters. These forward-looking statements are not historical facts but are the intent, belief or current expectations of our management based on their knowledge and understanding of our business and industry. Words such as “may,” “anticipates,” “expects,” “intends,” “plans,” “believes,” “seeks,” “estimates,” “would,” “could,” “should” and variations of these words and similar expressions are intended to identify forward-looking statements. We intend that such forward-looking statements be subject to the safe harbor provisions created by Section 27A of the Securities Act of 1933 and Section 21E of the Securities Exchange Act of 1934. These statements are not guarantees of future performance and are subject to risks, uncertainties and other factors, some of which are beyond our control, are difficult to predict and could cause actual results to differ materially from those expressed or forecasted in the forward-looking statements. Forward-looking statements that were true at the time made may ultimately prove to be incorrect or false. We caution you not to place undue reliance on forward-looking statements, which reflect our management's view only as of the date of this presentation. We undertake no obligation to update or revise forward-looking statements to reflect changed assumptions, the occurrence of unanticipated events or changes to future operating results. |

|
|
Forward-Looking Statements Forward-looking statements that were true at the time made may ultimately prove to be incorrect or false. We caution you not to place undue reliance on forward-looking statements, which reflect our management's view only as of the date of this presentation. We undertake no obligation to update or revise forward-looking statements to reflect changed assumptions, the occurrence of unanticipated events or changes to future operating results. Factors that could cause actual results to differ materially from any forward-looking statements made in the presentation include but are not limited to: market and economic challenges experienced by the U.S. economy or real estate industry as a whole and the local economic conditions in the markets in which our properties are located; our ability to renew expiring leases and lease vacant spaces at favorable rates or at all; the inability of tenants to continue paying their rent obligations due to bankruptcy, insolvency or a general downturn in their business; the availability of cash flow from operating activities to fund distributions and capital expenditures; our ability to raise capital in the future by issuing additional equity or debt securities, selling our assets or otherwise, to fund our future capital needs; our ability to strategically dispose of assets on favorable terms; our level of debt and the terms and limitations imposed on us by our debt agreements; our ability to retain our executive officers and other key personnel; the increase in our direct overhead, as a result of becoming a self-managed company; conflicts of interest and competing demands faced by certain of our directors; limitations on our ability to terminate our property management agreement and certain services under our administrative services agreement; unfavorable changes in laws or regulations impacting our business or our assets; and factors that could affect our ability to qualify as a real estate investment trust. The forward-looking statements should be read in light of these and other risk factors identified in the “Risk Factors” section of our 2012 Annual Report on Form 10-K for the year ended December 31, 2012, as filed with the Securities and Exchange Commission. |

|
|
TIERREIT.COM |

|
|
Portfolio Characteristics Represents our pro rata ownership share S. Wacker - Chicago, IL June 2013 December 2012 Operating properties 44 50 Square feet(1) 17.2 million 18.9 million Occupancy(1) 87% 86% Markets 22 26 |

|
|
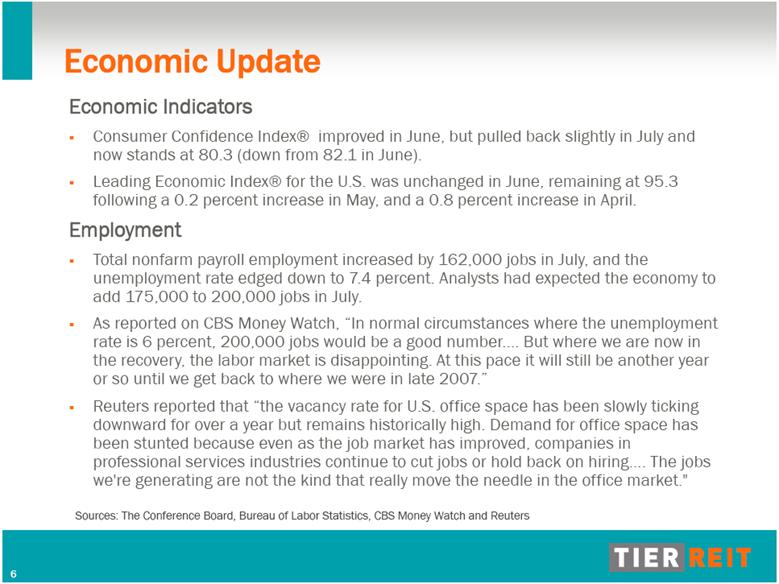
Economic Update Economic Indicators Consumer Confidence Index® improved in June, but pulled back slightly in July and now stands at 80.3 (down from 82.1 in June). Leading Economic Index® for the U.S. was unchanged in June, remaining at 95.3 following a 0.2 percent increase in May, and a 0.8 percent increase in April. Employment Total nonfarm payroll employment increased by 162,000 jobs in July, and the unemployment rate edged down to 7.4 percent. Analysts had expected the economy to add 175,000 to 200,000 jobs in July. As reported on CBS Money Watch, “In normal circumstances where the unemployment rate is 6 percent, 200,000 jobs would be a good number But where we are now in the recovery, the labor market is disappointing. At this pace it will still be another year or so until we get back to where we were in late 2007.” Reuters reported that “the vacancy rate for U.S. office space has been slowly ticking downward for over a year but remains historically high. Demand for office space has been stunted because even as the job market has improved, companies in professional services industries continue to cut jobs or hold back on hiring. The jobs we're generating are not the kind that really move the needle in the office market." Sources: The Conference Board, Bureau of Labor Statistics, CBS Money Watch and Reuters |
|
|
Economic Update – Post-Recession Employment Slowly Recovering Source: calculatedriskblog.com |

|
|
2013 Accomplishments (through 2Q 2013) Manage capital resources Reported $33.2 million of MFFO* year to date thru June 30, an increase from $20.8 million for the same period 2012 Achieved year to date savings from internalization of approximately $6.9 million Achieved year-over-year same store cash NOI* growth of 8.2% thru June 30 Increased unrestricted cash from $9.7 million at December 31 to $36.2 million at June 30 Recapitalize or dispose of remaining troubled assets Recapitalized Paces West (Atlanta, GA), retaining a 10% non-controlling interest Completed the sale of Alexander Road (Princeton, NJ) Disposed of Knoxville, TN and Wichita, KS properties Sharpen geographic focus Completed the sale of 5&15 Wayside (Burlington, MA) for a sales price of $69.3 million *Reconciliations of net income (loss) to MFFO attributable to common stockholders and same store cash NOI are contained in the Current Report on Form 8-K that was filed on August 15, 2013. |

|
|
2013 Accomplishments (through 2Q 2013 cont.) Lease the portfolio and increase occupancy Leased 1,357,000 square feet year to date thru June 30, including 626,000 square feet of renewal leasing and 731,000 square feet of new and expansion leasing Achieved rental rates 1.4% above expiring leases overall and 4.6% above expiring leases at our core properties Achieved positive net absorption of 160,000 square feet year to date and increased occupancy from 86% at December 2012 to 87% at June 2013 Strengthen the balance sheet Refinanced the Wanamaker Building, lowering the interest rate from 5.38% to 3.83% Reduced our debt balance (at ownership share) from $2.17 billion at December 31 to $2.03 billion at June 30 Reduced our debt as a percentage of our December 2012 real estate value from 64.4% at December 31 to 63.0% at June 30 |

|
|
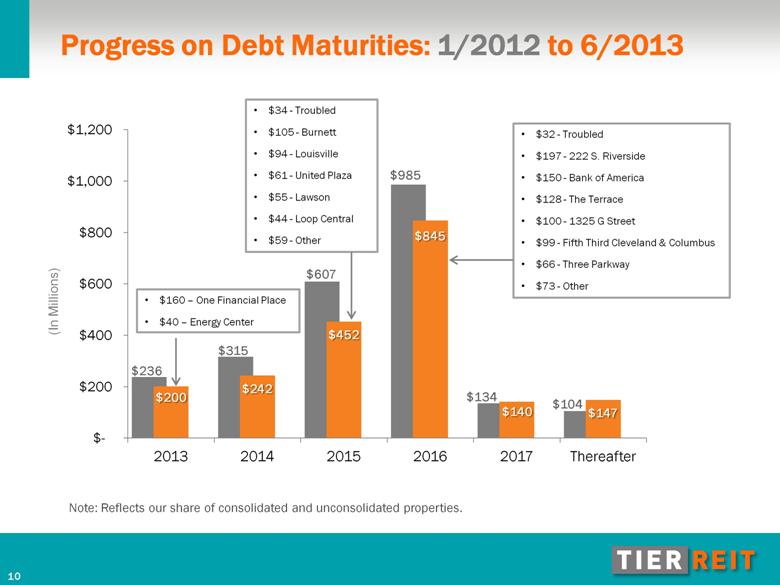
Progress on Debt Maturities: 1/2012 to 6/2013 (In Millions) $32 - Troubled $197 - 222 S. Riverside $150 - Bank of America $128 - The Terrace $100 - 1325 G Street $99 - Fifth Third Cleveland & Columbus $66 - Three Parkway $73 - Other Note: Reflects our share of consolidated and unconsolidated properties. $34 - Troubled $105 - Burnett $94 - Louisville $61 - United Plaza $55 - Lawson $44 - Loop Central $59 - Other $160 – One Financial Place $40 – Energy Center |
|
|
Portfolio Characteristics – Core and Non-Core Properties As of June 30, 2013: Core Properties 23 operating properties 12.8 million square feet(1) 10 Markets 90% of estimated value 88% occupancy(1) 79% CBD(2) 60% leverage Non-Core Properties 21 operating properties 4.4 million square feet(1) 12 Markets 10% of estimated value 82% occupancy(1) 29% CBD(2) 77% leverage Represents our pro rata ownership share (2) Based on square feet at our pro rata ownership share |

|
|
Top Nine Markets – By Percent of Total Net Operating Income* *Represents NOI generated during the three months ended June 30, 2013, by properties owned as of June 30, 2013. |

|
|
Top Nine Markets - Occupancy Trends Market December 2012 June 2013 Change from December 2012 to June 2013 Austin, TX 67% 80% +13% Louisville, KY 78% 84% +6% Dallas/Ft. Worth, TX 88% 92% +4% Houston, TX 91% 92% +1% Chicago, IL 85% 86% +1% Philadelphia, PA 93% 92% -1% Charlotte, NC 93% 92% -1% Baltimore, MD 92% 86% -6% Washington, D.C. 84% 70% -14% |

|
|
Leasing Cost Analysis – Second Quarter 2013 Total of $10.6 million in leasing costs Renewals 167,000 square feet $1.1 million, or $2.09 per square foot per year of lease term, in tenant improvement and commission costs 3.1 year average term Expansions 68,000 square feet $1.2 million, or $4.63 per square foot per year of lease term, in tenant improvement and commission costs 3.8 year average term New leases 247,000 square feet $8.3 million, or $4.69 per square foot per year of lease term, in tenant improvement and commission costs 7.2 year average term Note: These figures include our pro rata share of leasing activity at all properties. Buena Vista Plaza – Burbank, CA |

|
|
Funds from Operations (FFO*) and Modified Funds from Operations (MFFO*) FFO attributable to common stockholders for the second quarter 2013 was $27.6 million, or $0.09 per diluted share MFFO attributable to common stockholders for the second quarter 2013 was $17.1 million, or $0.06 per diluted share, and excludes the following non-cash items: $5.6 million net gain on troubled debt restructuring and early extinguishment of debt $2.5 million straight-line rent adjustment $2.4 million amortization of rent intangibles *Reconciliations of net income (loss) to FFO and MFFO attributable to common stockholders are contained in the Current Report on Form 8-K that was filed on August 15, 2013. |

|
|
Six months ended June 2013 vs. six months ended June 2012 Same store cash NOI* for year to date 2013 was $98.9 million Increased $7.5 million, or 8.2%, as compared to year to date 2012 due to: Increase in revenue of $10.1 million primarily due to: increased base rent tenants transitioning from free rent into cash paying rent phase of leases increased recoveries Increase in expenses of $2.6 million primarily due to: Increased property operating expense, partially offset by reduction in bad debt expense Same Store Results *Reconciliations of net income (loss) to same store cash NOI are contained in the Current Report on Form 8-K that was filed on August 15, 2013. |

|
|
Second quarter 2013 vs. second quarter 2012 Same store cash NOI* for second quarter 2013 was $50.1 million Increased $2.3 million, or 4.8%, as compared to second quarter 2012 primarily due to: increased base rent tenants transitioning from free rent into cash paying rent phase of leases increased recoveries partially offset by increased property operating and real estate tax expense Second quarter 2013 vs. first quarter 2013 Same store cash NOI* for second quarter 2013 was $50.1 million Increased $1.3 million, or 2.6%, as compared to first quarter 2013 primarily due to: tenants transitioning from free rent into cash paying rent phase of leases increased recoveries partially offset by increased real estate tax expense Same Store Results *Reconciliations of net income (loss) to same store cash NOI are contained in the Current Report on Form 8-K that was filed on August 15, 2013. |

|
|
Objectives and Key Areas of Focus Objectives Maximize stockholder value Lay the groundwork for distributable cash flow Create liquidity for our stockholders Key Areas of Focus – 2013 to 2015 Manage capital resources Lease the portfolio and increase occupancy to 90% or more Recapitalize or dispose of remaining troubled assets Sharpen geographic focus Decrease ownership in select core markets Strengthen the balance sheet by reducing our leverage to approximately 50% Maintain a well-respected management team |

|
|
Playback Information Stockholders should call toll free (855) 859-2056 and use passcode 97807520 for a playback of today’s call An audio link for a playback of today’s call will be on our website at www.tierreit.com/ir Today’s presentation is available on our website at www.tierreit.com/ir under the heading ‘SEC Filings’ in the Form 8-K filing made today Save the date! TIER REIT’s third quarter conference call will be held on November 19, 2013. Please check our website for details, and sign up at www.tierreit.com/ir for conference call information and other timely communications |

|
|
Questions |

|
|
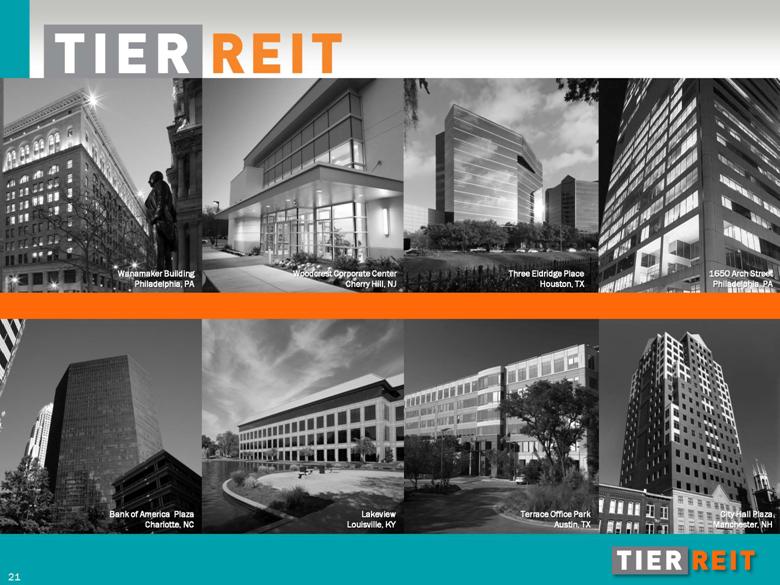
Wanamaker Building Philadelphia, PA Woodcrest Corporate Center Cherry Hill, NJ 1650 Arch Street Philadelphia, PA Three Eldridge Place Houston, TX City Hall Plaza Manchester, NH Terrace Office Park Austin, TX Lakeview Louisville, KY Bank of America Plaza Charlotte, NC |
|
|
Playback Information Stockholders should call toll free (855) 859-2056 and use passcode 97807520 for a playback of today’s call An audio link for a playback of today’s call will be on our website at www.tierreit.com/ir Today’s presentation is available on our website at www.tierreit.com/ir under the heading ‘SEC Filings’ in the Form 8-K filing made today Save the date! TIER REIT’s third quarter conference call will be held on November 19, 2013. Please check our website for details, and sign up at www.tierreit.com/ir for conference call information and other timely communications |
