Attached files
| file | filename |
|---|---|
| 8-K - CURRENT REPORT - ANGIODYNAMICS INC | an28594426-8k.htm |
EXHIBIT 99.1
Mark Frost, Executive Vice President and CFO August 2013 AngioDynamics, the AngioDynamics logo and other trademarks displayed In this presentation are trademarks owned and used by AngioDynamics, Inc. © Copyright 2012 AngioDynamics, Inc. All rights reserved.

* FORWARD-LOOKING STATEMENTS Notice Regarding Forward Looking Statements This presentation contains forward-looking statements within the meaning of the Private Securities Litigation Reform Act of 1995. All statements regarding AngioDynamics’ expected future financial position, results of operations, cash flows, business strategy, budgets, projected costs, capital expenditures, products, competitive positions, growth opportunities, plans and objectives of management for future operations, as well as statements that include the words such as “expects,” “reaffirms” “intends,” “anticipates,” “plans,” “believes,” “seeks,” “estimates,” “optimistic,” or variations of such words and similar expressions, are forward-looking statements. These forward looking statements are not guarantees of future performance and are subject to risks and uncertainties. Investors are cautioned that actual events or results may differ from AngioDynamics’ expectations. Factors that may affect the actual results achieved by AngioDynamics include, without limitation, the ability of AngioDynamics to develop its existing and new products, technological advances and patents attained by competitors, future actions by the FDA or other regulatory agencies, domestic and foreign health care reforms and government regulations, results of pending or future clinical trials, overall economic conditions, the results of on-going litigation, the effects of economic, credit and capital market conditions, general market conditions, market acceptance, foreign currency exchange rate fluctuations, the effects on pricing from group purchasing organizations and competition, the ability of AngioDynamics to integrate purchased businesses, as well as the risk factors listed from time to time in AngioDynamics’ SEC filings, including but not limited to its Annual Report on Form 10-K for the year ended May 31, 2013. AngioDynamics does not assume any obligation to publicly update or revise any forward-looking statements for any reason. In the United States, NanoKnife has been cleared by the FDA for use in the surgical ablation of soft tissue. NanoKnife has not been cleared for the treatment or therapy of a specific disease or condition. This document may discuss the use of NanoKnife for specific clinical indications for which it is not cleared in the United States at this time. Notice Regarding Non-GAAP Financial Measures Management uses non-GAAP measures to establish operational goals, and believes that non-GAAP measures may assist investors in analyzing the underlying trends in AngioDynamics’ business over time. Investors should consider these non-GAAP measures in addition to, not as a substitute for or as superior to, financial reporting measures prepared in accordance with GAAP. In this presentation, AngioDynamics has reported non-GAAP sales growth, non-GAAP gross margin, non-GAAP operating income, adjusted EBITDA (income before interest, taxes, depreciation and amortization), non-GAAP net income and non-GAAP earnings per share. Management uses these measures in its internal analysis and review of operational performance. Management believes that these measures provide investors with useful information in comparing AngioDynamics’ performance over different periods. By using these non-GAAP measures, management believes that investors get a better picture of the performance of AngioDynamics’ underlying business. Management encourages investors to review AngioDynamics’ financial results prepared in accordance with GAAP to understand AngioDynamics’ performance taking into account all relevant factors, including those that may only occur from time to time but have a material impact on AngioDynamics’ financial results. Please see the tables that follow for a reconciliation of non-GAAP measures to measures prepared in accordance with GAAP.

* ANGIODYNAMICS AT A GLANCE Corporate History Founded 1988 | IPO May 2004 | ANGO (NASDAQ) Acquired Microsulis (2013) | Vortex Medical (2012) Navilyst (2012) | Oncobionic (2008) | RITA Medical (2007) Worldwide Presence Albany NY – HQ | 1,400 Employees | 7 Operating Locations

* Strategic Imperatives b A NEW DAY FOR ANGIODYNAMICS Vascular Access VA Peripheral Vascular PV Oncology/ Surgery O/S BioFlo as a platform technology Advanced techniques & procedures New technologies Automated fluid management Thrombolysis/thrombectomy/PE Comprehensive venous strategy NanoKnife standard-of-care Thermal ablation Interventional oncology Three Global Businesses Focused on Innovation Develop innovative, differentiated and high quality products for clinicians and patients Focus our investments in product categories and geographic markets that offer sustainable, profitable growth Enhance our profitability by driving operation excellence across the entire organization Grow revenues 8-10% Long-term Objectives Grow earnings at a mid teens rate Recognized globally as a leading provider of innovative, image guided, minimally invasive solutions.

5 Fluid Mgmt PICCs Other PV 65% YoY Sales Growth EVLT Ports 0% 5% 10% 15% 20% 40% +50% HARVEST FIX INVEST SCALE Microwave IRE RFA Resection Other VA AngioVac Std GM% FY 2013: Flat Sales; 50% GM% (10%) (5%) Transformation to a Double-Digit Growth Company HIGH LOW

6 Ports 0% 5% 10% 15% 20% +50% YoY Sales Growth 40% EVLT AngioVac 65% IRE Resection Other VA Other PV Fluid Mgmt Dialysis Microwave Std GM% PICCs RFA Long-Term: 10% Sales Growth; 60% GM% Transformation to a Double-Digit Growth Company (10%) (5%) HIGH LOW

* PERIPHERAL VASCULAR BUSINESS Reinvigorate NAMIC Build Thrombus Management Grow Core PV Peripheral Vascular AngioVac Adoption Channel Synergy Fluid Management in IR/Vascular Venous Ablation in Cardiology Core Products in Cardiology Automated Power Injector (API) Strategic Objectives Key Growth Drivers $1.3B Market 18% Share Fluid Management Thrombus Management Varicose Vein Ablation Angiographic/Drainage Catheters Global Net Sales $ in millions FY13 Fluid Mgmt $81 VenaCure EVLT $46 AngioVac $2 Core Products $51 Total PV $180 Expand EVLT Adoption

8 Additional: Annual Incidence Venous Thromboembolism (VTE) Incidence Overall ~1 Million VTE Events per Year in US Overall 300,000 VTE Deaths per Year in US - #3 cause Heit JA, et al. Blood. 2005; 106:267A. Murphy SL, et al. Deaths: Preliminary Data for 2010. National Vital Statistics Reports; 2012 Catheter/Lead RA 200,000 RA Mass 47,000 IVCF Thrombosis 14,000 TV Endocarditis 2,500 The Opportunity

* PV AngioVac Procedure Strong IP Distinct product FDA cleared with 625+ cases to date Attractive pricing & higher margins Scalable platform for next generation devices Large, established unmet opportunity

10 Extended learning curve Long set up time Lack of flow restriction indicator Uncontrolled contrast dosage to the patient Contrast use and waste per procedure Unreliable hemodynamics readings Greater control Reduced per procedure costs Provide greater protection and safety NAMIC Duet Key Features and Benefits Current market concerns that the NAMIC API will address: Additional solutions provided by NAMIC API

* VENACURE EVLT PV The Power of Water… 30M People in U.S. w/ varicose veins Large Underpenetrated Market Opportunity <2% Receive treatment $240 million Global market, with 3-5% CAGR 140,000+ VenaCure EVLT procedures in FY2013 ANGO has 27% share of Venous Ablation market and 54% share of the Laser Ablation market Installed base of 4,000 units WW, including 500 new 1470 lasers since launch in June 2011 Less focal charring of vein wall Reduced perforations Enhanced trackability Faster procedure time Advantages of NeverTouch Direct

* VASCULAR ACCESS BUSINESS Penetrate & Convert BIOFLO BIOFLO BIOFLO VA Vascular Access BioFlo PICCs BioFlo Ports & BioFlo Dialysis Catheters 510(k)s planned for FY14 Tip Location Distribution agreement Penetration of IDNs/GPOs Strategic Objectives Key Growth Drivers $1.0B Market 12% Share PICC Lines Implantable Ports Dialysis & Renal Infusion Global Net Sales $ in millions FY13 PICCs $52 Ports $31 Dialysis/Other $24 Total VA $107 Grow Int’l from 10% to 25% of revenue
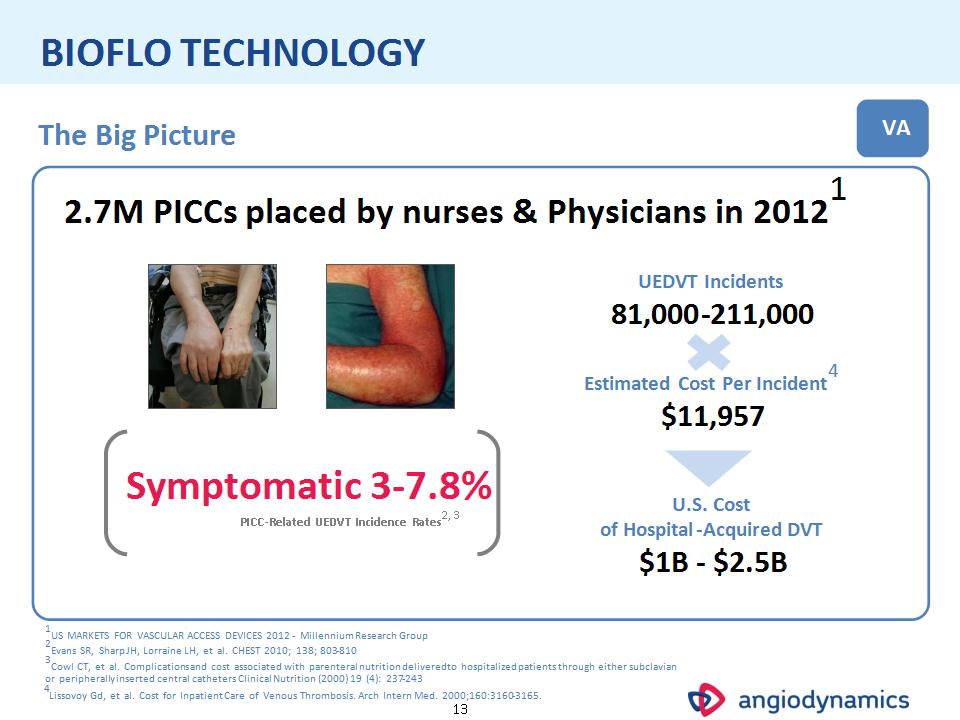
* BIOFLO TECHNOLOGY Estimated Cost Per Incident4 $11,957 PICC-Related UEDVT Incidence Rates2, 3 VA 2.7M PICCs placed by nurses & Physicians in 20121 The Big Picture 2Evans SR, Sharp JH, Lorraine LH, et al. CHEST 2010 ; 138; 803-810 1US MARKETS FOR VASCULAR ACCESS DEVICES 2012 - Millennium Research Group U.S. Cost of Hospital-Acquired DVT $1B – $2.5B 4Lissovoy Gd, et al. Cost for Inpatient Care of Venous Thrombosis. Arch Intern Med. 2000; 160: 3160-3165. Symptomatic 3-7.8% 3Cowl CT, et al. Complications and cost associated with parenteral nutrition delivered to hospitalized patients through either subclavian or peripherally inserted central catheters Clinical Nutrition (2000) 19 (4): 237-243 UEDVT Incidents 81,000-211,000

* Coatings (on the surface) Impregnated (in the pores) Current Next Generation PICC Technologies NO HEPARIN NO ANTIBIOTICS NOT A COATING NOT ELUTING Minimizes complications associated w/ heparin Reduces risks associated w/ bacterial resistance Present throughout entire catheter Present for life of device Unlike other technologies that are superficial and/or transient, BioFlo is designed to be both integral to the catheter and permanent The BioFlo™ Advantage… VA NOTE: BioFlo has been cleared in the U.S., approved in Canada, and CE Marked in Europe A Revolutionary PICC Technology… BIOFLO TECHNOLOGY (cont’d)

* BIOFLO TECHNOLOGY (cont’d) VA 2Presented at INS May 21, 2013. 1Presented at Ohio Association for Healthcare Quality conference on May 17, 2013. Prospective Customer Evaluation of BioFlo Hospital BioFlo PICC Placements (6 months) DVTs DVT RATE Hillcrest1 276 0 0 Cleveland Clinic2 373 1 0.2% Preliminary Retrospective Analysis BARD PowerPICC Solo2® vs. BioFlo with PASV PICC Metric PowerPICC Solo 2 BioFlo w/ PASV PICCs Placed 60 133 Occlusion Rate 9.63/1,000 catheter days 4.96/1,000 catheter days T-PA Usage Rate 12.84 doses/1,000 catheter days 7.93 doses/1,000 catheter days DVT Rate 0.80/1,000 catheter days 0.50/1,000 catheter days Impact of BioFlo 48% reduction in occlusions 38% reduction in t-PA use 37% reduction in DVT NOTE: Preliminary retrospective data analysis conducted outside the U.S. by I ndependent I nvestigator. BioFlo has been cleared in the U.S., approved in Canada, and CE Marked in Europe.
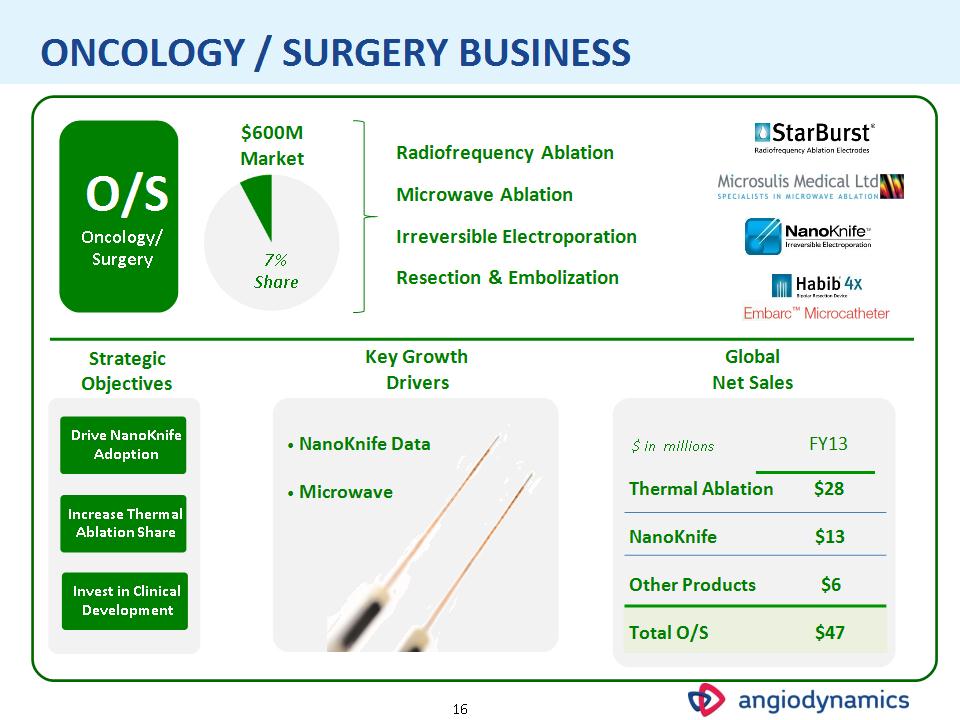
* ONCOLOGY / SURGERY BUSINESS Drive NanoKnife Adoption Increase Thermal Ablation Share NanoKnife Data Microwave Strategic Objectives Key Growth Drivers Global Net Sales Invest in Clinical Development O/S Oncology/ Surgery $600M Market Radiofrequency Ablation Microwave Ablation Irreversible Electroporation Resection & Embolization 7% Share $ in millions FY13 Thermal Ablation $28 NanoKnife $13 Other Products $6 Total O/S $47

17 Microsulis We believe Microsulis is the leading microwave tumor ablation technology on the market today “Everything we wanted in a microwave device…” -Current AngioDynamics RFA Customer 2.45Ghz system for faster tissue penetration Single applicator 5 cm ablation Fast ablation times Predictable volumes of coagulation Attractive pricing and gross margins
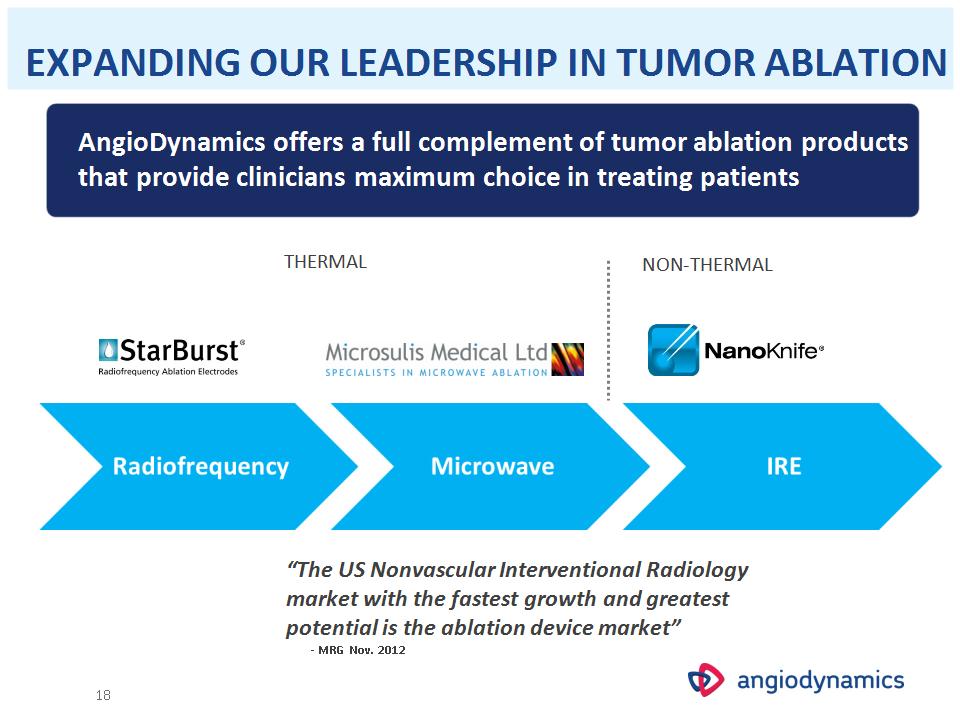
18 AngioDynamics offers a full complement of tumor ablation products that provide clinicians maximum choice in treating patients THERMAL NON-THERMAL “The US Nonvascular Interventional Radiology market with the fastest growth and greatest potential is the ablation device market” – MRG Nov. 2012 EXPANDING OUR LEADERSHIP IN TUMOR ABLATION

* $10M in FY13 savings achieved & at least $15 million in FY14 planned Organizational changes completed Management team now in place – best talent from both organizations New CFO New Chief Tech/Ops Officer Creation of three global businesses to achieve greater focus on customers and markets NAVILYST INTEGRATION New Head of Quality New Head of Regulatory Announcement Jan 31, 2012 FY14 ERP Implementation Functional shared service consolidation Accelerating ops excellence activities Lean Supply Chain FY13 Synergies ahead of $5-7M plan R&D organization changes implemented Quality organization/process revamped Sales/Mktg organization course correction completed Robust product pipeline established New Head of Queensbury Manuf. New Medical Director
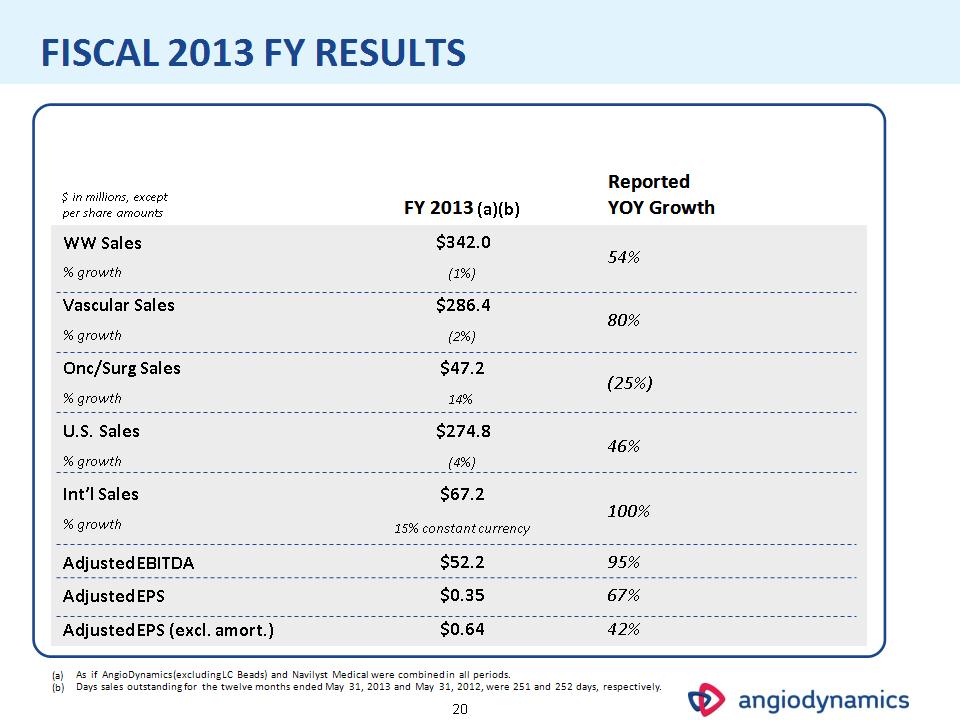
* FISCAL 2013 FY RESULTS $ in millions, except per share amounts FY 2013 (a)(b) Reported YOY Growth WW Sales $342.0 54% % growth (1%) 54% Vascular Sales $286.4 80% % growth (2%) 80% Onc/Surg Sales $47.2 (25%) % growth 14% (25%) U.S. Sales $274.8 46% % growth (4%) 46% Int’l Sales $67.2 100% % growth 15% constant currency 100% Adjusted EBITDA $52.2 95% Adjusted EPS $0.35 67% Adjusted EPS (excl. amort.) $0.64 42% As if AngioDynamics (excluding LC Beads) and Navilyst Medical were combined in all periods. Days sales outstanding for the twelve months ended May 31, 2013 and May 31, 2012, were 251 and 252 days, respectively.

* FISCAL 2014 GUIDANCE $ in millions, except per share amounts Adjusted Non-GAAP Q1 Adjusted Non-GAAP Full Year Sales $81 — $84 $346 — $352 EBITDA (a) (b) N/A $52 — $54 EPS (c) $0.02 — $0.04 $0.31 — $0.35 EPS (c) (d) $0.10 — $0.12 $0.61 — $0.65 Adjusted result reflects an estimated $7 million in acquisition-related and restructuring costs and $3 million of purchase accounting expenses. $17 million in amortization, $9 million in depreciation, and $3 million in purchase accounting expenses related to Vortex Medical and Microsulis acquisitions are excluded. Approximately 36 million diluted shares outstanding and a 37% tax rate. Excluding amortization for intangible assets
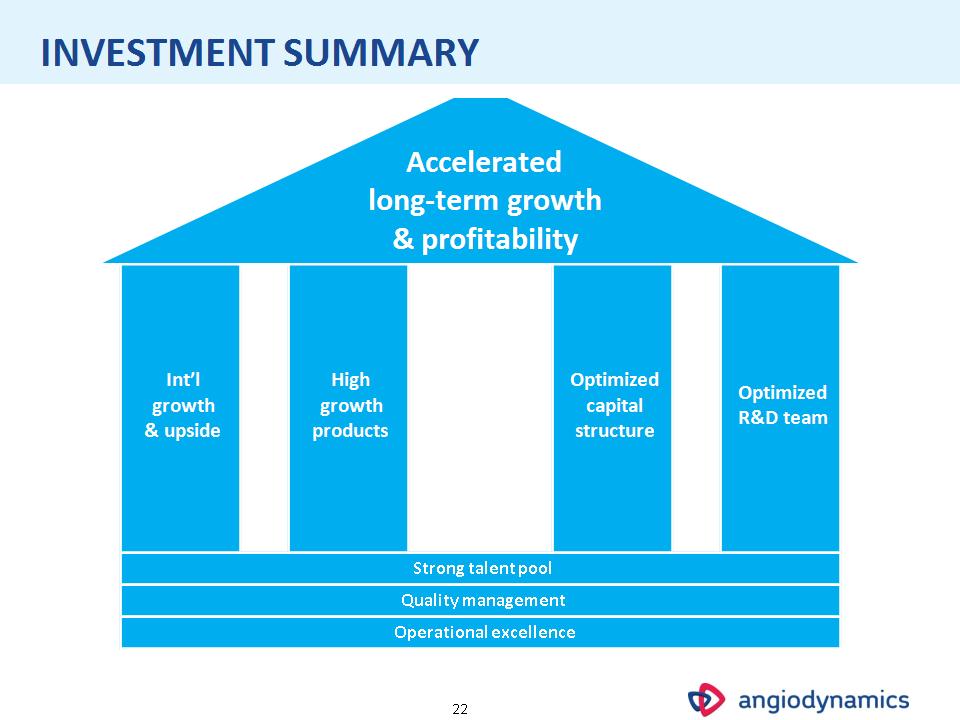
* Int’l growth & upside High growth products Optimized capital structure Optimized R&D team INVESTMENT SUMMARY Accelerated long-term growth & profitability Strong talent pool Quality management Operational excellence

AngioDynamics, the AngioDynamics logo and other trademarks displayed in this presentation are trademarks owned and used by AngioDynamics, Inc. © Copyright 2012 AngioDynamics, Inc. All rights reserved.
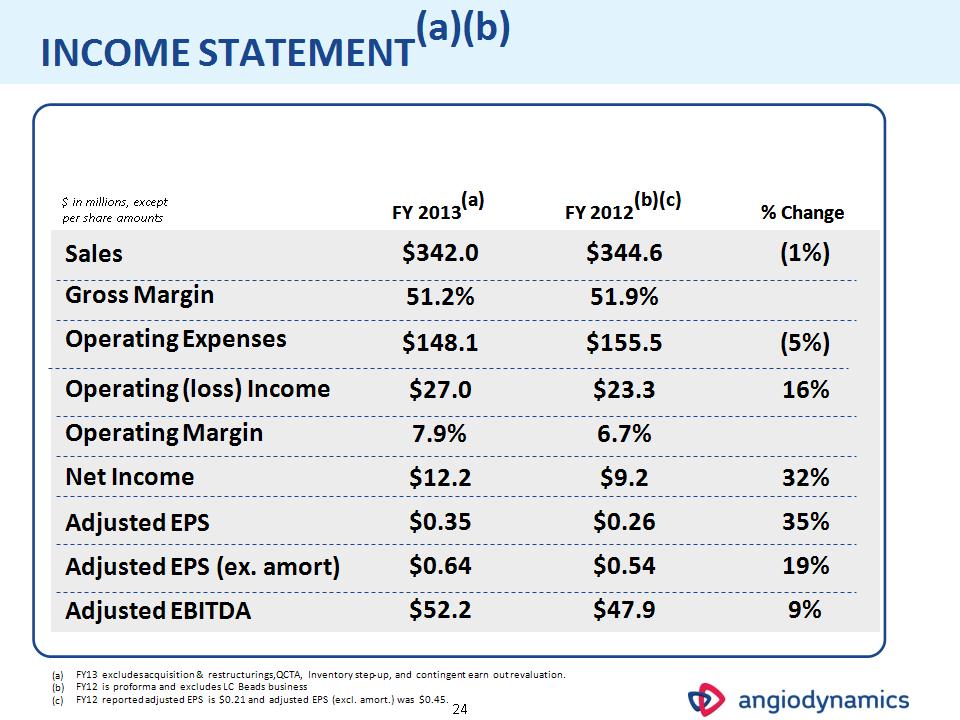
* $ in millions, except per share amounts FY 2013(a) FY 2012(b)(c) % Change Sales $342.0 $344.6 (1%) Gross Margin 51.2% 51.9% Operating Expenses $148.1 $155.5 (5%) Operating (loss) Income $27.0 $23.3 16% Operating Margin 7.9% 6.7% Net Income $12.2 $9.2 32% Adjusted EPS $0.35 $0.26 35% Adjusted EPS (ex. amort) $0.64 $0.54 19% Adjusted EBITDA $52.2 $47.9 9% FY13 excludes acquisition & restructurings, QCTA, Inventory step-up, and contingent earn out revaluation. FY12 is proforma and excludes LC Beads business FY12 reported adjusted EPS is $0.21 and adjusted EPS (excl. amort.) was $0.45. INCOME STATEMENT(a)(b)

* $ in millions FY 2013 FY 2012 Cash and investments $24.0 $40.1 Net working capital $77.8 $103.8 Total assets $791.9 $721.8 Total debt $142.5 $150.0 Total stockholders’ equity $526.8 $523.5 BALANCE SHEET AND CASH FLOW $ in millions, except per share amounts Cash flow from operations $26.3 $11.5 CFFO/share $0.74 $0.45 Free cash flow $14.8 $9.0