Attached files
| file | filename |
|---|---|
| 8-K - FORM 8-K - TRANSATLANTIC PETROLEUM LTD. | v352850_8k.htm |
The 2013 Oil & Gas Conference August 14, 2013
FORWARD LOOKING STATEMENTS Outlooks, projections, estimates, targets and business plans in this presentation or any related subsequent discussions are forward - looking statements . Actual future results, including TransAtlantic Petroleum Ltd . ’s own production growth and mix ; financial results ; the amount and mix of capital expenditures ; resource additions and recoveries ; finding and development costs ; project and drilling plans, timing, costs, and capacities ; revenue enhancements and cost efficiencies ; industry margins ; margin enhancements and integration benefits ; and the impact of technology could differ materially due to a number of factors . These include market prices for natural gas, natural gas liquids and oil products ; estimates of reserves and economic assumptions ; the ability to produce and transport natural gas, natural gas liquids and oil ; the results of exploration and development drilling and related activities ; economic conditions in the countries and provinces in which we carry on business, especially economic slowdowns ; actions by governmental authorities, receipt of required approvals, increases in taxes, legislative and regulatory initiatives relating to fracture stimulation activities, changes in environmental and other regulations, and renegotiations of contracts ; political uncertainty, including actions by insurgent groups or other conflict ; the negotiation and closing of material contracts ; shortages of drilling rigs, equipment or oilfield services ; and other factors discussed here and under the heading “Risk Factors" in our Annual Report on Form 10 - K for the year ended December 31 , 2012 and our Quarterly Report on Form 10 - Q for the three months ended June 30 , 2013 , which are available on our website at www . transatlanticpetroleum . com and www . sec . gov . See also TransAtlantic’s audited financial statements and the accompanying management discussion and analysis . Forward - looking statements are based on management’s knowledge and reasonable expectations on the date hereof, and we assume no duty to update these statements as of any future date . The information set forth in this presentation does not constitute an offer, solicitation or recommendation to sell or an offer to buy any securities of the Company . The information published herein is provided for informational purposes only . The Company makes no representation that the information and opinions expressed herein are accurate, complete or current . The information contained herein is current as of the date hereof, but may become outdated or subsequently may change . Nothing contained herein constitutes financial, legal, tax, or other advice . The SEC has generally permitted oil and gas companies, in their filings with the SEC, to disclose only proved reserves that a company has demonstrated by actual production or conclusive formation tests to be economically and legally producible under existing economic and operating conditions . We may use the terms “estimated ultimate recovery,” “EUR,” “probable,” “possible,” and “non - proven” reserves, “prospective resources” or “upside” or other descriptions of volumes of resources or reserves potentially recoverable through additional drilling or recovery techniques that the SEC’s guidelines may prohibit us from including in filings with the SEC . These estimates are by their nature more speculative than estimates of proved reserves and accordingly are subject to substantially greater risk of actually being realized by the Company . There is no certainty that any portion of estimated prospective resources will be discovered . If discovered, there is no certainty that it will be commercially viable to produce any portion of the estimated prospective resources . Boe (barrel of oil equivalent) is derived by converting natural gas to oil in the ratio of six thousand cubic feet (Mcf) of natural gas to one barrel (bbl) of oil . Boe may be misleading, particularly if used in isolation . A BOE conversion ratio of 6 Mcf : 1 bbl is based on an energy equivalency conversion method primarily applicable at the burner tip and does not represent a value equivalency at the wellhead . 2

INVESTMENT THESIS • Significantly increasing drilling activity in 2H13 • Capital deployed on most favorable projects • Three - part strategy in Turkey provides clear path to grow production and cash flow • Resuming activity in Bulgaria with new partner • Expert team in place to execute capital plan 3
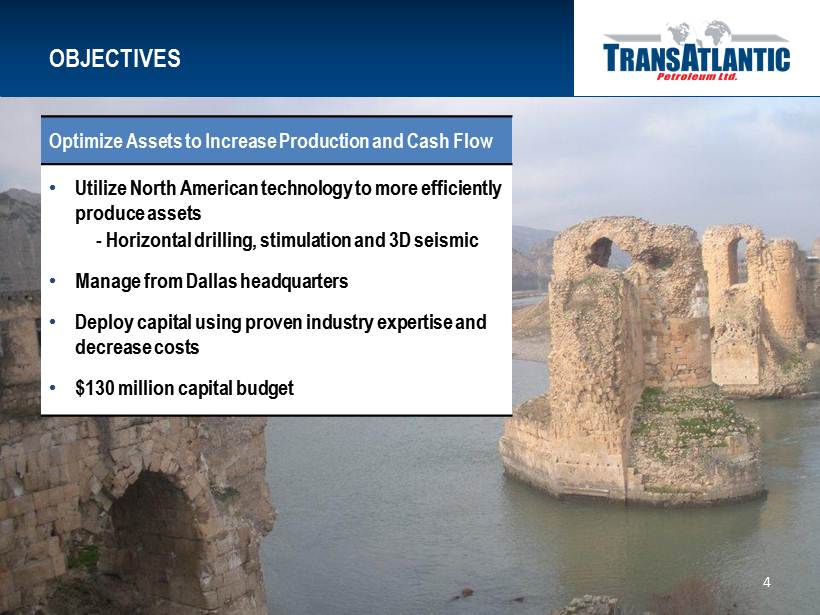
OBJECTIVES 4 Optimize Assets to Increase Production and Cash Flow • Utilize North American technology to more efficiently produce assets - Horizontal drilling, stimulation and 3D seismic • Manage from Dallas headquarters • Deploy capital using proven industry expertise and decrease costs • $130 million capital budget
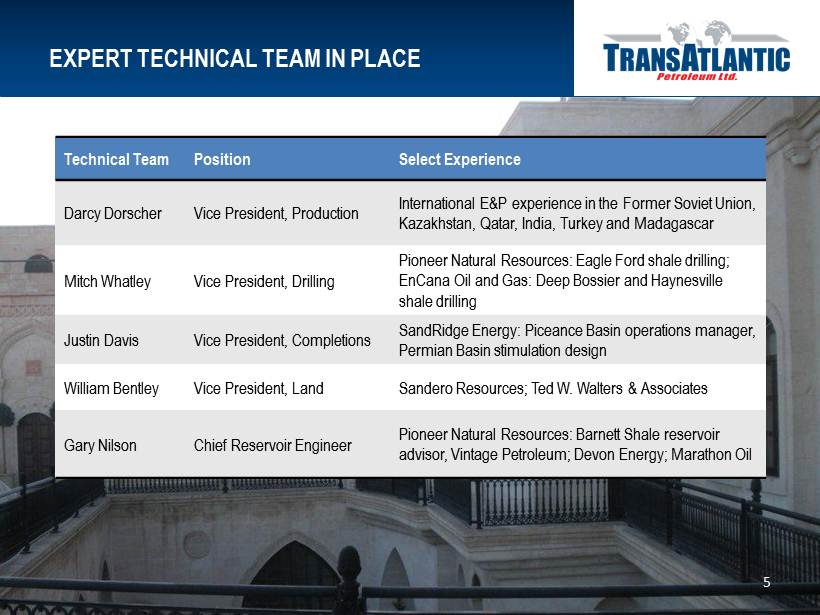
EXPERT TECHNICAL TEAM IN PLACE 5 Technical Team Position Select Experience Darcy Dorscher Vice President, Production International E&P experience in the Former Soviet Union , Kazakhstan, Qatar, India, Turkey and Madagascar Mitch Whatley Vice President, Drilling Pioneer Natural Resources: Eagle Ford shale drilling; EnCana Oil and Gas: Deep Bossier and Haynesville shale drilling Justin Davis Vice President, Completions SandRidge Energy: Piceance Basin operations manager, Permian Basin stimulation design William Bentley Vice President, Land Sandero Resources; Ted W. Walters & Associates Gary Nilson Chief Reservoir Engineer Pioneer Natural Resources: Barnett Shale reservoir advisor, Vintage Petroleum; Devon Energy; Marathon Oil
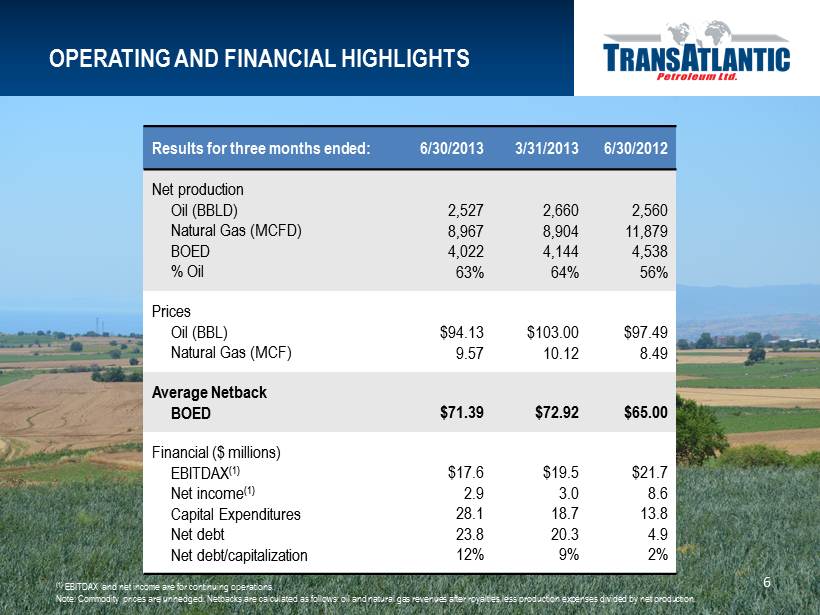
OPERATING AND FINANCIAL HIGHLIGHTS 6 Results for three months ended: 6/30/2013 3/31/2013 6/30/2012 Net p roduction Oil (BBLD) Natural Gas (MCFD) BOED % Oil 2,527 8,967 4,022 63% 2,660 8,904 4,144 64% 2,560 11,879 4,538 56% Prices Oil (BBL) Natural Gas (MCF) $94.13 9.57 $103.00 10.12 $97.49 8.49 Average Netback BOED $71.39 $72.92 $65.00 Financial ($ millions) EBITDAX (1) Net income (1) Capital Expenditures Net debt Net debt/capitalization $17.6 2.9 28.1 23.8 12% $19.5 3.0 18.7 20.3 9% $21.7 8.6 13.8 4.9 2% (1) EBITDAX and net income are for continuing operations. Note: Commodity prices are unhedged. Netbacks are calculated as follows: oil and natural gas revenues after royalties less pr odu ction expenses divided by net production.
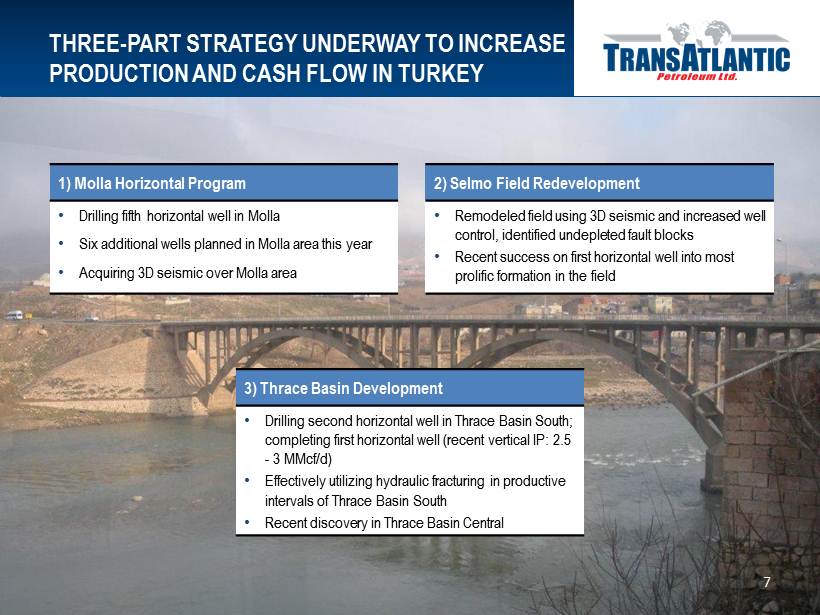
THREE - PART STRATEGY UNDERWAY TO INCREASE PRODUCTION AND CASH FLOW IN TURKEY 7 2) Selmo Field Redevelopment • Remodeled field using 3D seismic and increased well control, identified undepleted fault blocks • Recent success on first horizontal well into most prolific formation in the field 1) Molla Horizontal Program • Drilling fifth horizontal well in Molla • Six additional wells planned in Molla area this year • Acquiring 3D seismic over Molla area 3) Thrace Basin Development • Drilling second horizontal well in Thrace Basin South; completing first horizontal well (recent vertical IP: 2.5 - 3 MMcf/d) • Effectively utilizing hydraulic fracturing in productive intervals of Thrace Basin South • Recent discovery in Thrace Basin Central
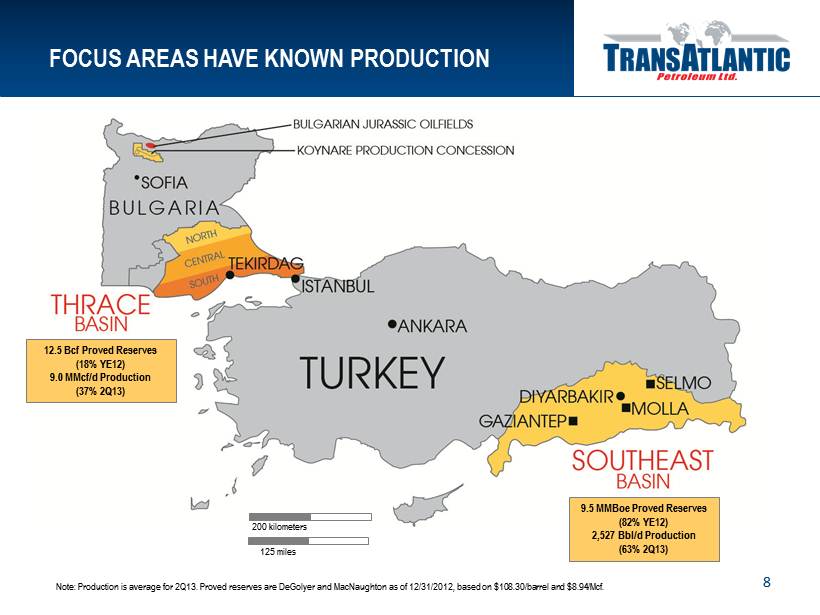
8 125 miles 200 kilometers FOCUS AREAS HAVE KNOWN PRODUCTION 12.5 Bcf Proved Reserves (18% YE12) 9.0 MMcf/d Production (37% 2Q13) 9.5 MMBoe Proved Reserves (82% YE12) 2,527 Bbl/d Production (63% 2Q13) Note: Production is average for 2Q13. Proved reserves are DeGolyer and MacNaughton as of 12/31/2012, based on $ 108.30/barrel and $8.94/Mcf .
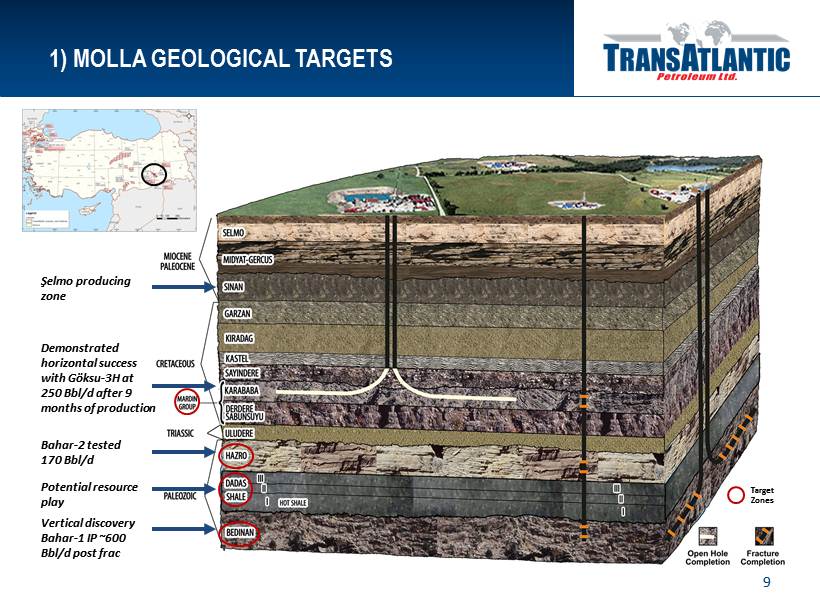
Demonstrated horizontal success with Göksu - 3H at 250 Bbl/d after 9 months of production Vertical discovery Bahar - 1 IP ~600 Bbl/d post frac Bahar - 2 tested 170 Bbl/d Potential resource play 1) MOLLA GEOLOGICAL TARGETS 9 Target Zones Şelmo producing zone
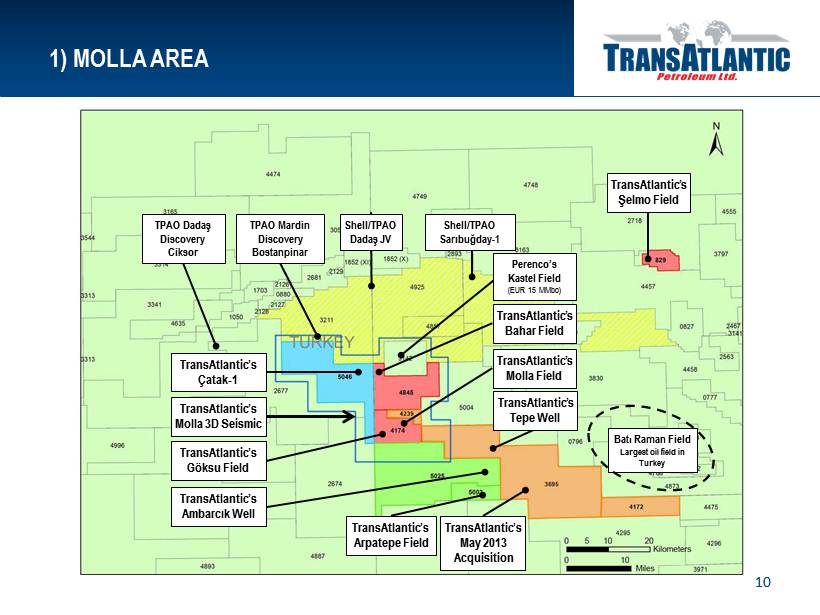
1) MOLLA AREA 10 TransAtlantic’s Şelmo Field TransAtlantic’s Bahar Field TransAtlantic’s Molla Field TransAtlantic’s Molla 3D Seismic Bat ı Raman Field Largest oil field in Turkey TPAO Dadaş Discovery Ciksor Shell/TPAO Dadaş JV Shell/TPAO Sarıbuğday - 1 TPAO Mardin Discovery Bostanpinar TransAtlantic’s Ç atak - 1 TransAtlantic’s May 2013 Acquisition TransAtlantic’s Ambarcık Well TransAtlantic’s Tepe Well TransAtlantic’s Göksu Field TransAtlantic’s Arpatepe Field Perenco’s Kastel Field (EUR 15 MMbo )
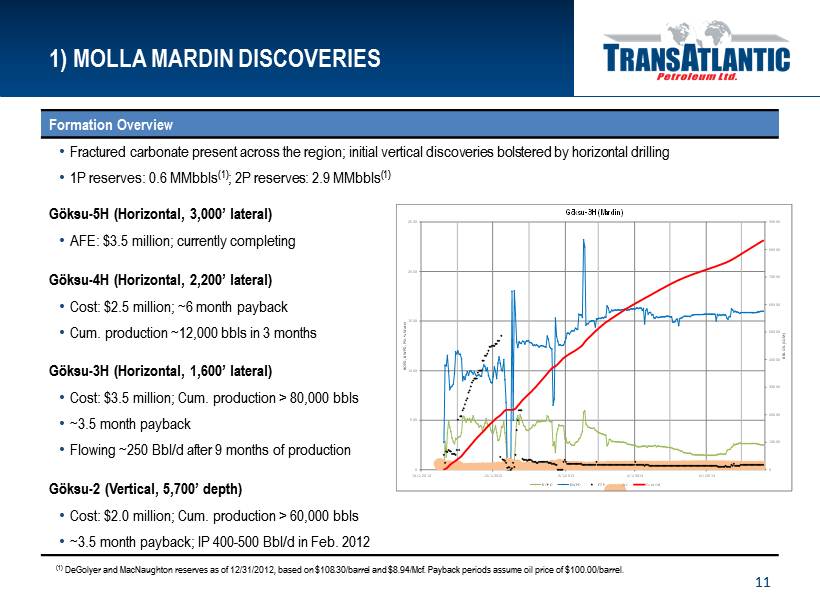
1) MOLLA MARDIN DISCOVERIES 11 Formation Overview • Fractured carbonate present across the region; i nitial vertical discoveries bolstered by horizontal drilling • 1P reserves: 0.6 MMbbls (1) ; 2P reserves: 2.9 MMbbls (1) Göksu - 5H (Horizontal, 3,000’ lateral) • AFE: $3.5 million; currently completing Göksu - 4H (Horizontal, 2,200’ lateral) • Cost: $2.5 million; ~6 month payback • Cum. production ~ 12,000 bbls in 3 months Göksu - 3H (Horizontal, 1,600’ lateral) • Cost: $3.5 million; Cum. production > 80,000 bbls • ~3.5 month payback • Flowing ~250 Bbl/d after 9 months of production Göksu - 2 (Vertical, 5,700’ depth) • Cost: $2.0 million; Cum. production > 60,000 bbls • ~3.5 month payback; IP 400 - 500 Bbl/d in Feb. 2012 (1) DeGolyer and MacNaughton reserves as of 12/31/2012, based on $108.30/barrel and $8.94/Mcf . Payback periods assume oil price of $100.00/barrel. 0 10000 20000 30000 40000 50000 60000 70000 80000 90000 0 500 1000 1500 2000 2500 10/1/2012 12/1/2012 2/1/2013 4/1/2013 6/1/2013 BBL OIL (CUM) BOPD, BWPD, PSI, % Water G ö ksu - 3H (Mardin) BOPD BWPD FTP WC Cum Oil
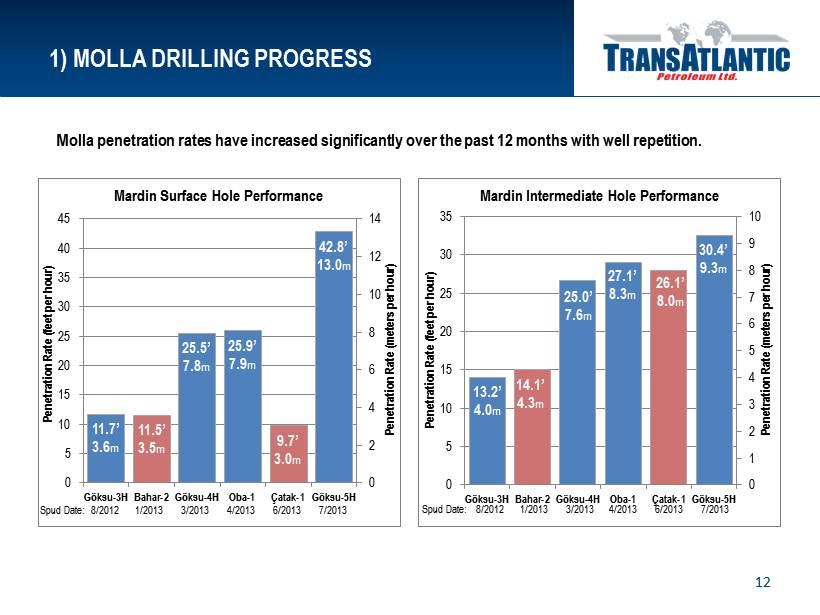
13.2’ 4.0 m 14.1’ 4.3 m 25.0’ 7.6 m 27.1’ 8.3 m 26.1’ 8.0 m 30.4’ 9.3 m 0 1 2 3 4 5 6 7 8 9 10 0 5 10 15 20 25 30 35 Göksu-3H Bahar-2 Göksu-4H Oba-1 Çatak-1 Göksu-5H Penetration Rate (meters per hour) Penetration Rate (feet per hour) Mardin Intermediate Hole Performance 11.7’ 3.6 m 11.5’ 3.5 m 25.5’ 7.8 m 25.9’ 7.9 m 9.7’ 3.0 m 42.8’ 13.0 m 0 2 4 6 8 10 12 14 0 5 10 15 20 25 30 35 40 45 Göksu-3H Bahar-2 Göksu-4H Oba-1 Çatak-1 Göksu-5H Penetration Rate (meters per hour) Penetration Rate (feet per hour) Mardin Surface Hole Performance 1) MOLLA DRILLING PROGRESS 12 Molla penetration rates have increased significantly over the past 12 months with well repetition. Spud Date: 8/2012 1/2013 3/2013 4/2013 6/2013 7/2013 Spud Date: 8/2012 1/2013 3/2013 4/2013 6/2013 7/2013
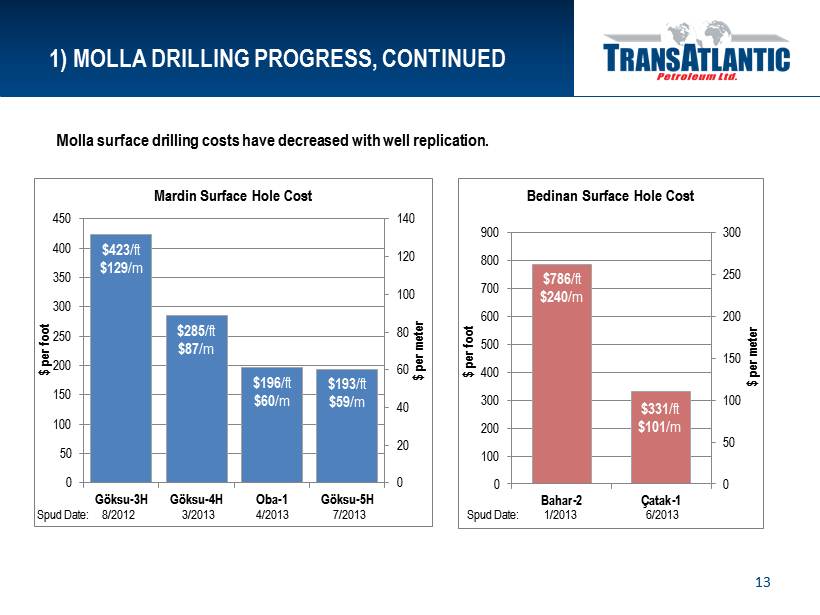
$423 / ft $129 /m $285 / ft $87 /m $196 / ft $60 /m $193 / ft $59 /m 0 20 40 60 80 100 120 140 0 50 100 150 200 250 300 350 400 450 Göksu-3H Göksu-4H Oba-1 Göksu-5H $ per meter $ per foot Mardin Surface Hole Cost 1) MOLLA DRILLING PROGRESS, CONTINUED 13 Molla surface drilling costs have decreased with well replication. Spud Date: 8/2012 3/2013 4/2013 7/2013 $786 / ft $240 /m $331 / ft $101 /m 0 50 100 150 200 250 300 0 100 200 300 400 500 600 700 800 900 Bahar-2 Çatak-1 $ per meter $ per foot Bedinan Surface Hole Cost Spud Date: 1/2013 6/2013
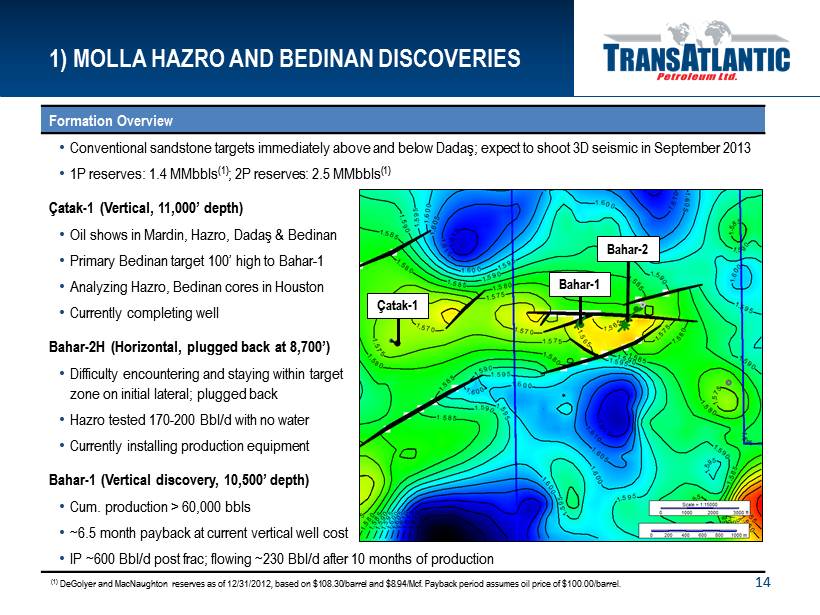
Formation Overview • Conventional sandstone targets immediately above and below Dadaş; expect to shoot 3D seismic in September 2013 • 1P reserves: 1.4 MMbbls (1) ; 2P reserves: 2.5 MMbbls (1) Çatak - 1 (Vertical, 11,000’ depth ) • Oil shows in Mardin, Hazro, Dada ş & Bedinan • Primary Bedinan target 100’ high to Bahar - 1 • Analyzing Hazro, Bedinan cores in Houston • Currently completing well Bahar - 2H (Horizontal, plugged back at 8,700’ ) • Difficulty encountering and staying within target zone on initial lateral; plugged back • Hazro t ested 170 - 200 Bbl/d with no water • Currently installing production equipment Bahar - 1 (Vertical discovery, 10,500’ depth ) • Cum. production > 60,000 bbls • ~6.5 month payback at current vertical well cost • IP ~600 Bbl/d post frac; f lowing ~230 Bbl/d after 10 months of production (1) DeGolyer and MacNaughton reserves as of 12/31/2012, based on $ 108.30/barrel and $8.94/Mcf. Payback period assumes oil price of $100.00/barrel. 1) MOLLA HAZRO AND BEDINAN DISCOVERIES 14 Bahar - 1 Ç atak - 1 Bahar - 2
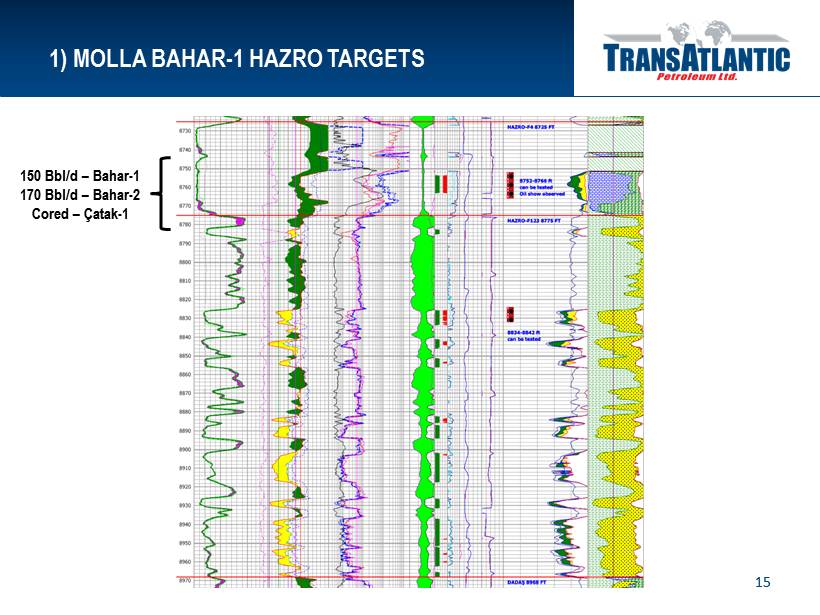
1) MOLLA BAHAR - 1 HAZRO TARGETS 15 150 Bbl/d – Bahar - 1 170 Bbl/d – Bahar - 2 Cored – Çatak - 1
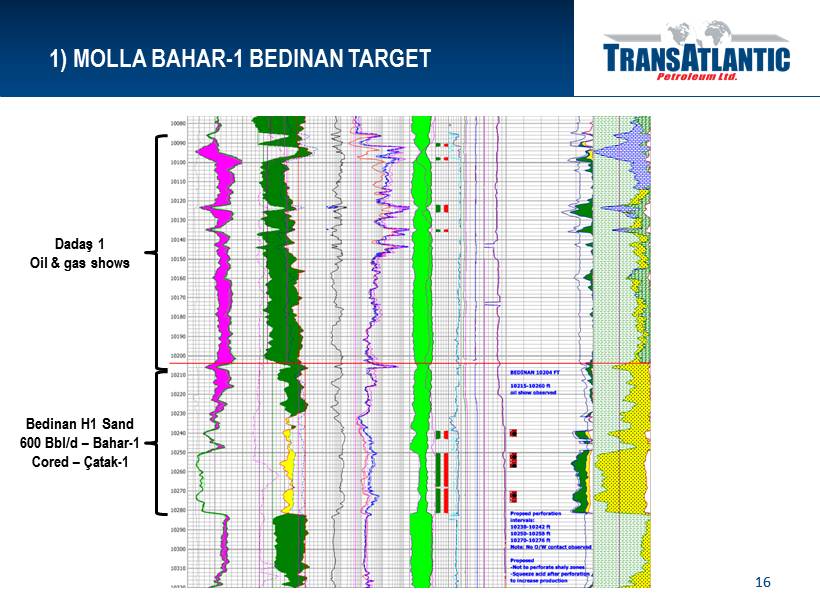
1) MOLLA BAHAR - 1 BEDINAN TARGET 16 Dadaş 1 Oil & gas shows Bedinan H1 Sand 600 Bbl/d – Bahar - 1 Cored – Ç atak - 1
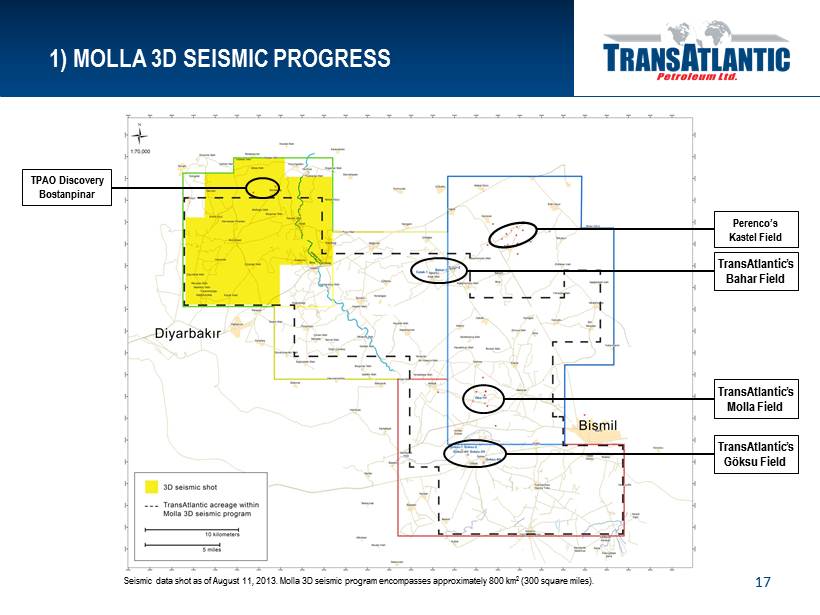
1) MOLLA 3D SEISMIC PROGRESS 17 Seismic data shot as of August 11, 2013. Molla 3D seismic program encompasses approximately 800 km 2 (300 square miles). TransAtlantic’s Molla Field TransAtlantic’s Göksu Field Perenco’s Kastel Field TransAtlantic’s Bahar Field TPAO Discovery Bostanpinar
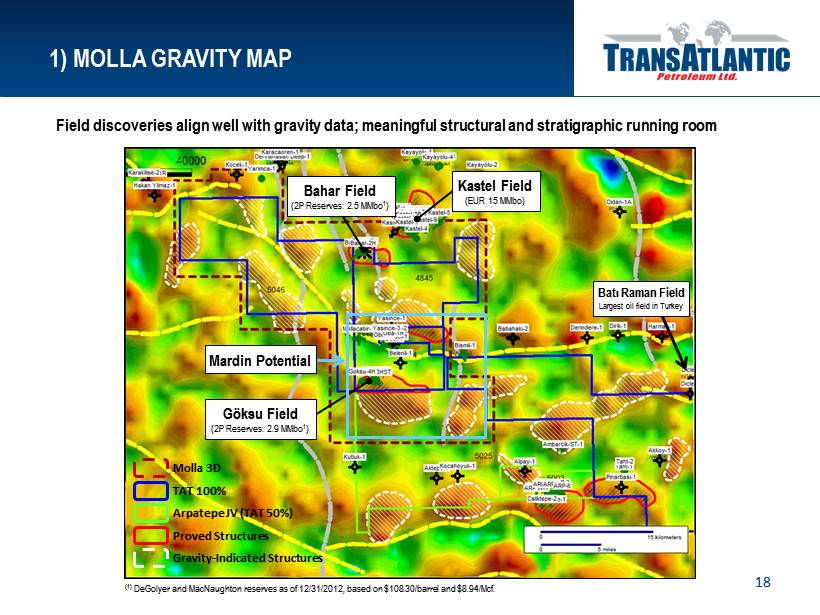
1) MOLLA GRAVITY MAP Field discoveries align well with gravity data; m eaningful structural and stratigraphic running room Kastel Field (EUR 15 MMbo ) (1) DeGolyer and MacNaughton reserves as of 12/31/2012, based on $108.30/barrel and $8.94/Mcf. Arpatepe JV (TAT 50%) Proved Structures Gravity - Indicated Structures TAT 100% Molla 3D Mardin Potential 18 Bahar Field (2P Reserves: 2.5 MMbo 1 ) Göksu Field (2P Reserves: 2.9 MMbo 1 ) Bat ı Raman Field Largest oil field in Turkey
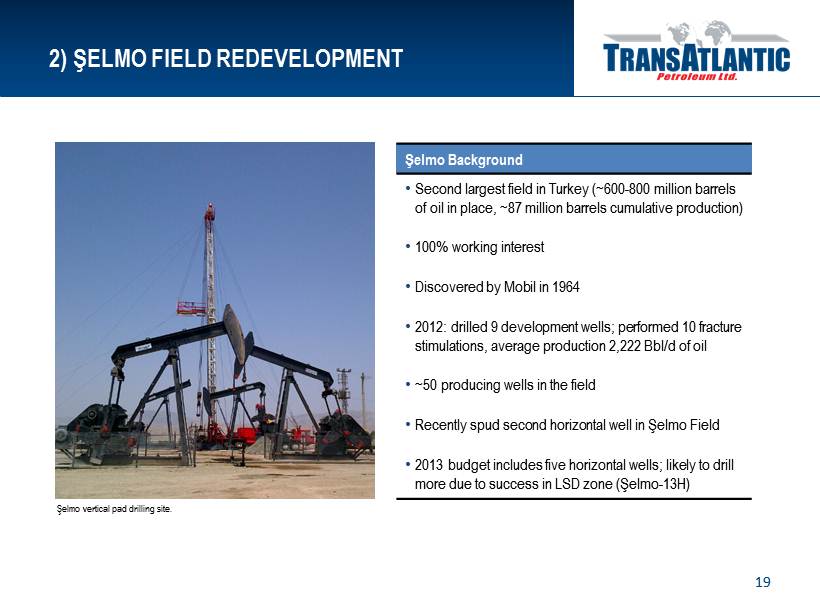
2) ŞELMO FIELD REDEVELOPMENT 19 Şelmo Background • Second largest field in Turkey (~600 - 800 million barrels of oil in place, ~87 million barrels cumulative production) • 100% working interest • Discovered by Mobil in 1964 • 2012: drilled 9 development wells; performed 10 fracture stimulations, average production 2,222 Bbl/d of oil • ~50 producing wells in the field • Recently spud second horizontal well in Şelmo Field • 2013 budget includes five horizontal wells; likely to drill more due to success in LSD zone (Şelmo - 13H) Ş elmo vertical pad drilling site.
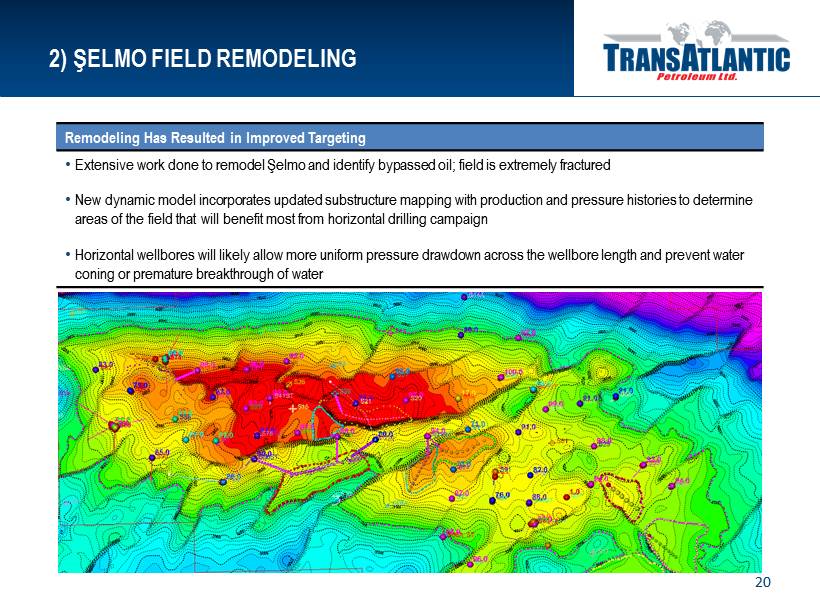
2) ŞELMO FIELD REMODELING 20 Remodeling Has Resulted in Improved Targeting • Extensive work done to remodel Ş elmo and identify bypassed oil; field is extremely fractured • New dynamic model incorporates updated substructure mapping with production and pressure histories to determine areas of the field that will benefit most from horizontal drilling campaign • Horizontal wellbores will likely allow more uniform pressure drawdown across the wellbore length and prevent water coning or premature breakthrough of water
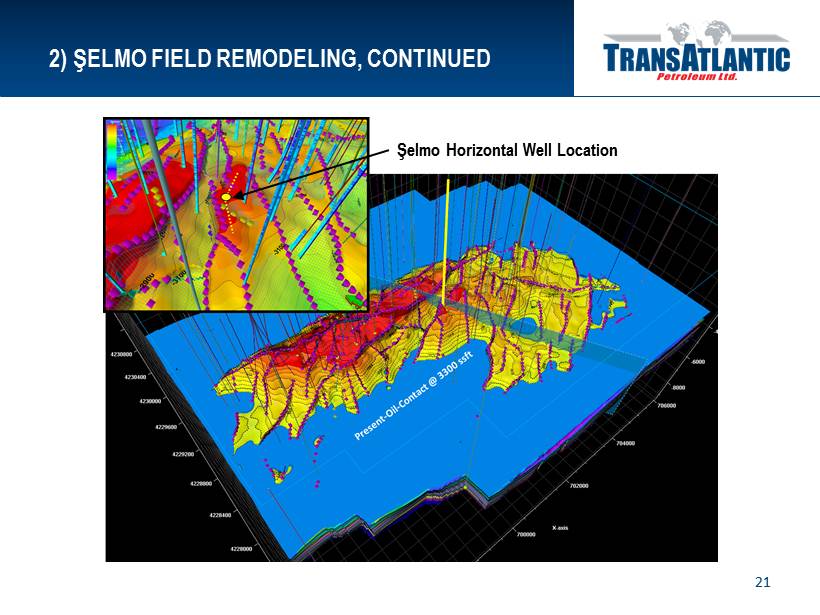
2) ŞELMO FIELD REMODELING , CONTINUED 21 Ş elmo Horizontal Well Location
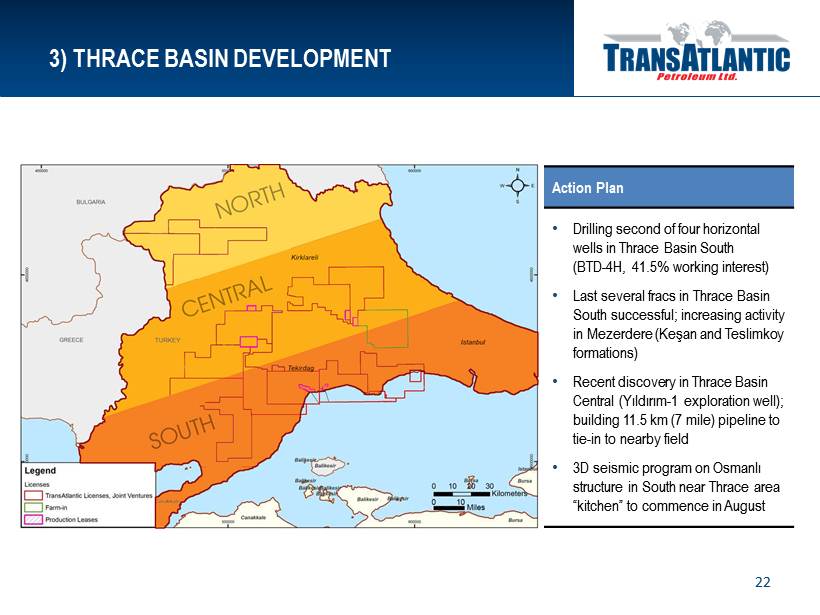
3) THRACE BASIN DEVELOPMENT 22 Action Plan • Drilling second of four horizontal wells in Thrace Basin South (BTD - 4H, 41.5% working interest) • Last several fracs in Thrace Basin South successful; increasing activity in Mezerdere (Keşan and Teslimkoy formations) • Recent discovery in Thrace Basin Central (Yıldırım - 1 exploration well); building 11.5 km (7 mile) pipeline to tie - in to nearby field • 3D seismic program on Osmanlı structure in South near Thrace area “kitchen” to commence in August
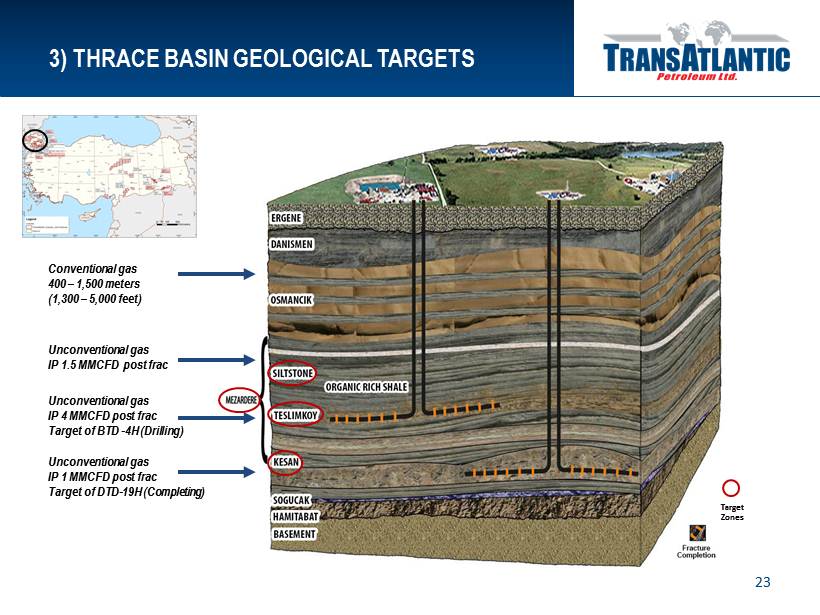
3) THRACE BASIN GEOLOGICAL TARGETS 23 Conventional gas 400 – 1,500 meters (1,300 – 5 ,000 feet) Unconventional gas IP 1.5 MMCFD post frac Unconventional gas IP 4 MMCFD post frac Target of BTD - 4H (Drilling) Unconventional gas IP 1 MMCFD post frac Target of DTD - 19H (Completing) Target Zones
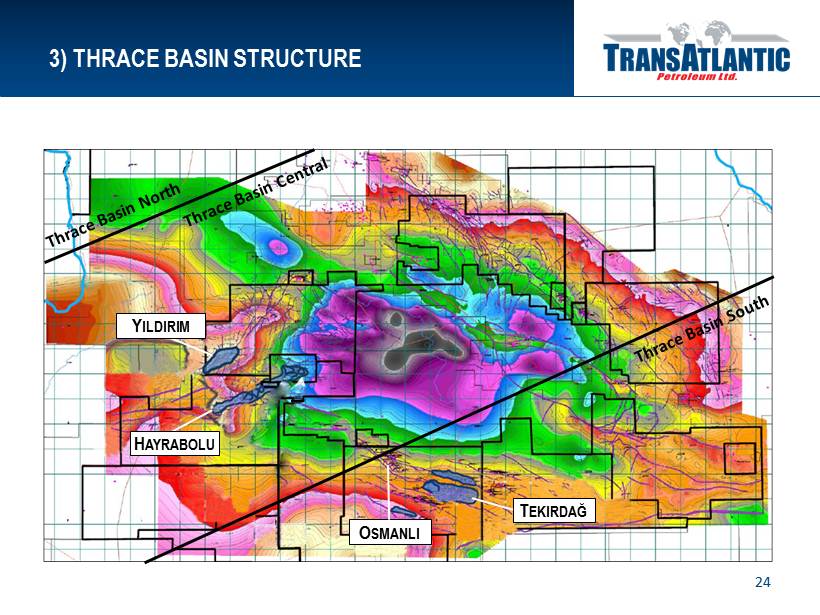
3) THRACE BASIN STRUCTURE 24 T EKIRDA Ğ O SMANLI Y ILDIRIM H AYRABOLU
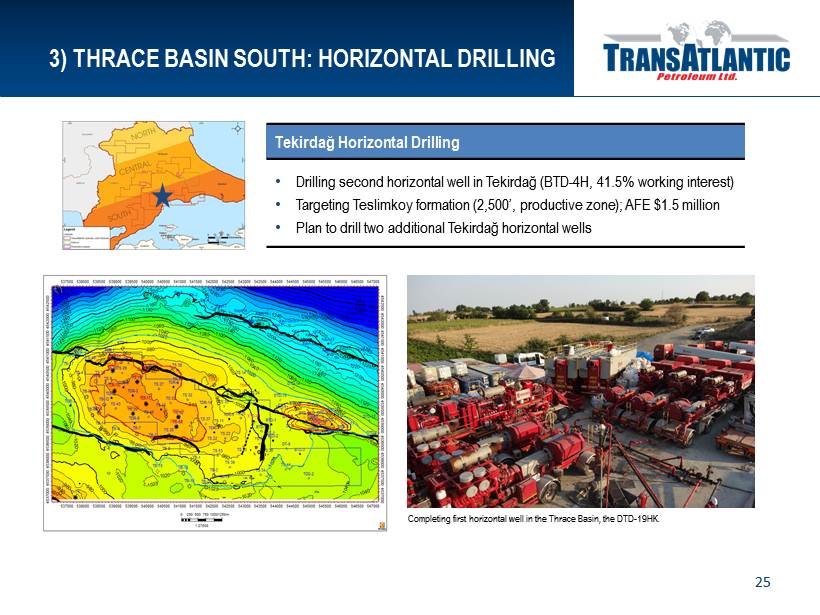
3) THRACE BASIN SOUTH: HORIZONTAL DRILLING 25 Tekirdağ Horizontal Drilling • Drilling second horizontal well in Tekirdağ (BTD - 4H, 41.5% working interest) • Targeting Teslimkoy formation (2,500’, productive zone) ; AFE $1.5 million • Plan to drill two additional Tekirda ğ horizontal wells Completing first horizontal well in the Thrace Basin, the DTD - 19HK.
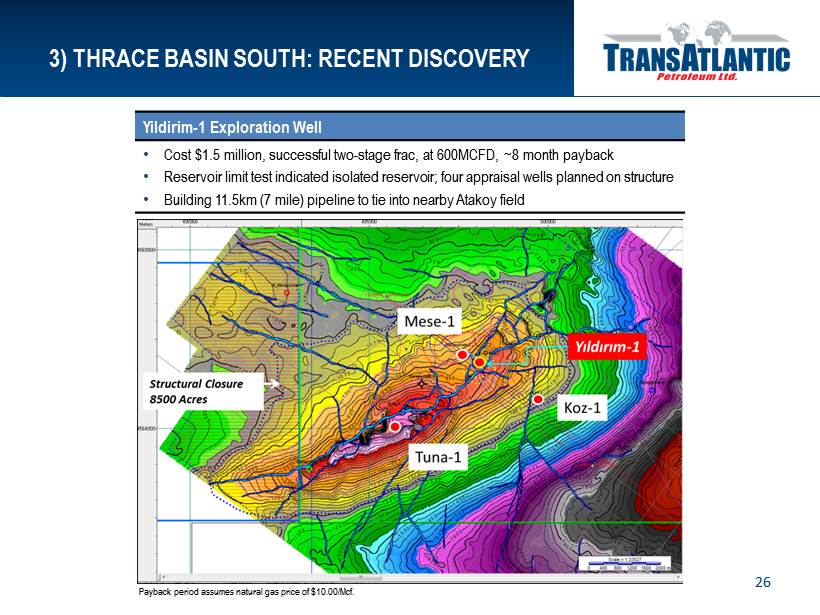
3) THRACE BASIN SOUTH: RECENT DISCOVERY 26 Yildirim - 1 Exploration Well • Cost $1.5 million, successful two - stage frac , at 600 MCFD, ~8 month payback • Reservoir limit test indicated isolated reservoir; four appraisal wells planned on structure • Building 11.5km ( 7 mile) pipeline to tie into nearby Atakoy field Payback period assumes natural gas price of $10.00/Mcf.
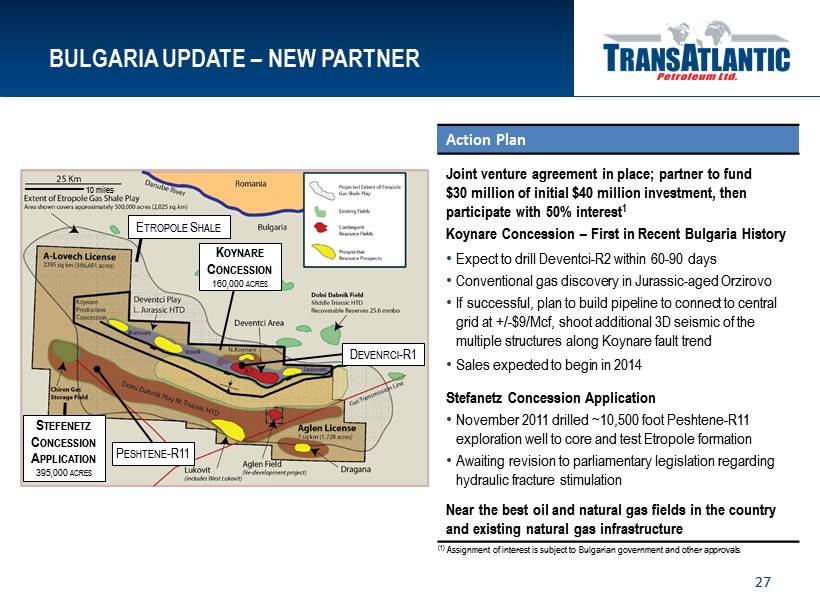
BULGARIA UPDATE – NEW PARTNER 27 Action Plan Joint venture agreement in place; partner to fund $30 million of initial $40 million investment, then participate with 50% interest 1 Koynare Concession – First in Recent Bulgaria History • Expect to drill Deventci - R2 within 60 - 90 days • Conventional gas discovery in Jurassic - aged Orzirovo • If successful, plan to build pipeline to connect to central grid at +/ - $9/Mcf, shoot additional 3D seismic of the multiple structures along Koynare fault trend • Sales expected to begin in 2014 Stefanetz Concession Application • November 2011 drilled ~10,500 foot Peshtene - R11 exploration well to core and test Etropole formation • Awaiting revision to parliamentary legislation regarding hydraulic fracture stimulation Near the best oil and natural gas fields in the country and existing natural gas infrastructure E TROPOLE S HALE K OYNARE C ONCESSION 160,000 ACRES 10 miles D EVENRCI - R1 P ESHTENE - R11 S TEFENETZ C ONCESSION A PPLICATION 395,000 ACRES (1) Assignment of interest is subject to Bulgarian government and other approvals.
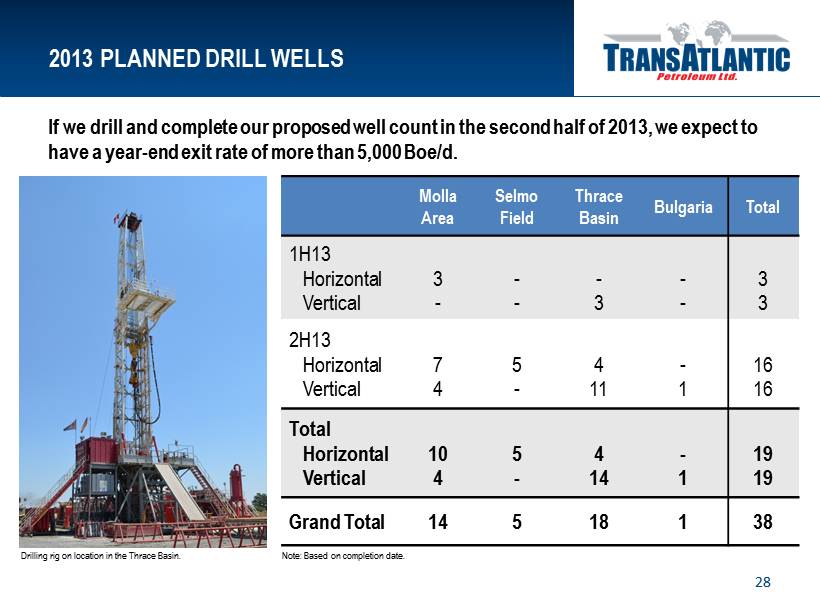
Molla Area Selmo Field Thrace Basin Bulgaria Total 1H13 Horizontal Vertical 3 - - - - 3 - - 3 3 2H13 Horizontal Vertical 7 4 5 - 4 11 - 1 16 16 Total Horizontal Vertical 10 4 5 - 4 14 - 1 19 19 Grand Total 14 5 18 1 38 2013 PLANNED DRILL WELLS 28 Drilling rig on location in the Thrace Basin. Note: Based on completion date. If we drill and complete our proposed well count in the second half of 2013, we expect to have a year - end exit rate of more than 5,000 Boe/d.
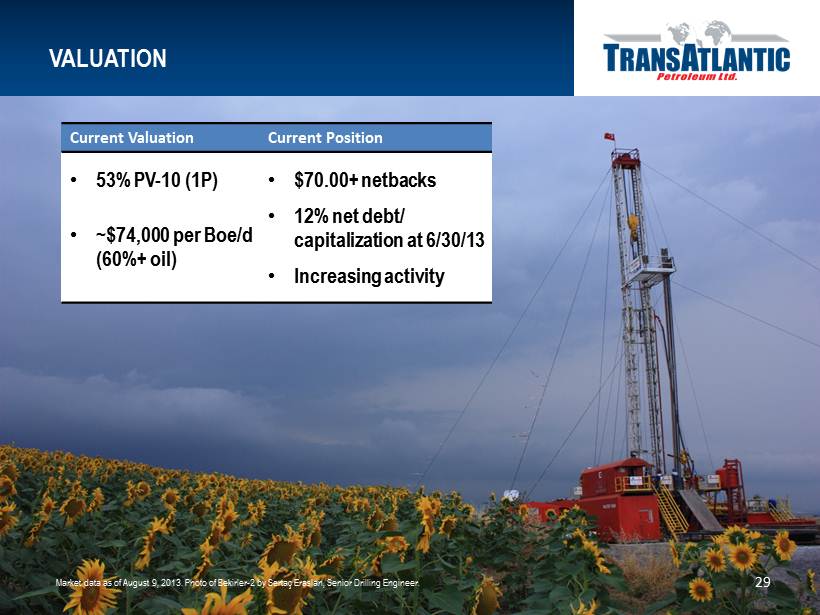
VALUATION 29 Current Valuation Current Position • 53% PV - 10 (1P) • ~$74,000 per Boe/d (60%+ oil) • $70.00+ netbacks • 12% net debt/ capitalization at 6/30/13 • Increasing activity Market data as of August 9, 2013. Photo of Bekirler - 2 by Sertaç Eraslan, Senior Drilling Engineer.
INVESTMENT THESIS • Significantly increasing drilling activity in 2H13 • Capital deployed on most favorable projects • Three - part strategy in Turkey provides clear path to grow production and cash flow • Resuming activity in Bulgaria with new partner • Expert team in place to execute capital plan 30
INVESTOR CONTACT INFORMATION Taylor B. Miele Director of Investor Relations (214) 265 - 4746 taylor.miele@tapcor.com Wil F. Saqueton VP - Chief Financial Officer (214) 265 - 4743 wil.saqueton@tapcor.com Ian J. Delahunty President (214) 265 - 4780 i an.delahunty@tapcor.com 31
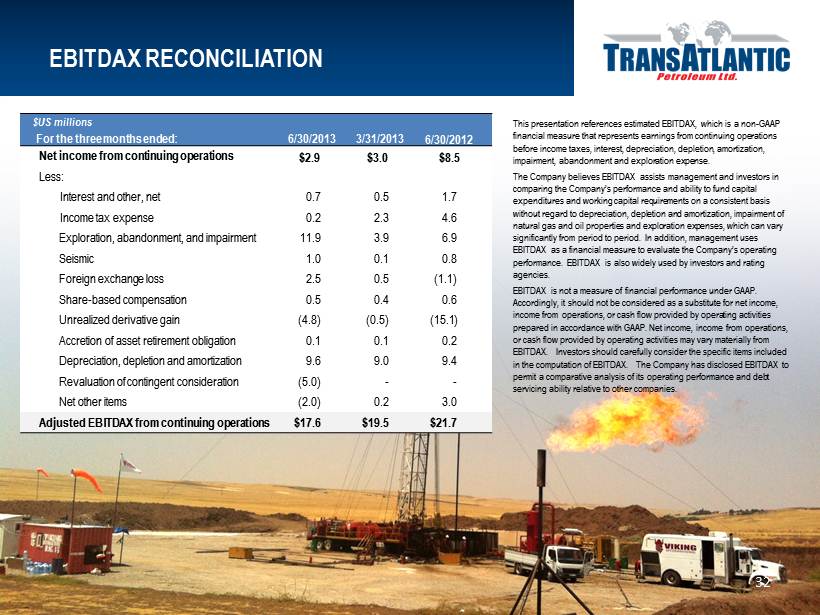
EBITDAX RECONCILIATION 32 $US millions For the three months ended: 6/30/2013 3/31/2013 6/30/2012 Net income from continuing operations $2.9 $3.0 $8.5 Less : Interest and other, net 0.7 0.5 1.7 Income tax expense 0.2 2.3 4.6 Exploration, abandonment, and impairment 11.9 3.9 6.9 Seismic 1.0 0.1 0.8 Foreign exchange loss 2.5 0.5 (1.1) Share - based compensation 0.5 0.4 0.6 Unrealized derivative gain (4.8) (0.5) (15.1) Accretion of asset retirement obligation 0.1 0.1 0.2 Depreciation, depletion and amortization 9.6 9.0 9.4 Revaluation of contingent consideration (5.0) - - Net o ther items (2.0) 0.2 3.0 Adjusted EBITDAX from continuing operations $17.6 $19.5 $21.7 This presentation references estimated EBITDAX, which is a non - GAAP financial measure that represents earnings from continuing operations before income taxes, interest, depreciation, depletion, amortization, impairment, abandonment and exploration expense. The Company believes EBITDAX assists management and investors in comparing the Company’s performance and ability to fund capital expenditures and working capital requirements on a consistent basis without regard to depreciation, depletion and amortization, impairment of natural gas and oil properties and exploration expenses, which can vary significantly from period to period. In addition, management uses EBITDAX as a financial measure to evaluate the Company’s operating performance. EBITDAX is also widely used by investors and rating agencies. EBITDAX is not a measure of financial performance under GAAP. Accordingly, it should not be considered as a substitute for net income, income from operations, or cash flow provided by operating activities prepared in accordance with GAAP. Net income, income from operations, or cash flow provided by operating activities may vary materially from EBITDAX. Investors should carefully consider the specific items included in the computation of EBITDAX. The Company has disclosed EBITDAX to permit a comparative analysis of its operating performance and debt servicing ability relative to other companies.
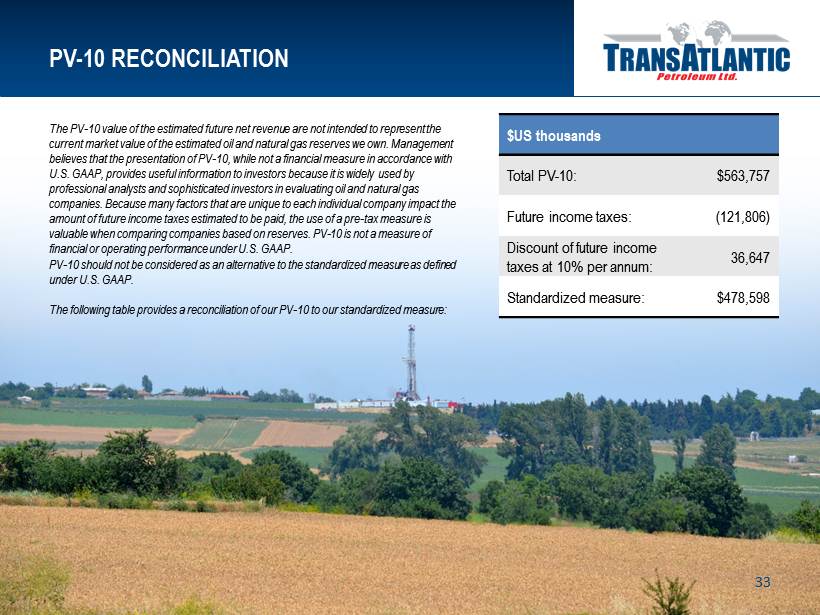
PV - 10 RECONCILIATION 33 The PV - 10 value of the estimated future net revenue are not intended to represent the current market value of the estimated oil and natural gas reserves we own. Management believes that the presentation of PV - 10, while not a financial measure in accordance with U.S. GAAP, provides useful information to investors because it is widely used by professional analysts and sophisticated investors in evaluating oil and natural gas companies. Because many factors that are unique to each individual company impact the amount of future income taxes estimated to be paid, the use of a pre - tax measure is valuable when comparing companies based on reserves. PV - 10 is not a measure of financial or operating performance under U.S. GAAP. PV - 10 should not be considered as an alternative to the standardized measure as defined under U.S. GAAP. The following table provides a reconciliation of our PV - 10 to our standardized measure: $US thousands Total PV - 10: $563,757 Future income taxes: (121,806) Discount of future income taxes at 10% per annum: 36,647 Standardized measure: $478,598