Attached files
| file | filename |
|---|---|
| 8-K - 8-K - HARDINGE INC | a13-8985_48k.htm |
| EX-99.1 - EX-99.1 - HARDINGE INC | a13-8985_4ex99d1.htm |
Exhibit 99.2
|
|
Second Quarter Financial Results Conference Call August 8, 2013 NASDAQ: HDNG www.hardinge.com Edward J. Gaio Vice President and Chief Financial Officer Richard L. Simons Chairman, President and Chief Executive Officer |
|
|
Safe Harbor Statement This presentation may contain forward-looking statements (within the meaning of Section 27A of the Securities Act of 1933, as amended and Section 21E of the Securities Exchange Act of 1934, as amended). Any such statements are based upon management’s current expectations that involve risks and uncertainties. Any statements that are not statements of historical fact or that are about future events may be deemed to be forward-looking statements. For example, words such as “may”, “will”, “should”, “estimates”, “predicts”, “potential”, “continue”, “strategy”, “believes”, “anticipates”, “plans”, “expects”, “intends” and similar expressions are intended to identify forward-looking statements. The Company’s actual results or outcomes and the timing of certain events may differ significantly from those discussed in any forward-looking statements. The following factors are among those that could cause actual results to differ materially from the forward-looking statements, which involve risks and uncertainties, and that should be considered in evaluating any such statement: fluctuations in the machine tool business cycles, changes in general economic conditions in the U.S. or internationally, the mix of products sold and the profit margins thereon, the relative success of the Company’s entry into new product and geographic markets, the Company’s ability to manage its operating costs, actions taken by customers such as order cancellations or reduced bookings by customers or distributors, competitor’s actions such as price discounting or new product introductions, governmental regulations and environmental matters, changes in the availability of cost of materials and supplies, the implementation of new technologies and currency fluctuations. The Company undertakes no obligation to publicly update any forward-looking statement, whether as a result of new information, future events, or otherwise. 2 |
|
|
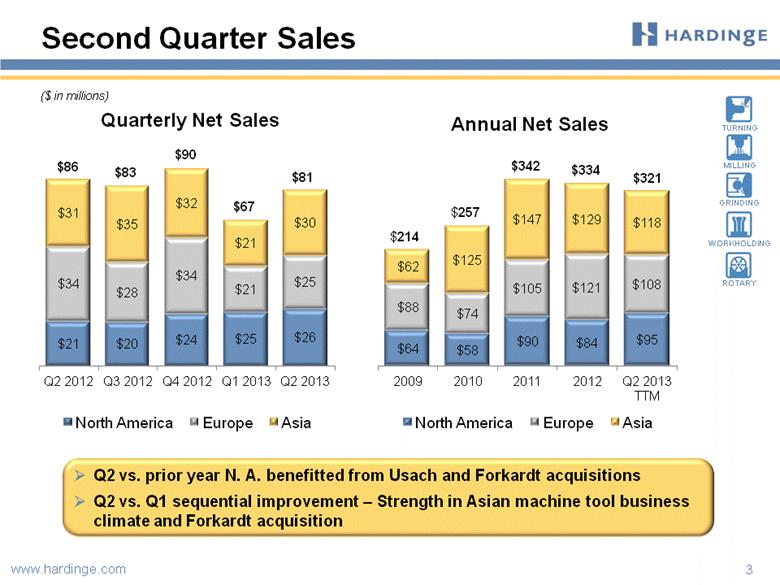
Second Quarter Sales 3 ($ in millions) $321 $214 $257 $342 $334 $81 Quarterly Net Sales Annual Net Sales $86 $83 Q2 vs. prior year N. A. benefitted from Usach and Forkardt acquisitions Q2 vs. Q1 sequential improvement – Strength in Asian machine tool business climate and Forkardt acquisition $90 $67 |
|
|
Gross Margin 4 Quarterly Sales and Gross Margin Annual Sales and Gross Margin Net Sales (in millions) Q2 2013 adjusted gross margin improved over the prior year period due to favorable product mix Annualized gross margin improvement over prior years due to favorable product mix and increased productivity Sales ($ in millions) * Gross Profit and Gross Margin for 2009 and Q2 2013 TTM were adjusted to exclude unusual items. ** Gross Profit and Gross Margin for Q2 2013 were adjusted to exclude an $0.8 million inventory step-up charge related to acquisition purchase accounting. See supplemental slides for Adjusted Gross Profit and Gross Margin reconciliation and other important disclaimers regarding adjusted Gross Profit and Gross Margin. |
|
|
Operating Margin 5 Quarterly Sales & Operating Margin Annual Sales & Operating Margin Expected SG&A run rate of approximately $20 - $21 mm per quarter Sales ($ in millions) * Annual Operating Income and Operating Margin for 2009, 2010, 2012 and Q2 2013 TTM and quarterly Operating Income and Operating Margin for Q4 2012, Q1 2013 and Q2 2013 were adjusted to exclude unusual items. See supplemental slides for Adjusted Operating Income and Operating Margin reconciliation and other important disclaimers regarding Adjusted Operating Income and Operating Margin. |
|
|
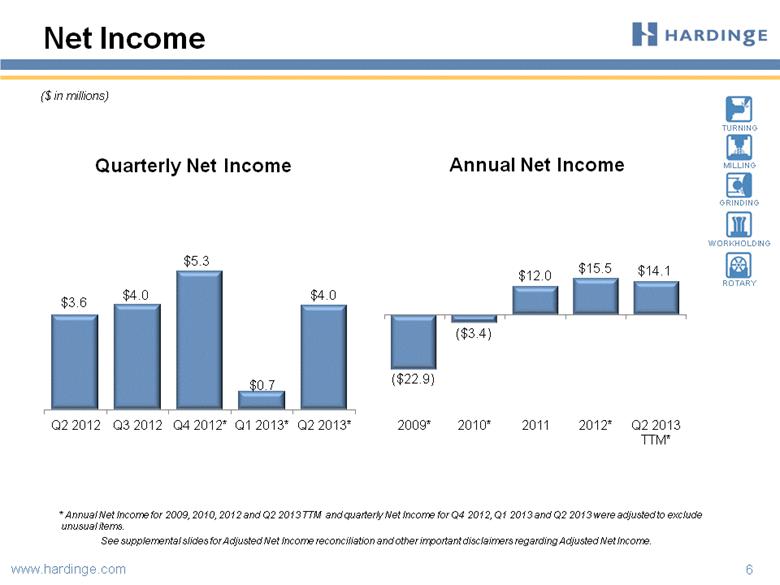
Quarterly Net Income Annual Net Income Net Income 6 ($ in millions) * Annual Net Income for 2009, 2010, 2012 and Q2 2013 TTM and quarterly Net Income for Q4 2012, Q1 2013 and Q2 2013 were adjusted to exclude unusual items. See supplemental slides for Adjusted Net Income reconciliation and other important disclaimers regarding Adjusted Net Income. |
|
|
Emphasis on Productivity and Cash Managed Working Capital* as a Percent of Sales 7 Receivable Days Outstanding (Avg) Inventory Turns (Avg) * Managed Working Capital is defined as: Receivables + Inventory - Payables - Customer Deposits |
|
|
8 Financial Strength Total Capitalization ($ in millions) * Reflects expansion capital investments in China and Switzerland. ** Midpoint of guidance of $4.0 million to $5.0 million provided on 8/8/2013. Cash & Cash Equivalents Capital Expenditures $166.5 $162.9 $168.5 $181.2 $207.0 ** Total Capitalization 1H 2013 capex was $1.6 million Q2 2013 Q2 2012 Cash provided by operating activities $8.7 $3.8 CapEx (0.8) (3.3) Operating free cash flow $7.9 $0.5 |
|
|
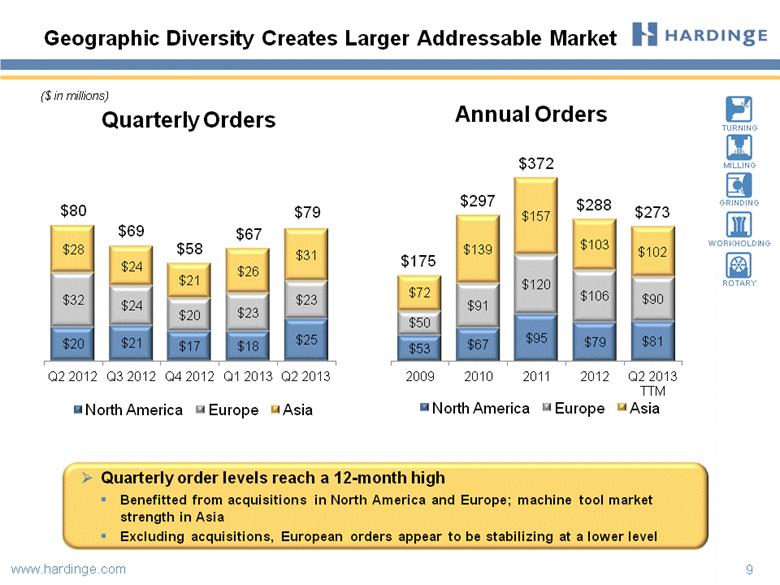
9 Geographic Diversity Creates Larger Addressable Market ($ in millions) Annual Orders $288 $372 $297 $175 $273 Quarterly Orders $80 $79 $67 $58 $69 Quarterly order levels reach a 12-month high Benefitted from acquisitions in North America and Europe; machine tool market strength in Asia Excluding acquisitions, European orders appear to be stabilizing at a lower level |
|
|
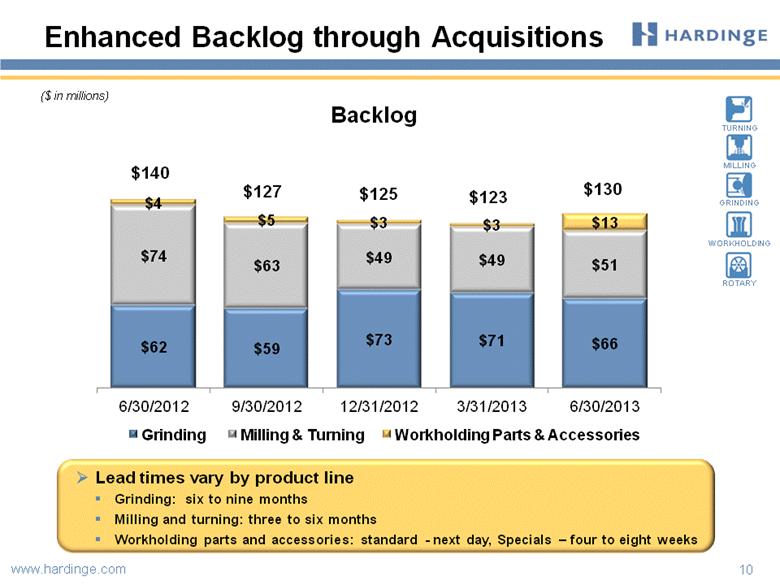
10 ($ in millions) Backlog Lead times vary by product line Grinding: six to nine months Milling and turning: three to six months Workholding parts and accessories: standard - next day, Specials – four to eight weeks Enhanced Backlog through Acquisitions $123 $130 $140 $127 $125 |
|
|
Oxford Economics Machine Tool Forecast Source: Oxford Economics Spring 2013 Global Machine Tool Outlook Report 11 Emerging Economies Drive Demand Machine Tool Consumption (in US$ billions) Previous world peak surpassed in 2011 China: 70% of Asian demand by 2016 Drivers of Machine Tool Consumption: Replacing technologically obsolete older machines Shrinking supply of skilled machinists Growing middle class in emerging economies Advancing productivity for global competitiveness Oxford Machine Tool Forecast 2012-2016 CAGR World ~8% Asia ~10% Europe ~5% Americas ~4% |
|
|
12 Overview and Outlook Long-term outlook on machine tool industry remains positive Hardinge 2013 outlook Order activity in Asia has been showing significant improvement since late 2012 Acquisitions help offset decline in North America and Europe organic sales; expecting sales levels comparable with or slightly lower than 2012 Acquisitions have improved margin profile Engineering and development efforts focused on maintaining competitive edge Hardinge Inc. Performance Excellence – our Lean Six Sigma performance improvement initiative Foundational values drive culture: Quality, customer service, continuous process improvement, global cooperation, and employee development |
|
|
Second Quarter 2013 Earnings Conference Call August 8, 2013 NASDAQ: HDNG www.hardinge.com |
|
|
NASDAQ: HDNG SUPPLEMENTAL INFORMATION www.hardinge.com |
|
|
Adjusted Gross Profit Reconciliation 15 ($ in millions) Gross Profit and Gross Margin for 2009 , Q2 2013 and Q2 2013 TTM were adjusted to exclude unusual items as listed above Hardinge believes that when used in conjunction with GAAP measures, Adjusted Gross Profit, which is a non-GAAP measure, assists in the understanding of Hardinge’s operating performance. 2009 2010 2011 2012 Q1 2013 Q2 2013 Q2 2013 TTM Sales $214.1 $257.0 $341.6 $334.4 $67.2 $80.8 $321.5 Cost of sales 173.3 195.7 250.5 237.6 48.2 57.4 227.5 Gross profit 40.8 61.3 91.1 96.8 19.0 23.4 94.0 Inventory impairment 5.0 - - - - - - Inventory step-up charge - - - - - 0.8 0.8 Adjusted gross profit $45.8 $61.3 $91.1 $96.8 $19.0 $24.2 $94.8 Adjusted gross margin 21.4% 23.9% 26.7% 29.0% 28.2% 29.9% 29.5% |
|
|
Annual Adjusted Net Income and Operating Income 16 ($ in millions) Net Income, Operating Income and Operating Margin in 2009, 2010, 2012 and Q2 2013 TTM were adjusted to exclude unusual items as listed above. Hardinge believes that when used in conjunction with GAAP measures, adjusted Net Income (loss) and adjusted Operating Income (loss), which are non-GAAP measures, assist in the understanding of Hardinge’s operating performance. 2009 2010 2011 2012 Q2 2013 TTM Net (loss) income ($33.3) ($5.2) $12.0 $17.9 $14.1 Inventory impairment 5.0 - - - - Restructuring 5.4 - - - - Gain on sale & acquisition - (1.7) - - - Inventory step-up charge - - - - 0.8 Acquisition transaction expense - - - 0.3 1.9 Other adjustment - 3.5 - (2.7) (2.7) Net (loss) income / adjusted net (loss) income (22.9) (3.4) 12.0 15.5 14.1 Plus: Interest expense, net 1.8 0.3 0.2 0.7 0.9 Adjusted income tax expense 1.9 2.2 4.4 4.2 3.0 Adjusted operating income (loss) ($19.2) ($0.9) $16.6 $20.4 $18.0 Sales $214.1 $257.0 $341.6 $334.4 $321.5 Adjusted operating margin (9.0)% (0.4)% 4.9% 6.1% 5.6% |
|
|
Quarterly Adjusted Net Income and Operating Income 17 ($ in thousands) Net Income, Operating Income and Operating Margin in Q4 2012, Q1 2013 and Q2 2013 were adjusted to exclude unusual items as listed above. Hardinge believes that when used in conjunction with GAAP measures, adjusted Net Income (loss) and adjusted Operating Income (loss), which are non-GAAP measures, assist in the understanding of Hardinge’s operating performance. Q4 2012 Q1 2013 Q2 2013 Net income $7,752 $40 $2,265 Inventory step-up charge - - 774 Acquisition transaction expense 290 645 970 Other adjustment (2,720) - - Adjusted net income 5,322 685 4,009 Plus: Interest expense, net 181 190 297 Adjusted income tax expense 1,332 222 383 Adjusted operating income $6,835 $1,097 $4,689 Sales $90,560 $67,219 $80,814 Adjusted operating margin 7.5% 1.6% 5.8% |
|
|
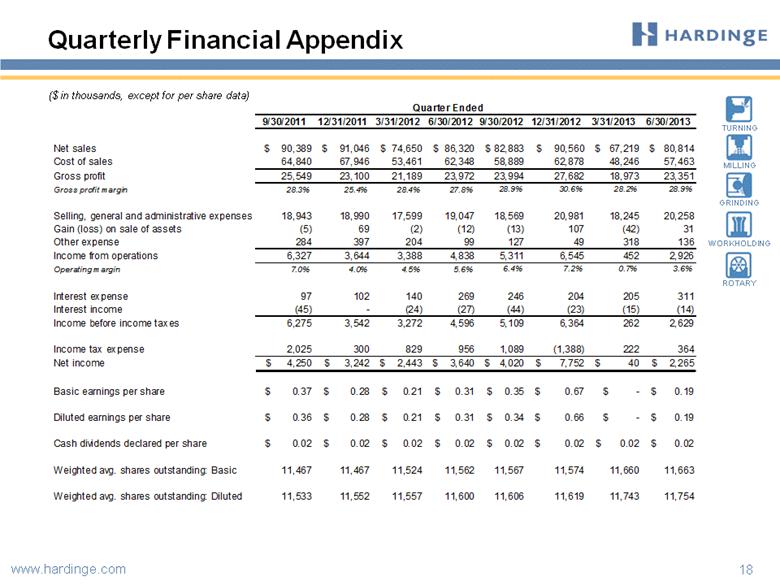
Quarterly Financial Appendix 18 ($ in thousands, except for per share data) 9/30/2011 12/31/2011 3/31/2012 6/30/2012 9/30/2012 12/31/2012 3/31/2013 6/30/2013 Net sales $ 90,389 $ 91,046 $ 74,650 $ 86,320 $ 82,883 $ 90,560 $ 67,219 $ 80,814 Cost of sales 64,840 67,946 53,461 62,348 58,889 62,878 48,246 57,463 Gross profit 25,549 23,100 21,189 23,972 23,994 27,682 18,973 23,351 Gross profit margin 28.3% 25.4% 28.4% 27.8% 28.9% 30.6% 28.2% 28.9% Selling, general and administrative expenses 18,943 18,990 17,599 19,047 18,569 20,981 18,245 20,258 Gain (loss) on sale of assets (5) 69 (2) (12) (13) 107 (42) 31 Other expense 284 397 204 99 127 49 318 136 Income from operations 6,327 3,644 3,388 4,838 5,311 6,545 452 2,926 Operating margin 7.0% 4.0% 4.5% 5.6% 6.4% 7.2% 0.7% 3.6% Interest expense 97 102 140 269 246 204 205 311 Interest income (45) - (24) (27) (44) (23) (15) (14) Income before income taxes 6,275 3,542 3,272 4,596 5,109 6,364 262 2,629 Income tax expense 2,025 300 829 956 1,089 (1,388) 222 364 Net income $ 4,250 $ 3,242 $ 2,443 $ 3,640 $ 4,020 $ 7,752 $ 40 $ 2,265 Basic earnings per share $ 0.37 $ 0.28 $ 0.21 $ 0.31 $ 0.35 $ 0.67 $ - $ 0.19 Diluted earnings per share $ 0.36 $ 0.28 $ 0.21 $ 0.31 $ 0.34 $ 0.66 $ - $ 0.19 Cash dividends declared per share $ 0.02 $ 0.02 $ 0.02 $ 0.02 $ 0.02 $ 0.02 $ 0.02 $ 0.02 Weighted avg. shares outstanding: Basic 11,467 11,467 11,524 11,562 11,567 11,574 11,660 11,663 Weighted avg. shares outstanding: Diluted 11,533 11,552 11,557 11,600 11,606 11,619 11,743 11,754 Quarter Ended |