Attached files
| file | filename |
|---|---|
| EX-99.1 - NEWS RELEASE DATED AUGUST 5, 2013 - LANDAUER INC | exh-991.htm |
| 8-K - LDR - FORM 8-K - 8/5/13 - LANDAUER INC | ldr-8k.htm |
Exhibit 99.2
Investor Slide Presentation

Respect Innovation Honesty Reliability Investor Presentation August 2013

2 Safe Harbor Statement Some of the information shared here (including, in particular, the section titled “Fiscal 2013 Outlook”) constitutes forward - looking statements that are based on assumptions and involve certain risks and uncertainties . These include the following, without limitation : assumptions, risks and uncertainties associated with the Company’s future performance, the Company’s development and introduction of new technologies in general ; the ability to protect and utilize the Company’s intellectual property ; continued customer acceptance of the InLight technology ; the adaptability of optically stimulated luminescence (OSL) technology to new platforms and formats ; military and other government funding for the purchase of certain of the Company’s equipment and services ; the impact on sales and pricing of certain customer group purchasing arrangements ; changes in spending or reimbursement for medical products or services ; the costs associated with the Company’s research and business development efforts ; the usefulness of older technologies and related licenses and intellectual property ; the effectiveness of and costs associated with the Company’s IT platform enhancements ; the anticipated results of operations of the Company and its subsidiaries or ventures ; valuation of the Company’s long - lived assets or business units relative to future cash flows ; changes in pricing of products and services ; changes in postal and delivery practices ; the Company’s business plans ; anticipated revenue and cost growth ; the ability to integrate the operations of acquired businesses and to realize the expected benefits of acquisitions ; the risks associated with conducting business internationally ; costs incurred for potential acquisitions or similar transactions ; other anticipated financial events ; the effects of changing economic and competitive conditions, including instability in capital markets which could impact availability of short and long - term financing ; the timing and extent of changes in interest rates ; the level of borrowings ; foreign exchange rates ; government regulations ; accreditation requirements ; changes in the trading market that affect the costs of obligations under the Company’s benefit plans ; and pending accounting pronouncements . These assumptions may not materialize to the extent assumed, and risks and uncertainties may cause actual results to be different from what is anticipated today . These risks and uncertainties also may result in changes to the Company’s business plans and prospects, and could create the need from time to time to write down the value of assets or otherwise cause the Company to incur unanticipated expenses . Additional information may be obtained by reviewing the information set forth in Item 1 A “Risk Factors” and Item 7 A “Quantitative and Qualitative Disclosures about Market Risk” and information contained in the Company's Annual Report on Form 10 - K for the year ended September 30 , 2012 and other reports filed by the Company, from time to time, with the Securities and Exchange Commission . The Company does not undertake, and expressly disclaims, any duty to update any forward - looking statement whether as a result of new information, future events or changes in the Company’s expectations, except as required by law . During the past several years, the Company has been engaged in an initiative to re - engineer many of its business processes and replace significant components of its information technology systems . A principal component of this initiative is the implementation of new enterprise resource planning software and other applications to manage certain business operations . This enhancement of the Company’s IT platform has been a complex project and has involved extensive customization of the Company’s software and IT systems . In July 2012 , the enhanced IT platform became operational . Although the Company has been encouraged by its experience with the enhanced platform during the first several months of the platform’s start - up phase, there can be no assurance that the new platform will continue to maintain its functionality at the levels anticipated or otherwise meet the Company’s business and operational objectives . If unforeseen problems arise, the Company’s operations could be adversely impacted, including the ability of the Company to perform one or more of the following in a timely manner : customer quotes, customer orders, product shipment, customer services and support, order billing and tracking, contractual obligations fulfillment and related operations . As previously disclosed, the Company expects to incur ongoing maintenance expenditures for the new IT platform at levels higher than the Company traditionally experienced under its prior platform . Unforeseen problems with the new platform could increase further such expenditures .

Financial Highlights Three Operating Segments Diverse Markets Served Business Facts Business Facts • Based in Glenwood, IL • Founded in 1954 • Approximately 550 employees • Global Platform and Infrastructure • 78,000 annual customers served; 1.7 annual individuals served • 94%+ Customer retention rates Three Operating Segments • Radiation Measurement • 77% of FY 2012 Op Income • Medical Physics • 10% of FY 2012 Op Income • Medical Products • 13% of FY 2012 Op Income Financial Highlights Diverse Markets Served The Global Leader in Radiation Science and Services Landauer Today 3 • $160 Million in Annual Revenue (Fiscal 2012) • ~ 90% Recurring Revenues • 21+ consecutive years of revenue growth • $55 Million in Adjusted EBITDA (Fiscal 2012) • $165 Million in Cumulative Dividends paid over last 10 years $ • Healthcare & Education • National Security • Energy • Industry

Radiation Management is Becoming More Complex Advanced imaging and treatment choices, healthcare consolidation and tougher regulations and standards are raising the bar for radiation safety Evolving Treatments Advanced radiation treatment choices and consumerism Healthcare Consolidation Acquisitions Partnerships Tougher State and Federal Regulations Regulatory Trends • CT, PA, MA, RI, TX New Standards Patient Safety and National Public Policy Risk to Health System 4

Radiation Risk Not Managed Consistently Healthcare Systems do not have a single expert focused on radiation risk across all locations, departments and modalities • Radiation injury and even death • Lawsuits $100K - $15M+ • Violations, delays in patient care, & poor PR • Risk to pregnant & at - risk patients • Excess exposure to staff • Radiation injury and death • Lawsuits $200K - $17M+ • Reportable events to state DOH, TJC, FDA • Delays in patient care or even ceased operations • All impact regulatory compliance & employee safety • Violations • Delays in patient care • Poor PR • Gaps in radiation safety training • Dosimeters not worn or returned • Lack of meaningful exposure review and follow up • No documentation that radiation levels in public areas are safe • Outdated radiological emergency plans • Incomplete or unknown patient dose benchmarking & CT protocol review • Failure of state, NRC, & TJC inspections • Outdated or non - standardized policy and procedures • Casual or absent privileging for fluoroscopy operators • Radiation over/under – dose, imprecise delivery or unintended exposure due to improper equipment calibration or lock of QA/QC • Lack of checklists, training, oversight • Regulatory non - compliance Medical Imaging Risks Radiation Oncology Risks Employee Monitoring Risks 5
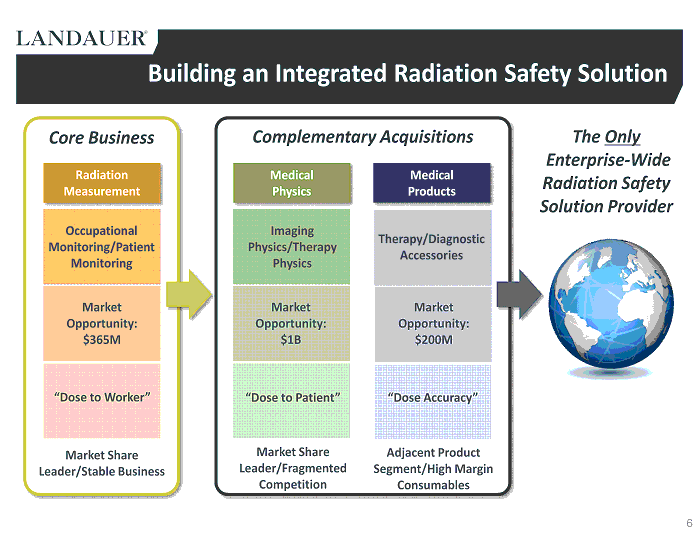
Building an Integrated Radiation Safety Solution Occupational Monitoring/Patient Monitoring Market Opportunity: $ 365M “ Dose to Worker ” Radiation Measurement Market Share Leader/Stable Business Market Share Leader/Fragmented Competition Adjacent Product Segment/High Margin Consumables Core Business Complementary Acquisitions Imaging Physics/Therapy Physics Market Opportunity: $1B “Dose to Patient” Therapy/Diagnostic Accessories Market Opportunity: $200M “Dose Accuracy” The Only Enterprise - Wide Radiation Safety Solution Provider Medical Physics Medical Products 6

Attractive Niche Business Model – Annuity Focused Hospitals Nuclear Power Medical Imaging Industry Radiation Measurement Therapy Imaging Commissioning Medical Physics Image Guided Procedures Radiation Therapy Medical Products Strong, Stable Core Business with Growth Opportunities Complementary Growth Businesses 77% of LDR’s Operating Income 23% of LDR’s Operating Income 7 90 % Annuity Service 10% Equipment 90% Annuity Service 10% Episodic 100% Consumables

* Note: Fiscal 2009 Net Income excludes $1.8M after - tax impact of charges Driving Strong Cash Flows… Revenue, Net Income & Cash Flow from Operations ($ in Millions) 8 75.2 79.0 82.1 90.0 93.8 114.4 120.5 152.4 19 20 21 23 25* 24 25 19 21 24 28 35 31 26 31 36 28% 30% 34% 39% 33% 23% 26% 24% 0% 10% 20% 30% 40% 50% $0M $20M $40M $60M $80M $100M $120M $140M $160M $180M $200M 2005 2006 2007 2008 2009 2010 2011 2012 Revenue Net Income Cash Flow % Revenue Net Income Cash Flow Margin

…and Generating Robust Dividend Payments “Best In Class” Dividend Yield 0.0% 0.5% 1.0% 1.5% 2.0% 2.5% 3.0% 3.5% 4.0% 4.5% 5.0% $0.60 $0.80 $1.00 $1.20 $1.40 $1.60 $1.80 $2.00 $2.20 $2.40 Sep - 03 Sep - 04 Sep - 05 Sep - 06 Sep - 07 Sep - 08 Sep - 09 Sep - 10 Sep - 11 Sep - 12 Annual Dividend Per Share Annual Dividend per Share Avg Dividend Yield 9

Executing a Successful Strategy Optimize Core Competitive Growth Strategic Expansion Deliver Sustainable Long Term Growth and Maximize Total Shareholder Returns 10

Radiation Measurement Strategic Initiatives □ Management/Structure • New Segment President Q3 FY 2012 □ IT Platform Enhancement • Went live in July 2012 • Order to Cash Functionality • Full System Functionality, Declining Stabilization Expenses □ Global Shared Services • Sales/Marketing • Manufacturing/Operations • Finance/Human Resources 2012 Revenue: $108M 2012 Operating Income: $21.5M □ International Expansion • $11M in 2005; $30M in 2012 • 11 Countries in 2005; 44 countries in 2012 □ New Channels/Existing Technologies • Military, First Responder • $23+ million new orders □ New Products/Existing Technology • Patient Monitoring □ Informatics Expansion • Leverage dose history information for 1.6 million participants □ Business Development • Assessing Global Opportunities □ New Technology/New Products • Next Generation Dosimetry Platform Investments Radiation Measurement Strategic Expansion Competitive Growth Optimize the Core 11
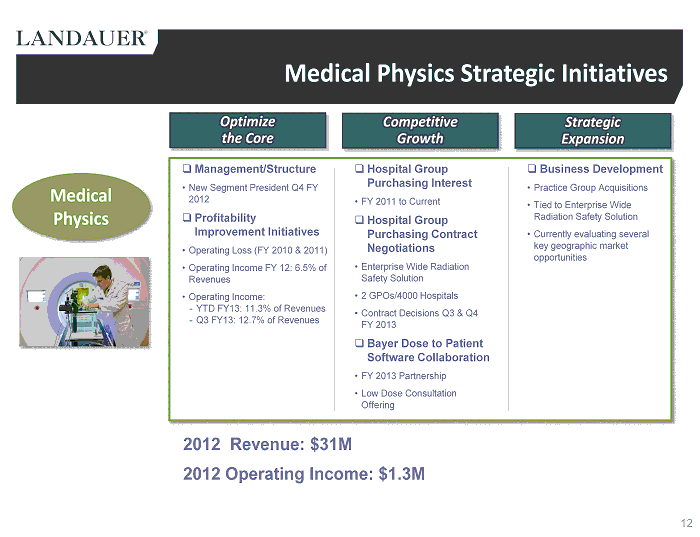
Medical Physics Strategic Initiatives □ Management/Structure • New Segment President Q4 FY 2012 □ Profitability Improvement Initiatives • Operating Loss (FY 2010 & 2011) • Operating Income FY 12: 6.5% of Revenues • Operating Income: - YTD FY13: 11.3% of Revenues - Q3 FY13: 12.7% of Revenues □ Hospital Group Purchasing Interest • FY 2011 to Current □ Hospital Group Purchasing Contract Negotiations • Enterprise Wide Radiation Safety Solution • 2 GPOs/4000 Hospitals • Contract Decisions Q3 & Q4 FY 2013 □ Bayer Dose to Patient Software Collaboration • FY 2013 Partnership • Low Dose Consultation Offering □ Business Development • Practice Group Acquisitions • Tied to Enterprise Wide Radiation Safety Solution • Currently evaluating several key geographic market opportunities 2012 Revenue : $ 31M 2012 Operating Income : $1.3M Medical Physics 12 Strategic Expansion Competitive Growth Optimize the Core
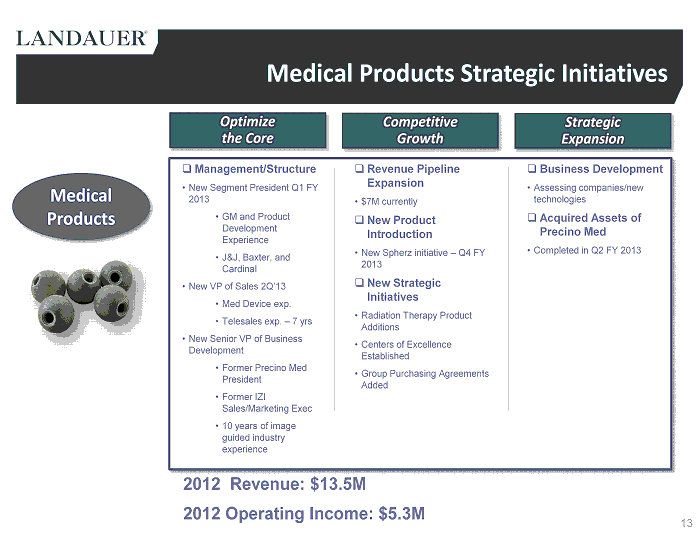
Medical Products Strategic Initiatives □ Management/Structure • New Segment President Q1 FY 2013 • GM and Product Development Experience • J&J, Baxter, and Cardinal • New VP of Sales 2Q’13 • Med Device exp. • Telesales exp. – 7 yrs • New Senior VP of Business Development • Former Precino Med President • Former IZI Sales/Marketing Exec • 10 years of image guided industry experience □ Revenue Pipeline Expansion • $7M currently □ New Product Introduction • New Spherz initiative – Q4 FY 2013 □ New Strategic Initiatives • Radiation Therapy Product Additions • Centers of Excellence Established • Group Purchasing Agreements Added □ Business Development • Assessing companies/new technologies □ Acquired Assets of Precino Med • Completed in Q2 FY 2013 2012 Revenue: $13.5M 2012 Operating Income: $5.3M Medical Products 13 Strategic Expansion Competitive Growth Optimize the Core

Q3 FY 2013 Highlights Radiation Measurement ▪ Top Line Initiatives ▪ Bottom Line Initiatives Strategic Expansion • Patient monitoring – new Microstar system introduction in Q4 FY 2013 • Next generation dosimetry platform – R&D development Competitive Growth • Group purchasing changing dynamics • Radwatch military sales of $3.0M since Q2 FY 2013 Optimize the Core • IT system stabilization • More than 8,500 customers on new system/ 3,000 on legacy system • Globalization/Shared Services Efficiency Medical Physics • Strategic acquisitions represent new revenue opportunities – tied to integrated delivery networks • Currently assessing multiple acquisitions • Hospital group purchasing contract negotiations – 2 GPOs/4000 hospitals • Enterprise wide radiation safety solution presented to largest US GPO • Optimize personnel utilization • Exit low margin legacy contracts • 11.3% operating margin YTD‘13, compared to 6.7% in FY ‘12 Medical Products • Acquired assets of Precino Med • Focus on image - guided surgery, radiation therapy and advanced medical imaging • Focus on $7M pipeline execution • New Spherz initiative - Q4 FY 2013 • New senior leadership team installed 14

Q3 FY 2013 Highlights Innovative New Products Radwatch “Cloud based Data Management” http:// youtube/ETsvfary6m0 Radiation Measurement 15 MicroStar 2 “Patient Dose Data Management”

Financial Overview Respect Innovation Honesty Reliability

Landauer Financial Overview ($ in millions, FYE 9/30) Revenue $93.8 $114.4 $120.5 $ 152.4 $ 152.5* 2009 2010 2011 2012 2013E ($ in millions, FYE 9/30) Adjusted EBITDA $45.3 $46.6 $ 48.5 $54.2 $48* 2009 2010 2011 2012 2013E ▪ Approximately 90 % of revenue derived from subscription and is recurring in nature ▪ Core business growing organically in the 3 % to 5 % range going forward ▪ Contract with U . S . military to replace its antiquated radiation monitoring system provides opportunities to expand to other global military and first responder markets ▪ Strategic expansion contributing to long term growth prospects ▪ Strong history of EBITDA to support dividend return to shareholders, reinvestment in the core business and capital required to support strategic expansion ▪ 27 % growth in revenue and 12 % growth in EBITDA in FY 2012 reflecting execution of business strategy * Midpoint of guidance (8/6) 17

3Q’ FY13 Financial Highlights Adjusted EBITDA ▪ Revenue of $ 36 . 6 million in the third quarter of fiscal 2013 ▪ Goodwill impairment charge of $ 22 . 7 million related to the carrying value of the Medical Products business ▪ Operating loss of $ 16 . 8 million includes goodwill impairment charge ( $ 22 . 7 million ), IT platform enhancement expense ( $ 1 . 7 million), and additional customer service support ( $ 0 . 2 million ), versus prior year period . Adjusted Operating income for non - cash impairment : $ 6 . 9 million . ▪ Net loss of $ 13 . 8 million, or $ 1 . 46 loss per diluted share, included goodwill impairment charge ( $ 1 . 88 per share), IT platform enhancement expenses ( $ 0 . 13 per share), and additional customer service support ( $ 0 . 02 per share ), versus prior year period . Adjusted Net Income for non - cash impairment : $ 4 . 0 million . ▪ Adjusted EBITDA of $ 11 . 1 million ▪ Anticipate restructuring charges of approximately $ 0 . 7 million in the fourth quarter of fiscal 2013 associated with a global optimization initiative within the Radiation Measurement business, generating operating expense reductions of approximately $ 1 . 3 million annually $26 $80 $8 $23 $2 $7 $ 152.5* $0 $50 $100 $150 $200 Q3 2012 YTD FY 2013 Estimate Thousands Radiation Measurement Medical Physics $11 $35 $48* $0 $10 $20 $30 $40 $50 $60 Q3 2012 YTD FY 2013 Estimate Thousands Revenue 18 * Midpoint of guidance (8/6)

FY 2013 Outlook vs. FY 2012 Actual Fiscal Year 2013 Outlook - Updated ▪ Expected Revenue $150 to $155 million, which includes a full year of contributions from IZI Medical Products acquisition, versus 10.5 months in fiscal 2012 ▪ Adjusted EBITDA of $47 to $49 million ▪ Net Income of $18.5 to $ 20.5 million, not including impact of impairment charge Outlook ▪ New IT Platform Enhancement: $ 4.3 million incremental (Non - cash $2.4 million) ▪ Non - cash Stock Based Compensation Expense: $ 0.2 million incremental ▪ Impact from reduced high margin IZI revenue 19

20 Dividend Policy ▪ Board of Directors declared a regular quarterly cash dividend of $0.55 per share for the third quarter of fiscal 2013 – This represents an annual rate of $2.20 per share, consistent with fiscal 2013 levels – For the t hird fiscal quarter, the dividend was paid on July 3 , 2013 to shareholders of record on June 7, 2013 Recent Dividend Payment

Appendix Respect Innovation Honesty Reliability

Landauer, Inc. is a recognized leader in personal and environmental radiation measurement and monitoring, outsourced medical physics services and high - quality medical consumable accessories LDR Corporate Evolution InLight product technology released Acquired IZI Medical Products: Genesis of Medical Products Segment Estimated Revenues of $150M to $155M for FY’13 • Adjusted EBITDA of $51M to $53M • Net Income of $21M to $23M Raised annual dividend rate from $2.15 to $2.20 Acquired Global Physics Solutions: Genesis of Medical Physics Segment First launch of RadWatch solution Bill Saxelby named President and CEO Reported FY’06 Revenue of $79M • Initiated global IT Systems overhaul • Replaced 35 year old IBM Mainframe • Michael Burke appointed to CFO • Greg Groenke appointed Pres / GM IZI Medical Products • Mike Kaminski appointed Pres / GM Radiation Measurement • Systems Initiative Phase 3.0 Completed • Successful System Launch $ 22 2005 2009 2010 2011 2012 2013 2006 2007 2008
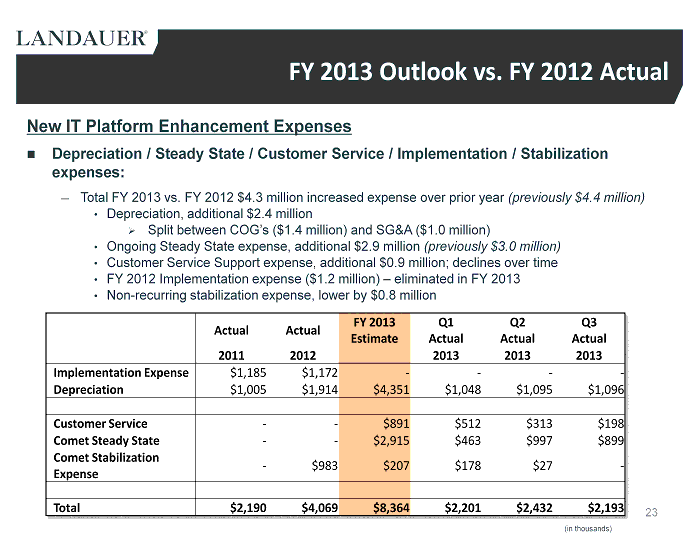
23 New IT Platform Enhancement Expenses Depreciation / Steady State / Customer Service / Implementation / Stabilization expenses: ― Total FY 2013 vs. FY 2012 $ 4.3 million increased expense over prior year (previously $4.4 million) • Depreciation, additional $2.4 million » Split between COG’s ($1.4 million) and SG&A ($1.0 million ) • Ongoing Steady State expense, additional $2.9 million (previously $3.0 million) • Customer Service Support expense, additional $0.9 million; declines over time • FY 2012 Implementation expense ($1.2 million) – eliminated in FY 2013 • Non - recurring stabilization expense, lower by $0.8 million FY 2013 Outlook vs. FY 2012 Actual Actual Actual FY 2013 Estimate Q1 Actual Q2 Actual Q3 Actual 2011 2012 2013 2013 2013 Implementation Expense $1,185 $1,172 - - - - Depreciation $1,005 $1,914 $4,351 $1,048 $1,095 $ 1,096 Customer Service - - $891 $512 $313 $198 Comet Steady State - - $2,915 $463 $997 $899 Comet Stabilization Expense - $983 $207 $178 $27 - Total $2,190 $4,069 $8,364 $2,201 $2,432 $ 2,193 (in thousands)

• Customer Records - o ver 500M records migrated from IBM legacy system to new IT System platform • LDR Data Center Co - location Strategy – Phase 1.0 (FY12), Phase 2.0 (FY13). Disaster Recovery / • Redundancy / Risk Mitigation: total investment to date $3.4M • Landauer Databases – over 325% increase in databases supported: 75 325 • Landauer Application Servers - 450 % growth in servers: 45 250 • MyLDR.com - 9,000+ Customers vs. 3000 Customers on IBM legacy systems • RadWatch Military / Emergency Response Software - enabled $7.1M revenue achievement in FY12 • MicroStar Software Platform – over 400 Customers supported since 2007. Enabled $9M one - time revenue, and $500K recurring revenue since 2011; new microSTARii launched Q4, FY13 • Independent Laboratory Systems – 15 Global Customer installations / infrastructure support since April, 2009 • RadWizard Data Management System – Over 600 Customers / over 150K participants monitored • Customer Facing Solutions – 45 developed since 2007 • Application Portfolio – over 300 different application solutions supported: customers & internal solutions LDR IT Evolution: 2006 - 2013 Applications (since 2007) Infrastructure (since 2007) 2003 Luxel + Technology introduced 2005 InLight Product Technology released 2007 • COMET Program started • 229 Applications Supported 20 10 • Nagase Landauer online w/ ILS • COMET Phase 1 Finance released 20 09 • First ILS Software Solution Developed • SIS and RadWizard released to market 20 11 • COMET Phase 2.0 myLDR.com 1.0 • RadWizard 2.0 20 12 • COMET Phase 3.0, myLDR.com 2.0 • RadWizard 3.0 • Landauer Data Center Phase 1.0 Landauer I/T Org: Basis of Support 24 20 13 • Landauer Data Center Phase 2.0
