Attached files
| file | filename |
|---|---|
| 8-K - FORM 8-K - Cole Real Estate Investments, Inc. | d580530d8k.htm |
| EX-99.2 - EX-99.2 - Cole Real Estate Investments, Inc. | d580530dex992.htm |
| EX-99.1 - EX-99.1 - Cole Real Estate Investments, Inc. | d580530dex991.htm |
Exhibit 99.3

Supplemental Financial Information
Second Quarter 2013, Unaudited
August 5, 2013
Cole Real Estate Investments, Inc.
(f/k/a Cole Credit Property Trust III, Inc.)
Supplemental Unaudited Operating and Financial Data
As of and for the three months ended June 30, 2013
| Highlights |
3 | |||
| Financial Information |
||||
| Condensed Consolidated Unaudited Balance Sheets |
8 | |||
| Condensed Consolidated Unaudited Statements of Operations |
9 | |||
| Financial and Operational Statistics |
10 | |||
| Segment Reporting |
11 | |||
| Reconciliation of GAAP Net Income to Normalized EBITDA |
12 | |||
| Reconciliation of GAAP Net Income to FFO and AFFO |
13 | |||
| Adjusted G&A |
15 | |||
| Debt Overview |
16 | |||
| Real Estate Investment |
||||
| Real Estate Portfolio Diversification |
17 | |||
| Same Store Summary |
18 | |||
| Tenant Diversification |
19 | |||
| Industry Diversification |
21 | |||
| Geographic Diversification |
22 | |||
| Lease Expirations |
24 | |||
| Multi-Tenant Property Summary |
25 | |||
| Unconsolidated Joint Venture Investment Summary |
28 | |||
| Private Capital Management |
||||
| Managed Programs |
29 | |||
| Terms and Definitions |
32 | |||
2
Cole Real Estate Investments Announces Record Second Quarter 2013 Financial Results
Increasing the Dividend and Increasing Second Half 2013 Guidance
PHOENIX, August 5, 2013 – Cole Real Estate Investments, Inc. (NYSE: COLE), a market-leading net lease REIT, today announced record financial results for the second quarter ended June 30, 2013.
Second Quarter 2013 Consolidated Highlights
| • | NYSE Listing – Shares began trading on the NYSE on June 20, 2013 and received early inclusion in the MSCI U.S. REIT Index (RMS/RMZ) on July 3, 2013 |
| • | Record Operating Results – Reported consolidated revenue of $250.3 million and net income of $29.1 million, a 91% and 26% year-over-year increase from the second quarter of 2012, respectively |
| • | Record AFFO – Reported consolidated AFFO of $0.23 per diluted share, a 44% year-over-year increase from the second quarter of 2012, which includes $0.03 per diluted share from the private capital management segment |
| • | Accretive Acquisitions – $266 million was acquired in the second quarter 2013 with a weighted average annual lease yield of 7.7% and $1.3 billion of assets were acquired over the past four quarters with a weighted average annual lease yield of 7.8% |
| • | Robust Private Capital Flows – $508 million of capital was raised on behalf of our managed REITs in the second quarter 2013 and also achieved a record-breaking month of $509 million of capital raised during July |
| • | Increased Guidance – 10% increase in second half AFFO guidance to the new range of $0.42 to $0.47 per diluted share |
| • | Increased Dividends – Increased the annual distribution rate to $0.72 from $0.70 per share effective with the August dividend payable September 3, 2013, which represents an 11% increase over the past two quarters |
| • | Tender Offer – Commenced a modified “Dutch auction” tender offer to purchase $250 million of shares currently scheduled to expire on August 8, 2013 |
| • | Share Repurchase Program – Authorized to repurchase up to $250 million of shares in the open market starting on the 11th business day following completion of the tender offer |
Real Estate Investment Segment Highlights
| • | Revenue and net income of $167.6 million and $19.9 million, respectively |
| • | AFFO of $0.20 per diluted share, an increase of 25% over the second quarter of 2012 |
| • | Normalized EBITDA of $139.3 million, an increase of 27% over the second quarter of 2012 |
| • | Acquired six properties with a weighted average annual lease yield of 7.7% and generated an 18% net gain on five properties sold at a weighted average annual lease yield of 7.5% |
| • | Increased the unsecured credit facility to $1.4 billion from $858 million, extended the term of the revolving loans to June 2017 and the term loan to June 2018 and decreased the weighted average interest rate to 2.9% from 3.0% |
| • | Total portfolio occupancy of 99.1%, investment grade tenancy of 55%, and a weighted average remaining lease term of 12.2 years as of June 30, 2013 |
-more-
3
Private Capital Management Segment Highlights
| • | Revenue and net income of $82.6 million and $9.2 million, respectively |
| • | AFFO of $0.03 per diluted share and Normalized EBITDA of $15.1 million |
| • | Structured $1.1 billion of real estate acquisitions and $422 million of real estate financing on behalf of the managed REITs in the second quarter 2013 |
| • | Merger between Cole Credit Property Trust II, Inc. (“CCPT II”) and Spirit Realty Capital, Inc. (NYSE Ticker: SRC) completed on July 17, 2013 |
| • | Cole Corporate Income Trust, Inc. (“CCIT”) announced the close of its offering on September 30, 2013 and CCIT’s Board of Directors has determined to begin the evaluation of potential strategies to provide CCIT stockholders with liquidity |
Second Quarter 2013 Financial Results
Revenue
Consolidated revenue for the quarter ended June 30, 2013 increased 91% to $250.3 million, as compared to $131.4 million for the same quarter in 2012. This increase was due to an increase in revenue from the Real Estate Investment segment and the inclusion of revenue from the Private Capital Management segment, which was acquired on April 5, 2013.
Revenue for the Real Estate Investment segment for the quarter ended June 30, 2013 increased 28% to $167.6 million, as compared to $131.4 million for the same quarter in 2012. This increase was primarily due to a $1.0 billion increase in the average gross real estate assets net of gross intangible lease liabilities we owned, for the three months ended June 30, 2013, compared to the three months ended June 30, 2012. In addition, “same store” base rental revenue increased by 1.1% as compared to the year-ago quarter. Revenue for the Private Capital Management segment for the quarter ended June 30, 2013 was $82.6 million before reallowed fees and commissions.
4
Normalized EBITDA
Consolidated Normalized EBITDA increased 40% to $154.3 million for the quarter ended June 30, 2013, compared to $110.0 million for the same quarter in 2012. Normalized EBITDA for the Real Estate Investment segment increased 27% to $139.3 million for the quarter ended June 30, 2013, compared to $110.0 million for the year-ago quarter. Normalized EBITDA for the Private Capital Management segment was $15.0 million for the quarter ended June 30, 2013.
Net Income
Net income increased 26% to $29.1 million for the quarter ended June 30, 2013, compared to $23.1 million for the same quarter in 2012.
FFO and FFO per diluted share
Funds from Operations (FFO) for the quarter ended June 30, 2013, increased 17% to $76.2 million, or $0.16 per diluted share, as compared to $65.0 million, or $0.14 per diluted share, for the same quarter in 2012.
AFFO and AFFO per diluted share
Adjusted Funds from Operations (AFFO) for the quarter ended June 30, 2013, increased 44% to $110.8 million, or $0.23 per diluted share, as compared to $76.8 million, or $0.16 per diluted share, for the same quarter in 2012. AFFO for the Real Estate Investment segment increased 25% to $95.7 million, or $0.20 per diluted share for the quarter ended June 30, 2013, compared to $76.8 million, or $0.16 per diluted share, for the year-ago quarter. AFFO for the Private Capital Management segment was $15.1 million, or $0.03 per diluted share, for the quarter ended June 30, 2013.
Balance Sheet
As of June 30, 2013, Cole had total assets of $7.9 billion, unrestricted cash and cash equivalents of $167.5 million, total debt of $3.5 billion and $566.2 million available for borrowing under its senior unsecured credit facility. The leverage ratio of total debt to gross real estate and related assets was 47% and net debt, which represents total debt less cash, to annualized Normalized EBITDA was 5.4x.
During the second quarter, the Company increased the size of its senior unsecured credit facility to $1.4 billion from $858 million, extended the term of the revolving loans to June 2017 and the term loan to June 2018, while also decreasing the weighted average interest rate to 2.9% from 3.0%.
Tender Offer
On June 20, 2013, Cole commenced a modified “Dutch auction” tender offer to purchase for cash up to $250 million of shares of common stock on the terms and subject to the conditions described in its Offer to Purchase of that date. The tender offer and withdrawal rights will expire at 5:00 p.m. Eastern on August 8, 2013.
Increased Distributions
On August 2, 2013, Cole’s Board of Directors increased the amounts of the previously declared monthly dividends for August and September to $0.06 per share, representing an increase in the annual distribution rate to $0.72 from $0.70 per share. As previously announced, these dividends will be paid to stockholders of record as of August 30 and September 30, 2013, respectively, and the payments dates will be September 3 and October 1, 2013, respectively. The Board also declared a monthly dividend in the amount of $0.06 per share for the month of October 2013, which will be payable on November 1, 2013 to stockholders of record as of October 31, 2013.
5
Increased Second Half 2013 Guidance
The Company increased its guidance for the second half, as follows:
| • | Total revenue guidance increased by 18% to the range of $557 million to $585 million and is comprised of: |
| • | Real Estate Investment segment revenue in the range of $327 million to $335 million |
| • | Private Capital Management segment revenue (on a gross basis before reallowed fees and commissions) in the range of $230 million to $250 million |
| • | Normalized EBITDA guidance increased by 11% to the range of $297 million to $324 million |
| • | AFFO per diluted share guidance increased by 10% to the range of $0.42 to $0.47 |
Business Segment Descriptions
Real Estate Investment
As of June 30, 2013, the Company owned 1,014 properties in 48 states with 44.0 million rentable square feet, including properties owned through Consolidated Joint Ventures. Property types owned include single and multi-tenant retail, single tenant office and single tenant industrial. The Company also owned 21 CMBS bonds and three notes receivable and had interests in 12 properties with 2.3 million rentable square feet of commercial and retail space through Unconsolidated Joint Ventures. Total gross asset value of the portfolio was $7.5 billion.
During the second quarter of 2013, the Company acquired six properties for an aggregate purchase price of $266 million, which included one property acquired through a joint venture arrangement.
Also during the second quarter, the Company sold five properties for an aggregate sale price of $31.5 million, recognizing a $4.9 million gain on sale during the second quarter of 2013.
Private Capital Management
As of June 30, 2013, the Company through subsidiaries, collectively known as Cole Capital™, was the advisor to five publicly registered, non-listed REITs (“managed REITs”), for which it provides capital raising, acquisition, financing, leasing, asset management and shareholder services. As of June 30, 2013 the managed REITs, including CCPT II, owned 1,096 properties, with 37.0 million rentable square feet of single and multi-tenant retail and commercial space, representing $6.5 billion in gross real estate assets. Of the managed REITs properties, CCPT II owned 747 properties with 21.1 million square feet, representing $3.5 billion in gross real estate assets. On July 17, 2013, the merger of CCPT II and Spirit Realty Capital, Inc. was completed.
6
About Cole Real Estate Investments, Inc.
Cole is a real estate investment trust that owns and operates a diversified portfolio of core commercial real estate investments primarily consisting of 1,014 necessity retail, office and industrial properties located throughout the United States. Cole’s portfolio comprises more than 44.0 million square feet of rentable space located in 48 states, including properties owned through consolidated joint venture arrangements. As of June 30, 2013, the rentable space at these properties was 99.1% leased and the weighted average remaining lease term was 12.2 years. As of June 30, 2013, the Company also owned 21 CMBS and three notes receivable. In addition, through unconsolidated joint venture arrangements, as of June 30, 2013, the Company had interests in 12 properties comprising 2.3 million rentable square feet of commercial and retail space.
As of June 30, 2013, the Company was the advisor to Cole Credit Property Trust, Inc. (“CCPT”), CCPT II, Cole Credit Property Trust IV, Inc. (“CCPT IV”), CCIT and Cole Real Estate Income Strategy (Daily NAV), Inc. (“INAV”, collectively with CCPT, CCPT II, CCPT IV and CCIT, the “Managed REITs”). In addition, the Company sponsored 1031 programs and performs property management services for the related properties (collectively, with the Managed REITs, the “Managed Programs”). As of June 30, 2013, the Managed Programs owned 1,096 properties, comprising 37.0 million rentable square feet of single and multi-tenant retail and commercial space. As of June 30, 2013, the rentable space at these properties was 97.5% leased.
Contact for Cole Real Estate Investments, Inc.
| Stephan Keller | Aaron Halfacre, CFA | Jessica Thorsheim | ||
| Executive Vice President, CFO | Head of Strategic Relations | Director, Investor Relations |
Our Investor Relations department can be reached via telephone at (877) 405-2653 or via email at investorrelations@colereit.com.
Forward-Looking Statements
Certain statements contained in this release may be considered forward-looking statements within the meaning of Section 27A of the Securities Act of 1933, as amended (the “Securities Act”), and Section 21E of the Securities Exchange Act of 1934, as amended (the “Exchange Act”). We intend for all such forward-looking statements to be covered by the safe harbor provisions for forward-looking statements contained in Section 27A of the Securities Act and Section 21E of the Exchange Act, as applicable. Such statements include, in particular, statements about Cole’s plans, strategies, and prospects and are subject to certain risks and uncertainties, as well as known and unknown risks, which could cause actual results to differ materially from those projected or anticipated. Therefore, such statements are not intended to be a guarantee of Cole’s performance in future periods. Such forward-looking statements can generally be identified by our use of forward-looking terminology such as “may,” “will,” “would,” “could,” “should,” “expect,” “intend,” “anticipate,” “estimate,” “believe,” “continue,” or other similar words. Readers are cautioned not to place undue reliance on these forward-looking statements, which speak only as of the date of this release. Cole makes no representation or warranty (express or implied) about the accuracy of any such forward-looking statements contained in this release, and does not intend, and undertakes no obligation, to publicly update or revise any forward-looking statements, whether as a result of new information, future events, or otherwise.
7
COLE REAL ESTATE INVESTMENTS, INC.
(F/K/A COLE CREDIT PROPERTY TRUST III, INC.)
CONDENSED CONSOLIDATED UNAUDITED BALANCE SHEETS
(in thousands, except share and per share amounts)
| June 30, 2013 | December 31, 2012 | |||||||
| ASSETS |
||||||||
| Investment in real estate assets: |
||||||||
| Land |
$ | 1,525,353 | $ | 1,488,525 | ||||
| Buildings and improvements, less accumulated depreciation of $249,446 and $187,448, respectively |
4,365,738 | 4,218,182 | ||||||
| Acquired intangible lease assets, less accumulated amortization of $160,308 and $121,894, respectively |
853,137 | 859,985 | ||||||
|
|
|
|
|
|||||
| Total investment in real estate assets, net |
6,744,228 | 6,566,692 | ||||||
| Investment in notes receivable, net |
90,464 | 90,358 | ||||||
| Investment in marketable securities |
10,499 | 51,103 | ||||||
| Investment in marketable securities pledged as collateral |
257,518 | 266,098 | ||||||
| Investment in unconsolidated entities |
94,932 | 96,785 | ||||||
|
|
|
|
|
|||||
| Total investment in real estate assets and related assets, net |
7,197,641 | 7,071,036 | ||||||
| Assets related to real estate held for sale, net |
— | 23,153 | ||||||
| Cash and cash equivalents |
167,474 | 192,504 | ||||||
| Restricted cash |
25,502 | 18,444 | ||||||
| Rents and tenant receivables, less allowance for doubtful accounts of $440 and $337, respectively |
97,956 | 79,569 | ||||||
| Intangible assets, prepaid expenses and other assets, net |
104,332 | 11,790 | ||||||
| Deferred financing costs, less accumulated amortization of $16,248 and $23,105, respectively |
61,835 | 57,229 | ||||||
| Goodwill |
229,102 | — | ||||||
| Leasehold improvements and property and equipment, net |
21,295 | — | ||||||
| Due from affiliates |
8,036 | — | ||||||
|
|
|
|
|
|||||
| Total assets |
$ | 7,913,173 | $ | 7,453,725 | ||||
|
|
|
|
|
|||||
| LIABILITIES AND EQUITY |
||||||||
| Notes payable and other borrowings |
$ | 3,501,428 | $ | 3,292,048 | ||||
| Accounts payable and accrued expenses |
58,115 | 42,756 | ||||||
| Due to affiliates |
— | 4,525 | ||||||
| Acquired below market lease intangibles, less accumulated amortization of $21,303 and $16,389, respectively |
114,934 | 113,607 | ||||||
| Distributions payable |
28,501 | 26,399 | ||||||
| Contingent consideration |
211,143 | 5,341 | ||||||
| Derivative liabilities, deferred rent and other liabilities |
52,968 | 51,639 | ||||||
|
|
|
|
|
|||||
| Total liabilities |
3,967,089 | 3,536,315 | ||||||
|
|
|
|
|
|||||
| Commitments and contingencies |
||||||||
| Redeemable common stock |
— | 234,578 | ||||||
|
|
|
|
|
|||||
| EQUITY: |
||||||||
| Preferred stock, $0.01 par value; 10,000,000 shares authorized, none issued and outstanding |
— | — | ||||||
| Common stock, $0.01 par value; 990,000,000 shares authorized and 489,808,175 and 479,547,099 shares outstanding, respectively |
4,898 | 4,795 | ||||||
| Capital in excess of par value |
4,416,151 | 4,068,015 | ||||||
| Accumulated distributions in excess of earnings |
(510,539 | ) | (416,886 | ) | ||||
| Accumulated other comprehensive income |
18,856 | 23,101 | ||||||
|
|
|
|
|
|||||
| Total stockholders’ equity |
3,929,366 | 3,679,025 | ||||||
| Noncontrolling interests |
16,718 | 3,807 | ||||||
|
|
|
|
|
|||||
| Total equity |
3,946,084 | 3,682,832 | ||||||
|
|
|
|
|
|||||
| Total liabilities and equity |
$ | 7,913,173 | $ | 7,453,725 | ||||
|
|
|
|
|
|||||
8
COLE REAL ESTATE INVESTMENTS, INC.
(F/K/A COLE CREDIT PROPERTY TRUST III, INC.)
CONDENSED CONSOLIDATED UNAUDITED STATEMENTS OF OPERATIONS
(in thousands, except share and per share amounts)
| Three Months Ended June 30, | Six Months Ended June 30, | |||||||||||||||
| 2013 | 2012 | 2013 | 2012 | |||||||||||||
| Revenues: |
||||||||||||||||
| Real estate investment revenue |
$ | 159,812 | $ | 124,910 | $ | 312,089 | $ | 234,066 | ||||||||
| Interest income on real estate-related investments |
7,837 | 6,452 | 15,785 | 10,241 | ||||||||||||
| Private capital management revenue |
82,643 | — | 82,643 | — | ||||||||||||
|
|
|
|
|
|
|
|
|
|||||||||
| Total revenue |
250,292 | 131,362 | 410,517 | 244,307 | ||||||||||||
|
|
|
|
|
|
|
|
|
|||||||||
| Expenses: |
||||||||||||||||
| Reallowed fees and commissions |
38,962 | — | 38,962 | — | ||||||||||||
| General and administrative expenses |
41,436 | 4,652 | 45,467 | 8,676 | ||||||||||||
| Merger related stock-based compensation expense |
10,278 | — | 10,278 | — | ||||||||||||
| Property operating expenses |
17,507 | 11,543 | 33,129 | 21,298 | ||||||||||||
| Property and asset management expenses |
1,393 | 10,988 | 15,302 | 21,043 | ||||||||||||
| Merger and acquisition related expenses |
11,810 | 17,438 | 27,423 | 32,819 | ||||||||||||
| Depreciation and amortization |
56,393 | 38,269 | 104,110 | 71,540 | ||||||||||||
|
|
|
|
|
|
|
|
|
|||||||||
| Total operating expenses |
177,779 | 82,890 | 274,671 | 155,376 | ||||||||||||
|
|
|
|
|
|
|
|
|
|||||||||
| Operating income |
72,513 | 48,472 | 135,846 | 88,931 | ||||||||||||
|
|
|
|
|
|
|
|
|
|||||||||
| Other income (expense): |
||||||||||||||||
| Equity in income of unconsolidated entities |
972 | 552 | 2,281 | 886 | ||||||||||||
| Other (expense) income |
(774 | ) | 675 | (851 | ) | 3,992 | ||||||||||
| Interest expense |
(48,938 | ) | (30,141 | ) | (88,007 | ) | (57,312 | ) | ||||||||
|
|
|
|
|
|
|
|
|
|||||||||
| Total other expense |
(48,740 | ) | (28,914 | ) | (86,577 | ) | (52,434 | ) | ||||||||
|
|
|
|
|
|
|
|
|
|||||||||
| Income from continuing operations before income taxes |
23,773 | 19,558 | 49,269 | 36,497 | ||||||||||||
| Benefit from income taxes |
235 | — | 235 | — | ||||||||||||
|
|
|
|
|
|
|
|
|
|||||||||
| Income from continuing operations |
24,008 | 19,558 | 49,504 | 36,497 | ||||||||||||
|
|
|
|
|
|
|
|
|
|||||||||
| Discontinued operations: |
||||||||||||||||
| Income from discontinued operations |
195 | 3,532 | 838 | 7,762 | ||||||||||||
| Gain on sale of real estate assets |
4,931 | — | 19,007 | 14,781 | ||||||||||||
|
|
|
|
|
|
|
|
|
|||||||||
| Income from discontinued operations |
5,126 | 3,532 | 19,845 | 22,543 | ||||||||||||
|
|
|
|
|
|
|
|
|
|||||||||
| Net income |
29,134 | 23,090 | 69,349 | 59,040 | ||||||||||||
| Net income (loss) allocated to noncontrolling interests |
111 | (133 | ) | 215 | (120 | ) | ||||||||||
|
|
|
|
|
|
|
|
|
|||||||||
| Net income attributable to the Company |
$ | 29,023 | $ | 23,223 | $ | 69,134 | $ | 59,160 | ||||||||
|
|
|
|
|
|
|
|
|
|||||||||
| Basic earnings per share: |
||||||||||||||||
| Income from continuing operations |
$ | 0.05 | $ | 0.04 | $ | 0.10 | $ | 0.08 | ||||||||
| Income from discontinued operations |
$ | 0.01 | $ | 0.01 | $ | 0.04 | $ | 0.05 | ||||||||
| Net income attributable to the Company |
$ | 0.06 | $ | 0.05 | $ | 0.14 | $ | 0.13 | ||||||||
| Diluted earnings per share: |
||||||||||||||||
| Income from continuing operations |
$ | 0.05 | $ | 0.04 | $ | 0.10 | $ | 0.08 | ||||||||
| Income from discontinued operations |
$ | 0.01 | $ | 0.01 | $ | 0.04 | $ | 0.05 | ||||||||
| Net income attributable to the Company |
$ | 0.06 | $ | 0.05 | $ | 0.14 | $ | 0.13 | ||||||||
| Weighted average number of common shares outstanding: |
||||||||||||||||
| Basic |
487,915,368 | 473,159,051 | 484,396,906 | 470,033,648 | ||||||||||||
| Diluted |
491,510,128 | 473,159,051 | 486,194,286 | 470,033,648 | ||||||||||||
| Distributions declared per common share issued |
$ | 0.17 | $ | 0.16 | $ | 0.33 | $ | 0.31 | ||||||||
9
Financial and Operational Statistics
The following table presents certain financial and real estate portfolio information as of and for the three months ended June 30, 2013:
| Market Capitalization |
||||
| Shares outstanding (1) |
489,808,175 | |||
| Closing stock price |
$ | 11.44 | ||
| Market capitalization (thousands) |
$ | 5,603,406 | ||
| Total capitalization (thousands) (2) |
$ | 9,104,834 | ||
| Enterprise value (thousands) (3) |
$ | 8,937,360 | ||
| High stock close price |
$ | 11.55 | ||
| Low stock close price |
$ | 9.85 | ||
| Distributions declared per share (4) |
$ | 0.70 | ||
| Distribution yield (5) |
6.1 | % | ||
| Financial Ratios |
||||
| Debt to enterprise value (3) (6) |
39.2 | % | ||
| Annualized Normalized EBITDA (thousands) (7) (8) |
$ | 617,244 | ||
| Net debt to Annualized Normalized EBITDA (7) (8) (9) |
5.4 | |||
| Gross real estate and related assets (thousands) (10) |
$ | 7,462,923 | ||
| Total debt to gross real estate and related assets (6) (10) |
47.0 | % | ||
| Unsecured debt to gross real estate and related assets (10) |
9.4 | % | ||
| Distribution payout (11) |
76.1 | % | ||
| Interest coverage ratio (7) (12) |
3.15 | |||
| Weighted average cost of debt (13) |
4.22 | % | ||
| Weighted average years to maturity of debt (13) |
6.0 | |||
| Owned Property Information |
||||
| Number of properties |
1,014 | |||
| Number of tenants |
567 | |||
| Total square feet (thousands) |
44,035 | |||
| Occupancy (14) |
99.1 | % | ||
| Weighted average remaining lease term (years) (15) |
12.2 | |||
| Percent of investment grade tenants (16) |
42.4 | % |
| (1) | Excludes shares held in escrow as these are not considered outstanding in accordance with GAAP. |
| (2) | Total capitalization represents market capitalization plus notes payable and other borrowings. |
| (3) | Enterprise value represents total capitalization less cash and cash equivalents. |
| (4) | Represents the annualized distribution per share based on the distribution rate in effect as of June 30, 2013. |
| (5) | Annualized distributions to closing stock price. |
| (6) | Debt represents notes payable and other borrowings. |
| (7) | Normalized EBITDA is a non-GAAP measure. See the Terms and Definitions section that begins on page 32 for a description of our non-GAAP measures and page 12 for a reconciliation of net income to Normalized EBITDA. |
| (8) | Annualized three months ended June 30, 2013. |
| (9) | Net debt represents total GAAP-basis debt less cash. |
| (10) | Gross real estate and related assets represents total gross real estate and related assets, including investments in notes receivables, marketable securities and net investment in unconsolidated entities, net of gross intangible lease liabilities. |
| (11) | Computed by dividing annualized distribution per share by annualized AFFO per share. |
| (12) | Computed by dividing Annualized Normalized EBITDA by interest expense. |
| (13) | Calculated based on the Company’s total debt outstanding of $3.5 billion, which includes $700.0 million outstanding under a senior unsecured credit facility. Rates ranging from 2.44% to 3.44% were used to calculate the variable debt payment obligations in future periods. These were the rates effective as of June 30, 2013. |
| (14) | Percent of leasable square feet for which there is a lease in place. |
| (15) | Calculated using the remaining non-cancelable lease terms. |
| (16) | Based on annualized rental revenue from tenants with credit ratings of BBB- or higher, excluding tenants with implied investment grade ratings. Tenant credit rating may reflect the credit rating of the parent company or a guarantor. |
10
Segment Reporting
The Company operates under two business segments - Real Estate Investment and Private Capital Management. The following table presents a summary of the financial results for each business segment (in thousands):
| Three Months Ended June 30, | Six Months Ended June 30, | |||||||||||||||
| 2013 | 2012 | 2013 | 2012 | |||||||||||||
| Real Estate Investment |
||||||||||||||||
| Rental and other property income |
$ | 144,756 | $ | 114,317 | $ | 283,334 | $ | 214,359 | ||||||||
| Tenant reimbursement income |
15,056 | 10,593 | 28,755 | 19,707 | ||||||||||||
| Interest income on notes receivable |
1,936 | 1,476 | 3,859 | 2,848 | ||||||||||||
| Interest income on marketable securities |
5,901 | 4,976 | 11,926 | 7,393 | ||||||||||||
|
|
|
|
|
|
|
|
|
|||||||||
| Total real estate investment revenue |
167,649 | 131,362 | 327,874 | 244,307 | ||||||||||||
|
|
|
|
|
|
|
|
|
|||||||||
| General and administrative expenses |
12,757 | 4,652 | 16,788 | 8,676 | ||||||||||||
| Merger related stock-based compensation expense |
10,278 | — | 10,278 | — | ||||||||||||
| Property operating expenses |
17,507 | 11,543 | 33,129 | 21,298 | ||||||||||||
| Property and asset management expenses |
1,393 | 10,988 | 15,302 | 21,043 | ||||||||||||
| Merger and acquisition related expenses |
11,810 | 17,438 | 27,423 | 32,819 | ||||||||||||
| Depreciation and amortization |
50,335 | 38,269 | 98,052 | 71,540 | ||||||||||||
|
|
|
|
|
|
|
|
|
|||||||||
| Total operating expenses |
104,080 | 82,890 | 200,972 | 155,376 | ||||||||||||
|
|
|
|
|
|
|
|
|
|||||||||
| Total other expense (1) |
(48,747 | ) | (28,914 | ) | (86,584 | ) | (52,434 | ) | ||||||||
|
|
|
|
|
|
|
|
|
|||||||||
| Income from continuing operations |
14,822 | 19,558 | 40,318 | 36,497 | ||||||||||||
| Income from discontinued operations |
5,126 | 3,532 | 19,845 | 22,543 | ||||||||||||
|
|
|
|
|
|
|
|
|
|||||||||
| Net income |
$ | 19,948 | $ | 23,090 | $ | 60,163 | $ | 59,040 | ||||||||
|
|
|
|
|
|
|
|
|
|||||||||
| Private Capital Management |
||||||||||||||||
| Dealer manager fees, selling commissions and offering reimbursements |
$ | 51,818 | $ | — | $ | 51,818 | $ | — | ||||||||
| Transaction service fees |
21,509 | — | 21,509 | — | ||||||||||||
| Management fees and reimbursements |
9,316 | — | 9,316 | — | ||||||||||||
|
|
|
|
|
|
|
|
|
|||||||||
| Total private capital management revenue |
82,643 | — | 82,643 | — | ||||||||||||
|
|
|
|
|
|
|
|
|
|||||||||
| Reallowed fees and commissions |
38,962 | — | 38,962 | — | ||||||||||||
| General and administrative expenses |
28,679 | — | 28,679 | — | ||||||||||||
| Depreciation and amortization |
6,058 | — | 6,058 | — | ||||||||||||
|
|
|
|
|
|
|
|
|
|||||||||
| Total operating expenses |
73,699 | — | 73,699 | — | ||||||||||||
|
|
|
|
|
|
|
|
|
|||||||||
| Total other income |
7 | — | 7 | — | ||||||||||||
| Benefit from income taxes (2) |
235 | — | 235 | — | ||||||||||||
|
|
|
|
|
|
|
|
|
|||||||||
| Net income |
$ | 9,186 | $ | — | $ | 9,186 | $ | — | ||||||||
|
|
|
|
|
|
|
|
|
|||||||||
| Total Company |
||||||||||||||||
| Total revenue |
$ | 250,292 | $ | 131,362 | $ | 410,517 | $ | 244,307 | ||||||||
| Total operating expenses |
177,779 | 82,890 | 274,671 | 155,376 | ||||||||||||
| Total other expense, net |
(48,740 | ) | (28,914 | ) | (86,577 | ) | (52,434 | ) | ||||||||
| Benefit from income taxes |
235 | — | 235 | — | ||||||||||||
|
|
|
|
|
|
|
|
|
|||||||||
| Income from continuing operations |
24,008 | 19,558 | 49,504 | 36,497 | ||||||||||||
| Income from discontinued operations |
5,126 | 3,532 | 19,845 | 22,543 | ||||||||||||
|
|
|
|
|
|
|
|
|
|||||||||
| Net income |
$ | 29,134 | $ | 23,090 | $ | 69,349 | $ | 59,040 | ||||||||
|
|
|
|
|
|
|
|
|
|||||||||
| (1) | Primarily consists of interest expense. |
| (2) | While most of the business activities of the Company’s Private Capital Management segment are conducted through a subsidiary of the Company that is a taxable REIT subsidiary (“TRS”), revenues and expenses recorded in the TRS for tax purposes are not the same as those included in the Private Capital Management segment in accordance with GAAP. In future periods, we expect to recognize an income tax expense, not a benefit from income taxes. |
| Total Assets as of | ||||||||
| June 30, 2013 | December 31, 2012 | |||||||
| Real estate investment |
$ | 7,546,129 | $ | 7,453,725 | ||||
| Private capital management |
367,044 | — | ||||||
|
|
|
|
|
|||||
| Total company |
$ | 7,913,173 | $ | 7,453,725 | ||||
|
|
|
|
|
|||||
11
Reconciliation of GAAP Net Income to Normalized EBITDA
The calculations of EBITDA and Normalized EBITDA, and reconciliation to net income, which is the most directly comparable GAAP financial measure, are presented in the table below (in thousands):
| Three Months Ended June 30, 2013 | Three Months Ended June 30, 2012 | |||||||||||||||||||||||
| Total | Real Estate Investment |
Private Capital Management |
Total | Real Estate Investment |
Private Capital Management |
|||||||||||||||||||
| Net income attributable to the company |
$ | 29,023 | $ | 19,837 | $ | 9,186 | $ | 23,223 | $ | 23,223 | $ | — | ||||||||||||
| Adjustments: |
||||||||||||||||||||||||
| Interest expense |
48,938 | 48,938 | — | 28,846 | 28,846 | — | ||||||||||||||||||
| Depreciation and amortization |
56,463 | 50,405 | 6,058 | 41,294 | 41,294 | — | ||||||||||||||||||
| Benefit from income taxes |
(235 | ) | — | (235 | ) | — | — | — | ||||||||||||||||
| Proportionate share of adjustments for unconsolidated joint ventures |
111 | 111 | — | (133 | ) | (133 | ) | — | ||||||||||||||||
|
|
|
|
|
|
|
|
|
|
|
|
|
|||||||||||||
| EBITDA (1) |
134,300 | 119,291 | 15,009 | 93,230 | 93,230 | — | ||||||||||||||||||
|
|
|
|
|
|
|
|
|
|
|
|
|
|||||||||||||
| Management adjustments: |
||||||||||||||||||||||||
| Gain on sale of real estate assets |
(4,931 | ) | (4,931 | ) | — | (664 | ) | (664 | ) | — | ||||||||||||||
| Merger and acquisition related expenses |
11,810 | 11,810 | — | 17,438 | 17,438 | — | ||||||||||||||||||
| Merger related stock-based compensation expense |
10,278 | 10,278 | — | — | — | — | ||||||||||||||||||
| Listing and tender offer expenses |
2,854 | 2,854 | — | — | — | — | ||||||||||||||||||
|
|
|
|
|
|
|
|
|
|
|
|
|
|||||||||||||
| Total adjustments |
20,011 | 20,011 | — | 16,774 | 16,774 | — | ||||||||||||||||||
|
|
|
|
|
|
|
|
|
|
|
|
|
|||||||||||||
| Normalized EBITDA (1) |
$ | 154,311 | $ | 139,302 | $ | 15,009 | $ | 110,004 | $ | 110,004 | $ | — | ||||||||||||
|
|
|
|
|
|
|
|
|
|
|
|
|
|||||||||||||
| (1) | EBITDA and Normalized EBITDA are non-GAAP measures. See the Terms and Definitions section that begins on page 32 for a description of our non-GAAP measures. |
12
Reconciliation of GAAP Net Income to
Funds from Operations and Adjusted Funds from Operations
The calculations of funds from operations (FFO) and adjusted funds from operations (AFFO), and reconciliation to net income, which is the most directly comparable GAAP financial measure, are presented in the tables below (in thousands, except share and per share amounts):
| Three Months Ended | ||||||||||||||||||||
| June 30, 2013 |
March 31, 2013 |
December 31, 2012 |
September 30, 2012 |
June 30, 2012 |
||||||||||||||||
| Total Company |
||||||||||||||||||||
| Net income attributable to the company |
$ | 29,023 | $ | 40,111 | $ | 125,611 | $ | 18,567 | $ | 23,223 | ||||||||||
| Depreciation and amortization of real property |
50,405 | 47,835 | 45,516 | 44,380 | 41,294 | |||||||||||||||
| Depreciation and amortization of real estate assets in unconsolidated joint ventures |
1,733 | 1,860 | 2,162 | 1,549 | 1,138 | |||||||||||||||
| Net gain on sale and condemnation of real estate assets |
(4,931 | ) | (13,953 | ) | (93,676 | ) | — | (664 | ) | |||||||||||
|
|
|
|
|
|
|
|
|
|
|
|||||||||||
| FFO - Total Company (1) |
76,230 | 75,853 | 79,613 | 64,496 | 64,991 | |||||||||||||||
| Merger and acquisition related expenses |
11,810 | 15,613 | 17,460 | 13,612 | 17,438 | |||||||||||||||
| Merger related stock-based compensation expense |
10,278 | — | — | — | — | |||||||||||||||
| Listing and tender offering expenses |
2,854 | — | — | — | — | |||||||||||||||
| Amortization of deferred financing costs |
3,958 | 3,753 | 5,477 | 3,859 | 3,379 | |||||||||||||||
| Straight-line rent adjustments |
(8,881 | ) | (9,688 | ) | (8,942 | ) | (8,937 | ) | (8,209 | ) | ||||||||||
| Above/below market lease intangibles amortization, net |
731 | 888 | 834 | 535 | 801 | |||||||||||||||
| Loss on derivatives and extinguishment of debt |
7,782 | — | 3,514 | 9,263 | — | |||||||||||||||
| Loss (gain) on the sale of marketable securities |
1,331 | — | (12,455 | ) | — | — | ||||||||||||||
| Other amortization (accretion), net (2) |
4,547 | (1,375 | ) | (1,524 | ) | (1,403 | ) | (1,190 | ) | |||||||||||
| Proportionate share of adjustments for unconsolidated joint ventures |
121 | 30 | (567 | ) | (888 | ) | (409 | ) | ||||||||||||
|
|
|
|
|
|
|
|
|
|
|
|||||||||||
| AFFO - Total Company (1) (3) |
$ | 110,761 | $ | 85,074 | $ | 83,410 | $ | 80,537 | $ | 76,801 | ||||||||||
|
|
|
|
|
|
|
|
|
|
|
|||||||||||
| FFO per common share, basic |
$ | 0.16 | $ | 0.16 | $ | 0.17 | $ | 0.14 | $ | 0.14 | ||||||||||
| FFO per common share, diluted |
$ | 0.16 | $ | 0.16 | $ | 0.17 | $ | 0.14 | $ | 0.14 | ||||||||||
| AFFO per common share, basic |
$ | 0.23 | $ | 0.18 | $ | 0.17 | $ | 0.17 | $ | 0.16 | ||||||||||
| AFFO per common share, diluted |
$ | 0.23 | $ | 0.18 | $ | 0.17 | $ | 0.17 | $ | 0.16 | ||||||||||
| Distributions paid (including DRIP) |
$ | 83,791 | $ | 76,894 | $ | 77,246 | $ | 77,705 | $ | 76,419 | ||||||||||
| Weighted average shares outstanding, basic |
487,915,368 | 480,819,849 | 478,762,187 | 476,353,149 | 473,159,051 | |||||||||||||||
| Weighted average shares outstanding, diluted |
491,510,128 | 480,819,849 | 478,762,187 | 476,353,149 | 473,159,051 | |||||||||||||||
13
Reconciliation of Net Income to
Funds from Operations and Adjusted Funds from Operations (Continued)
| Three Months Ended | ||||||||||||||||||||
| June 30, 2013 |
March 31, 2013 |
December 31, 2012 |
September 30, 2012 |
June 30, 2012 |
||||||||||||||||
| Real Estate Investment Segment |
||||||||||||||||||||
| Net income attributable to the company |
$ | 19,837 | $ | 40,111 | $ | 125,611 | $ | 18,567 | $ | 23,223 | ||||||||||
| Depreciation and amortization of real property |
50,405 | 47,835 | 45,516 | 44,380 | 41,294 | |||||||||||||||
| Depreciation and amortization of real estate assets in unconsolidated joint ventures |
1,733 | 1,860 | 2,162 | 1,549 | 1,138 | |||||||||||||||
| Net gain on sale and condemnation of real estate assets |
(4,931 | ) | (13,953 | ) | (93,676 | ) | — | (664 | ) | |||||||||||
|
|
|
|
|
|
|
|
|
|
|
|||||||||||
| FFO - Real Estate Investment Segment (1) |
67,044 | 75,853 | 79,613 | 64,496 | 64,991 | |||||||||||||||
| Merger and acquisition related expenses |
11,810 | 15,613 | 17,460 | 13,612 | 17,438 | |||||||||||||||
| Merger related stock-based compensation expense |
10,278 | — | — | — | — | |||||||||||||||
| Listing and tender offering expenses |
2,854 | — | — | — | — | |||||||||||||||
| Amortization of deferred financing costs |
3,958 | 3,753 | 5,477 | 3,859 | 3,379 | |||||||||||||||
| Straight-line rent adjustments |
(8,881 | ) | (9,688 | ) | (8,942 | ) | (8,937 | ) | (8,209 | ) | ||||||||||
| Above/below market lease intangibles amortization, net |
731 | 888 | 834 | 535 | 801 | |||||||||||||||
| Loss on derivatives and extinguishment of debt |
7,782 | — | 3,514 | 9,263 | — | |||||||||||||||
| Loss (gain) on the sale of marketable securities |
1,331 | — | (12,455 | ) | — | — | ||||||||||||||
| Other accretion, net |
(1,365 | ) | (1,375 | ) | (1,524 | ) | (1,403 | ) | (1,190 | ) | ||||||||||
| Proportionate share of adjustments for unconsolidated joint ventures |
121 | 30 | (567 | ) | (888 | ) | (409 | ) | ||||||||||||
|
|
|
|
|
|
|
|
|
|
|
|||||||||||
| AFFO - Real Estate Investment Segment (1) (3) |
$ | 95,663 | $ | 85,074 | $ | 83,410 | $ | 80,537 | $ | 76,801 | ||||||||||
|
|
|
|
|
|
|
|
|
|
|
|||||||||||
| Private Capital Management Segment |
||||||||||||||||||||
| Net income attributable to the company |
$ | 9,186 | $ | — | $ | — | $ | — | $ | — | ||||||||||
| Other amortization, net |
5,912 | — | — | — | — | |||||||||||||||
|
|
|
|
|
|
|
|
|
|
|
|||||||||||
| AFFO - Private Capital Management Segment (1) (3) |
$ | 15,098 | $ | — | $ | — | $ | — | $ | — | ||||||||||
|
|
|
|
|
|
|
|
|
|
|
|||||||||||
| (1) | FFO and AFFO are non-GAAP measures. See the Terms and Definitions section that begins on page 32 for a description of our non-GAAP measures. |
| (2) | Primarily consists of CMBS accretion and amortization of intangible assets. |
| (3) | During the three months ended June 30, 2013, March 31, 2013, December 31, 2012, September 30, 2012 and June 30, 2012, the Company capitalized expenses incurred related to the ongoing maintenance of the properties, including tenant improvements and leasing commissions, of $983,000, $1.3 million, $1.4 million, $2.1 million, and $2.8 million, respectively. |
14
Adjusted G&A
The following table shows information regarding the Company’s general and administrative expenses (in thousands):
| Three Months Ended June 30, 2013 | ||||||||||||
| Total | Real Estate Investment |
Private Capital Management |
||||||||||
| G&A |
$ | 41,436 | $ | 12,757 | $ | 28,679 | ||||||
| Less: |
||||||||||||
| Listing and tender offer expenses |
2,854 | 2,854 | — | |||||||||
| Expense reimbursements from managed programs |
10,836 | — | 10,836 | |||||||||
|
|
|
|
|
|
|
|||||||
| Adjusted G&A (1) |
$ | 27,746 | $ | 9,903 | $ | 17,843 | ||||||
|
|
|
|
|
|
|
|||||||
| (1) | Adjusted G&A is a non-GAAP measure. See the Terms and Definitions section that begins on page 32 for a description of our non-GAAP measures. |
15
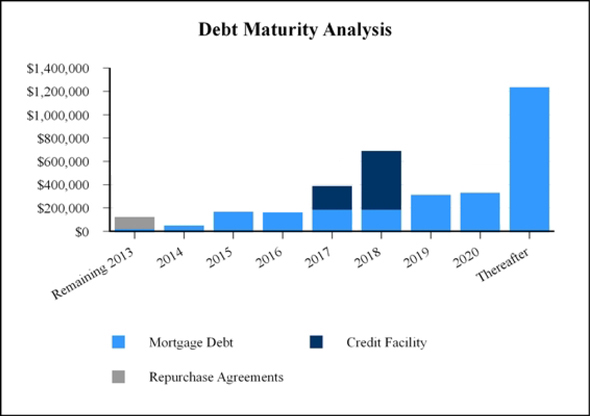
Debt Overview
As of June 30, 2013, the Company had $3.5 billion of debt outstanding, with a weighted average years to maturity of 6.0 years and weighted average interest rate of 4.22%. The following tables show certain information regarding the Company’s debt, as of June 30, 2013 (in thousands):
| Minimum Interest Rate |
Maximum Interest Rate |
Weighted Average Interest Rate |
Weighted Average Years to Maturity |
Balance | ||||||||||||||||
| Fixed rate debt |
2.75 | % | 6.83 | % | 4.74 | % | 6.8 | $ | 2,578,318 | |||||||||||
| Variable rate debt |
|
1m LIBOR + 2.25 |
% |
|
1m LIBOR + 3.25 |
% |
3.01 | % | 3.0 | 96,843 | ||||||||||
| Construction facilities |
|
1m LIBOR + 2.35 |
% |
|
1m LIBOR + 2.35 |
% |
2.54 | % | 0.5 | 26,752 | ||||||||||
| Credit facility - term loan |
3.30 | % | 3.30 | % | 3.30 | % | 4.9 | 500,000 | ||||||||||||
| Credit facility - revolving line of credit |
|
1m LIBOR + 1.65 |
% |
|
1m LIBOR + 2.25 |
% |
1.92 | % | 3.9 | 200,000 | ||||||||||
| Repurchase agreements |
|
3m LIBOR + 1.20 |
% |
|
3m LIBOR + 1.75 |
% |
1.72 | % | 0.1 | 100,057 | ||||||||||
|
|
|
|||||||||||||||||||
| Total |
$ | 3,501,970 | ||||||||||||||||||
|
|
|
|||||||||||||||||||
| Year of Maturity |
Balloon Payments | Amortizing Principal Payments |
Debt Maturity | |||||||||
| Remaining 2013 |
$ | 126,809 | $ | 1,146 | $ | 127,955 | ||||||
| 2014 |
51,809 | 2,338 | 54,147 | |||||||||
| 2015 |
174,000 | 3,191 | 177,191 | |||||||||
| 2016 |
162,836 | 5,892 | 168,728 | |||||||||
| 2017 |
387,089 | 6,064 | 393,153 | |||||||||
| 2018 |
685,385 | 6,545 | 691,930 | |||||||||
| 2019 |
307,648 | 8,225 | 315,873 | |||||||||
| 2020 |
330,065 | 5,444 | 335,509 | |||||||||
| Thereafter |
1,235,294 | 2,190 | 1,237,484 | |||||||||
|
|
|
|
|
|
|
|||||||
| Total |
$ | 3,460,935 | $ | 41,035 | $ | 3,501,970 | ||||||
|
|
|
|
|
|
|
|||||||
16
Real Estate Portfolio Diversification
The following table presents diversifications of the Company’s real estate portfolio, including property type information, as of June 30, 2013:
| Number of Investments |
Rentable Square Feet (thousands) |
Annualized Revenue (1) (thousands) |
% of Annualized Revenue |
Weighted Average Lease Term Remaining (2) |
||||||||||||||||
| Freestanding retail |
886 | 17,740 | $ | 270,685 | 44.3 | % | 14.8 | |||||||||||||
| Multi-tenant retail |
73 | 11,056 | 144,714 | 23.8 | % | 7.5 | ||||||||||||||
| Office |
34 | 5,940 | 108,888 | 17.9 | % | 11.8 | ||||||||||||||
| Industrial |
21 | 9,299 | 43,645 | 7.2 | % | 12.4 | ||||||||||||||
|
|
|
|
|
|
|
|
|
|
|
|||||||||||
| Total real estate assets |
1,014 | 44,035 | 567,932 | 93.2 | % | 12.2 | ||||||||||||||
| Secured notes and CMBS |
24 | N/A | 22,364 | 3.7 | % | N/A | ||||||||||||||
| Unconsolidated joint ventures |
12 | (3) | 2,306 | 18,851 | 3.1 | % | 7.7 | |||||||||||||
|
|
|
|
|
|
|
|
|
|||||||||||||
| Total real estate and related assets |
1,050 | 46,341 | $ | 609,147 | 100.0 | % | ||||||||||||||
|
|
|
|
|
|
|
|
|
|||||||||||||
| (1) | Annualized revenue for real estate assets represents the average annual base rental income over the respective lease terms, including adjustments for rent concessions or abatements, if any. Annualized revenue for the secured notes and CMBS represents average annual interest income over the respective loan term, excluding adjustments for accretion or amortization of discounts or premiums. Annualized revenue for the unconsolidated joint ventures represents the Company’s interest in the average annual base rental income over the respective lease terms, including adjustments for rent concessions or abatements, if any. |
| (2) | Calculated using the non-cancelable lease terms. |
| (3) | Represents properties owned by unconsolidated joint ventures. |
17
Same Store Summary
We review our stabilized operating results from properties that we owned for the entirety of both the current and prior year reporting periods, referred to as “same store.”
The following tables show our same store portfolio statistics, which include 700 properties, acquired prior to April 1, 2012 and owned through June 30, 2013, excluding properties acquired through the Unconsolidated Joint Ventures:
| Three Months Ended June 30, | Increase/(Decrease) | |||||||||||||||
| 2013 | 2012 | $ Change | % Change | |||||||||||||
| Same store base rental revenue (1) |
$ | 101,769 | $ | 100,701 | $ | 1,068 | 1.1 | % | ||||||||
| Same store other rental revenue |
4,994 | 6,013 | (1,019 | ) | (16.9 | )% | ||||||||||
|
|
|
|
|
|
|
|
|
|||||||||
| Total same store rental revenue |
106,763 | 106,714 | 49 | — | % | |||||||||||
| Rental and other property income from income-producing properties acquired subsequent to March 31, 2012 and properties sold prior to June 30, 2013 |
37,993 | 7,603 | 30,390 | 399.7 | % | |||||||||||
|
|
|
|
|
|
|
|
|
|||||||||
| Total rental and other property income |
$ | 144,756 | $ | 114,317 | $ | 30,439 | 26.6 | % | ||||||||
|
|
|
|
|
|
|
|
|
|||||||||
| Base Rental Revenue (in thousands) (1) | ||||||||||||||||||||
| Number of | Three Months Ended June 30, | Increase/(Decrease) | ||||||||||||||||||
| Property Type |
Properties | 2013 | 2012 | $ Change | % Change | |||||||||||||||
| Freestanding retail |
598 | $ | 52,806 | $ | 52,581 | $ | 225 | 0.4 | % | |||||||||||
| Multi-tenant retail |
58 | 26,178 | 25,592 | 586 | 2.3 | % | ||||||||||||||
| Office |
26 | 15,784 | 15,568 | 216 | 1.4 | % | ||||||||||||||
| Industrial |
18 | 7,001 | 6,960 | 41 | 0.6 | % | ||||||||||||||
|
|
|
|
|
|
|
|
|
|
|
|||||||||||
| Total |
700 | $ | 101,769 | $ | 100,701 | $ | 1,068 | 1.1 | % | |||||||||||
|
|
|
|
|
|
|
|
|
|
|
|||||||||||
The following tables show our same store portfolio statistics, which include 647 properties, acquired prior to January 1, 2012 and owned through June 30, 2013, excluding properties acquired through the Unconsolidated Joint Ventures:
| Six Months Ended June 30, | Increase/(Decrease) | |||||||||||||||
| 2013 | 2012 | $ Change | % Change | |||||||||||||
| Same store base rental revenue (1) |
$ | 186,924 | $ | 185,096 | $ | 1,828 | 1.0 | % | ||||||||
| Same store other rental revenue |
9,293 | 10,482 | (1,189 | ) | (11.3 | )% | ||||||||||
|
|
|
|
|
|
|
|
|
|||||||||
| Total same store rental revenue |
196,217 | 195,578 | 639 | 0.3 | % | |||||||||||
| Rental and other property income from income-producing properties acquired subsequent to December 31, 2011 and properties sold prior to June 30, 2013 |
87,117 | 18,781 | 68,336 | 363.9 | % | |||||||||||
|
|
|
|
|
|
|
|
|
|||||||||
| Total rental and other property income |
$ | 283,334 | $ | 214,359 | $ | 68,975 | 32.2 | % | ||||||||
|
|
|
|
|
|
|
|
|
|||||||||
| Base Rental Revenue (in thousands) (1) | ||||||||||||||||||||
| Number of | Six Months Ended June 30, | Increase/(Decrease) | ||||||||||||||||||
| Property Type |
Properties | 2013 | 2012 | $ Change | % Change | |||||||||||||||
| Freestanding retail |
555 | $ | 99,134 | $ | 98,789 | $ | 345 | 0.3 | % | |||||||||||
| Multi-tenant retail |
51 | 44,492 | 43,565 | 927 | 2.1 | % | ||||||||||||||
| Office |
23 | 29,296 | 28,848 | 448 | 1.6 | % | ||||||||||||||
| Industrial |
18 | 14,002 | 13,894 | 108 | 0.8 | % | ||||||||||||||
|
|
|
|
|
|
|
|
|
|
|
|||||||||||
| Total |
647 | $ | 186,924 | $ | 185,096 | $ | 1,828 | 1.0 | % | |||||||||||
|
|
|
|
|
|
|
|
|
|
|
|||||||||||
| (1) | Base rental revenue represents contractual base rental revenue earned and does not include the impact of certain GAAP adjustments to rental revenue, such as straight-line rent and amortization of above market intangible lease assets and below market lease intangible liabilities. Such GAAP adjustments are included in the line item referred to as “same store other rental revenue.” |
18
Tenant Diversification
The following table shows certain information regarding the tenant diversification of the Company’s real estate portfolio, including consolidated joint ventures, as of June 30, 2013:
| Tenant |
Number of Leases |
Number of States |
Leased Square Feet (thousands) |
% of Leased Square Feet |
Annualized Rental Revenue (1) (thousands) |
% of Annualized Rental Revenue |
Weighted Average Lease Term Remaining (2) |
S&P Credit | ||||||||||||||||||||||||
| 1 |
Walgreens | 73 | 30 | 1,078 | 2.5 | % | $ | 27,229 | 4.8 | % | 17.9 | BBB | ||||||||||||||||||||
| 2 |
Albertson’s | 34 | 6 | 1,969 | 4.5 | % | 24,074 | 4.2 | % | 16.8 | B | |||||||||||||||||||||
| 3 |
PetSmart | 42 | 16 | 1,300 | 3.0 | % | 23,800 | 4.2 | % | 8.3 | BB+ | |||||||||||||||||||||
| 4 |
CVS | 54 | 22 | 860 | 2.0 | % | 20,275 | 3.6 | % | 18.1 | BBB+ | |||||||||||||||||||||
| 5 |
BJ’s Wholesale Club | 3 | 8 | 2,230 | 5.1 | % | 19,106 | 3.4 | % | 17.7 | B | |||||||||||||||||||||
| 6 |
Wal-Mart | 9 | 7 | 1,913 | 4.4 | % | 15,320 | 2.7 | % | 11.0 | AA | |||||||||||||||||||||
| 7 |
Apollo Group | 1 | 1 | 600 | 1.4 | % | 14,557 | 2.6 | % | 17.8 | Not Rated | |||||||||||||||||||||
| 8 |
L.A. Fitness | 17 | 8 | 752 | 1.7 | % | 14,208 | 2.5 | % | 11.0 | Not Rated | |||||||||||||||||||||
| 9 |
Amazon | 3 | 2 | 3,048 | 7.0 | % | 13,922 | 2.5 | % | 13.3 | AA- | |||||||||||||||||||||
| 10 |
Home Depot | 12 | 8 | 1,810 | 4.1 | % | 13,207 | 2.3 | % | 14.9 | A- | |||||||||||||||||||||
| 11 |
Kohl’s | 19 | 9 | 1,499 | 3.4 | % | 13,012 | 2.3 | % | 15.1 | BBB+ | |||||||||||||||||||||
| 12 |
Family Dollar | 140 | 26 | 1,185 | 2.7 | % | 12,839 | 2.3 | % | 13.8 | BBB- | |||||||||||||||||||||
| 13 |
Tractor Supply | 42 | 20 | 875 | 2.0 | % | 11,092 | 2.0 | % | 11.7 | Not Rated | |||||||||||||||||||||
| 14 |
Merrill Lynch | 1 | 1 | 482 | 1.1 | % | 10,963 | 1.9 | % | 11.4 | A | |||||||||||||||||||||
| 15 |
Best Buy | 20 | 12 | 673 | 1.5 | % | 9,506 | 1.7 | % | 6.2 | BB | |||||||||||||||||||||
| 16 |
On The Border | 27 | 13 | 190 | 0.4 | % | 8,556 | 1.5 | % | 16.8 | Not Rated | |||||||||||||||||||||
| 17 |
Encana Oil & Gas, USA | 1 | 1 | 319 | 0.7 | % | 7,806 | 1.4 | % | 14.0 | Not Rated | |||||||||||||||||||||
| 18 |
HealthNow | 1 | 1 | 430 | 1.0 | % | 7,722 | 1.4 | % | 11.1 | BBB- | |||||||||||||||||||||
| 19 |
Stripes | 24 | 2 | 140 | 0.3 | % | 6,932 | 1.2 | % | 15.6 | Not Rated | |||||||||||||||||||||
| 20 |
RSA Security | 1 | 1 | 328 | 0.8 | % | 6,915 | 1.2 | % | 10.7 | A | |||||||||||||||||||||
| 21 |
Lowe’s | 9 | 9 | 1,204 | 2.8 | % | 6,445 | 1.1 | % | 13.8 | A- | |||||||||||||||||||||
| 22 |
AT&T | 9 | 7 | 1,021 | 2.3 | % | 6,279 | 1.1 | % | 6.2 | A- | |||||||||||||||||||||
| 23 |
Advance Auto Parts | 45 | 10 | 304 | 0.7 | % | 5,885 | 1.0 | % | 9.9 | BBB- | |||||||||||||||||||||
| 24 |
Cigna | 2 | 2 | 299 | 0.7 | % | 5,773 | 1.0 | % | 9.2 | A+ | |||||||||||||||||||||
| 25 |
Dick’s Sporting Goods | 10 | 6 | 472 | 1.1 | % | 5,650 | 1.0 | % | 6.5 | Not Rated | |||||||||||||||||||||
|
|
|
|
|
|
|
|
|
|
|
|||||||||||||||||||||||
| Top 25 Tenants | 599 | 24,981 | 57.2 | % | $ | 311,073 | 54.9 | % | ||||||||||||||||||||||||
|
|
|
|
|
|
|
|
|
|
|
|||||||||||||||||||||||
19
Tenant Diversification (Continued)
| Tenant |
Number of Leases |
Number of States |
Leased Square Feet (thousands) |
% of Leased Square Feet |
Annualized Rental Revenue (1) (thousands) |
% of Annualized Rental Revenue |
Weighted Average Lease Term Remaining (2) |
S&P Credit | ||||||||||||||||||||||||
| 26 |
Academy Sports | 7 | 4 | 591 | 1.4 | % | $ | 5,464 | 1.0 | % | 14.6 | B | ||||||||||||||||||||
| 27 |
Outback Steakhouse | 20 | 14 | 124 | 0.3 | % | 5,196 | 0.9 | % | 18.8 | B+ | |||||||||||||||||||||
| 28 |
Thorntons Oil | 23 | 4 | 79 | 0.2 | % | 4,935 | 0.9 | % | 12.5 | Not Rated | |||||||||||||||||||||
| 29 |
Aaron Rents | 6 | 17 | 655 | 1.5 | % | 4,912 | 0.9 | % | 11.3 | Not Rated | |||||||||||||||||||||
| 30 |
Ross | 16 | 10 | 466 | 1.1 | % | 4,830 | 0.9 | % | 4.4 | A- | |||||||||||||||||||||
| 31 |
Bed Bath & Beyond | 16 | 10 | 431 | 1.0 | % | 4,677 | 0.8 | % | 4.9 | BBB+ | |||||||||||||||||||||
| 32 |
VA Clinic | 1 | 1 | 66 | 0.2 | % | 4,657 | 0.8 | % | 16.7 | AA+ | |||||||||||||||||||||
| 33 |
The Medicines Company | 1 | 1 | 179 | 0.4 | % | 4,577 | 0.8 | % | 10.4 | Not Rated | |||||||||||||||||||||
| 34 |
Golden Corral | 22 | 7 | 234 | 0.5 | % | 4,391 | 0.8 | % | 13.9 | Not Rated | |||||||||||||||||||||
| 35 |
Giant Eagle | 4 | 1 | 303 | 0.7 | % | 4,365 | 0.8 | % | 14.1 | Not Rated | |||||||||||||||||||||
| 36 |
MedAssets | 1 | 1 | 231 | 0.5 | % | 4,364 | 0.8 | % | 14.7 | B+ | |||||||||||||||||||||
| 37 |
Hobby Lobby | 10 | 8 | 552 | 1.3 | % | 4,306 | 0.8 | % | 7.6 | Not Rated | |||||||||||||||||||||
| 38 |
Applebee’s | 9 | 12 | 95 | 0.2 | % | 4,284 | 0.8 | % | 15.0 | Not Rated | |||||||||||||||||||||
| 39 |
Cracker Barrel | 12 | 5 | 120 | 0.3 | % | 3,929 | 0.7 | % | 15.0 | Not Rated | |||||||||||||||||||||
| 40 |
Wendy’s | 9 | 6 | 107 | 0.2 | % | 3,856 | 0.7 | % | 19.1 | Not Rated | |||||||||||||||||||||
| 41 |
FedEx | 8 | 8 | 390 | 0.9 | % | 3,559 | 0.6 | % | 7.6 | BBB | |||||||||||||||||||||
| 42 |
Stop & Shop | 2 | 2 | 122 | 0.3 | % | 3,521 | 0.6 | % | 18.1 | BBB | |||||||||||||||||||||
| 43 |
Sysmex | 1 | 1 | 163 | 0.4 | % | 3,507 | 0.6 | % | 13.3 | Not Rated | |||||||||||||||||||||
| 44 |
Wells Fargo | 8 | 7 | 241 | 0.6 | % | 3,414 | 0.6 | % | 9.5 | AA- | |||||||||||||||||||||
| 45 |
Ryan’s Buffet | 1 | 9 | 137 | 0.3 | % | 3,373 | 0.6 | % | 9.5 | Not Rated | |||||||||||||||||||||
| 46 |
Igloo | 1 | 1 | 914 | 2.1 | % | 3,345 | 0.6 | % | 11.3 | Not Rated | |||||||||||||||||||||
| 47 |
Banner Life Insurance Company | 1 | 1 | 116 | 0.3 | % | 3,131 | 0.6 | % | 13.2 | AA- | |||||||||||||||||||||
| 48 |
Sam’s Club | 3 | 3 | 373 | 0.9 | % | 3,109 | 0.5 | % | 7.5 | AA | |||||||||||||||||||||
| 49 |
Carmax | 2 | 2 | 116 | 0.3 | % | 3,039 | 0.5 | % | 15.4 | Not Rated | |||||||||||||||||||||
| 50 |
Hanesbrands | 1 | 1 | 930 | 2.1 | % | 2,993 | 0.5 | % | 8.5 | BB | |||||||||||||||||||||
|
|
|
|
|
|
|
|
|
|
|
|||||||||||||||||||||||
| Tenants 26—50 | 185 | 7,735 | 18.0 | % | $ | 101,734 | 18.1 | % | ||||||||||||||||||||||||
|
|
|
|
|
|
|
|
|
|
|
|||||||||||||||||||||||
| Top 50 Tenants | 784 | 32,716 | 75.2 | % | $ | 412,807 | 73.0 | % | ||||||||||||||||||||||||
|
|
|
|
|
|
|
|
|
|
|
|||||||||||||||||||||||
| Total Portfolio | 1,767 | 48 | 43,629 | 100 | % | $ | 567,932 | 100.0 | % | |||||||||||||||||||||||
| (1) | Represents the average annual base rental income over the respective lease terms, including adjustments for rent concessions or abatements, if any. |
| (2) | Calculated using the non-cancelable lease terms. |
| (3) | Standard & Poor’s Credit rating may reflect the credit rating of the parent company or a guarantor. |
20
Industry Diversification
The following table shows certain information regarding the tenant industry diversification of the Company’s real estate portfolio, including consolidated joint ventures, as of June 30, 2013:
| Industry |
Number of Leases |
Number of Tenants |
Number of States |
Leased Square Feet (thousands) |
Annualized Rental Revenue (1) (thousands) |
% of Annualized Rental Revenue |
Weighted Average Lease Term Remaining (2) |
|||||||||||||||||||||
| Grocery |
75 | 25 | 24 | 4,014 | $ | 52,524 | 9.1 | % | 15.3 | |||||||||||||||||||
| Drugstore |
127 | 2 | 36 | 1,938 | 47,504 | 8.4 | % | 18.0 | ||||||||||||||||||||
| Discount store |
228 | 15 | 32 | 4,563 | 44,030 | 7.8 | % | 10.1 | ||||||||||||||||||||
| Full service restaurant |
189 | 80 | 30 | 1,100 | 38,856 | 6.8 | % | 14.6 | ||||||||||||||||||||
| Home and garden |
69 | 9 | 29 | 3,937 | 31,442 | 5.5 | % | 13.4 | ||||||||||||||||||||
| Pet supplies |
49 | 2 | 18 | 1,405 | 25,438 | 4.5 | % | 8.2 | ||||||||||||||||||||
| Warehouse club |
7 | 3 | 11 | 2,767 | 24,200 | 4.3 | % | 16.2 | ||||||||||||||||||||
| Healthcare |
58 | 44 | 17 | 899 | 22,439 | 4.0 | % | 11.2 | ||||||||||||||||||||
| Financial services |
61 | 29 | 14 | 859 | 20,067 | 3.5 | % | 12.0 | ||||||||||||||||||||
| Limited service restaurant |
133 | 57 | 26 | 730 | 18,934 | 3.3 | % | 11.3 | ||||||||||||||||||||
| Convenience store |
82 | 9 | 16 | 346 | 17,567 | 3.1 | % | 14.3 | ||||||||||||||||||||
| Other professional services |
9 | 8 | 8 | 953 | 17,113 | 3.0 | % | 11.1 | ||||||||||||||||||||
| Fitness |
26 | 9 | 10 | 882 | 16,217 | 2.9 | % | 10.7 | ||||||||||||||||||||
| Specialty retail |
96 | 44 | 20 | 1,310 | 15,613 | 2.7 | % | 8.1 | ||||||||||||||||||||
| Education |
6 | 5 | 4 | 632 | 15,127 | 2.7 | % | 17.4 | ||||||||||||||||||||
| Department store |
27 | 6 | 10 | 2,266 | 15,081 | 2.7 | % | 14.8 | ||||||||||||||||||||
| Apparel |
111 | 50 | 12 | 933 | 14,552 | 2.6 | % | 5.0 | ||||||||||||||||||||
| Wholesale |
3 | 1 | 2 | 3,048 | 13,922 | 2.5 | % | 13.3 | ||||||||||||||||||||
| Sporting goods |
25 | 9 | 12 | 1,256 | 13,891 | 2.4 | % | 10.3 | ||||||||||||||||||||
| Manufacturing |
5 | 5 | 5 | 3,207 | 13,295 | 2.3 | % | 10.5 | ||||||||||||||||||||
| Electronics and appliances |
32 | 6 | 18 | 930 | 13,029 | 2.3 | % | 6.8 | ||||||||||||||||||||
| Automotive |
75 | 9 | 19 | 613 | 12,239 | 2.2 | % | 12.5 | ||||||||||||||||||||
| Insurance services |
8 | 6 | 7 | 571 | 11,756 | 2.1 | % | 9.6 | ||||||||||||||||||||
| Hobby, books and music |
46 | 13 | 17 | 995 | 9,957 | 1.8 | % | 5.8 | ||||||||||||||||||||
| Home furnishings |
40 | 15 | 13 | 757 | 8,899 | 1.6 | % | 6.0 | ||||||||||||||||||||
| Communications |
33 | 9 | 11 | 1,076 | 7,991 | 1.4 | % | 5.6 | ||||||||||||||||||||
| Mining and natural resources |
1 | 1 | 1 | 319 | 7,806 | 1.4 | % | 14.0 | ||||||||||||||||||||
| Office supplies |
23 | 4 | 11 | 441 | 6,434 | 1.1 | % | 5.5 | ||||||||||||||||||||
| Logistics (shipping, delivery, warehousing) |
11 | 2 | 11 | 394 | 3,674 | 0.6 | % | 7.4 | ||||||||||||||||||||
| Personal services |
95 | 78 | 14 | 148 | 3,642 | 0.6 | % | 4.0 | ||||||||||||||||||||
| Agriculture |
2 | 2 | 2 | 156 | 1,927 | 0.3 | % | 12.7 | ||||||||||||||||||||
| Technology |
1 | 1 | 1 | 107 | 1,594 | 0.3 | % | 8.5 | ||||||||||||||||||||
| Childcare |
8 | 4 | 5 | 60 | 868 | 0.2 | % | 12.2 | ||||||||||||||||||||
| Government and non-profit |
4 | 3 | 3 | 10 | 177 | — | %(3) | 1.1 | ||||||||||||||||||||
| Real estate services |
1 | 1 | 1 | 4 | 70 | — | %(3) | 0.8 | ||||||||||||||||||||
| Entertainment and recreation |
1 | 1 | 1 | 3 | 57 | — | %(3) | 1.9 | ||||||||||||||||||||
|
|
|
|
|
|
|
|
|
|
|
|
|
|||||||||||||||||
| Total |
1,767 | 567 | 48 | 43,629 | $ | 567,932 | 100.0 | % | ||||||||||||||||||||
|
|
|
|
|
|
|
|
|
|
|
|
|
|||||||||||||||||
| (1) | Represents the average annual base rental income over the respective lease terms, including adjustments for rent concessions or abatements, if any. |
| (2) | Calculated using the non-cancelable lease terms. |
| (3) | Represents less than 0.1% of total annualized rental revenue. |
21
Geographic Diversification
The following table shows certain information regarding the geographic diversification of the Company’s real estate portfolio, including consolidated joint ventures, as of June 30, 2013:
| State |
Number of Properties |
% Leased | Rentable Square Feet (thousands) |
Annualized Rental Revenue (1) (thousands) |
% of Annualized Rental Revenue |
|||||||||||||||
| Texas |
187 | 99.3 | % | 6,446 | $ | 95,967 | 16.9 | % | ||||||||||||
| Arizona |
41 | 99.6 | % | 2,976 | 48,996 | 8.6 | % | |||||||||||||
| California |
22 | 98.8 | % | 2,905 | 40,401 | 7.1 | % | |||||||||||||
| Florida |
81 | 96.9 | % | 3,287 | 39,864 | 7.0 | % | |||||||||||||
| Illinois |
46 | 98.2 | % | 1,548 | 30,851 | 5.4 | % | |||||||||||||
| Georgia |
40 | 99.1 | % | 2,967 | 28,963 | 5.1 | % | |||||||||||||
| Michigan |
43 | 94.2 | % | 1,690 | 21,840 | 3.8 | % | |||||||||||||
| New Jersey |
14 | 100.0 | % | 894 | 20,450 | 3.6 | % | |||||||||||||
| Ohio |
71 | 100.0 | % | 1,709 | 18,114 | 3.2 | % | |||||||||||||
| Virginia |
23 | 97.4 | % | 1,336 | 18,024 | 3.2 | % | |||||||||||||
| South Carolina |
27 | 100.0 | % | 2,148 | 16,885 | 3.0 | % | |||||||||||||
| Alabama |
24 | 99.2 | % | 1,258 | 16,085 | 2.8 | % | |||||||||||||
| Tennessee |
19 | 99.6 | % | 2,529 | 15,577 | 2.7 | % | |||||||||||||
| Massachusetts |
10 | 100.0 | % | 1,222 | 14,332 | 2.5 | % | |||||||||||||
| North Carolina |
33 | 100.0 | % | 1,498 | 13,215 | 2.3 | % | |||||||||||||
| Indiana |
44 | 100.0 | % | 531 | 10,101 | 1.8 | % | |||||||||||||
| New York |
6 | 100.0 | % | 640 | 9,677 | 1.7 | % | |||||||||||||
| Colorado |
15 | 99.2 | % | 803 | 9,123 | 1.6 | % | |||||||||||||
| Louisiana |
31 | 100.0 | % | 866 | 9,032 | 1.6 | % | |||||||||||||
| Pennsylvania |
15 | 99.8 | % | 1,046 | 8,037 | 1.4 | % | |||||||||||||
| New Mexico |
18 | 100.0 | % | 685 | 7,739 | 1.4 | % | |||||||||||||
| Nevada |
17 | 100.0 | % | 699 | 7,428 | 1.3 | % | |||||||||||||
| Maryland |
6 | 100.0 | % | 366 | 7,346 | 1.3 | % | |||||||||||||
| Oklahoma |
20 | 100.0 | % | 386 | 6,918 | 1.2 | % | |||||||||||||
| Missouri |
26 | 100.0 | % | 428 | 6,316 | 1.1 | % | |||||||||||||
| Wisconsin |
16 | 99.7 | % | 381 | 5,905 | 1.0 | % | |||||||||||||
| Iowa |
14 | 100.0 | % | 474 | 4,787 | 0.8 | % | |||||||||||||
| Kentucky |
18 | 100.0 | % | 144 | 3,755 | 0.7 | % | |||||||||||||
| Nebraska |
5 | 100.0 | % | 225 | 3,739 | 0.7 | % | |||||||||||||
| Maine |
14 | 100.0 | % | 282 | 3,325 | 0.6 | % | |||||||||||||
| Mississippi |
11 | 100.0 | % | 258 | 2,899 | 0.5 | % | |||||||||||||
| Arkansas |
13 | 100.0 | % | 246 | 2,671 | 0.5 | % | |||||||||||||
| Minnesota |
8 | 100.0 | % | 116 | 2,649 | 0.5 | % | |||||||||||||
| Kansas |
7 | 100.0 | % | 205 | 2,602 | 0.5 | % | |||||||||||||
| Connecticut |
1 | 100.0 | % | 70 | 2,511 | 0.4 | % | |||||||||||||
| Oregon |
1 | 100.0 | % | 213 | 2,489 | 0.4 | % | |||||||||||||
| New Hampshire |
4 | 100.0 | % | 126 | 2,023 | 0.4 | % | |||||||||||||
| Alaska |
2 | 100.0 | % | 92 | 1,615 | 0.3 | % | |||||||||||||
22
Geographic Diversification (Continued)
| State |
Number of Properties |
% Leased |
Rentable Square Feet (thousands) |
Annualized Rental Revenue (1) (thousands) |
% of Annualized Rental Revenue |
|||||||||||||||
| Rhode Island |
1 | 100.0 | % | 52 | $ | 1,010 | 0.2 | % | ||||||||||||
| Washington |
6 | 100.0 | % | 40 | 939 | 0.2 | % | |||||||||||||
| North Dakota |
1 | 100.0 | % | 70 | 926 | 0.2 | % | |||||||||||||
| Delaware |
2 | 100.0 | % | 35 | 624 | 0.1 | % | |||||||||||||
| Idaho |
2 | 100.0 | % | 24 | 498 | 0.1 | % | |||||||||||||
| Utah |
2 | 100.0 | % | 63 | 496 | 0.1 | % | |||||||||||||
| South Dakota |
2 | 100.0 | % | 22 | 491 | 0.1 | % | |||||||||||||
| West Virginia |
1 | 100.0 | % | 11 | 302 | 0.1 | % | |||||||||||||
| Montana |
1 | 100.0 | % | 16 | 261 | — | %(2) | |||||||||||||
| Vermont |
3 | 100.0 | % | 7 | 134 | — | %(2) | |||||||||||||
|
|
|
|
|
|
|
|
|
|
|
|||||||||||
| Total |
1,014 | 99.1 | % | 44,035 | $ | 567,932 | 100.0 | % | ||||||||||||
|
|
|
|
|
|
|
|
|
|
|
|||||||||||
| (1) | Represents the average annual base rental income over the respective lease terms, including adjustments for rent concessions or abatements, if any. |
| (2) | Represents less than 0.1% of total annualized rental revenue. |
23
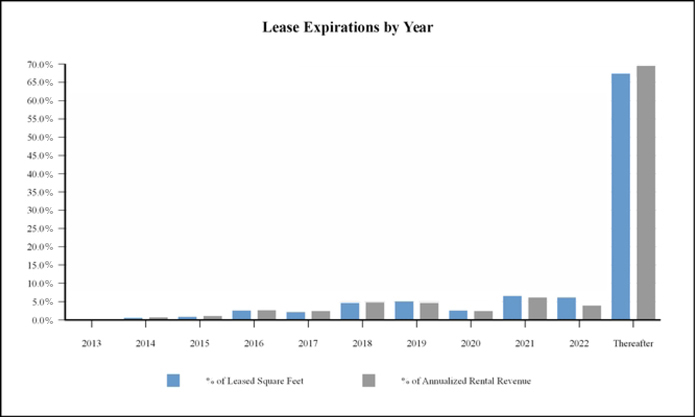
Lease Expirations
The following table shows certain information regarding the lease expirations of the Company’s real estate portfolio, including consolidated joint ventures, as of June 30, 2013, during each of the next ten years and thereafter, assuming no exercise of renewal options:
| Lease Expiration Year |
Number of Leases Expiring |
Leased Square Feet (thousands) |
% of Leased Square Feet |
Annualized Rental Revenue (1) (thousands) |
% of Annualized Rental Revenue |
|||||||||||||||
| 2013 |
32 | 93 | 0.2 | % | $ | 1,731 | 0.3 | % | ||||||||||||
| 2014 |
69 | 289 | 0.7 | % | 5,286 | 0.9 | % | |||||||||||||
| 2015 |
89 | 446 | 1.0 | % | 7,089 | 1.2 | % | |||||||||||||
| 2016 |
125 | 1,164 | 2.7 | % | 15,795 | 2.8 | % | |||||||||||||
| 2017 |
141 | 1,013 | 2.3 | % | 14,541 | 2.6 | % | |||||||||||||
| 2018 |
156 | 2,115 | 4.8 | % | 27,919 | 4.9 | % | |||||||||||||
| 2019 |
97 | 2,255 | 5.2 | % | 27,347 | 4.8 | % | |||||||||||||
| 2020 |
57 | 1,169 | 2.7 | % | 14,694 | 2.6 | % | |||||||||||||
| 2021 |
85 | 2,919 | 6.7 | % | 36,030 | 6.3 | % | |||||||||||||
| 2022 |
72 | 2,737 | 6.3 | % | 23,094 | 4.1 | % | |||||||||||||
| Thereafter |
844 | 29,429 | 67.4 | % | 394,406 | 69.5 | % | |||||||||||||
|
|
|
|
|
|
|
|
|
|
|
|||||||||||
| Totals |
1,767 | 43,629 | 100.0 | % | $ | 567,932 | 100.0 | % | ||||||||||||
|
|
|
|
|
|
|
|
|
|
|
|||||||||||
| (1) | Represents the average annual base rental income over the respective lease terms, including adjustments for rent concessions or abatements, if any. |
24
Multi-Tenant Property Summary
The following table shows certain information regarding the Company’s multi-tenant property investments, including consolidated joint ventures, as of June 30, 2013:
| Property |
Location |
Type |
Rentable Square Feet (thousands) |
Occupancy | Purchase Price (thousands) |
Annualized Rental Revenue (1) (thousands) |
Major Tenants | |||||||||||||||
| Atascocita Commons |
Humble, TX | Power Center | 318 | 98.6 | % | $ | 56,500 | $ | 4,605 | Kohl’s, TJ Maxx, Ross, Palais Royal, Office Depot, Petco | ||||||||||||
| Bellview Plaza |
Pensacola, FL | Grocery | 84 | 100.0 | % | 8,200 | 833 | Publix, Planet Fitness | ||||||||||||||
| Big Lots & Tractor Supply |
Northport, AL | Anchored | 58 | 100.0 | % | 3,314 | 253 | Big Lots, Tractor Supply | ||||||||||||||
| Breakfast Pointe |
Panama Beach City, FL | Grocery | 96 | 98.9 | % | 16,000 | 1,341 | Publix, Office Depot | ||||||||||||||
| Camp Creek Marketplace |
East Point, GA | Power Center | 426 | 97.0 | % | 76,350 | 6,355 | BJ’s Wholesale Club, Marshall’s, Ross, TJ Maxx, Barnes & Noble, Staples, Petsmart, Old Navy | ||||||||||||||
| Century Town Center |
Vero Beach, FL | Power Center | 106 | 92.4 | % | 14,775 | 1,362 | Marshall’s | ||||||||||||||
| Cleveland Towne Center |
Cleveland, TN | Power Center | 154 | 92.8 | % | 17,650 | 1,732 | Ross, Bed Bath & Beyond, Michael’s, Electronic Express, Books-A-Million | ||||||||||||||
| Crossroads Marketplace |
Warner Robbins, GA | Anchored | 78 | 98.5 | % | 11,250 | 1,029 | Best Buy, Bed Bath & Beyond | ||||||||||||||
| CVS & Huntington Bank |
Northville, MI | Anchored | 16 | 100.0 | % | 3,797 | 292 | CVS | ||||||||||||||
| CVS & Noble Roman |
Mishawaka, IN | Anchored | 12 | 100.0 | % | 4,611 | 366 | CVS | ||||||||||||||
| CVS & Tres Amigos |
Ringgold, GA | Anchored | 15 | 100.0 | % | 3,990 | 323 | CVS | ||||||||||||||
| Del Monte Plaza |
Reno, NV | Grocery | 83 | 100.0 | % | 18,300 | 1,514 | Whole Foods, Sierra Trading Post | ||||||||||||||
| Denver West Plaza |
Lakewood, CO | Anchored | 71 | 91.5 | % | 14,000 | 1,215 | Best Buy, Office Depot | ||||||||||||||
| Dimond Crossing |
Anchorage, AK | Anchored | 85 | 100.0 | % | 14,376 | 1,348 | Petsmart, Bed Bath & Beyond | ||||||||||||||
| East Valley Center (2) |
Saginaw, MI | Power Center | 122 | 66.6 | % | 4,366 | 539 | Burlington Coat Factory | ||||||||||||||
| Eastland Center |
West Covina, CA | Power Center | 811 | 97.3 | % | 145,900 | 10,217 | Target, Wal-Mart, Burlington Coat Factory, Albertson’s, Dick’s Sporting Goods, Bed Bath & Beyond, Ashley Furniture, Marshall’s, Ross, CVS, Office Depot, DSW, Petsmart | ||||||||||||||
| Evans Exchange (2) |
Evans, GA | Power Center | 66 | 97.5 | % | 13,356 | 1,172 | Home Depot, Food Lion | ||||||||||||||
| Evans Exchange (2) |
Evans, GA | Power Center | 131 | 100.0 | % | 6,044 | 524 | Home Depot, Food Lion | ||||||||||||||
| Fairlane Green |
Allen Park, MI | Power Center | 273 | 98.3 | % | 47,000 | 4,769 | TJ Maxx, Bed Bath & Beyond, Barnes & Noble, Michael’s, Old Navy | ||||||||||||||
| Falcon Valley |
Lenexa, KS | Grocery | 77 | 100.0 | % | 12,500 | 1,016 | Price Chopper | ||||||||||||||
| Folsum Gateway II |
Folsum, CA | Power Center | 115 | 96.8 | % | 36,000 | 2,860 | Bed Bath & Beyond, Petsmart, DSW | ||||||||||||||
| Glynn Isles |
Brunswick, GA | Power Center | 192 | 94.7 | % | 38,000 | 2,801 | Dick’s Sporting Goods, Ross, Petsmart, Michael’s, Office Depot | ||||||||||||||
| Greenway Commons |
Houston, TX | Power Center | 253 | 97.4 | % | 68,250 | 4,596 | Costco, L.A. Fitness | ||||||||||||||
| Highlands Ranch |
Highland Ranch, CO | Anchored | 51 | 100.0 | % | 6,346 | 553 | Ross, Staples | ||||||||||||||
| Hillside Town Center |
Chicago, IL | Power Center | 167 | 92.0 | % | 26,945 | 2,463 | Ross, Home Goods, Michael’s, Staples | ||||||||||||||
| Hobby Lobby Center |
Greenville, SC | Anchored | 70 | 100.0 | % | 6,300 | 593 | Hobby Lobby | ||||||||||||||
| Indian Lakes Crossing |
Virginia Beach, VA | Grocery | 71 | 95.8 | % | 14,200 | 1,069 | Harris Teeter | ||||||||||||||
25
Multi-Tenant Property Summary – (Continued)
| Property |
Location |
Type |
Rentable Square Feet (thousands) |
Occupancy | Purchase Price (thousands) |
Annualized Rental Revenue (1) (thousands) |
Major Tenants | |||||||||||||||
| Kingman Gateway |
Kingman, AZ | Anchored | 49 | 100.0 | % | $ | 4,756 | $ | 433 | Ross, Petsmart | ||||||||||||
| Kingsbury Center |
Chicago, IL | Anchored | 54 | 100.0 | % | 26,400 | 1,632 | Buy Buy Baby, Petsmart | ||||||||||||||
| Kohl’s & Academy Sports |
Hixson, TN | Power Center | 131 | 100.0 | % | 10,769 | 896 | Kohl’s, Academy Sports | ||||||||||||||
| Kohl’s Plaza |
Napa, CA | Anchored | 76 | 97.2 | % | 19,825 | 1,695 | Kohl’s | ||||||||||||||
| Kyle Marketplace |
Kyle, TX | Grocery | 218 | 98.6 | % | 45,000 | 3,481 | HEB! Plus | ||||||||||||||
| Lakeshore Crossing |
Gainesville, GA | Power Center | 123 | 100.0 | % | 9,000 | 695 | Lowe’s | ||||||||||||||
| Midtowne Park |
Anderson, SC | Power Center | 167 | 100.0 | % | 25,600 | 1,940 | Kohl’s, Dick’s Sporting Goods, Staples | ||||||||||||||
| Mueller Regional Retail District |
Austin, TX | Power Center | 348 | 95.9 | % | 67,250 | 5,775 | Home Depot, Best Buy, Marshall’s, Chair King, Bed Bath & Beyond, Petsmart, Staples | ||||||||||||||
| Nature Coast Commons |
Spring Hill, FL | Power Center | 225 | 83.2 | % | 29,000 | 2,837 | Sports Authority, Best Buy, Ross, Office Depot, Petsmart | ||||||||||||||
| Northpoint Shopping Center |
Cape Coral, FL | Power Center | 113 | 70.3 | % | 10,000 | 1,040 | Bed Bath & Beyond, AC Moore, Petsmart | ||||||||||||||
| Oxford Exchange |
Oxford, AL | Power Center | 334 | 97.1 | % | 45,500 | 3,898 | Hobby Lobby, Dick’s Sporting Goods, Ross, TJ Maxx, Bed Bath & Beyond, Petsmart, Best Buy, Office Max | ||||||||||||||
| Petco & Portrait Innovations |
Lake Charles, LA | Anchored | 18 | 100.0 | % | 3,901 | 363 | Petco | ||||||||||||||
| Petsmart & Bevmo |
Redding, CA | Anchored | 45 | 100.0 | % | 5,788 | 530 | Petsmart, Bevmo | ||||||||||||||
| Petsmart & Hallmark |
Cincinnati, OH | Anchored | 34 | 100.0 | % | 5,042 | 426 | Petsmart | ||||||||||||||
| Petsmart & Travis Credit Union |
Mercad, CA | Anchored | 31 | 100.0 | % | 5,369 | 460 | Petsmart | ||||||||||||||
| Pick ‘N Save Center |
Wauwatosa, WI | Grocery | 70 | 98.4 | % | 16,191 | 1,330 | Pick N Save | ||||||||||||||
| Pinehurst Square |
Bismarck, ND | Anchored | 70 | 100.0 | % | 10,250 | 926 | Best Buy, Petsmart | ||||||||||||||
| Prairie Market |
Oswego, IL | Grocery | 113 | 95.6 | % | 25,100 | 2,448 | Aldi, Petsmart | ||||||||||||||
| Red Oak Village |
San Marcos, TX | Power Center | 177 | 98.2 | % | 22,500 | 1,974 | Ross, Best Buy, Marshall’s, Bed Bath & Beyond, Petsmart | ||||||||||||||
| Riverside Centre |
St. Augustine, FL | Anchored | 62 | 100.0 | % | 4,725 | 482 | Hobby Lobby | ||||||||||||||
| San Tan Marketplace |
Gilbert, AZ | Power Center | 284 | 98.3 | % | 54,780 | 4,284 | Jo-Ann’s Fabric, Big Lots, Bed Bath & Beyond, Marshall’s, DSW, Office Max, Downeast Home & Clothing, Old Navy | ||||||||||||||
| Santa Rosa Commons |
Pace, FL | Grocery | 140 | 100.0 | % | 25,450 | 2,024 | Publix, TJ Maxx, Petsmart | ||||||||||||||
| Shelby Corners |
Utica, MI | Anchored | 77 | 91.9 | % | 4,255 | 478 | Chrismas Tree Shops, Buy Buy Baby | ||||||||||||||
| Sherwood Retail Center |
Sherwood, AR | Power Center | 119 | 100.0 | % | 5,825 | 601 | Gander Mountain, Tractor Supply, Hobby Lobby | ||||||||||||||
| Shoppes at Port Arthur |
Port Arthur, TX | Power Center | 96 | 100.0 | % | 15,000 | 1,336 | Ross, Best Buy, Petco | ||||||||||||||
| Shoppes at Sherbrooke |
Lake Worth, FL | Anchored | 58 | 98.1 | % | 10,500 | 1,009 | L.A. Fitness | ||||||||||||||
| Shoppes at Sugarmill Woods |
Homosassa, FL | Grocery | 50 | 86.8 | % | 8,100 | 657 | Publix | ||||||||||||||
| Silverado Plaza |
Tucson, AZ | Grocery | 77 | 98.7 | % | 9,250 | 746 | Safeway | ||||||||||||||
| South Plains Crossing |
Lubbock, TX | Power Center | 146 | 98.3 | % | 16,350 | 1,502 | Hobby Lobby, Spec’s | ||||||||||||||
| Stearns Crossing |
Bartlett, IL | Grocery | 96 | 90.4 | % | 12,375 | 1,145 | Dominick’s | ||||||||||||||
26
Multi-Tenant Property Summary – (Continued)
| Property |
Location | Type | Rentable Square Feet (thousands) |
Occupancy | Purchase Price (thousands) |
Annualized Rental Revenue (1) (thousands) |
Major Tenants | |||||||||||||||
| Sunset Valley |
Sunset Valley, TX |
Power Center | 150 | 94.6 | % | $ | 35,500 | $ | 3,148 | Petsmart, Babies R Us, DSW | ||||||||||||
| Telegraph Plaza (2) |
Monroe, MI | Power Center | 73 | 80.0 | % | 7,040 | 720 | Kohl’s, TJ Maxx, Petsmart | ||||||||||||||
| Telegraph Plaza (2) |
Monroe, MI | Power Center | 69 | 100.0 | % | 5,860 | 501 | Kohl’s, TJ Maxx, Petsmart | ||||||||||||||
| The Crossing |
Killeen, TX | Anchored | 61 | 100.0 | % | 9,000 | 944 | Gold’s Gym, University of Phoenix | ||||||||||||||
| The Forum |
Fort Myers, FL | Power Center | 189 | 96.9 | % | 34,250 | 2,900 | Ross, Best Buy, Bed Bath & Beyond, Staples, Books-A- Million, Petco | ||||||||||||||
| The Plaza |
Queen Creek, AZ | Anchored | 70 | 93.4 | % | 13,250 | 1,344 | L.A. Fitness | ||||||||||||||
| Toys “R” Us Center |
Parma, OH | Anchored | 49 | 100.0 | % | 3,749 | 341 | Toys R Us | ||||||||||||||
| University Plaza |
Flagstaff, AZ | Grocery | 165 | 100.0 | % | 17,165 | 1,907 | Safeway, Ross, Bed Bath & Beyond, Petsmart | ||||||||||||||
| Valley Bend |
Huntsville, AL | Power Center | 416 | 100.0 | % | 72,530 | 5,861 | Hobby Lobby, Dick’s Sporting Goods, Ross, Marshall’s, Huntsville Hospital, Barnes & Noble, Bed Bath & Beyond, Petsmart | ||||||||||||||
| Volusia Square |
Daytona Beach, FL |
Power Center | 232 | 96.4 | % | 31,000 | 2,667 | Hobby Lobby, HH Gregg, TJ Maxx, Home Depot | ||||||||||||||
| Waterside Marketplace |
Chesterfield, MI | Power Center | 250 | 88.1 | % | 26,500 | 3,066 | Dick’s Sporting Goods, Best Buy, TJ Maxx, Bed Bath & Beyond, Old Navy | ||||||||||||||
| West Valley Center (2) |
Saginaw, MI | Power Center | 281 | 99.1 | % | 26,120 | 2,908 | Dick’s Sporting Goods, TJ Maxx, Petsmart, Barnes & Noble, Babies R Us | ||||||||||||||
| White Oak Village |
Richmond, VA | Power Center | 433 | 93.6 | % | 68,000 | 6,409 | J.C. Penney, Martin’s, K&G Fashion Superstore, Petsmart, Michael’s, Office Max | ||||||||||||||
| Whittwood Town Center |
Whittier, CA | Power Center | 785 | 98.9 | % | 83,500 | 6,068 | Target, J.C. Penney, Sears, Kohl’s, Von’s, Petsmart, 24 Hour Fitness, Cost Plus | ||||||||||||||
| Widewater Commons |
Uniontown, PA | Anchored | 48 | 96.6 | % | 6,600 | 626 | Petsmart | ||||||||||||||
| Winchester Station |
Winchester, VA | Power Center | 183 | 97.5 | % | 26,881 | 2,521 | HH Gregg, Ross, Bed Bath & Beyond, Michael’s, Old Navy | ||||||||||||||
|
|
|
|
|
|
|
|
|
|||||||||||||||
| Total |
11,056 | 96.3 | % | $ | 1,709,116 | $ | 144,714 | |||||||||||||||
|
|
|
|
|
|
|
|
|
|||||||||||||||
| (1) | Represents the average annual base rental income over the respective lease terms, including adjustments for rent concessions or abatements, if any. |
| (2) | The Company purchased multiple parcels at the same multi-tenant property in separate transactions. |
27
Unconsolidated Joint Venture Investment Summary
The following table shows certain information regarding the Company’s interests in unconsolidated joint ventures, as of June 30, 2013 (in thousands):
| Joint Venture |
Partner | Cole Ownership % |
Rentable Square Feet (1) |
Annualized Rental Revenue (1) (2) |
Gross Asset Book Value (1) |
Debt (1) (3) | Major Tenants | |||||||||||||||||
| Cole/CoTops Portfolio LLC |
Affiliate of Cofinance Group |
80 | % | 702 | $ | 5,935 | $ | 42,894 | $ | 24,639 | Tops Market, Dollar Tree, Gander Mountain, Big Lots, BJ’s Wholesale Club | |||||||||||||
| Cole/Mosaic JV South Elgin IL, LLC |
Affiliate of Mosaic Properties and Development, LLC |
50 | % | 232 | 2,916 | 30,081 | 20,400 | Home Depot, Best Buy | ||||||||||||||||
| Chandler Festival SPE, LLC |
Propstra Chandler Trust & RED Development, LLC |
45 | % | 359 | 4,706 | 40,083 | 25,894 | Nordstrom Rack, Buy Buy Baby, Ross, TJ Maxx | ||||||||||||||||
| Chandler Village Center, LLC (AZ) |
Propstra Chandler Trust & RED Development, LLC |
45 | % | 130 | 2,429 | 100,298 | 57,000 | Sports Authority, Bed Bath & Beyond | ||||||||||||||||
| Cole/LBA JV OF Pleasanton CA |
Affiliate of LBA Realty |
90 | % | 343 | 6,491 | 18,321 | 20,370 | Clorox Companies | ||||||||||||||||
| Chandler Gateway SPE, LLC |
Propstra Chandler Trust & RED Development, LLC |
45 | % | 260 | 1,680 | 35,062 | 29,128 | Hobby Lobby | ||||||||||||||||
| Cole/Faison JV Bethlehem GA, LLC |
Faison-Winder Investors, LLC |
90 | % | 280 | 3,151 | 16,386 | 18,536 | Publix, Belk | ||||||||||||||||
|
|
|
|
|
|
|
|
|
|||||||||||||||||
| Total Unconsolidated Joint Ventures |
2,306 | $ | 27,308 | $ | 283,125 | $ | 195,967 | |||||||||||||||||
|
|
|
|
|
|
|
|
|
|||||||||||||||||
| Cole Interest (4) |
1,575 | $ | 18,851 | $ | 159,541 | $ | 115,336 | |||||||||||||||||
| (1) | Amounts represent information for total unconsolidated joint venture. |
| (2) | Represents the average annual base rental income over the respective lease terms, including adjustments for rent concessions or abatements, if any. |
| (3) | Debt amounts represent secured fixed and variable rates ranging from 2.09% to 6.25% and maturities ranging from July 2015 to July 2021, with a weighted average interest rate of 4.04% as of June 30, 2013 and a weighted average years to maturity of 3.8 years as of June 30, 2013. |
| (4) | Amounts represent the Company’s interest in unconsolidated joint ventures as of June 30, 2013. |
28
Managed Programs
Offering Summary
The following table shows the Company’s Managed Programs offering summary, as of June 30, 2013:
| Program (1) |
Inception Date | Cole Ownership % (2) |
Offering Price/NAV (3) |
Current Annualized Distribution |
||||||||||||
| Open Programs: |
||||||||||||||||
| CCPT IV |
7/27/2010 | 0.03 | % | $ | 10.00 | 6.25 | % | |||||||||
| CCIT |
4/6/2010 | 0.03 | % | $ | 10.00 | 6.50 | % | |||||||||
| INAV |
7/27/2010 | 0.51 | % | $ | 16.56 | 5.35 | % (4) | |||||||||
| Closed Programs: |
||||||||||||||||
| CCPT II (5) |
9/29/2004 | 0.01 | % | $ | 9.45 | 6.61 | % (6) | |||||||||
| Other programs (7) |
Various | Various | (7) | Various | Various | (7) | ||||||||||
| (1) | The Company is currently in the registration process for Cole Office & Industrial REIT (CCIT II), Inc. and Cole Credit Property Trust V, Inc. |
| (2) | Calculated based on the outstanding shares owned at June 30, 2013. |
| (3) | The Company generally calculates the NAV for CCPT, CCPT II and INAV, relying in part on an estimate of the fair market value of each of the respective REITs’ real estate portfolio provided by a third party, adjusted to give effect to the estimated fair value of mortgages encumbering the respective REITs’ assets as well as other adjustments. The NAVs are based on a number of variables, including individual tenant credits, lease terms, lending credit spreads and tenant defaults, among others. |
| (4) | Calculated using a daily distribution of $0.002429042 per share and NAV of $16.56 per share. |
| (5) | Merger between CCPT II and Spirit was completed subsequent to June 30, 2013. |
| (6) | Calculated based on the current NAV of $9.45 per share. |
| (7) | Includes CCPT and 1031 Programs. The Company has a 0.01% interest in CCPT and no interest in the 1031 Programs. CCPT has a current annualized distribution rate of 6.45%, based on the current NAV of $7.75 per share. The 1031 Programs have a weighted average current annualized distribution rate of 6.32%. |
Fee Summary
The following table shows the Company’s Managed Programs fee summary information, as of June 30, 2013:
| Offering Fees | Transaction Fees | Management Fees | ||||||||||||||||||||||||||
| Program |
Selling Commissions (1) |
Dealer Manager Fees (2) |
Acquisition Transactional Fees (3) |
Financing Transactional Fees |
Property Management Fees (4) |
Asset Management / Advisory Fees |
Performance Fees |
|||||||||||||||||||||
| Open Programs: |
||||||||||||||||||||||||||||
| CCPT IV |
7 | % | 2 | % | 2 | % | — | % | — % | 0.65% - 0.75% (5) | 15%(6) | |||||||||||||||||
| CCIT |
7 | % | 2 | % | 2 | % | — | % | — % | 0.65% - 0.75% (5) | 15%(6) | |||||||||||||||||
| INAV |
— | % | 0.55 | % | — | % | — | % | — % | 0.90% (7) | 25%(8) | |||||||||||||||||
| Closed Programs: |
||||||||||||||||||||||||||||
| CCPT II (9) |
N/A | N/A | 2 | % | 1 | % | 2%,4%(10) | 0.25% | (9) | |||||||||||||||||||
| Other programs (11) |
N/A | N/A | Various | Various | Various | Various | Various | |||||||||||||||||||||
| (1) | The Company reallows 100% of selling commissions earned to participating broker-dealers. |
| (2) | The Company may reallow all or a portion of its dealer manager fee to participating broker-dealers as a marketing and due diligence expense reimbursement. |
| (3) | Percent taken on gross purchase price. |
| (4) | Percent taken on gross revenues (leasing fees based on prevailing market rates with restrictions). |
| (5) | Annualized fee based on the average monthly invested assets. |
| (6) | Performance Fee paid only under the following events (i) if shares are listed on a national securities exchange; (ii) if the company is sold or the assets are liquidated; or (iii) termination of the advisory agreement. |
| (7) | The Company has waived this fee. |
| (8) | Performance Fee paid for any year in which the total return on stockholders’ capital exceeds 6% per annum on a calendar year basis. |
| (9) | Merger between CCPT II and Spirit was completed subsequent to June 30, 2013. No performance fees were recorded with respect to the merger. |
| (10) | Annualized fee for single-tenant and multi-tenant properties, respectively. |
| (11) | Includes CCPT and 1031 Programs. |
29
Managed Programs (Continued)
Program Summary
The following table shows the Company’s Managed Programs cumulative activity summary information, as of June 30, 2013:
| Program |
Capital Raised
(1) (thousands) |
Number of Properties |
Assets
Under Management (2) (thousands) |
Total Debt Outstanding (thousands) |
||||||||||||
| Open Programs: |
||||||||||||||||
| CCPT IV |
$ | 666,298 | 178 | $ | 1,232,983 | $ | 677,418 | |||||||||
| CCIT |
598,879 | 35 | 916,491 | 431,410 | ||||||||||||
| INAV |
42,148 | 20 | 54,103 | 16,775 | ||||||||||||
|
|
|
|
|
|
|
|
|
|||||||||
| Total Open Programs |
1,307,325 | 233 | 2,203,577 | 1,125,603 | ||||||||||||
|
|
|
|
|
|
|
|
|
|||||||||
| Closed Programs: |
||||||||||||||||
| CCPT II (3) |
2,280,595 | 747 | 3,413,197 | 1,763,300 | ||||||||||||
| Other programs (4) |
449,324 | 116 | 881,934 | 456,447 | ||||||||||||
|
|
|
|
|
|
|
|
|
|||||||||
| Total Closed Programs |
2,729,919 | 863 | 4,295,131 | 2,219,747 | ||||||||||||
|
|
|
|
|
|
|
|
|
|||||||||
| Total |
$ | 4,037,244 | 1,096 | $ | 6,498,708 | $ | 3,345,350 | |||||||||
|
|
|
|
|
|
|
|
|
|||||||||
| (1) | Includes DRIP issued, excludes redemptions and discounts. |
| (2) | Represents total gross real estate and related assets net of gross intangible lease liabilities. |
| (3) | Merger between CCPT II and Spirit was completed subsequent to June 30, 2013. |
| (4) | Includes CCPT and 1031 Programs. |
Program Activity Summary
The following table shows the Company’s Managed Programs activity summary information, for the period beginning on April 6, 2013 (the day after the merger with Cole Holdings) through June 30, 2013:
| Program |
Capital Raised
(1) (thousands) |
Number of Properties Acquired |
Purchase Price (thousands) |
New Debt (thousands) |
||||||||||||
| Open Programs: |
||||||||||||||||
| CCPT IV |
$ | 212,263 | 56 | $ | 529,803 | $ | 300,596 | (2) | ||||||||
| CCIT |
282,785 | 13 | 538,207 | 121,000 | ||||||||||||
| INAV |
13,404 | 6 | 15,757 | — | ||||||||||||
|
|
|
|
|
|
|
|
|
|||||||||
| Total Open Programs |
508,452 | 75 | 1,083,767 | 421,596 | ||||||||||||
|
|
|
|
|
|
|
|
|
|||||||||
| Closed Programs: |
||||||||||||||||
| CCPT II (3) |
— | — | — | — | ||||||||||||
| Other programs (4) |
— | 2 | 4,959 | — | ||||||||||||
|
|
|
|
|
|
|
|
|
|||||||||
| Total Closed Programs |
— | 2 | 4,959 | — | ||||||||||||
|
|
|
|
|
|
|
|
|
|||||||||
| Total |
$ | 508,452 | 77 | $ | 1,088,726 | $ | 421,596 | |||||||||
|
|
|
|
|
|
|
|
|
|||||||||
| (1) | Includes DRIP issued, excludes redemptions and discounts. |
| (2) | Includes $100.0 million increase in allowable borrowings pursuant to an amendment to the CCPT IV credit facility. |
| (3) | Merger between CCPT II and Spirit was completed subsequent to June 30, 2013. |
| (4) | Includes CCPT and 1031 Programs. |
30
Managed Programs (Continued)
Revenue Summary
The following table shows the Company’s Managed Programs revenue information, for the period beginning on April 6, 2013 (the day after the merger with Cole Holdings) through June 30, 2013 (in thousands):
| Program |
Offering Related Revenue and Reimbursements |
Transaction Service Revenue |
Management Service Revenue and Reimbursements |
Total Private Capital Management Revenue and Reimbursements |
||||||||||||
| Open Programs: |
||||||||||||||||
| CCPT IV |
$ | 22,800 | $ | 10,596 | $ | 2,670 | $ | 36,066 | ||||||||
| CCIT |
28,871 | 10,764 | 1,706 | 41,341 | ||||||||||||
| INAV |
147 | — | 75 | 222 | ||||||||||||
|
|
|
|
|
|
|
|
|
|||||||||
| Gross revenue - Open Programs |
51,818 | 21,360 | 4,451 | 77,629 | ||||||||||||
| Less: |
||||||||||||||||
| Reallowed revenue |
38,962 | — | — | 38,962 | ||||||||||||
| Reimbursements |
8,588 | — | 1,395 | 9,983 | ||||||||||||
|
|
|
|
|
|
|
|
|
|||||||||
| Adjusted revenue - Open Programs (1) |
4,268 | 21,360 | 3,056 | 28,684 | ||||||||||||
|
|
|
|
|
|
|
|
|
|||||||||
| Closed Programs: |
||||||||||||||||
| CCPT II (2) |
— | — | 4,451 | 4,451 | ||||||||||||
| Other programs (3) |
— | 149 | 414 | 563 | ||||||||||||
|
|
|
|
|
|
|
|
|
|||||||||
| Gross revenue - Closed Programs |
— | 149 | 4,865 | 5,014 | ||||||||||||
| Less: |
||||||||||||||||
| Reimbursements |
— | — | 853 | 853 | ||||||||||||
|
|
|
|
|
|
|
|
|
|||||||||
| Adjusted revenue - Closed Programs (1) |
— | 149 | 4,012 | 4,161 | ||||||||||||
|
|
|
|
|
|
|
|
|
|||||||||
| Total adjusted revenue (1) |
$ | 4,268 | $ | 21,509 | $ | 7,068 | $ | 32,845 | ||||||||
|
|
|
|
|
|
|
|
|
|||||||||
| (1) | Adjusted revenue is a non-GAAP measure. See the Terms and Definitions Section that begins on page 32 for a description of our non-GAAP measures. |
| (2) | Merger between CCPT II and Spirit was completed subsequent to June 30, 2013. |
| (3) | Includes CCPT and 1031 Programs. |
31
Terms and Definitions
Non-GAAP Financial Disclosures
FFO and AFFO
Funds From Operations (“FFO”) is a non-GAAP financial performance measure defined by the National Association of Real Estate Investment Trusts (“NAREIT”) and widely recognized by investors and analysts as one measure of operating performance of a real estate company. The FFO calculation excludes items such as real estate depreciation and amortization, gains and losses on the sale of depreciable real estate and impairments of depreciable real estate. Depreciation and amortization as applied in accordance with GAAP implicitly assumes that the value of real estate assets diminishes predictably over time. Since real estate values have historically risen or fallen with market conditions, it is management’s view, and we believe the view of many industry investors and analysts, that the presentation of operating results for real estate companies by using the historical cost accounting method alone is insufficient. In addition, FFO excludes gains and losses from the sale of depreciable real estate and impairment charges on depreciable real estate, which we believe provides management and investors with a helpful additional measure of the performance of our real estate portfolio, as it allows for comparisons, year to year, that reflect the impact on operations from trends in items such as occupancy rates, rental rates, operating costs, general and administrative expenses, and interest costs. We compute FFO in accordance with NAREIT’s definition.
In addition to FFO, we use Adjusted Funds From Operations (“AFFO”) as a non-GAAP supplemental financial performance measure to evaluate the operating performance of our real estate portfolio. AFFO, as defined by our company, excludes from FFO merger and acquisition related costs, amortization and write off of deferred financing costs, straight-line rent adjustments, above and below market lease intangibles amortization, realized loss on derivatives and debt prepayment fees, gain on sale of marketable securities, other amortization or accretion, other gains, adjustments for discontinued operations and our proportionate share of adjustments for unconsolidated joint ventures, all of which are required to be expensed or recorded as additions to revenue or other income in accordance with GAAP. In evaluating the performance of our portfolio over time, management employs business models and analyses that differentiate the costs to acquire investments from the investments’ revenues and expenses. Management believes that excluding the items noted above from AFFO provides investors with supplemental performance information that is consistent with the performance models and analysis used by management, and provides investors a view of the performance of our portfolio over time, including after the Company ceases to acquire properties on a frequent and regular basis. AFFO also allows for a comparison of the performance of our portfolio with other REITs that are not currently engaging in acquisitions and mergers, as well as a comparison of our performance with that of other REITs, as AFFO, or an equivalent measure, is routinely reported by other REITs, and we believe often used by analysts and investors for comparison purposes.
For all of these reasons, we believe FFO and AFFO, in addition to net income and cash flows from operating activities, as defined by GAAP, are helpful supplemental performance measures and useful in understanding the various ways in which our management evaluates the performance of our real estate portfolio over time. However, not all REITs calculate FFO and AFFO the same way, so comparisons with other REITs may not be meaningful. FFO and AFFO should not be considered as alternatives to net income or to cash flows from operating activities, and are not intended to be used as a liquidity measure indicative of cash flow available to fund our cash needs.
EBITDA and Normalized EBITDA
Normalized EBITDA as disclosed represents EBITDA, or earnings before interest, taxes, depreciation and amortization, modified to include other adjustments to GAAP net income for merger expenses which are considered non-recurring and gain/losses in real estate, foreign exchange and derivatives which are not considered fundamental attributes of our business plans and do not affect our overall long-term operating performance. We exclude these items from Normalized EBITDA as they are not the primary drivers in our decision making process. Our assessment of our operations is focused on long-term sustainability and not on such non-cash items, which may cause short term fluctuations in net income but have no impact on cash flows. We believe that Normalized EBITDA is a useful supplemental measure to investors and analysts for assessing the performance of our business segments, although it does not represent net income that is computed in accordance with GAAP. Therefore, Normalized EBITDA should not be considered as an alternative to net income or as an indicator of our financial performance. We use Normalized EBITDA as one measure of our operating performance when we formulate corporate goals and evaluate the effectiveness of our strategies. Normalized EBITDA may not be comparable to similarly titled measures of other companies.
32
Terms and Definitions (Continued)
Adjusted G&A
Adjusted G&A is a non-GAAP financial measure that represents general and administrative expense on a GAAP basis adjusted for both non-recurring items, including listing and tender offer expenses, and recurring items, including management service fee-related expenses. We believe that Adjusted G&A is useful to investors and analysts as a supplemental measure of expenses, and we use it to evaluate the profitability of our overall operations. Adjusted G&A should not be considered as an alternative to general and administrative expense computed on a GAAP basis as a measure of our profitability. Adjusted G&A may not be comparable to similarly titled measures of other companies.
Adjusted Revenues
Adjusted Revenues is a non-GAAP financial measure that represents revenue on a GAAP basis adjusted to eliminate revenue recorded as reimbursement revenue in accordance with GAAP, of certain expenses, which are included in reallowed fees and commissions and general and administrative expenses. We believe that excluding the items noted above from revenue provides investors with supplemental performance information that is consistent with the performance models and analysis used by management. Adjusted Revenues should not be considered as an alternative to revenue or cash flows from operating activities computed on a GAAP basis as a measure of our profitability. Adjusted Revenues may not be comparable to similarly titled measures of other companies.
Lease Yield
Lease yield is calculated as the average annual rental income, adjusted for any rent concessions or abatements, for the in-place leases over the non-cancellable lease term at the respective property divided by the property purchase price, exclusive of acquisition costs. In general, our properties are subject to long-term triple net or double net leases, and the future costs associated with the double net leases are unpredictable and may reduce the yield.
33