Attached files
| file | filename |
|---|---|
| 8-K - FORM 8-K - Cole Real Estate Investments, Inc. | d580530d8k.htm |
| EX-99.3 - EX-99.3 - Cole Real Estate Investments, Inc. | d580530dex993.htm |
| EX-99.1 - EX-99.1 - Cole Real Estate Investments, Inc. | d580530dex991.htm |
 2013 Second Quarter
Earnings Presentation www.ColeREIT.com
August 5, 2013
Exhibit 99.2 |
 2
©
2013 Cole Real Estate Investments, Inc. All Rights Reserved.
This presentation is for informational purposes only and is not an offer to buy or the
solicitation of an offer to sell any securities of Cole Real Estate Investments, Inc.
(“Cole”). The tender offer will be made only pursuant to an offer to purchase, letter of
transmittal and related materials that Cole distributed to its stockholders and filed with the
U.S. Securities and Exchange Commission
(“SEC”),
as
they
may
be
amended
from
time
to
time.
The
full
details
of
the
tender
offer,
including
complete
instructions on how to tender stock, are included in such materials. Stockholders are urged to
carefully read the offer to purchase, the letter of transmittal and other related
materials, as they may be amended from time to time, because they contain
important information, including the terms and conditions of the
tender offer. Stockholders may obtain free copies of the offer to
purchase, the letter of transmittal and other related materials that Cole files with the SEC
at the SEC’s website at: http://www.sec.gov
or by calling the information agent for the contemplated tender
offer, who will be identified in the materials
filed with the SEC at the commencement of the tender offer. In addition, copies of the
documents filed by Cole with the SEC will be available free of charge by directing a
written request to Cole Real Estate Investments, 2325 East Camelback Road, Suite 1100,
Phoenix, Arizona 85016, Attention: Investor Relations.
Disclosures
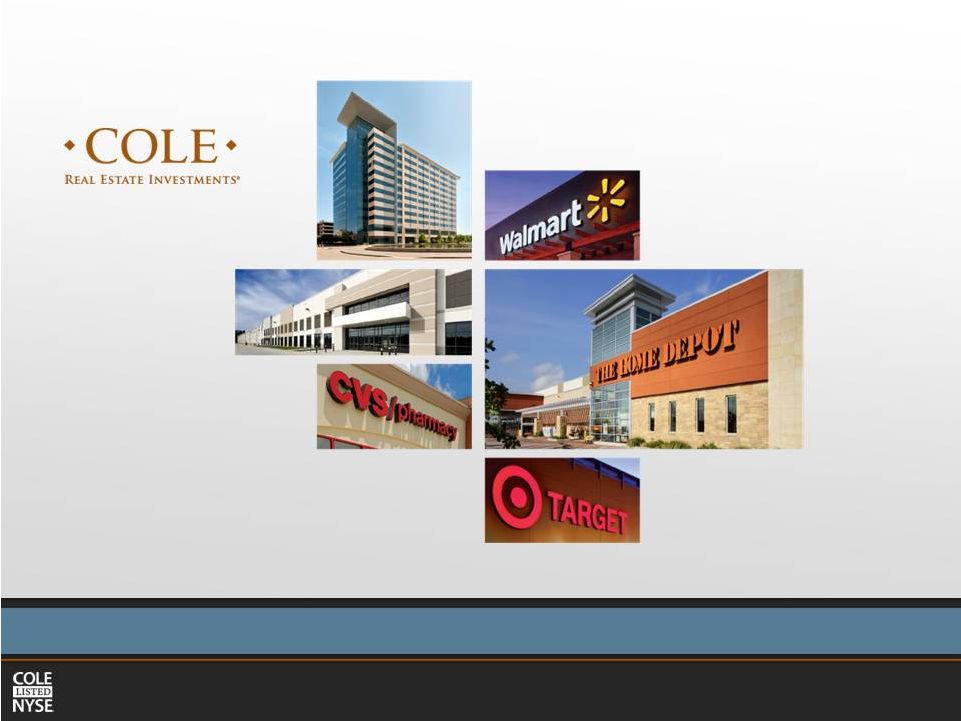
The properties pictured have been acquired by Cole. Corporate tenants may also occupy numerous
properties that are not owned by Cole or Cole-sponsored programs. Cole is not
affiliated or associated with, is not endorsed by, does not endorse, and is not
sponsored by or a sponsor of the tenants or the joint venture partners shown, or of their products or services pictured or
mentioned. The names, logos and all related product and service names, design marks and
slogans are the trademarks or service marks of their respective companies.
Tenants, Trademarks and Logos
Tender Offer |
 3
©
2013 Cole Real Estate Investments, Inc. All Rights Reserved.
In addition to historical information, this presentation contains forward-looking
statements within the meaning of Section 27A of the Securities Act of 1933, as amended,
and Section 21E of the Securities Exchange Act of 1934, as amended. These forward-
looking statements, which are based on current expectations, estimates and projections about
the industry and markets in which Cole operates, include beliefs of and assumptions
made by Cole’s management, and involve risks and uncertainties that could
significantly
affect
the
financial
results
of
Cole.
Words
such
as
“may,”
“expects,”
“anticipates,”
“intends,”
“plans,”
“believes,”
“projects,”
“seeks,”
“estimates,”
“would,”
“could”
and “should”
and variations of such words and similar expressions are
intended to identify such forward-looking statements, which generally are not historical
in nature. Such forward-looking statements
include,
but
are
not
limited
to,
statements
about
the
benefits
of
the
business
combination
transaction
with
Cole
Holdings Corporation, future financial and operating results, and the company’s plans,
objectives, expectations and intentions. All statements that address operating
performance, events or developments that we expect or anticipate will occur in the future are
forward-looking statements. These statements are not guarantees of future performance and
involve certain risks, uncertainties and assumptions that are difficult to predict.
Although we believe the expectations reflected in any forward-looking statements
are based on reasonable assumptions, we can give no assurance that our expectations will be
attained and therefore, actual outcomes and results may differ materially from what is
expressed or forecasted in such forward-looking statements. Some of the
factors
that
could
cause
actual
results
to
differ
materially
from
any
forward-looking
statements
include,
among
others,
(i)
changes in national, international, regional and local economic conditions, (ii) changes in
financial markets, interest rates, credit spreads, and foreign currency exchange rates,
(iii) changes in real estate conditions, (iv) continued ability to source new
investments, (v) risks associated with acquisitions, (vi) construction costs that may exceed
estimates, and construction delays, (vii) lease-up risks, rent relief, and inability
to obtain new tenants upon the expiration or termination of existing leases, (viii)
maintenance of real estate investment trust status, (ix) legal matters, (x) availability of
financing and capital generally, (xi) inability
to
obtain
financing
or
refinance
existing
debt
and
the
potential
need
to
fund
tenant
improvements
or
other
capital
expenditures out of operating cash flows, (xii) changes in demand for properties, and (xiii)
additional risks and factors discussed in reports filed by the Company with the SEC
from time to time. Cole does not make any undertaking with respect to updating any
forward looking statements appearing in this presentation. Forward-Looking Statements
|
 4
©
2013 Cole Real Estate Investments, Inc. All Rights Reserved.
Information Overview
2013 Second Quarter Highlights
Page 5
Real Estate Investments
Page 6 -
7
Private Capital Management
Page 8 -
9
Financials
Page 10 –
11
Corporate Strategy
Page 12 -
13 |
 5
©
2013 Cole Real Estate Investments, Inc. All Rights Reserved.
2013 Second Quarter Highlights
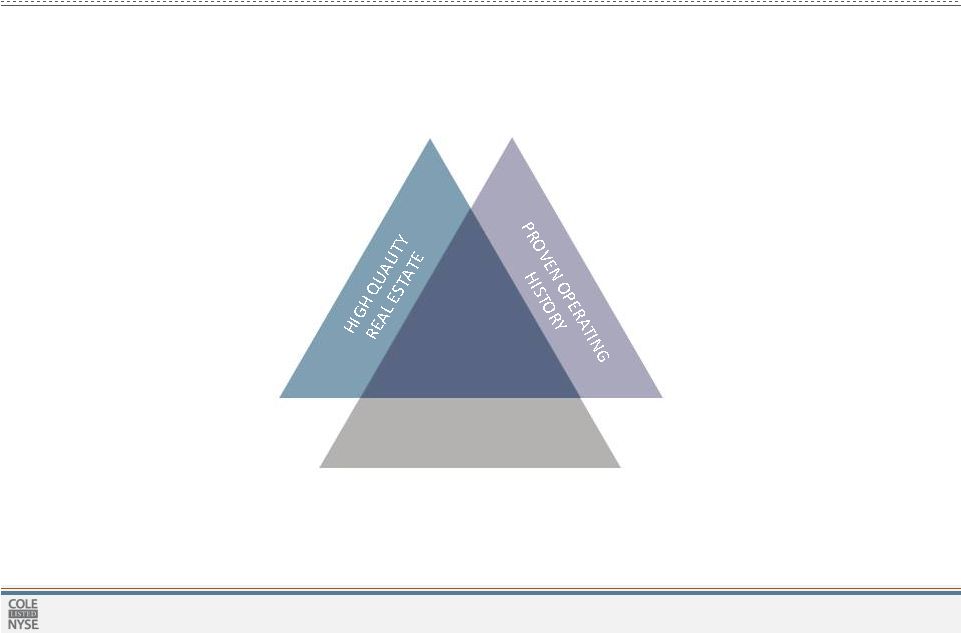
A Premier Net Lease Company
–
Highly ranked among net lease peers
–
Best-in-class management platform with capabilities across all aspects of property investment
and management
–
Disciplined
investment
philosophy
and
process
proven
over
market
cycles
–
Market-leading lease duration and substantial investment grade tenancy
–
Well diversified by tenancy, credit quality, property type and geography
Record Operating Results
»
Reported consolidated revenue of $250.3 million and net income of $29.1 million, a 91% and 26%
year-over-year increase from the second quarter of 2012, respectively
»
Reported consolidated AFFO of $0.23 per diluted share, a 44% year-over-year increase from the
second quarter of 2012 »
$266 million of real estate was acquired in the second quarter 2013 with a weighted average annual
lease yield of 7.7% and $1.3 billion of real estate was acquired over the past four quarters
with a weighted average annual lease yield of 7.8% »
$508 million of capital was raised on behalf of our managed REITs in the second quarter 2013 and a
record-breaking month of $509 million of capital raised during July was also achieved
Increased Guidance
»
10% increase in second half AFFO guidance to the new range of $0.42 to $0.47 per diluted share
Increased Dividend
»
Increased the annual distribution rate to $0.72 from $0.70 per share effective with the August
dividend, payable September 3, 2013
»
Represents an 11% increase over the past two quarters
Tender Offer
»
The
modified
“Dutch
auction”
tender
offer
to
purchase
up
to
$250
million
of
shares
will
expire
on
August
8,
2013
Share Repurchase Program
»
Authorized
to
repurchase
up
to
$250
million
of
shares
in
the
open
market
starting
on
the
11
th
business
day
following
completion of the tender offer |
 6
©
2013 Cole Real Estate Investments, Inc. All Rights Reserved.
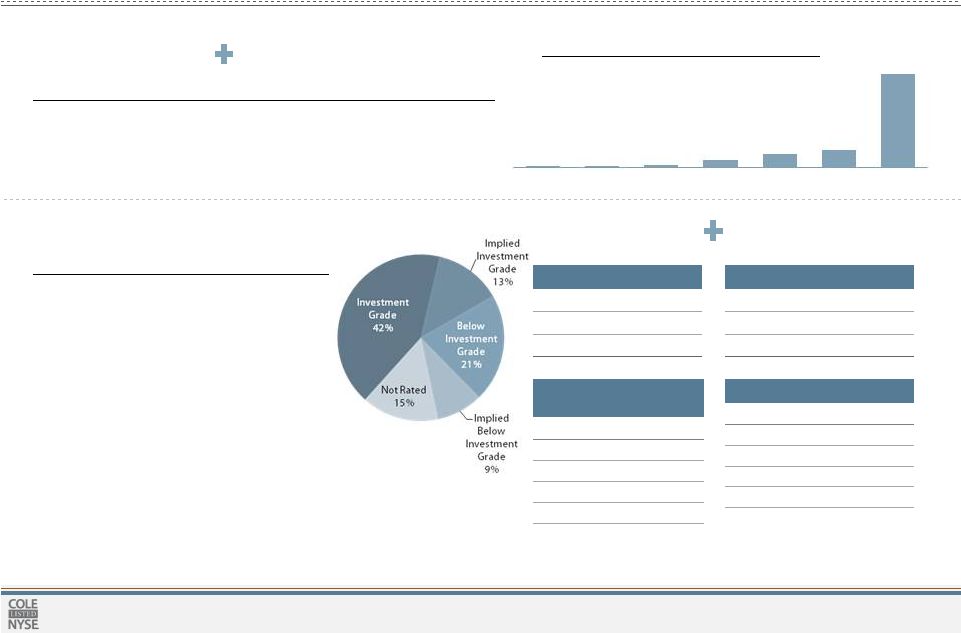
»
42% of Cole's annual rent is derived from
tenants rated investment grade and another
13% from tenants with an implied rating of
investment grade
»
Cole performs extensive upfront credit
analysis and ongoing credit monitoring for all
tenants
»
Implied investment grade ratings are based
on Moody’s Credit Edge or Moody’s KMV in
conjunction with current financial statements
Cole’s business has maintained high portfolio occupancy and one of the
longest weighted average remaining lease terms of all net lease peers,
providing highly visible, predictable cash flows
Real Estate Investments
Market-Leading Lease Duration and Substantial Investment Grade Tenancy
12.2 Years
Weighted
Average
Lease
Term
(1)
Lease Expiration Profile
(1)
55%
Investment
Grade
Tenants
(2)
Example Tenant
Implied Rating
Publix
AA
Cracker Barrel
AA-
Tractor Supply
AA-
Aaron’s Rents
A
Ulta
A+
Rating
% of Total
AAA to AA-
8.2%
A+ to A-
12.6%
BBB+ to BBB-
21.6%
42.4%
Implied Rating
% of Total
AAA to AA-
3.8%
A+ to A-
2.3%
BBB+ to BBB-
7.1%
13.2%
Example
Tenant
Rating
Wells Fargo
AA-
Amazon
AA-
Wal-Mart
AA
Target
A+
Home Depot
A-
42%
Investment Grade
13%
Implied Investment Grade
99.1%
Portfolio Occupancy
0.3%
0.9%
1.2%
5.4%
9.7%
13.0%
69.5%
2013
2014
2015
3-5 Years
5-7 Years
7-10 Years
10+ Years
1. Lease Expiration shows certain information regarding
the lease expirations of Cole’s real estate portfolio, including consolidated joint ventures, as of June 30, 2013, based on annualized rental revenue, during
each of the next ten years and thereafter, excluding unconsolidated JVs and CMBS/Secured
notes receivable.
2. Credit ratings based on annualized rental revenue from
tenants with credit ratings of BBB- or higher. Tenant credit rating may reflect the credit rating of the parent company or a guarantor. Credit ratings
exclude unconsolidated JVs and CMBS/Secured notes receivable. Moody’s Credit Edge
was used to determine implied credit rating for public non-rated tenants. Moody’s KMV was used to determine implied credit
rating for private non-rated tenants. Data for implied ratings as of July 29,
2013. Example tenants are from the Cole portfolio.
|
 7
©
2013 Cole Real Estate Investments, Inc. All Rights Reserved.
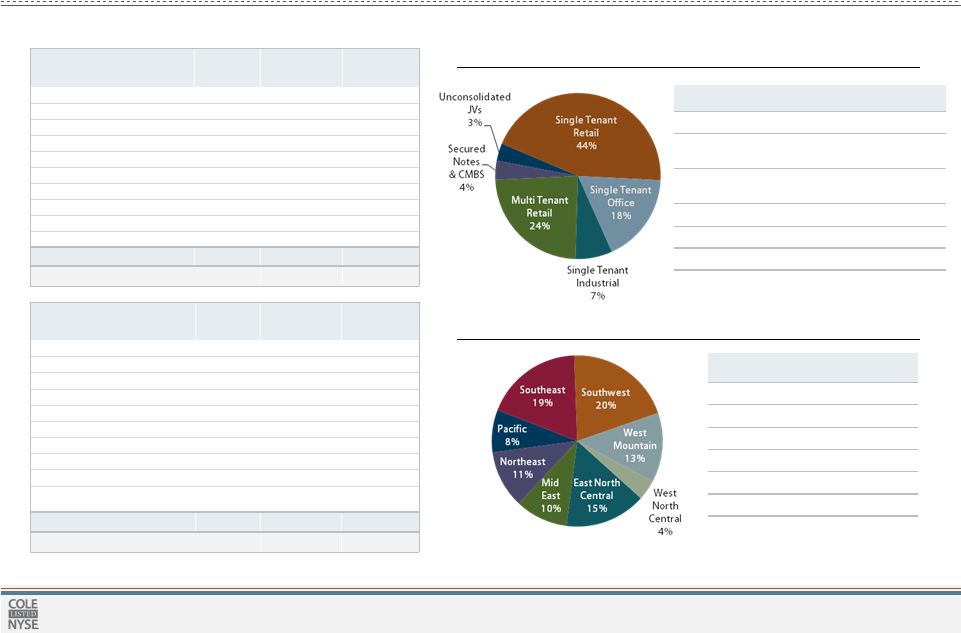
PROPERTY TYPE
PROPERTIES
SQUARE
FEET
ST Retail
886
17.7mm
ST Office and
Industrial
55
15.2mm
MT
Retail
–
Power
Center
36
8.5mm
MT
Retail
–
Grocery
13
1.3mm
MT Retail –
Anchored
24
1.3mm
Total
1,014
44.0mm
Geographic Diversity
TOP 10 STATES BY % OF ANNUALIZED
RENTAL REVENUE
TX
16.9%
GA
5.1%
AZ
8.6%
MI
3.8%
CA
7.1%
NJ
3.6%
FL
7.0%
OH
3.2%
IL
5.4%
VA
3.2%
Total
63.9%
Real Estate Investments
Well Diversified by Tenancy, Investment Type and Geography
Investment Type Diversity
TOP 10 TENANTS
NUMBER OF
LEASES
% OF
ANNUAL RENT
WTD. AVG.
REMAINING
LEASE TERM
WALGREENS
73
4.8%
17.9 YRS
ALBERTSON'S
34
4.2%
16.8 YRS
PETSMART
42
4.2%
8.3 YRS
CVS
54
3.6%
18.1 YRS
BJ'S WHOLESALE CLUB
3
3.4%
17.7 YRS
WAL-MART
9
2.7%
11.0 YRS
APOLLO GROUP
1
2.6%
17.8 YRS
L.A. FITNESS
17
2.5%
11.0 YRS
AMAZON
3
2.5%
13.3 YRS
HOME DEPOT
12
2.3%
14.9 YRS
TOP 10 TOTAL
248
32.8%
TOTAL NUMBER OF TENANTS
567
TOP 10 INDUSTRIES
NUMBER OF
LEASES
% OF
ANNUAL RENT
WTD. AVG.
REMAINING
LEASE TERM
GROCERY
75
9.1%
15.3 YRS
DRUGSTORE
127
8.4%
18.0 YRS
DISCOUNT STORE
228
7.8%
10.1 YRS
FULL SERVICE RESTAURANT
189
6.8%
14.6 YRS
HOME AND GARDEN
69
5.5%
13.4 YRS
PET SUPPLIES
49
4.5%
8.2 YRS
WAREHOUSE CLUB
7
4.3%
16.2 YRS
HEALTHCARE
58
4.0%
11.2 YRS
FINANCIAL SERVICES
61
3.5%
12.0 YRS
LIMITED SERVICE
RESTAURANT
133
3.3%
11.3 YRS
TOP 10 TOTAL
996
57.2%
TOTAL NUMBER OF INDUSTRIES
36
Tables and charts show certain information regarding the tenant and industry
diversification of Cole’s real estate portfolio, including consolidated joint ventures, as of June 30, 2013, based on
annualized rental revenue. |
 8
©
2013 Cole Real Estate Investments, Inc. All Rights Reserved.
Private Capital Management
Understanding the Fee Based Business Model
•
Selling commissions are passed through (reallowed) to the selling
firms and financial advisors who have sold shares in the offering. Our
current
traditional
programs
in
offering
pay
a
7%
commission.
(4)
•
A portion of the dealer-manager fees are paid to the participating
broker-dealer (of the financial advisors) and the remainder is retained
by Cole. Our current traditional programs in offering have a 2%
dealer-manager fee.
•
Transaction fees are paid on total purchase price of REIT assets
acquired. Our current traditional programs in offering charge a 2%
acquisition fee.
•
Management fees include recurring asset management advisory fees
as well as performance fees. Our current traditional programs in
offering charge an average annual advisory fee of 0.75% on invested
assets
and
a
performance
fee
of
15%.
(5)
•
Expense reimbursement revenue is offset by allowable organizational
and offering expenses associated with raising capital in a program
offering as well as management expense reimbursement for salaries
as well as certain general and administrative costs.
Premier Platform
»
Cole’s private capital business, Cole Capital™, is a premier alternatives broker-dealer
with fully integrated teams across external and internal sales, marketing, sales analytics,
events, national accounts, due diligence, compliance and shareholder services. Successful
»
Per
Robert
Stanger
&
Co.
industry
reports,
Cole
Capital™
is
the
only
non-traded
REIT
sponsor
to
rank
in
the
top
3
for
the
past
five
years
and
has
raised
over
$8.1
billion
since
2007
(1)
1.
Capital Raise data as of July 31, 2013.
2.
All dollars in thousands and US GAAP. Investors should review the Supplemental Financial Information
for the second quarter of 2013 furnished on Form 8-K on 8/5/2013 for additional information.
Revenue, for the period beginning on the merger date of 4/6/13 through 6/30/13, derived from both Open
and Closed Programs, including CCPT II whose merger with Spirit was completed subsequent to
June 30, 2013. 3.
See “About the Data” for a description of Adjusted Revenue and Normalized EBITDA which are
non-GAAP financial measures. 4.
The Company reallows 100% of selling commissions earned and may reallow all or a portion of its dealer
manager fee to participating broker-dealers as a marketing and due diligence expense
reimbursement.
5.
Advisory fees for current traditional programs in offering are an annualized fee based on the average
monthly invested assets beginning at 0.75% for the first $2 billion, 0.70% over $2 billion up to
$4 billion, and 0.65% over $4 billion. Upon a liquidity event and after investors have received an 8%
cumulative total return, Cole is entitled to receive 15% of the remaining net proceeds. Refer to
each program’s respective prospectus for specific details. |
 9
©
2013 Cole Real Estate Investments, Inc. All Rights Reserved.
Private Capital Management
Disciplined
»
Our disciplined investment strategy and proven ability to acquire accretive assets provides an
opportunity to attract a long- term investor base that values year-in, year-out
execution Recurring
»
Our
past
results
demonstrate
the
recurring,
repeatable
nature
of
our
revenue
Consistent
»
The sequencing of each new offering provides consistency across the three fee categories
Understanding Revenue Composition
1.
Illustrative annual revenue reflects typical revenue profile associated with standard product
fees and an average capital raise of $100 million per month ending in month 24 with all acquisitions
completed by month 36. Management Fees does not take into account any performance-related
fees, and revenue composition in Year 4 and beyond assumes 100% Management Fees. Offering
Fees (net) is gross offering fees net of all reallowed selling commissions and
dealer-manager fees as well as all expense reimbursements.
2.
Historical annual revenue includes results from current and prior managed REITs. Excludes
revenue associated with 1031 programs. Management Fees excludes performance related fees. Offering
Fees (net) is gross offering fees net of all reallowed selling commissions and
dealer-manager fees as well as all expense reimbursements.
0%
20%
40%
60%
80%
100%
Year 1
Year 2
Year 3
Average
Offering Fees (net)
Transaction Fees
Management Fees
ILLUSTRATIVE
ANNUAL
REVENUE
PROFILE
PER
EACH
NEW
FUND
OFFERING
(1)
0%
20%
40%
60%
80%
100%
Offering Fees (net)
Transaction Fees
Management Fees
HISTORICAL
ANNUAL
REVENUE
PROFILE
FROM
ACTUAL
OFFERINGS
(2)
2007
2008
2009
2010
2011
2012
Average |
 10
©
2013 Cole Real Estate Investments, Inc. All Rights Reserved.
Financials
Record Operating Results
Summary Financial Results
($ in thousands, except per share data)
Three Months Ended June 30, 2013
Three Months Ended June 30, 2012
Total
Real Estate
Investment
Private
Capital
Management
Year-Over-Year
% Change
Total
Real Estate
Investment
Net Income
$ 19,948
$ 9,186
26%
$ 23,090
$ 23,090
EBITDA
(1)
$119,291
$ 15,009
44%
$ 93,230
$ 93,230
Normalized EBITDA
(1)
$139,302
$ 15,009
40%
$ 110,004
$ 110,004
Annualized Normalized EBITDA
$ 440,016
Funds From Operations (FFO)
(1)
$ 67,044
9,186
17%
$ 64,991
$ 64,991
FFO per common share, diluted
$ 0.14
$ 0.02
14%
$ 0.14
$ 0.14
Adjusted Funds From Operations (AFFO)
(1)
(2)
$ 95,663
15,098
44%
$ 76,801
$ 76,801
AFFO per common share, diluted
$ 0.20
$ 0.03
44%
$ 0.16
$ 0.16
Weighted average shares outstanding, diluted
473,159,051
For more information reference the supplemental financial information filed on August 5, 2013.
Private Capital Management data is not applicable for the three months ended June 30, 2012 as the acquisition of Cole
Holdings occurred on April 5, 2013.
1.
EBITDA, Normalized EBITDA, FFO and AFFO are non-GAAP measures. See “About the
Data” for a description of our non-GAAP measures and accompanying Supplemental Financial Information for GAAP
reconciliation.
2.
During the three months ended June 30, 2013 and June 30, 2012, the Company capitalized
expenses incurred related to the ongoing maintenance of the properties, including tenant improvements and leasing
commissions, of $983,000 and $2.8 million, respectively. $
29,134 $134,300
$ 154,311
$ 617,244
$ 76,230
$ 0.16
$ 110,761
$ 0.23
491,510,128
$
$ |
 11
©
2013 Cole Real Estate Investments, Inc. All Rights Reserved.
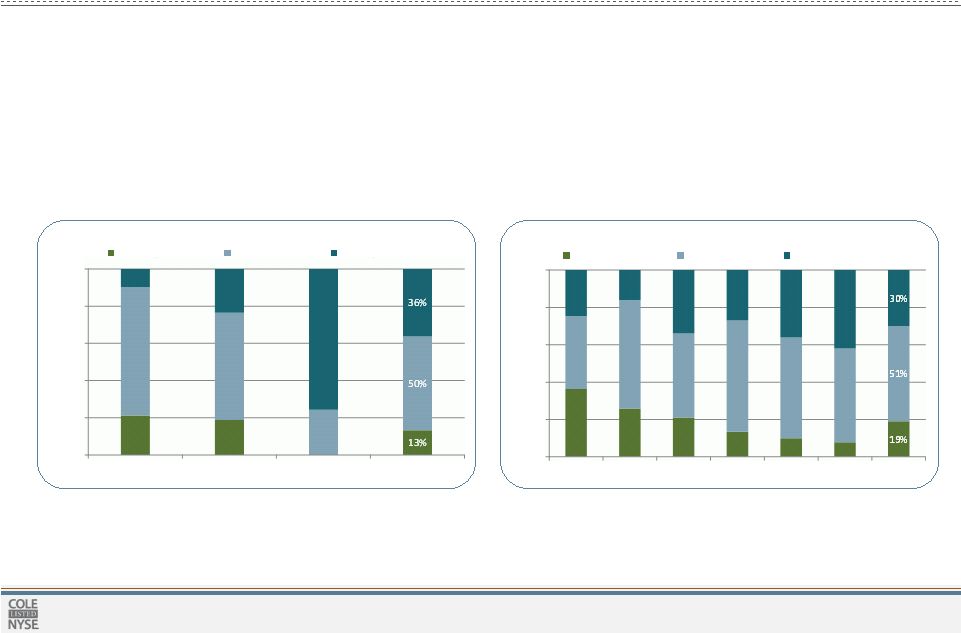
2H13E AFFO PER DILUTED SHARE COMPOSITION
2H13E NORMALIZED EBITDA COMPOSITION ($mm)
$0
$0
Financials
Increased 2013 Second Half Guidance
Note: All dollars in millions, except per share data; All US GAAP except Normalized EBITDA and
AFFO. See “About the Data” for a description of the Non-GAAP financial measures and accompanying
Supplemental Financial Information for GAAP reconciliation. 2H2013E AFFO and NORMALIZED EBITDA
compositions are based on the mid point of the respective financial ranges.
1.Real Estate Investment Revenue includes $9 million from estimated Interest income on real
estate related investments. Estimates assume $550 million of net acquisitions in the second half at a 7.3% cap rate
and include the potential impact of the $250 million tender offer and up to $250 million of
share repurchases. Funding sources for investment activity will come from a combination of property dispositions,
CMBS sales, cash on balance sheet and/or the use of the credit facility with a target total
debt to gross assets ratio not to exceed 50%. 2.Private Capital Management
Revenue (Gross) is presented before reallowed fees and commissions. On a net basis Adjusted Revenues are estimated to be $66 - $78 million.
3.Includes the impact of CCPTII’s merger with Spirit Realty Capital, Inc., which closed
on July 17, 2013. Assumes $1.67 billion of capital raised in 2H13 within Cole’s private capital management business, Cole
Capital , raised predominantly across Cole Corporate Income
Trust, Inc., a single-tenant office and industrial portfolio, and Cole Credit Property Trust IV, Inc., a single and multi-tenant retail portfolio.
TM |
 12
©
2013 Cole Real Estate Investments, Inc. All Rights Reserved.
Current Dividend Yield
Equivalent
COLE
Price
NNN
4.6%
$15.55
WPC
4.8%
$15.13
LXP
4.8%
$15.05
O
5.0%
$14.35
CSG
6.2%
$11.65
EPR
6.3%
$11.48
ARCP
6.3%
$11.43
COLE
6.7%
$10.68
SRC
7.2%
$10.02
Average
5.6%
$12.76
Strategic Steps to Enhanced Value
Corporate Strategy
Optimizing Capital Spreads: Equity
Average
Upside
of
33%
Based
on
Peer
Multiples
(1)
1.
Create Investor Liquidity
»
Listed on the NYSE on June 20, 2013
»
$250 million modified “Dutch auction” tender designed to ease investor
transition
2.
Broaden Shareholder
Base
»
Early inclusion in the MSCI U.S. REIT Index (RMS/RMZ) occurred July 3, 2013
»
Based on our analysis, we anticipate the possibility of near term index inclusion
in Dow Jones Real Estate, FTSE NAREIT and various S&P indices
3.
Close the Information Gap
»
2Q13 financials provide first fully consolidated financial picture of the Company
4.
Increase Institutional Ownership
»
Proactive discussions with sell-side analysts regarding equity research coverage
»
Active targeting of, and robust communication with, institutional investors
5.
Maximize the
Opportunity
»
Authorized to repurchase up to $250 million of shares in the open market
starting on the 11th business day following the completion of the tender offer 1.
Source : SNL. Cole multiples computed with an annualized midpoint of 2H2013
guidance of $0.42 to $0.47. Annual distribution assumed for Cole of
$0.72. Average upside calculated as average percentage price change from COLE’s current price to the
Equivalent COLE price at comparable multiples or dividend yields. Please see “About the
Data” for a description of AFFO which is a non-GAAP financial measure.
Data as of 7/31/2013.
Average Upside of 19% Based on Peer Dividend Yields
(1)
2013E
AFFO
Multiple
Equivalent
COLE
Price
O
18.8x
$16.71
NNN
18.2x
$16.17
WPC
17.5x
$15.59
LXP
16.5x
$14.73
ARCP
15.6x
$13.92
CSG
15.5x
$13.76
EPR
13.7x
$12.15
COLE
12.0x
$10.68
SRC
11.9x
$10.59
Average
16.0x
$14.20
Average
Upside
of
19%
Based
on
Peer
Dividend
Yields
(1) |
 13
©
2013 Cole Real Estate Investments, Inc. All Rights Reserved.
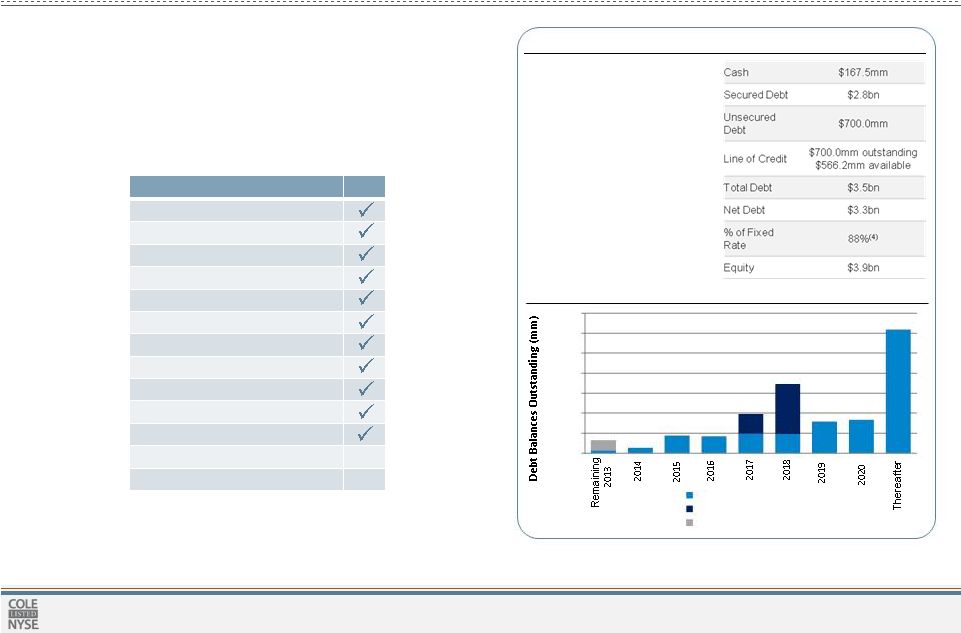
Key
Balance
Sheet
Metrics
and
Capital
Structure
(2)
Debt Maturity Profile
•
39% Debt to Enterprise Value
•
47% Debt to Gross Real Estate and
Related Assets
•
5.4x Net Debt to Normalized
EBITDA Ratio
•
3.2x Interest Coverage Ratio
•
4.22% Weighted average cost of
debt
•
6.0 Weighted average years to
maturity
•
Gross Book Value of
Unencumbered
Properties
$2.0bn
(3)
Capital Structure Objectives
»
Seek unsecured debt issuance
»
Reduce leverage to increase flexibility
»
Obtain investment grade rating
Understanding Ratings Criteria
»
Based upon our analysis of Moody’s rating methodology, we
should be well positioned and appear ready for investment grade
status
Corporate Strategy
Optimizing Capital Spreads: Debt
Key
Financial
Rating
Criteria
(1)
Cole
Liquidity >= 1 year
Weighted Average Debt Maturities < 20%
Average FFO Payout < 90%
Debt + Preferred / Gross Assets < 50%
Net Debt / EBITDA < 8.0x
Gross Assets > $2 Billion
Development Pipeline < 10%
EBITDA Margin > 55%
EBITDA Margin Volatility < 6%
Fixed Charge Coverage > 2.2x
Joint Venture Exposure < 15%
Unencumbered Assets > 60%
30%
Secured Debt / Gross Assets <
20% 36%
$0
$200
$400
$600
$800
$1,000
$1,200
$1,400
Mortgage Debt
Credit Facility
Repurchase Agreements
Criteria as reported in Moody’s Investor Service Rating Methodology published July 30,
2010.
Data as of June 30, 2013. Additionally, investors should review the Supplemental Financial
Information for the second quarter of 2013 furnished on Form 8-K on 8/5/2013 for additional information.
Gross Book Value of unencumbered properties includes $1.9 billion of assets pledged to the
credit facility as of June 30, 2013.
Includes the credit facility’s term loan of $500.0 million and $473.0 million of variable
rate debt each subject to interest rate swap agreements. 1.
2.
3.
4. |
 14
©
2013 Cole Real Estate Investments, Inc. All Rights Reserved.
Why Cole?
PRIVATE CAPITAL
MANAGEMENT
GROWTH
»
Active portfolio management to monetize
gains and redeploy capital
»
Yield enhancement through property
type
diversification
»
Future deal pipeline and yield potential
via joint ventures
»
Embedded annual rental increases
»
Best-in-class platform built for
size and
scale »
Proven ability to source and acquire high-
quality accretive assets
»
Disciplined acquisition results via rigorous
underwriting and credit discipline
»
Proactive risk management to protect and
enhance NOI
Our focus is on growing AFFO per share while maintaining a balanced risk profile
»
Valuable fee revenue provides diversified income growth
»
Ability to raise cycle-resistant capital capturing growing income investor trends
»
Continuously developing new products and distribution relationships |
 15
©
2013 Cole Real Estate Investments, Inc. All Rights Reserved.
Portfolio Highlights
Single-Tenant Retail
Walgreens Portfolio
71 Properties | 30 States | 1.0 M SF
Portfolio Price: $342.2 Million
Lease Yield: 7.8%
BJ’s Wholesale Club
Portfolio
10 Properties | 7 States | 1.0 M SF
Portfolio Price: $177.4 Million
Lease Yield: 7.8%
Family Dollar Portfolio
140 Properties | 26 States | 1.2 M
SF
Portfolio Price: $186.0 Million
Lease Yield: 6.9%
Tractor Supply Portfolio
40 Properties | 20 States | 822,000
SF
Portfolio Price: $120.2 Million
Lease Yield: 8.7%
Kohl’s Portfolio
13 Properties | 8 States | 1.0 M SF
Portfolio Price: $105.3 Million
Lease Yield: 8.0%
L.A. Fitness Portfolio
14 Properties | 7 States | 615,000
SF
Portfolio Price: $116.0 Million
Lease Yield: 10.0%
CVS Portfolio
48 Properties | 21 States | 592,000
SF
Portfolio Price: $207.7 Million
Lease Yield: 7.6%
Albertsons Portfolio
33 Properties | 5 States | 1.9 M SF
Portfolio Price: $276.9 Million
Lease Yield: 8.3%
Note: Owned properties. Lease yield represents the average rental income over the
non-cancellable lease-terms as of close of escrow divided by the purchase price of the property; excluding certain increases subject to
the consumer price index (CPI). Data as of 6/30/13
|
 16
©
2013 Cole Real Estate Investments, Inc. All Rights Reserved.
Walmart Portfolio
7 Properties | 6 States | 1.3 M SF
Portfolio Price: $106.7 Million
Lease Yield: 7.2%
On the Border Portfolio
26 Properties | 13 States | 182,000
SF
Portfolio Price: $77.0 Million
Lease Yield: 9.7%
Stripes Portfolio
24 Properties | 2 States | 138,000 SF
Portfolio Price: $80.5 Million
Lease Yield: 8.1%
PetSmart Portfolio
13 Properties | 9 States | 351,000 SF
Portfolio Price: $82.1 Million
Lease Yield : 7.7%
Advance Auto Parts
Portfolio
45 Properties | 10 States | 302,000
SF
Portfolio Price: $70.5 Million
Lease Yield: 8.4%
Lowe’s Portfolio
8 Properties | 8 States |1.1 M SF
Portfolio Price: $77.7 Million
Lease Yield: 7.4%
Outback Steakhouse
Portfolio
20 Properties | 14 States | 126,000
SF
Portfolio Price: $55.9 Million
Lease Yield: 9.3%
Thorntons Oil Portfolio
23 Properties | 4 States | 79,000 SF
Portfolio Price: $60.1 Million
Lease Yield: 7.9%
Portfolio Highlights
Single-Tenant Retail
Note: Owned properties. Lease yield represents the average rental income over the
non-cancellable lease-terms as of close of escrow divided by the purchase price of the property; excluding certain increases subject
to the consumer price index (CPI). Data as of 6/30/13
|
 17
©
2013 Cole Real Estate Investments, Inc. All Rights Reserved.
Academy Sports Portfolio
6 Properties | 3 States | 523,000 SF
Portfolio Price: $51.4 Million
Lease Yield: 9.5%
Best Buy Portfolio
10 Properties | 8 States | 362,000
SF
Portfolio Price: $58.3 Million
Lease Yield: 8.3%
Golden Corral Portfolio
22 Properties | 7 States | 234,000 SF
Portfolio Price: $52.1 Million
Lease Yield: 8.4%
Applebee’s Portfolio
19 Properties | 12 States | 95,000 SF
Portfolio Price: $37.7 Million
Lease Yield: 11.3%
Aaron Rents Portfolio
38 Properties | 16 States | 360,000
SF
Portfolio Price: $44.4 Million
Lease Yield: 9.1%
Home Depot Portfolio
5 Properties | 5 States |525,000 SF
Portfolio Price: $45.0 Million
Lease Yield: 8.7%
Cracker Barrel Portfolio
10 Properties | 5 States | 101,000
SF
Portfolio Price: $31.3 Million
Lease Yield: 11.3%
Wendy’s Portfolio
32 Properties | 4 States | 101,000 SF
Portfolio Price: $43.3 Million
Lease Yield: 8.7%
Portfolio Highlights
Single-Tenant Retail
Note: Owned properties. Lease yield represents the average rental income over the
non-cancellable lease-terms as of close of escrow divided by the purchase price of the property; excluding certain increases subject
to the consumer price index (CPI). Data as of 6/30/13
|
 18
©
2013 Cole Real Estate Investments, Inc. All Rights Reserved.
Health Now NY
Buffalo MSA | 430,000 SF
Purchase Price: $84.5 Million
Class A, two-tower office property
originally constructed as a build-to-suit
Lease Yield: 8.9%
Portfolio Highlights
Office and Industrial
Amazon Portfolio
3 Properties | 2 States | 3.0 M SF
Portfolio Price: $186.6 Million
Regional distribution centers for
domestic and international orders
Lease Yield: 7.5%
EMC Corporation
Boston MSA | 328,000 SF
Purchase Price: $93.5 Million
Corporate headquarters campus for
EMC affiliate RSA security
Lease Yield: 7.4%
Encana Oil & Gas
Dallas MSA | 319,000 SF
Purchase Price: $120.0 Million
Class A, regional headquarters for leading
energy producer
Lease Yield: 6.5%
Merrill Lynch
Trenton MSA | 482,000 SF
Purchase Price: $135.0 Million
Corporate headquarters for Merrill
Lynch Global Wealth & Investment
Management
Lease Yield: 8.1%
PetSmart
Phoenix MSA | 366,000 SF
Purchase Price: $102.5 Million
Corporate campus comprised of three
mid-rise office towers
Lease Yield: 8.3%
Igloo
Houston MSA | 914,000 SF
Purchase Price: $38.1 Million
Corporate headquarters, distribution,
warehouse and manufacturing facility
Lease Yield: 8.5%
Walmart
Riverside MSA | 496,000 SF
Purchase Price: $91.5 Million
Warehouse and distribution
Lease Yield: 6.8%
Note: Owned properties. Lease yield represents the average rental income over the
non-cancellable lease-terms as of close of escrow divided by the purchase price of the property; excluding certain increases subject
to the consumer price index (CPI). Data as of 6/30/13
|
 19
©
2013 Cole Real Estate Investments, Inc. All Rights Reserved.
AT&T
2 Properties | 2 States | 1.0 M SF
Purchase Price: $234.4 Million
Two class A office regional
headquarters facilities
Lease Yield: 8.3%
Clorox
San Francisco-Oakland MSA |
343,000 SF
Purchase Price: $96.5 Million*
Six-building corporate operations and
R&D center
Lease Yield: 6.9%
The Medicines Company
Newark MSA | 179,000 SF
Purchase Price: $53.0 Million
Headquarters for global pharmaceutical
company
Lease Yield: 8.7%
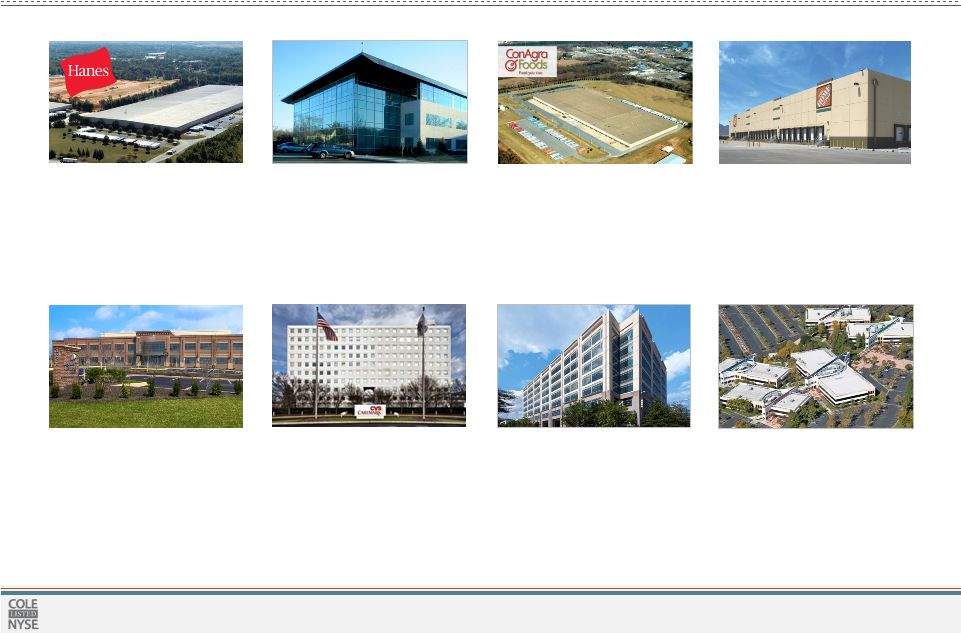
Hanesbrands
Greensboro MSA | 930,000 SF
Purchase Price: $31.7 Million
Eastern distribution center for apparel
products
Lease Yield: 9.4%
The Home Depot
3 Properties | 3 States | 1.0 M SF
Purchase Price: $76.4 Million
Two Rapid Deployment Centers and a
built-to-suit call center
Lease Yield: 8.5%
CVS Pharmacy
Chicago MSA | 195,000 SF
Purchase Price: $44.3 Million
One of three regional operations
centers for the pharmacy health care
provider
Lease Yield: 8.0%
Banner Life Insurance Co.
Washington DC MSA | 116,000 SF
Purchase Price: $38.2 Million
U.S. headquarters for life insurance
company
Lease Yield: 8.2%
ConAgra Foods
Harrisburg MSA | 719,000 SF
Purchase Price: $28.5 Million
Warehouse and distribution facility for
Chef Boyardee food processing plant
Lease Yield: 8.9%
Portfolio Highlights
Office and Industrial
Note: Owned properties. Lease yield represents the average rental income over the
non-cancellable lease-terms as of close of escrow divided by the purchase price of the property; excluding certain increases subject
to the consumer price index (CPI). Data as of 6/30/13. *Joint Venture. Cole’s ownership
is 90% ($86.9 million) |
 20
©
2013 Cole Real Estate Investments, Inc. All Rights Reserved.
Portfolio Highlights
Multi-Tenant Power Centers and Grocery-Anchored Retail
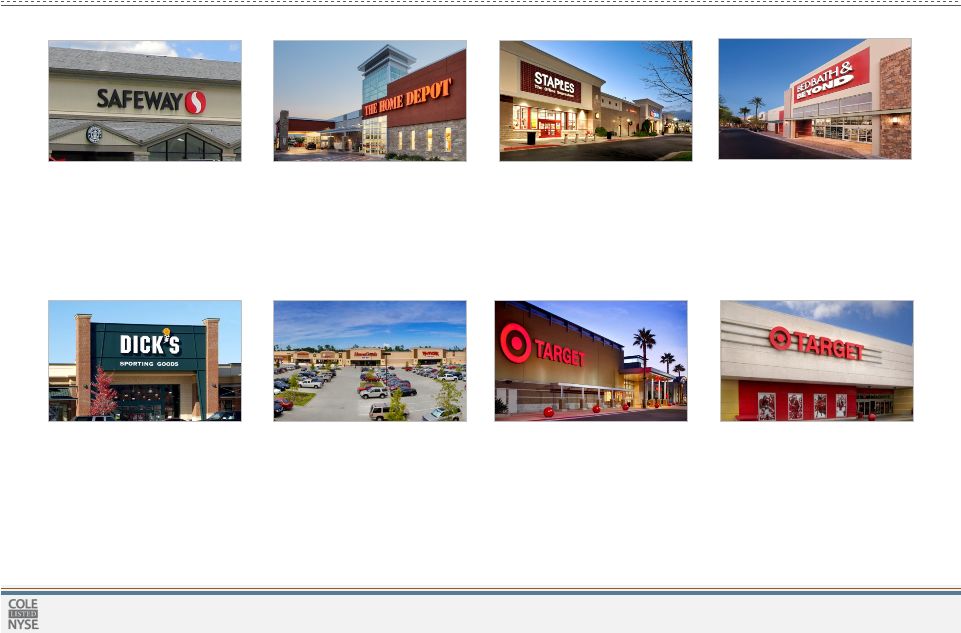
Atascocita Commons
Houston MSA | 318,000 SF
Purchase Price: $56.5 Million
Anchor Tenants: Kohl’s, T.J. Maxx,
Office Depot, Petco, Palais Royal and
Ross
Lease Yield: 7.4%
Camp Creek Marketplace
Atlanta MSA | 426,000 SF
Purchase Price: $76.4 Million
Anchor Tenants: BJ’s Warehouse,
Ross, Marshalls, T.J. Maxx, Staples and
PetSmart
Lease Yield: 8.0 %
Eastland Center
Los Angeles MSA | 811,000 SF
Purchase Price: $145.9 Million
Anchor Tenants: Target, Walmart, Dick’s
Sporting Goods, Marshalls, Burlington
Coat Factory, Office Depot and PetSmart
Lease Yield: 6.5%
Power Center Portfolio
4 Properties* | Phoenix MSA, 1.0M
SF
Portfolio Price: $175.0 Million*
Anchor Tenants: Jo-Ann Fabrics,
Bed Bath & Beyond, Marshalls, DSW,
Nordstrom Rack and Hobby Lobby
Lease Yield: 7.8%
Mueller Regional
Austin MSA | 348,000 SF
Purchase Price: $67.3 Million
Anchor Tenants: The Home Depot, Best
Buy, Bed Bath & Beyond and Marshalls
Lease Yield: 8.2%
Valley Bend
Huntsville MSA | 416,000 SF
Purchase Price: $72.5 Million
Anchor Tenants: Hobby Lobby, Dick’s
Sporting Goods, Marshalls, Bed Bath &
Beyond and PetSmart
Lease Yield: 8.1%
University Plaza
Flagstaff MSA | 165,000 SF
Purchase Price: $17.2 Million
Anchor Tenants: Safeway, Bed Bath &
Beyond, Ross, and PetSmart
Lease Yield: 9.9%
Whittwood Town Center
Los Angeles MSA | 785,000 SF
Purchase Price: $83.5 Million
Anchor Tenants: Target, JCPenney,
Sears, Kohl’s, Vons, PetSmart, World
Market and 24Hour Fitness
Lease Yield: 6.9%
Note: Owned properties. Lease yield represents the average rental income over the
non-cancellable lease-terms as of close of escrow divided by the purchase price of the property; excluding certain increases subject
to the consumer price index (CPI). Data as of 6/30/13. *The Company has interests in three
properties through joint venture arrangements. Cole’s shares of the purchase price is $108.9 million.
|
 21
©
2013 Cole Real Estate Investments, Inc. All Rights Reserved.
Portfolio Highlights
Multi-Tenant Power Centers and Grocery-Anchored Retail
Greenway Commons
Houston MSA | 253,000 SF
Purchase Price: $68.3 Million
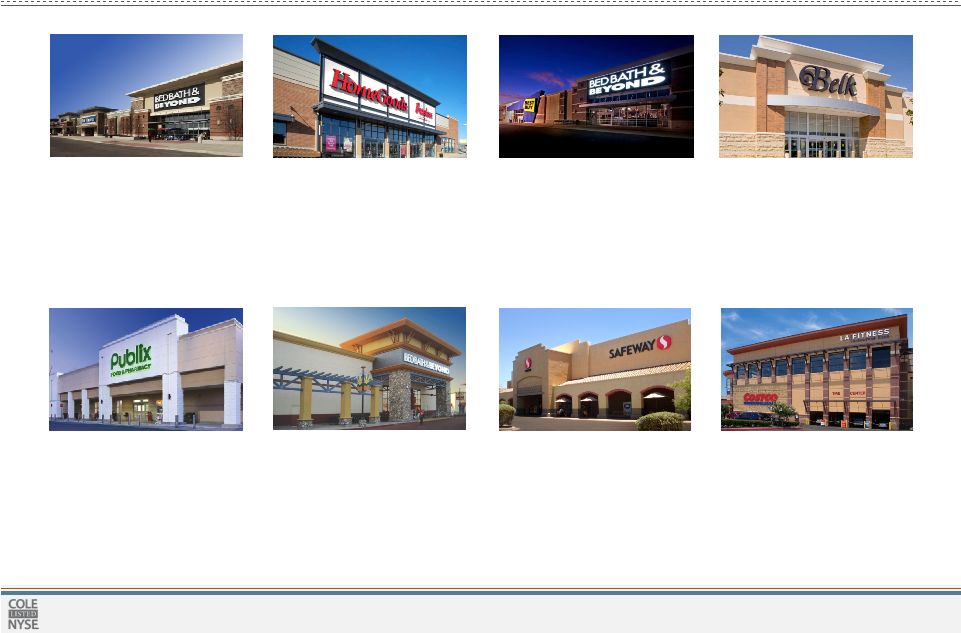
Anchor Tenants: Costco, LA Fitness,
Buffalo Wild Wings
Lease Yield: 6.6%
Folsom Gateway II
Sacramento MSA | 115,000 SF
Purchase Price: $36.0 Million
Anchor Tenants: Bed Bath & Beyond,
PetSmart, ULTA, DSW, US Bank
Lease Yield: 7.8%
Fairlane Green
Detroit MSA | 273,000 SF
Purchase Price: $47.0 Million
Anchor Tenants: Bed Bath & Beyond,
Michaels, TJ Maxx, Old Navy, Barnes &
Noble, Pier 1 Imports
Lease Yield: 9.9%
Santa Rosa Commons
Pensacola MSA | 140,000 SF
Purchase Price: $25.5 Million
Anchor Tenants: Publix, TJ Maxx,
PetSmart
Lease Yield: 8.0%
Silverado Plaza
Tucson MSA | 77,000 SF
Portfolio Price: $9.3 Million
Anchor Tenants: Safeway, Wells Fargo
Lease Yield: 7.8%
Hillside Town Center
Chicago MSA | 167,000 SF
Purchase Price: $26.9 Million
Anchor Tenants: HomeGoods,
Michaels, Petco, Staples, Charming
Charlie
Lease Yield: 9.0%
Oxford Exchange
Birmingham MSA | 334,000 SF
Purchase Price: $45.5 Million
Anchor Tenants: Dick’s Sporting Goods,
Hobby Lobby, TJ Maxx, Ross Dress For
Less, PetSmart, Old Navy, Bed Bath &
Beyond
Lease Yield: 8.5%
Barrow Crossing
Atlanta MSA | 280,000 SF
Purchase Price: $37.1 Million*
Belk, PetSmart, Michaels, TJ Maxx,
Staples, Publix, McDonalds
Lease Yield: 8.4%
Note: Owned properties. Lease yield represents the average rental income over the
non-cancellable lease-terms as of close of escrow divided by the purchase price of the property; excluding certain increases subject
to the consumer price index (CPI). Data as of 6/30/13. *Joint venture. Cole’s
ownership is 90% ($33.4 million) |
 22
©
2013 Cole Real Estate Investments, Inc. All Rights Reserved.
About the Data
Supplemental Information
The supplemental financial information package for the
second quarter ended June 30, 2013 that accompanies this presentation, and the Company's Form 10-Q
report for the same period, were filed on August 5, 2013 and are
available on Cole's website at www.colereit.com. Non-GAAP Financial Measures
FFO and AFFO
Funds From Operations (“FFO”) is a non-GAAP financial
performance measure defined by the National Association of Real Estate Investment Trusts
(“NAREIT”) and widely recognized by investors and analysts as
one measure of operating performance of a real estate company. The FFO calculation excludes
items such as real estate depreciation and amortization, gains and
losses on the sale of depreciable real estate and impairments of depreciable real estate.
Depreciation and amortization as applied in accordance with GAAP
implicitly assumes that the value of real estate assets diminishes predictably over time. Since
real estate values have historically risen or fallen with market
conditions, it is management’s view, and we believe the view of many industry investors and
analysts, that the presentation of operating results for real estate
companies by using the historical cost accounting method alone is insufficient. In addition, FFO
excludes gains and losses from the sale of depreciable real estate and
impairment charges on depreciable real estate, which we believe provides management and
investors with a helpful additional measure of the performance of our
real estate portfolio, as it allows for comparisons, year to year, that reflect the impact on
operations from trends in items such as occupancy rates, rental rates,
operating costs, general and administrative expenses, and interest costs. We compute FFO
in accordance with NAREIT’s definition. In addition to FFO, we use
Adjusted Funds From Operations (“AFFO”) as a non-GAAP supplemental financial performance measure to evaluate the operating
performance of our real estate portfolio. AFFO, as defined by our
company, excludes from FFO merger, acquisition, and listing related costs, amortization and
write off of deferred financing costs, straight-line rent
adjustments, above and below market lease intangibles amortization, realized loss on derivatives and debt
prepayment fees, gain on sale of marketable securities, other
amortization or accretion, other gains, adjustments for discontinued operations and our
proportionate share of adjustments for unconsolidated joint ventures,
all of which are required to be expensed or recorded as additions to revenue or other income
in accordance with GAAP. In evaluating the performance of our portfolio
over time, management employs business models and analyses that differentiate the
costs to acquire investments from the investments’ revenues and
expenses. Management believes that excluding the items noted above from AFFO provides
investors with supplemental performance information that is consistent
with the performance models and analysis used by management, and provides investors a
view of the performance of our portfolio over time, including after the
Company ceases to acquire properties on a frequent and regular basis. AFFO also allows
for a comparison of the performance of our portfolio with other REITs
that are not currently engaging in acquisitions and mergers, as well as a comparison of our
performance with that of other REITs, as AFFO, or an equivalent
measure, is routinely reported by REITs, and we believe often used by analysts and investors
for comparison purposes.
For all of these reasons, we believe FFO and AFFO, in
addition to net income and cash flows from operating activities, as defined by GAAP, are helpful
supplemental performance measures and useful in understanding the
various ways in which our management evaluates the performance of our real estate
portfolio over time. However, not all REITs calculate FFO and AFFO the
same way, so comparisons with other REITs may not be meaningful. FFO and AFFO
should not be considered as alternatives to net income or to cash flows
from operating activities, and are not intended to be used as a liquidity measure indicative
of cash flow available to fund our cash needs.
|
 23
©
2013 Cole Real Estate Investments, Inc. All Rights Reserved.
About the Data (continued)
Non-GAAP Financial Measures continued
EBITDA and Normalized EBITDA
Normalized EBITDA
as
disclosed
represents
EBITDA,
or
earnings
before
interest,
taxes,
depreciation
and
amortization,
modified
to
include
other
adjustments to GAAP net income for merger, acquisition, and listing related expenses which are
considered non-recurring and gain/losses in real estate and derivatives which are not
considered fundamental attributes of our business plans and do not affect our overall long-term operating
performance.
We
exclude
these
items
from
Normalized
EBITDA
as
they
are
not
the
primary
drivers
in
our
decision
making
process.
In
addition,
our
assessment of our operations is focused on long-term sustainability and not on such non-cash
items, which may cause short term fluctuations in net income but have no impact on cash
flows. We believe that Normalized EBITDA is a useful supplemental measure to investors and analysts for
assessing the performance of our business segments, although it does not represent net income that is
computed in accordance with GAAP. Therefore, Normalized EBITDA should not be considered as an
alternative to net income or as an indicator of our financial performance. We use Normalized
EBITDA as one measure of our operating performance when we formulate corporate goals and evaluate the effectiveness of our
strategies. Normalized EBITDA may not be comparable to similarly titled measures of other
companies. Adjusted Revenue
Adjusted Revenue is a non-GAAP financial measure that represents revenue on a GAAP basis adjusted
to eliminate revenue recorded as reimbursement revenue in accordance with GAAP. Included within
Offering Fee Revenue and Management Fee Revenue is revenue related to expense reimbursements
for offering costs and certain general and administrative costs incurred by the Company, included in general and
administrative expense
of
the
Company,
which
is
reimbursed
by
the
managed
REITs.
We
believe
that
excluding
the
items
noted
above
from
revenue
provides investors with supplemental performance information that is consistent with the performance
models and analysis used by management.
Adjusted
Revenues
should
not
be
considered
as
an
alternative
to
revenue
or
cash
flows
from
operating
activities
computed
on a
GAAP basis as a measure of our profitability. Adjusted Revenues may not be comparable to similarly
titled measures of other companies. GAAP Reconciliations
A reconciliation of net income to FFO, AFFO and Normalized EBITDA and a reconciliation of revenue to
adjusted revenue are provided in the Supplemental Financial Information for the second quarter
of 2013 accompanying this presentation. Lease Yield
Lease yield is calculated as the average annual rental income, adjusted for any rent concessions or
abatements, for the in-place leases over the non- cancellable lease
term
at
the
respective
property
divided
by
the
property
purchase
price,
exclusive
of
acquisition
costs.
In
general,
our
properties
are
subject to long-term triple net or double net leases, and the future costs associated with the
double net leases are unpredictable and may reduce the yield. |