Attached files
| file | filename |
|---|---|
| 8-K - MSCI INC. 8-K - MSCI Inc. | a50682352.htm |
| EX-99.1 - EXHIBIT 99.1 - MSCI Inc. | a50682352ex991.htm |
Exhibit 99.2
msci.com ©2013. All rights reserved. msci.com Second Quarter 2013 Earnings Presentation August 1, 2013
msci.com ©2013. All rights reserved. 2 msci.com Forward-Looking Statements and Other Information Forward-Looking Statements – Safe Harbor Statements This presentation may contain forward-looking statements within the meaning of the Private Securities Litigation Reform Act of 1995. You should not place undue reliance on forward-looking statements because they involve known and unknown risks, uncertainties and other factors that are, in some cases, beyond our control and that could materially affect actual results, levels of activity, performance or achievements. For a discussion of risk and uncertainties that could materially affect actual results, levels of activity, performance or achievements, please see the Company’s Annual Report on Form 10-K for the fiscal year ended December 31, 2012 and its other reports filed with the SEC. Any forward-looking statements included in this presentation reflect the Company’s view as of the date of the presentation. The Company assumes no obligation to publicly update or revise these forward-looking statements for any reason, whether as a result of new information, future events, or otherwise, except as required by law. Other Information Percentage changes and totals in this presentation may not sum due to rounding. Percentage changes are referenced to the comparable period in 2012, unless otherwise noted. Total sales include recurring subscription sales and non-recurring sales. Definitions of Run Rate and Retention Rate provided on page
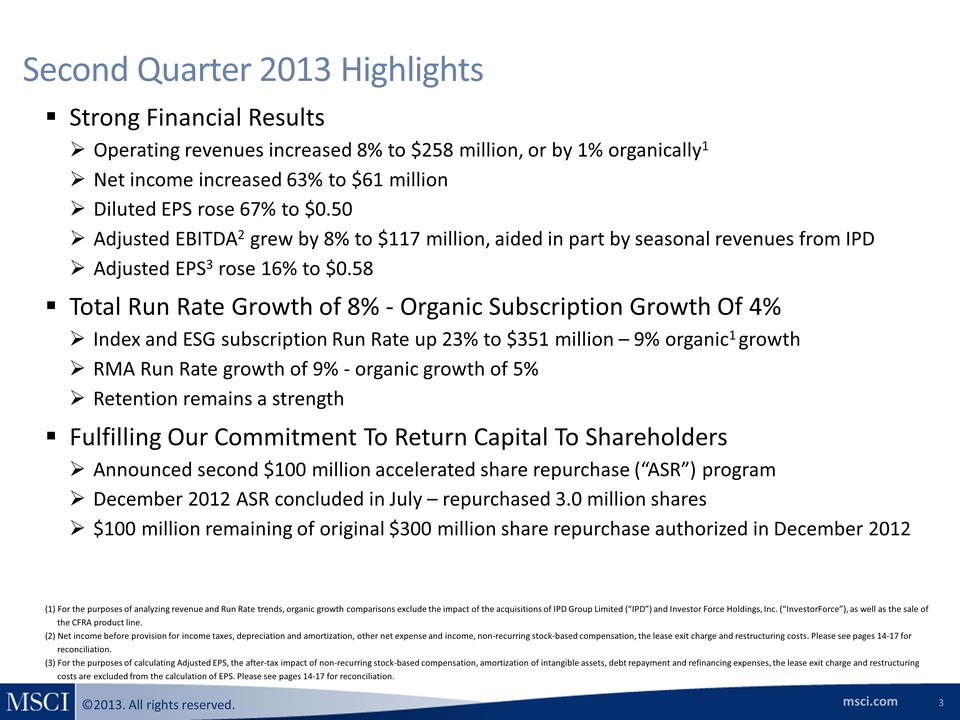
msci.com ©2013. All rights reserved. Second Quarter 2013 Highlights 3 Strong Financial Results Operating revenues increased 8% to $258 million, or by 1% organically1 Net income increased 63% to $61 million Diluted EPS rose 67% to $0.50 Adjusted EBITDA2 grew by 8% to $117 million, aided in part by seasonal revenues from IPD Adjusted EPS3 rose 16% to $0.58 Total Run Rate Growth of 8% - Organic Subscription Growth Of 4% Index and ESG subscription Run Rate up 23% to $351 million – 9% organic1 growth RMA Run Rate growth of 9% - organic growth of 5% Retention remains a strength Fulfilling Our Commitment To Return Capital To Shareholders Announced second $100 million accelerated share repurchase (“ASR”) program December 2012 ASR concluded in July – repurchased 3.0 million shares $100 million remaining of original $300 million share repurchase authorized in December 2012 (1) For the purposes of analyzing revenue and Run Rate trends, organic growth comparisons exclude the impact of the acquisitions of IPD Group Limited (“IPD”) and Investor Force Holdings, Inc. (“InvestorForce”), as well as the sale of the CFRA product line. (2) Net income before provision for income taxes, depreciation and amortization, other net expense and income, non-recurring stock-based compensation, the lease exit charge and restructuring costs. Please see pages 14-17 for reconciliation. (3) For the purposes of calculating Adjusted EPS, the after-tax impact of non-recurring stock-based compensation, amortization of intangible assets, debt repayment and refinancing expenses, the lease exit charge and restructuring costs are excluded from the calculation of EPS. Please see pages 14-17 for reconciliation.
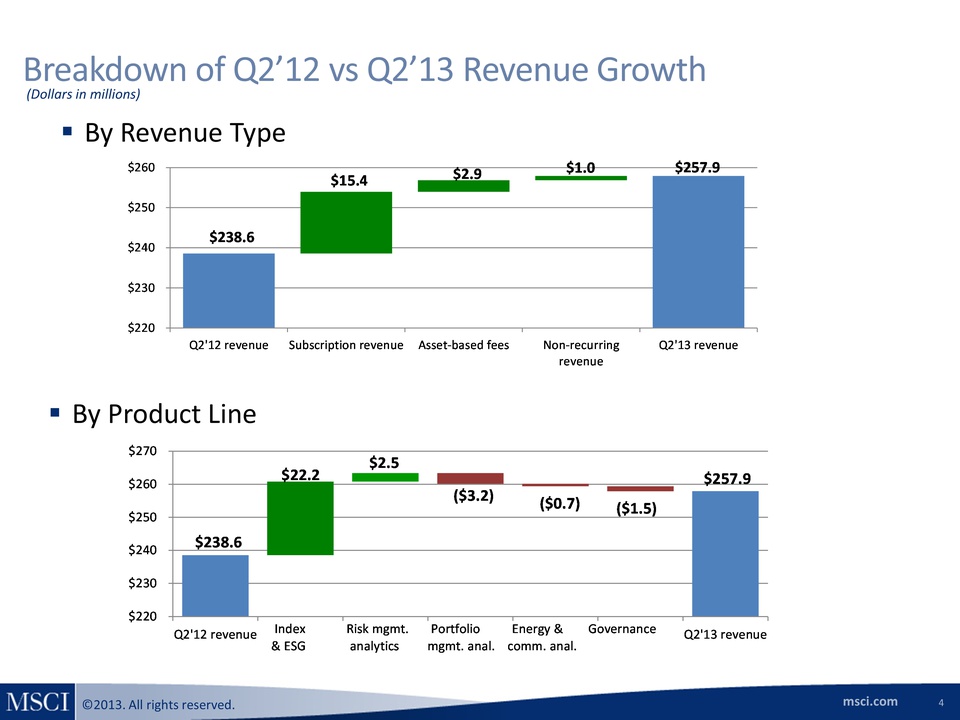
msci.com ©2013. All rights reserved. Breakdown of Q2’12 vs Q2’13 Revenue Growth 4 By Revenue Type By Product Line (Dollars in millions) $238.6 $257.9 $15.4 $220$230$240$250$260Q2'12 revenueSubscription revenueAsset-based feesNon-recurringrevenueQ2'13 revenue$1.0$2.9$238.6 $257.9 $22.2 $2.5 ($3.2) ($0.7) ($1.5)$220$230$240$250$260$270Q2'12 revenueQ2'13 revenueIndex Risk mgmt. Portfolio Energy & Governance & ESG analytics mgmt. anal. comm. anal.
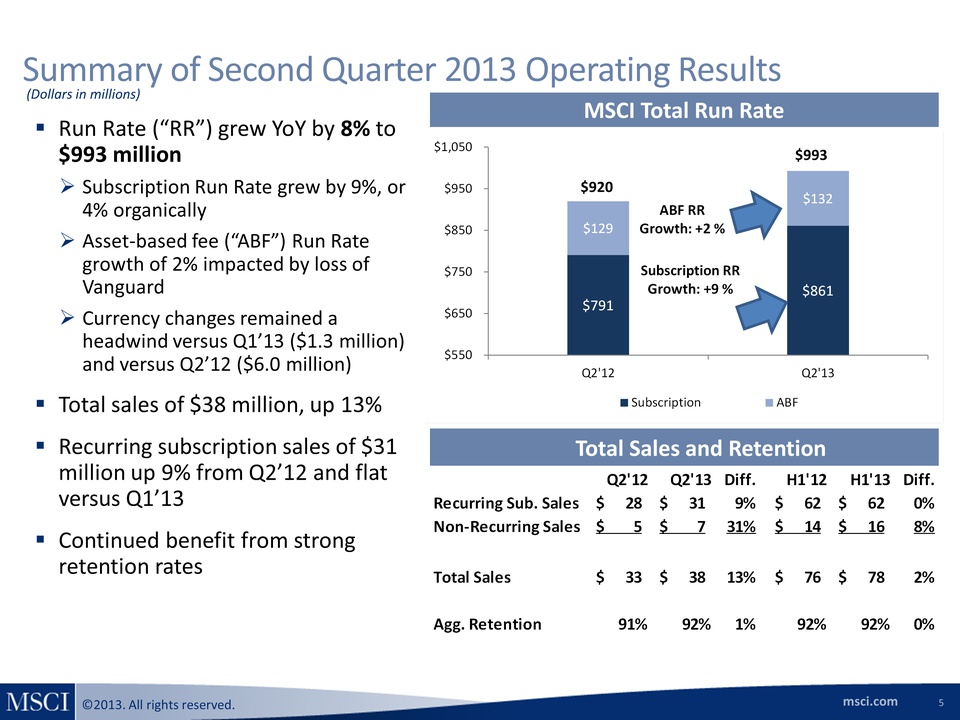
msci.com ©2013. All rights reserved. Summary of Second Quarter 2013 Operating Results 5 MSCI Total Run Rate Total Sales and Retention Run Rate (“RR”) grew YoY by 8% to $993 million Subscription Run Rate grew by 9%, or 4% organically Asset-based fee (“ABF”) Run Rate growth of 2% impacted by loss of Vanguard Currency changes remained a headwind versus Q1’13 ($1.3 million) and versus Q2’12 ($6.0 million) Total sales of $38 million, up 13% Recurring subscription sales of $31 million up 9% from Q2’12 and flat versus Q1’13 Continued benefit from strong retention rates (Dollars in millions) $791 $861 $129 $132 $550$650$750$850$950$1,050Q2'12Q2'13SubscriptionABFSubscription RR Growth: +9 %ABF RR Growth: +2 %$993 $920 Q2'12Q2'13Diff.H1'12H1'13Diff.Recurring Sub. Sales28$ 31$ 9%62$ 62$ 0%Non-Recurring Sales5$ 7$ 31%14$ 16$ 8%Total Sales33$ 38$ 13%76$ 78$ 2%Agg. Retention91%92%1%92%92%0%
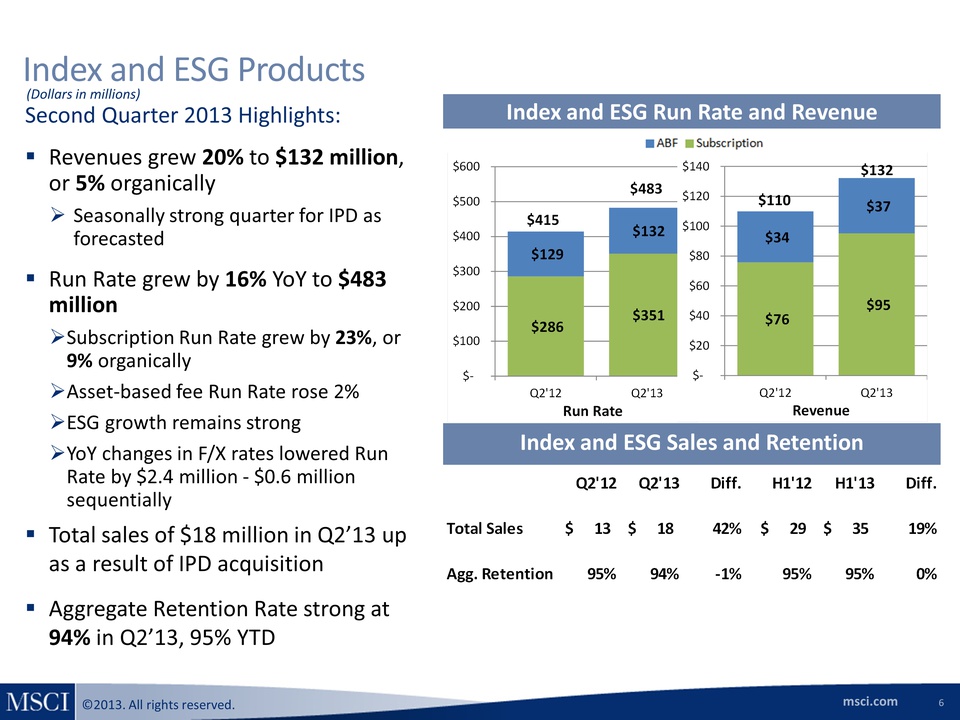
msci.com ©2013. All rights reserved. Index and ESG Products 6 Index and ESG Run Rate and Revenue Second Quarter 2013 Highlights: Revenues grew 20% to $132 million, or 5% organically Seasonally strong quarter for IPD as forecasted Run Rate grew by 16% YoY to $483 million Subscription Run Rate grew by 23%, or 9% organically Asset-based fee Run Rate rose 2% ESG growth remains strong YoY changes in F/X rates lowered Run Rate by $2.4 million - $0.6 million sequentially Total sales of $18 million in Q2’13 up as a result of IPD acquisition Aggregate Retention Rate strong at 94% in Q2’13, 95% YTD Index and ESG Sales and Retention (Dollars in millions) $286 $351 $129 $132 $- $100 $200 $300 $400 $500 $600Q2'12Q2'13Run Rate$415$483$76 $95 $34 $37 $- $20 $40 $60 $80 $100 $120 $140Q2'12Q2'13Revenue$110$132Q2'12Q2'13Diff.H1'12H1'13Diff.Total Sales13$ 18$ 42%29$ 35$ 19%Agg. Retention95%94%-1%95%95%0%
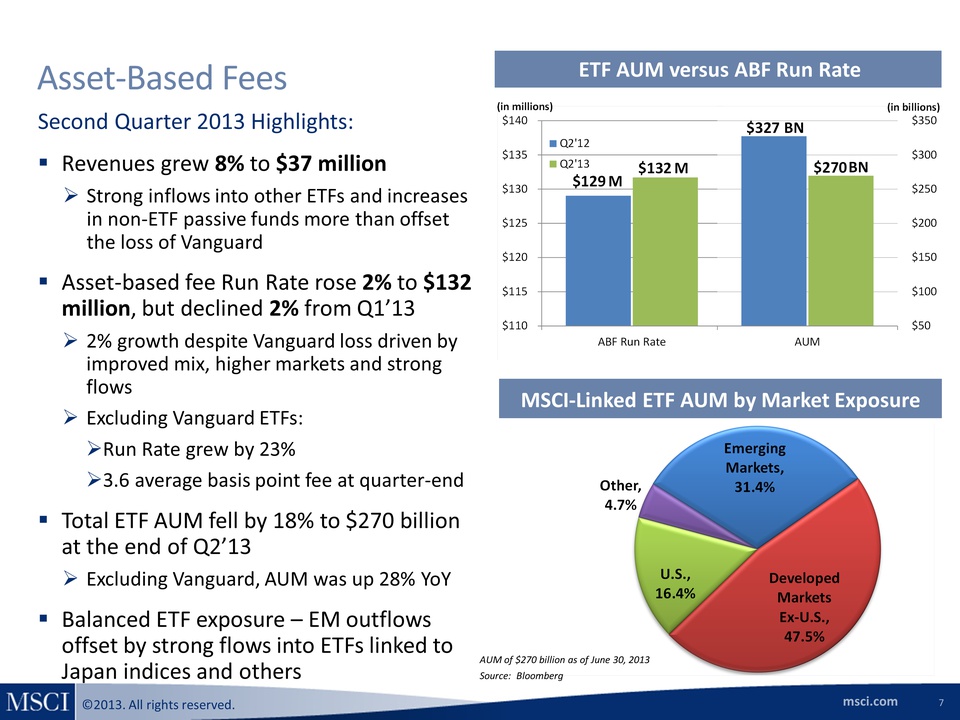
msci.com ©2013. All rights reserved. Asset-Based Fees ETF AUM versus ABF Run Rate 7 MSCI-Linked ETF AUM by Market Exposure Second Quarter 2013 Highlights: Revenues grew 8% to $37 million Strong inflows into other ETFs and increases in non-ETF passive funds more than offset the loss of Vanguard Asset-based fee Run Rate rose 2% to $132 million, but declined 2% from Q1’13 2% growth despite Vanguard loss driven by improved mix, higher markets and strong flows Excluding Vanguard ETFs: Run Rate grew by 23% 3.6 average basis point fee at quarter-end Total ETF AUM fell by 18% to $270 billion at the end of Q2’13 Excluding Vanguard, AUM was up 28% YoY Balanced ETF exposure – EM outflows offset by strong flows into ETFs linked to Japan indices and others Emerging Markets, 31.4%Developed Markets Ex-U.S., 47.5%U.S., 16.4%Other, 4.7%AUM of $270 billion as of June 30, 2013 Source: Bloomberg $129$132 $110 $115 $120 $125 $130 $135 $140ABF Run RateQ2'12Q2'13$270 $50 $100 $150 $200 $250 $300 $350AUMMM$327BNBN(in millions)(in billions)
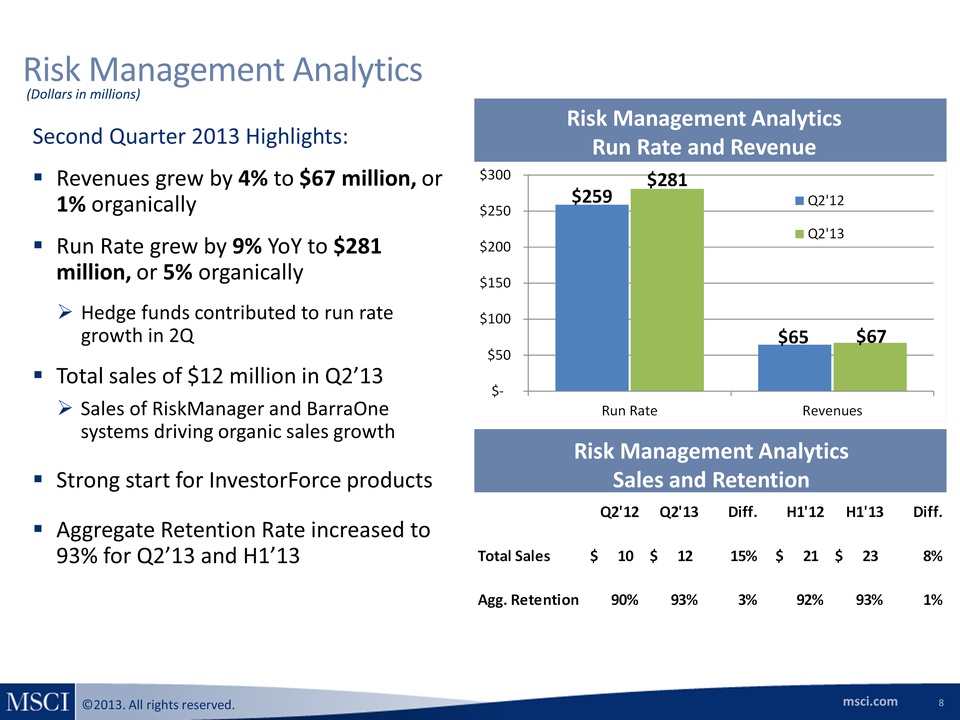
msci.com ©2013. All rights reserved. Risk Management Analytics Risk Management Analytics Run Rate and Revenue Second Quarter 2013 Highlights: Revenues grew by 4% to $67 million, or 1% organically Run Rate grew by 9% YoY to $281 million, or 5% organically Hedge funds contributed to run rate growth in 2Q Total sales of $12 million in Q2’13 Sales of RiskManager and BarraOne systems driving organic sales growth Strong start for InvestorForce products Aggregate Retention Rate increased to 93% for Q2’13 and H1’13 8 Risk Management Analytics Sales and Retention (Dollars in millions) $259$65$281$67 $- $50 $100 $150 $200 $250 $300Run RateRevenuesQ2'12Q2'13Q2'12Q2'13Diff.H1'12H1'13Diff.Total Sales10$ 12$ 15%21$ 23$ 8%Agg. Retention90%93%3%92%93%1%
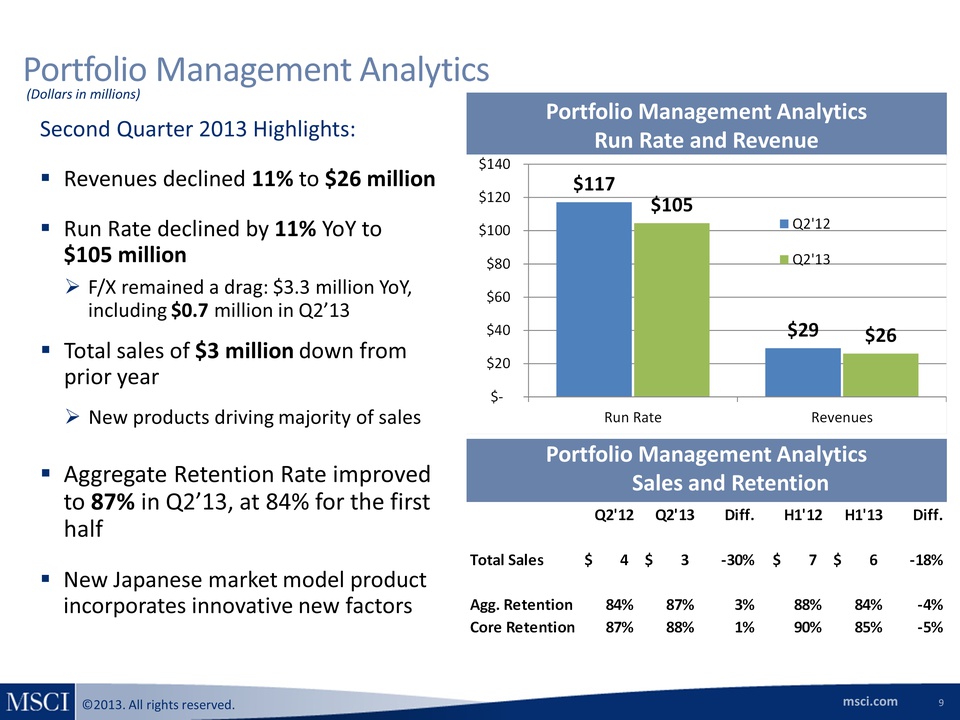
msci.com ©2013. All rights reserved. Portfolio Management Analytics Portfolio Management Analytics Run Rate and Revenue Second Quarter 2013 Highlights: Revenues declined 11% to $26 million Run Rate declined by 11% YoY to $105 million F/X remained a drag: $3.3 million YoY, including $0.7 million in Q2’13 Total sales of $3 million down from prior year New products driving majority of sales Aggregate Retention Rate improved to 87% in Q2’13, at 84% for the first half New Japanese market model product incorporates innovative new factors 9 Portfolio Management Analytics Sales and Retention (Dollars in millions) $117$29$105$26 $- $20 $40 $60 $80 $100 $120 $140Run RateRevenuesQ2'12Q2'13Q2'12Q2'13Diff.H1'12H1'13Diff.Total Sales4$ 3$ -30%7$ 6$ -18%Agg. Retention84%87%3%88%84%-4%Core Retention87%88%1%90%85%-5%
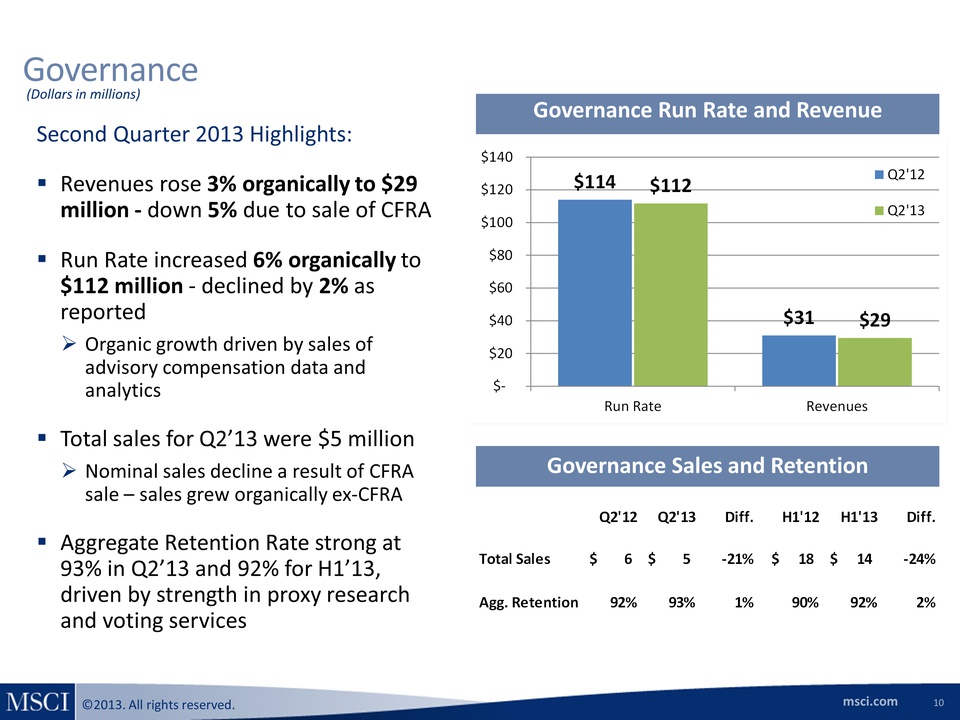
msci.com ©2013. All rights reserved. Governance Governance Run Rate and Revenue Second Quarter 2013 Highlights: Revenues rose 3% organically to $29 million - down 5% due to sale of CFRA Run Rate increased 6% organically to $112 million - declined by 2% as reported Organic growth driven by sales of advisory compensation data and analytics Total sales for Q2’13 were $5 million Nominal sales decline a result of CFRA sale – sales grew organically ex-CFRA Aggregate Retention Rate strong at 93% in Q2’13 and 92% for H1’13, driven by strength in proxy research and voting services 10 Governance Sales and Retention (Dollars in millions) $114$31$112$29 $- $20 $40 $60 $80 $100 $120 $140Run RateRevenuesQ2'12Q2'13Q2'12Q2'13Diff.H1'12H1'13Diff.Total Sales6$ 5$ -21%18$ 14$ -24%Agg. Retention92%93%1%90%92%2%
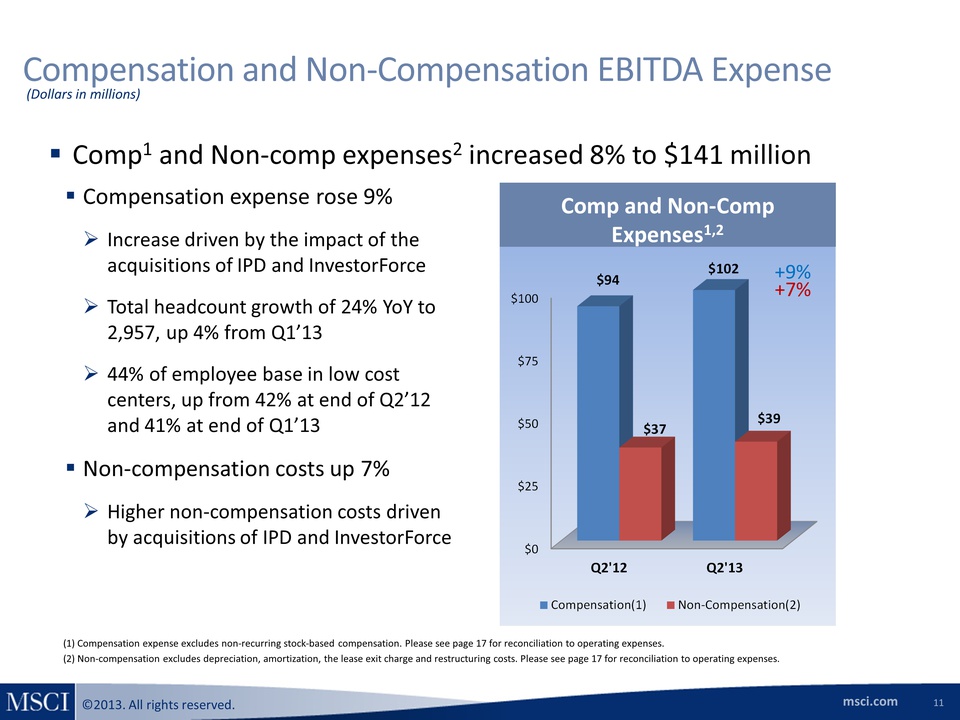
msci.com ©2013. All rights reserved. $0$25$50$75$100Q2'12Q2'13$94 $102 $37 $39 Compensation(1)Non-Compensation(2)Compensation and Non-Compensation EBITDA Expense Comp and Non-Comp Expenses1,2 (Dollars in millions) (1) Compensation expense excludes non-recurring stock-based compensation. Please see page 17 for reconciliation to operating expenses. (2) Non-compensation excludes depreciation, amortization, the lease exit charge and restructuring costs. Please see page 17 for reconciliation to operating expenses. 11 Comp1 and Non-comp expenses2 increased 8% to $141 million Compensation expense rose 9% Increase driven by the impact of the acquisitions of IPD and InvestorForce Total headcount growth of 24% YoY to 2,957, up 4% from Q1’13 44% of employee base in low cost centers, up from 42% at end of Q2’12 and 41% at end of Q1’13 Non-compensation costs up 7% Higher non-compensation costs driven by acquisitions of IPD and InvestorForce +9% +7%
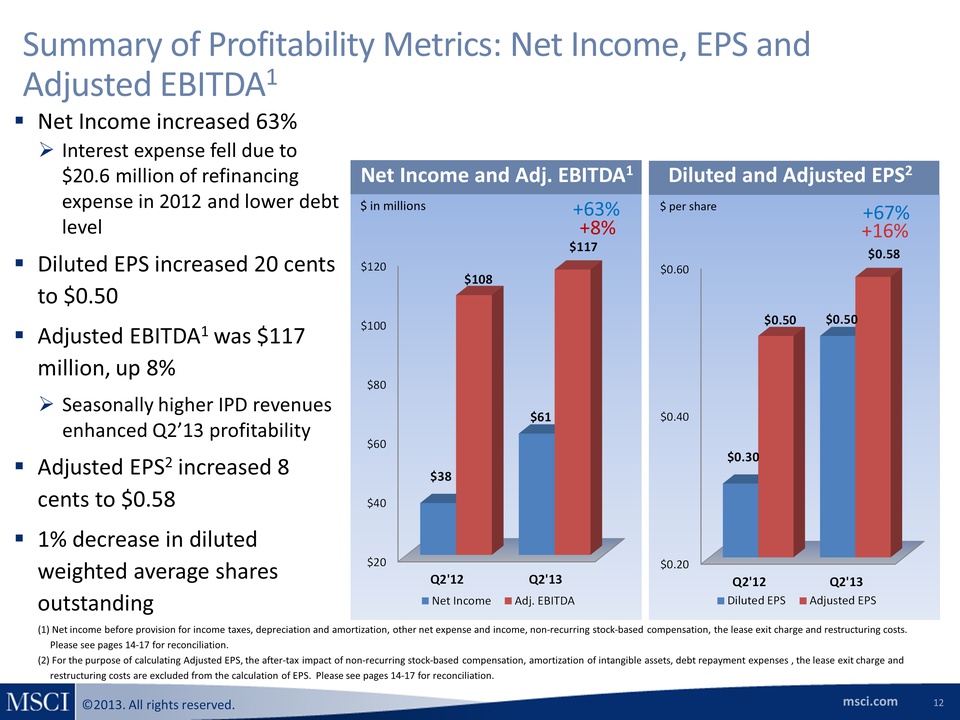
msci.com ©2013. All rights reserved. $20$40$60$80$100$120Q2'12Q2'13$38 $61 $108 $117 Net IncomeAdj. EBITDA$0.20$0.40$0.60Q2'12Q2'13$0.30 $0.50 $0.50 $0.58 Diluted EPSAdjusted EPSSummary of Profitability Metrics: Net Income, EPS and Adjusted EBITDA1 12 $ per share +67% +16% Diluted and Adjusted EPS2 Net Income increased 63% Interest expense fell due to $20.6 million of refinancing expense in 2012 and lower debt level Diluted EPS increased 20 cents to $0.50 Adjusted EBITDA1 was $117 million, up 8% Seasonally higher IPD revenues enhanced Q2’13 profitability Adjusted EPS2 increased 8 cents to $0.58 1% decrease in diluted weighted average shares outstanding Net Income and Adj. EBITDA1 +8% (1) Net income before provision for income taxes, depreciation and amortization, other net expense and income, non-recurring stock-based compensation, the lease exit charge and restructuring costs. Please see pages 14-17 for reconciliation. (2) For the purpose of calculating Adjusted EPS, the after-tax impact of non-recurring stock-based compensation, amortization of intangible assets, debt repayment expenses , the lease exit charge and restructuring costs are excluded from the calculation of EPS. Please see pages 14-17 for reconciliation. $ in millions +63%
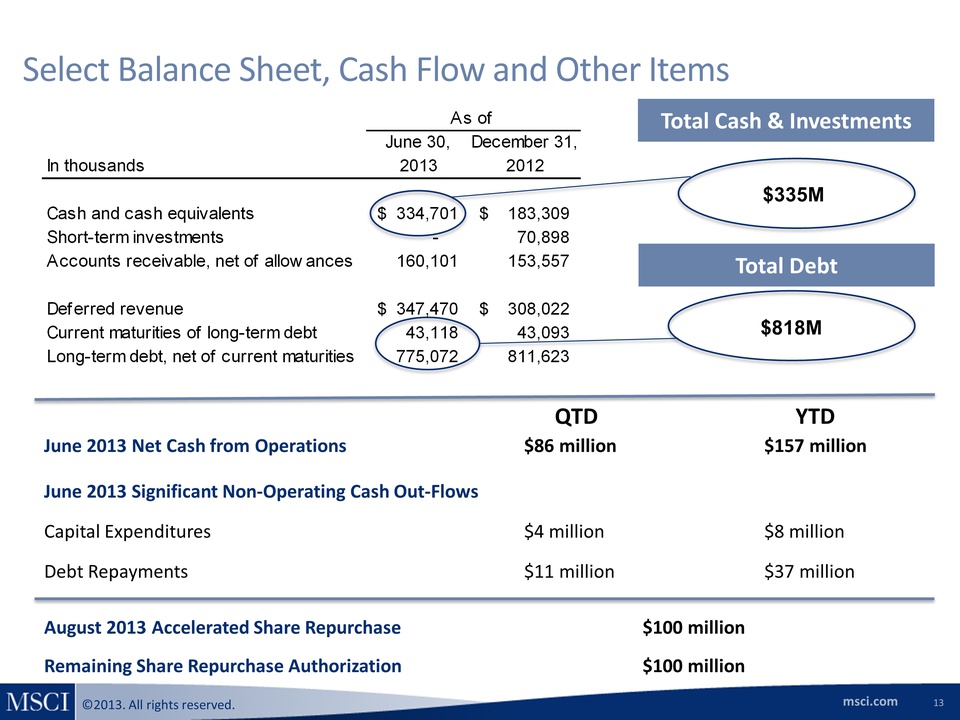
msci.com ©2013. All rights reserved. 13 Select Balance Sheet, Cash Flow and Other Items $818M $335M June 30,December 31,In thousands20132012Cash and cash equivalents334,701$ 183,309$ Short-term investments- 70,898 Accounts receivable, net of allowances160,101 153,557 Deferred revenue347,470$ 308,022$ Current maturities of long-term debt43,118 43,093 Long-term debt, net of current maturities775,072 811,623 As of Total Cash & Investments Total Debt June 2013 Net Cash from Operations $86 million $157 million June 2013 Significant Non-Operating Cash Out-Flows Capital Expenditures $4 million $8 million Debt Repayments $11 million $37 million August 2013 Accelerated Share Repurchase $100 million Remaining Share Repurchase Authorization $100 million QTD YTD
msci.com ©2013. All rights reserved. Use of Non-GAAP Financial Measures and Operating Metrics MSCI has presented supplemental non-GAAP financial measures as part of this presentation. A reconciliation is provided that reconciles each non-GAAP financial measure with the most comparable GAAP measure. The presentation of non-GAAP financial measures should not be considered as alternative measures for the most directly comparable GAAP financial measures. These measures are used by management to monitor the financial performance of the business, inform business decision making and forecast future results. Adjusted EBITDA is defined as net income before provision for income taxes, other net expense and income, depreciation and amortization, non-recurring stock-based compensation expense, the lease exit charge and restructuring costs. Adjusted Net Income and Adjusted EPS are defined as net income and EPS, respectively, before provision for non-recurring stock-based compensation expenses, amortization of intangible assets, restructuring costs, the lease exit charge and the accelerated amortization or write off of deferred financing and debt discount costs as a result of debt repayment (debt repayment and refinancing expenses), as well as for any related tax effects. We believe that adjustments related to the lease exit charge, restructuring costs and debt repayment and refinancing expenses are useful to management and investors because it allows for an evaluation of MSCI’s underlying operating performance. Additionally, we believe that adjusting for non-recurring stock-based compensation expenses, debt repayment and refinancing expenses and depreciation and amortization may help investors compare our performance to that of other companies in our industry as we do not believe that other companies in our industry have as significant a portion of their operating expenses represented by these items. We believe that the non-GAAP financial measures presented in this presentation facilitate meaningful period-to-period comparisons and provide a baseline for the evaluation of future results. Adjusted EBITDA, Adjusted Net Income and Adjusted EPS are not defined in the same manner by all companies and may not be comparable to other similarly titled measures of other companies. The Run Rate at a particular point in time represents the forward-looking revenues for the next 12 months from all subscriptions and investment product licenses we currently provide to our clients under renewable contracts or agreements assuming all contracts or agreements that come up for renewal are renewed and assuming then-current currency exchange rates. For any license where fees are linked to an investment product’s assets or trading volume, the Run Rate calculation reflects an annualization of the most recent periodic fee earned under such license or subscription. The Run Rate for IPD products was approximated using the trailing 12 months of revenues primarily adjusted for estimates for non-recurring sales, new sales and cancellations. The Run Rate does not include fees associated with “one-time” and other non-recurring transactions. In addition, we remove from the Run Rate the fees associated with any subscription or investment product license agreement with respect to which we have received a notice of termination or non-renewal during the period and determined that such notice evidences the client’s final decision to terminate or not renew the applicable subscription or agreement, even though such notice is not effective until a later date. The Aggregate Retention Rates are calculated by annualizing the cancellations for which we have received a notice of termination or non-renewal during the applicable period and have determined that such notice evidences the client’s final decision to terminate or not renew the applicable subscription or agreement, even though such notice is not effective until a later date. This annualized cancellation figure is then divided by the subscription Run Rate at the beginning of the year to calculate a cancellation rate. This cancellation rate is then subtracted from 100% to derive the annualized Aggregate Retention Rate for the applicable period. The Aggregate Retention Rate is computed on a product-by-product basis. Therefore, if a client reduces the number of products to which it subscribes or switches between our products, we treat it as a cancellation. In addition, we treat any reduction in fees resulting from renegotiated contracts as a cancellation in the calculation to the extent of the reduction. For the calculation of the Core Retention Rate, the same methodology is used except the cancellations in the applicable period are reduced by the amount of product swaps.
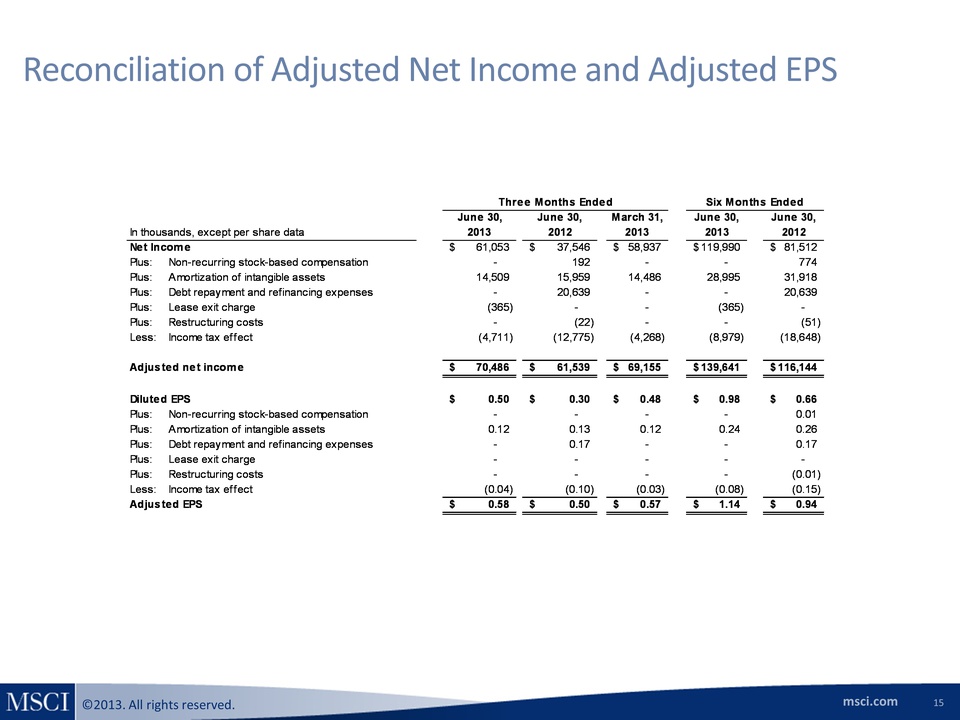
msci.com ©2013. All rights reserved. 15 Reconciliation of Adjusted Net Income and Adjusted EPS June 30,June 30,March 31,June 30,June 30,In thousands, except per share data20132012201320132012Net Income61,053$ 37,546$ 58,937$ 119,990$ 81,512$ Plus:Non-recurring stock-based compensation- 192 - - 774 Plus:Amortization of intangible assets14,509 15,959 14,486 28,995 31,918 Plus:Debt repayment and refinancing expenses- 20,639 - - 20,639 Plus:Lease exit charge(365) - - (365) - Plus:Restructuring costs- (22) - - (51) Less:Income tax effect(4,711) (12,775) (4,268) (8,979) (18,648) Adjusted net income70,486$ 61,539$ 69,155$ 139,641$ 116,144$ Diluted EPS0.50$ 0.30$ 0.48$ 0.98$ 0.66$ Plus:Non-recurring stock-based compensation- - - - 0.01 Plus:Amortization of intangible assets0.12 0.13 0.12 0.24 0.26 Plus:Debt repayment and refinancing expenses- 0.17 - - 0.17 Plus:Lease exit charge- - - - - Plus:Restructuring costs- - - - (0.01) Less:Income tax effect(0.04) (0.10) (0.03) (0.08) (0.15) Adjusted EPS0.58$ 0.50$ 0.57$ 1.14$ 0.94$ Three Months EndedSix Months Ended
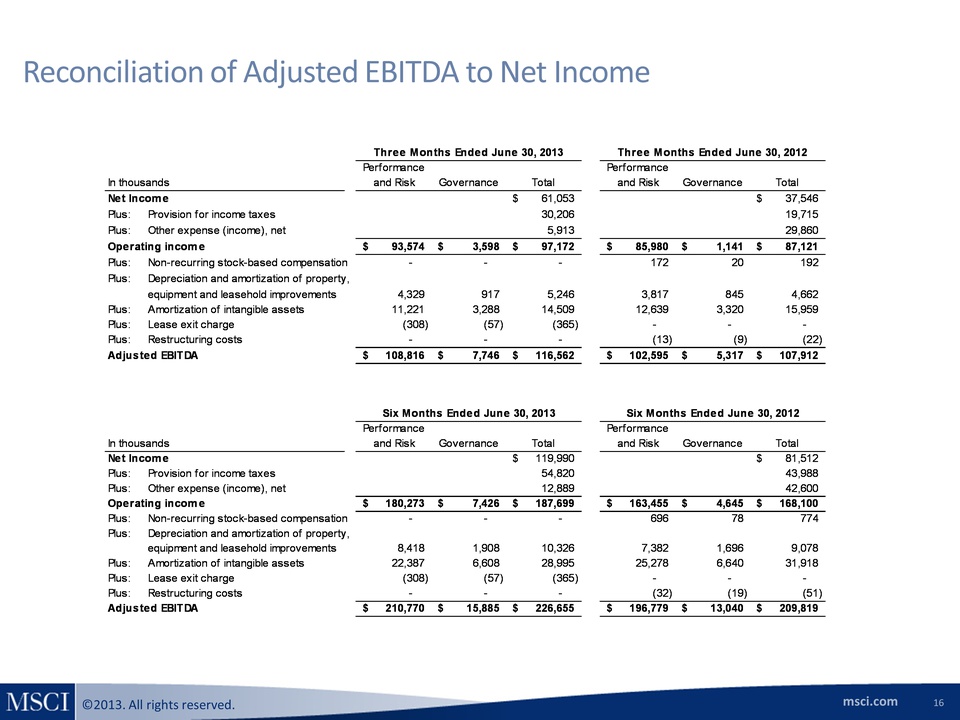
msci.com ©2013. All rights reserved. Reconciliation of Adjusted EBITDA to Net Income 16 In thousandsPerformance and RiskGovernanceTotalPerformance and RiskGovernanceTotalNet Income61,053$ 37,546$ Plus:Provision for income taxes30,206 19,715 Plus:Other expense (income), net5,913 29,860 Operating income93,574$ 3,598$ 97,172$ 85,980$ 1,141$ 87,121$ Plus:Non-recurring stock-based compensation- - - 172 20 192 Plus:Depreciation and amortization of property,equipment and leasehold improvements4,329 917 5,246 3,817 845 4,662 Plus:Amortization of intangible assets11,221 3,288 14,509 12,639 3,320 15,959 Plus:Lease exit charge(308) (57) (365) - - - Plus:Restructuring costs- - - (13) (9) (22) Adjusted EBITDA108,816$ 7,746$ 116,562$ 102,595$ 5,317$ 107,912$ In thousandsPerformance and RiskGovernanceTotalPerformance and RiskGovernanceTotalNet Income119,990$ 81,512$ Plus:Provision for income taxes54,820 43,988 Plus:Other expense (income), net12,889 42,600 Operating income180,273$ 7,426$ 187,699$ 163,455$ 4,645$ 168,100$ Plus:Non-recurring stock-based compensation- - - 696 78 774 Plus:Depreciation and amortization of property,equipment and leasehold improvements8,418 1,908 10,326 7,382 1,696 9,078 Plus:Amortization of intangible assets22,387 6,608 28,995 25,278 6,640 31,918 Plus:Lease exit charge(308) (57) (365) - - - Plus:Restructuring costs- - - (32) (19) (51) Adjusted EBITDA210,770$ 15,885$ 226,655$ 196,779$ 13,040$ 209,819$ Three Months Ended June 30, 2013Three Months Ended June 30, 2012Six Months Ended June 30, 2013Six Months Ended June 30, 2012
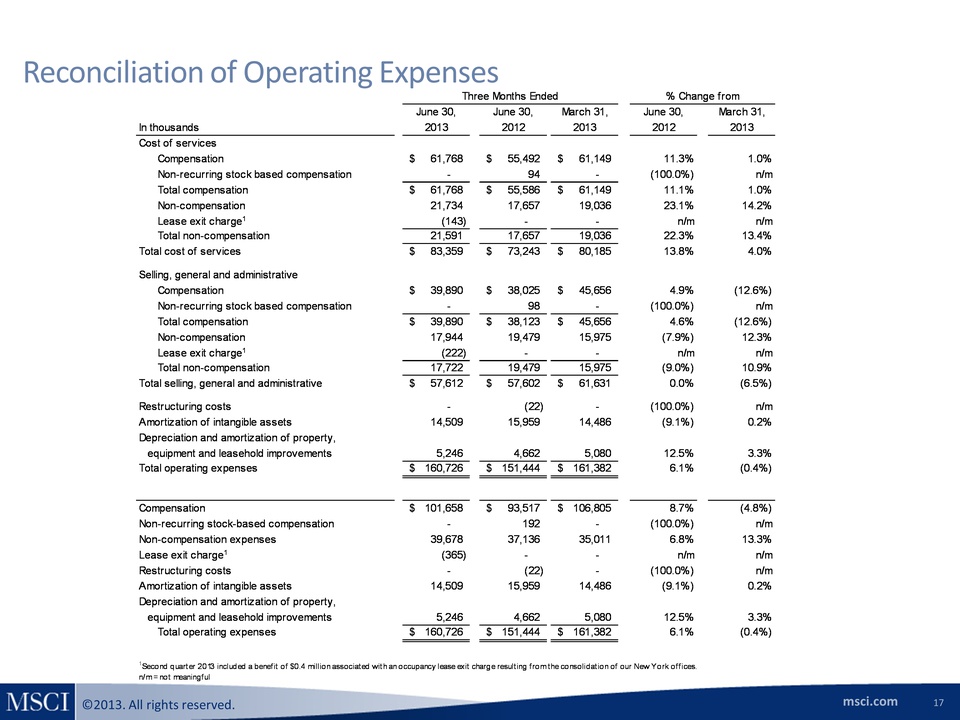
msci.com ©2013. All rights reserved. Reconciliation of Operating Expenses 17 June 30,June 30,March 31,June 30,March 31,In thousands20132012201320122013Cost of servicesCompensation61,768$ 55,492$ 61,149$ 11.3%1.0%Non-recurring stock based compensation- 94 - (100.0%)n/mTotal compensation61,768$ 55,586$ 61,149$ 11.1%1.0%Non-compensation21,734 17,657 19,036 23.1%14.2%Lease exit charge1(143) - - n/mn/mTotal non-compensation21,591 17,657 19,036 22.3%13.4%Total cost of services83,359$ 73,243$ 80,185$ 13.8%4.0%Selling, general and administrative Compensation39,890$ 38,025$ 45,656$ 4.9%(12.6%)Non-recurring stock based compensation- 98 - (100.0%)n/mTotal compensation39,890$ 38,123$ 45,656$ 4.6%(12.6%)Non-compensation17,944 19,479 15,975 (7.9%)12.3%Lease exit charge1(222) - - n/mn/mTotal non-compensation17,722 19,479 15,975 (9.0%)10.9%Total selling, general and administrative57,612$ 57,602$ 61,631$ 0.0%(6.5%)Restructuring costs- (22) - (100.0%)n/mAmortization of intangible assets14,509 15,959 14,486 (9.1%)0.2%Depreciation and amortization of property,equipment and leasehold improvements5,246 4,662 5,080 12.5%3.3%Total operating expenses160,726$ 151,444$ 161,382$ 6.1%(0.4%)Compensation 101,658$ 93,517$ 106,805$ 8.7%(4.8%)Non-recurring stock-based compensation- 192 - (100.0%)n/mNon-compensation expenses39,678 37,136 35,011 6.8%13.3%Lease exit charge1(365) - - n/mn/mRestructuring costs- (22) - (100.0%)n/mAmortization of intangible assets14,509 15,959 14,486 (9.1%)0.2%Depreciation and amortization of property,equipment and leasehold improvements5,246 4,662 5,080 12.5%3.3% Total operation expensesTotal operating expenses160,726$ 151,444$ 161,382$ 6.1%(0.4%)Three Months Ended% Change from1Second quarter 2013 included a benefit of $0.4 million associated with an occupancy lease exit charge resulting from the consolidation of our New York offices.n/m = not meaningful