Attached files
| file | filename |
|---|---|
| 8-K - 8-K - YADKIN FINANCIAL Corp | a8k7-31x13investorpresenta.htm |

Yadkin Financial Corporation KBW Community Bank Investor Conference July 31, 2013 Joe Towell, President & CEO Mark DeMarcus, Executive VP & COO Jan Hollar, Executive VP & CFO

Forward-Looking Statements and Other Cautionary Information Certain statements included in this presentation, other than statements of historical fact, are forward-looking statements (as such item is defined in Section 27A of the Securities Act of 1933, as amended, referred to as the Securities Act, and Section 21E of the Securities Exchange Act of 1934, as amended, referred to as the Exchange Act, and the regulations thereunder), which are intended to be covered by the safe harbors created thereby. The words “anticipate,” “believe,” “estimate,” “expect,” “intend,” “may,” “plan,” “will,” “would,” “could,” “should,” “guidance,” “potential,” “continue,” “project,” “forecast,” “confident,” and similar expressions are typically used to identify forward-looking statements. These forward-looking statements include, among others, statements regarding (1) our belief we have identified all of our problem assets, (2) our ability to maintain our liquidity position, (3) our net interest margin, (4) our growth opportunities and ability to capitalize on them, and (5) our ability to implement cost savings initiatives to improve efficiency. These statements are based on assumptions and assessments made by management in light of their experience and their perception of historical trends, current conditions, expected future developments and other factors they believe to be appropriate. Any forward-looking statements are not guarantees of our future performance and are subject to risks and uncertainties and may be affected by various factors that may cause actual results, developments and business decisions to differ materially from those in the forward-looking statements. Some of the factors that may cause actual results, developments and business decisions to differ materially from those contemplated by such forward-looking statements include (i) competitive pressures among depository and other financial institutions may increase significantly and have an effect on pricing, spending, third-party relationships and revenues; (ii) the strength of the United States economy in general and the strength of the local economies in which we conduct our operations may be different than expected resulting in, among other things, a deterioration in the credit quality or a reduced demand for credit, including the resultant effect on our loan portfolio and allowance for loan losses; (iii) the rate of delinquencies and amounts of charge-offs, the level of allowance for loan loss, the rates of loan growth, or adverse changes in asset quality in our loan portfolio, which may result in increased credit risk-related losses and expenses; (iv) changes in political conditions or the legislative or regulatory environment, including the effect of recent financial reform legislation on the banking industry; (v) timing and impact of potential future acquisitions, the success or failure of integrating operations, and the ability to capitalize on growth opportunities upon entering new markets; and (vi) adverse conditions in the stock market, the public debt market and other capital markets (including changes in interest rate conditions) could have a negative impact on our company. Additional factors could cause our results to differ materially from those described in the forward-looking statements can be found in our reports (such as Annual Reports on Form 10-K, Quarterly Reports on Form 10-Q and Current Reports on Form 8-K) filed with the SEC and available at the SEC's Internet site (http://www.sec.gov). We can give no assurance that any of the events anticipated by the forward-looking statements will occur or, if any of them does, what impact they will have on our results of operations and financial condition. We disclaim any intent or obligation to publicly update or revise any forward-looking statements, regardless of whether new information becomes available, future developments occur or otherwise. This presentation is not all-inclusive and does not purport to contain all of the information that you may desire, or should consider, in determining whether to make an investment in us. You must conduct and rely upon your own evaluation of us and the terms of the investment, including the merits and risks of purchasing our equity interests. We are not making any representations or warranties regarding the accuracy or the completeness of the information set forth herein. In addition, no representations or warranties of any kind are intended nor should any be inferred with respect to the economic viability of this investment or with respect to any benefits that may accrue to you upon making an investment in us. You should not consider the contents of this presentation, or any prior or subsequent communications from us regarding a potential investment as legal, business financial, investment or tax advice. We urge you to consult your own advisors regarding the risks and consequences related to your potential investment. The information contained in this presentation is confidential and should not be used by you for any purpose other than evaluating a potential investment in us and may not be disclosed by you to any other person other than your advisors assisting you with the evaluation of such investment. 3

4

Recent Events • Treasury auctioned Yadkin TARP to private investors in September 2012 • Raised $66 million in common equity in October 2012 - $45 million new equity, $21 million converted from preferred • Executed classified asset disposition – sold approximately $65 million in classified assets during Q4 2012 and Q1 2013 • Effected 1-for-3 reverse stock split in May 2013 • 2013: Q1 EPS $0.30, Q2 EPS $0.30 • Rebranded all divisions of the Company under the Yadkin name and changed ticker to YDKN in May 2013 5

We Are Yadkin • As the Company grew, each entity maintained its original name – 10 supported flags at time of rebrand • Lack of customer awareness, employee unity, and cost of support • With this move, we are capitalizing on the strength of heritage and energizing the future with a refreshed identity • Unity, Strength, and Vision 6

Yadkin Overview • Attractive market footprint • Revenue generation and expansion • Management execution • Improving loan and deposit mix • Diversification: retail, mortgage, wealth 7

Exceptional Franchise 8 North Carolina Deposit Market Share Strong Demographic Footprint Source: SNL Financial and MapInfo Note: Deposit data as of 6/30/2012; Pro forma for recently completed and announced transactions Note: Deposit market share excludes money center branches of BAC, WAC and BBT Charlotte MSA Projected Population Growth: 8.80% Raleigh/Durham MSA Projected Population Growth: 10.8% > 10.0% 5.0 – 10.0 3.4 – 5.0 < 3.4 Yadkin Proj. Pop. Growth 2011-2016 (%) Institution Branches Total Deposits ($000) Market Share 1 Bank of America Corp. 185 168,201,707 49.22 2 BB&T Corp. 366 51,839,146 15.17 3 Wells Fargo & Co. 333 47,204,563 13.81 4 First Citizens BancShares Inc. 265 12,712,490 3.72 5 PNC Financial Services Group Inc. 173 9,456,300 2.77 6 SunTrust Banks Inc. 188 7,088,226 2.07 7 First Bancorp 82 2,520,676 0.74 8 Capital Bank Financial Corp. 53 2,352,848 0.69 9 BNC Bancorp 27 2,272,244 0.66 10 Fifth Third Bancorp 61 2,173,108 0.64 11 FNB United Corp. 63 2,043,657 0.60 12 Piedmont Cmnty Bk Hldgs Inc. 45 1,664,959 0.49 13 Square 1 Financial Inc. 1 1,641,557 0.48 14 Yadkin Financial Corp. 31 1,576,141 0.46 15 HomeTrust Bancshares Inc 20 1,472,363 0.43 16 NewBridge Bancorp 31 1,452,441 0.42 17 Southern BancShares (N.C.) Inc. 56 1,318,507 0.39 18 Fidelity BancShares (N.C.) Inc. 64 1,237,388 0.36 19 Park Sterling Corp. 18 972,739 0.28 20 United Community Banks Inc. 21 918,518 0.27 Other Market Participants (94) 621 21,641,537 6.33 Market Total 2,704 341,761,115 100.00

Retail Banking By The Numbers: • 43,000 households • 9,500 Business households • $44 million in deposits per branch • 2.7 services per household • 3.9 accounts per household • Utilization of balanced scorecard to measure/rationalize branch network 9

Market Segmentation • Target Markets • Commercial: Operating companies, PAs, healthcare, retail/small business, agribusiness • Consumer: upper/middle lifecycle • Marketing model based on market penetration and market opportunity 10

Loan Production Dollars in thousands 11 2013 Projected Total

Targeted Loan Production Dollars in thousands 12 $100,000

Attractive Loan Mix Commercial loans = Owner occupied CRE + C&I loans Peer Group includes select banks headquartered in NC with $1-5 billion in assets as of 3/31/13 13 P er centag e

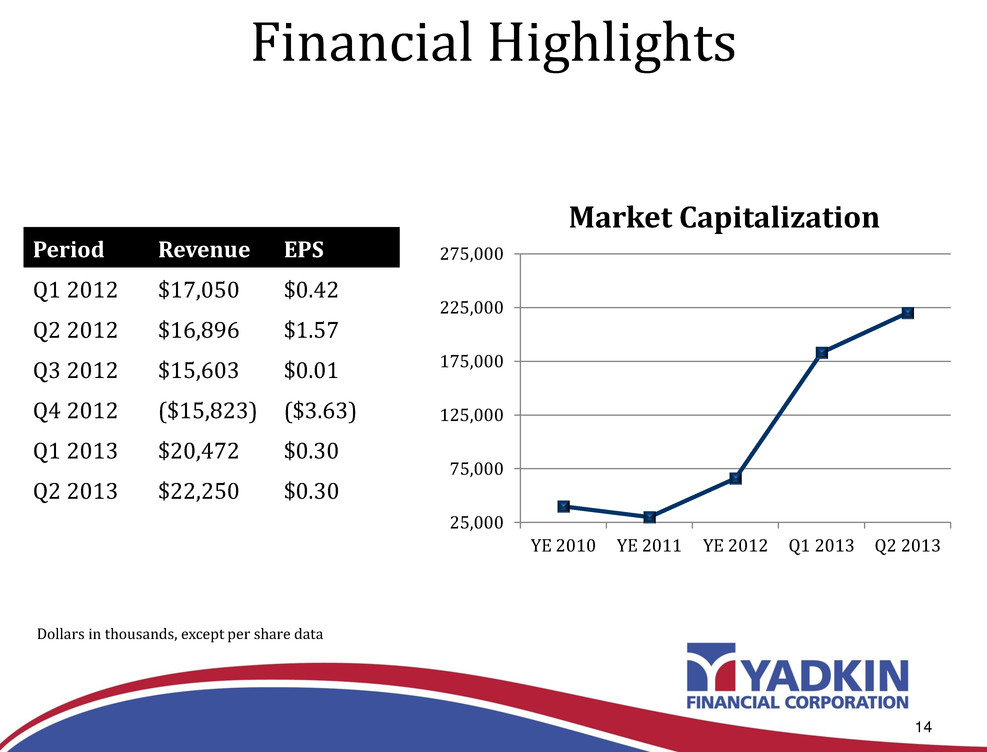
Financial Highlights Period Revenue EPS Q1 2012 $17,050 $0.42 Q2 2012 $16,896 $1.57 Q3 2012 $15,603 $0.01 Q4 2012 ($15,823) ($3.63) Q1 2013 $20,472 $0.30 Q2 2013 $22,250 $0.30 14 Dollars in thousands, except per share data 25,000 75,000 125,000 175,000 225,000 275,000 YE 2010 YE 2011 YE 2012 Q1 2013 Q2 2013 Market Capitalization

Net Interest Margin Trends 15

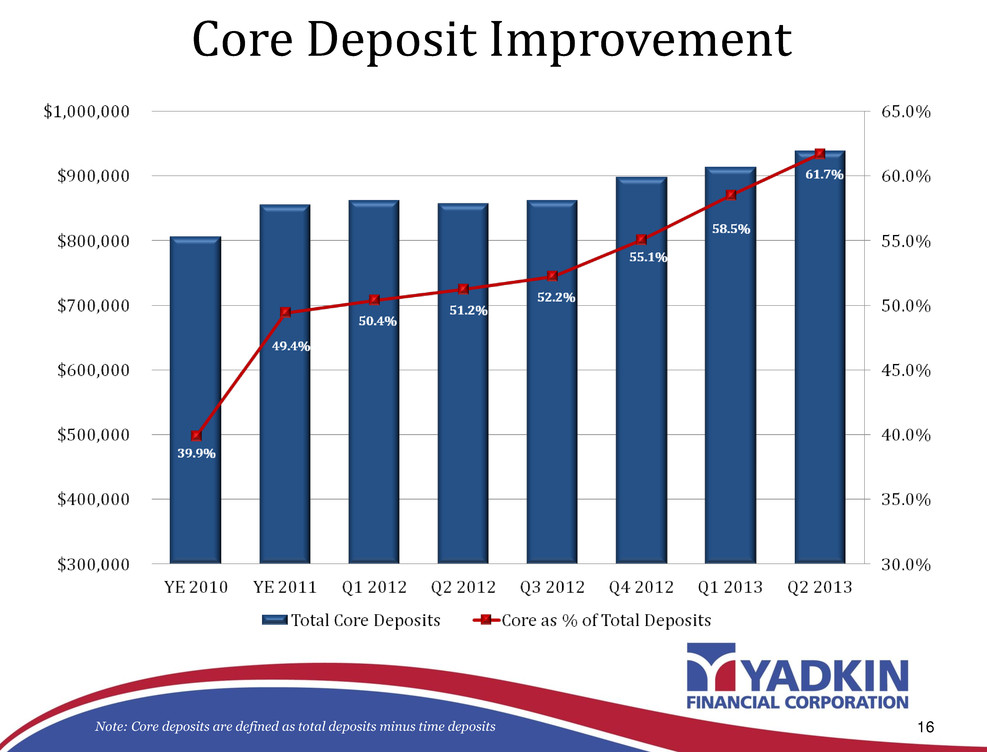
Core Deposit Improvement 16 Note: Core deposits are defined as total deposits minus time deposits

Yadkin Mortgage • Loan officer staff of 50 (35% in branch, 65% in standalone production offices) • Growth based on purchase money focus • Monthly trend: $26 million funded, $45 million pipeline • Servicing portfolio of $275 million • Contributing 5-7% of total Company revenue • Low fixed cost structure 17

Aggressive Credit Management • Classified asset ratio decreased from high of over 100% in 2010 to 22% as of Q2 2013 18 Dollars in thousands

Significant Credit Improvement Nonperforming assets excludes accruing troubled debt restructured loans. Past due loans includes all loans 30 days or more past due. Dollars in thousands 19

Near Term Financial Performance Targets & Goals 20 • Net interest margin above 4.00% • Q2 2013: 3.90% • Operating efficiency ratio in mid-50s • Q2 2013: 64.53% • ROA greater than 1.00% • Q2 2013: 0.90% • Tangible Common Equity greater than 8.0% • Q2 2013: 8.0%

2013 Earnings Levers 21 • Net interest margin focus • Deposit mix improvement • Deposit costs/repricing opportunities through end of 2013 • Redeployed excess liquidity • Loan growth on track for 2-3% in 2013 – disciplined relationship pricing achieving target ROE levels • Significant reduction in credit costs • Revenue diversification • Mortgage – strong growth model • Wealth– near term growth plans in brokerage/insurance

Investment Thesis • Demonstrated profitability • Proven management execution • Credit discipline • Market growth • Substantial franchise value 22

23
